
 Open Access Article
 This Open Access Article is licensed under a Creative Commons Attribution-Non Commercial 3.0 Unported Licence
Polymer ligand binding to surface-immobilized gold nanoparticles: a fluorescence-based study on the adsorption kinetics†
Julian
Sindram
* and
Matthias
Karg

Institut für Physikalische Chemie I: Kolloide und Nanooptik, Heinrich-Heine-Universität Düsseldorf, Universitätsstr. 1, 40225 Düsseldorf, Germany. E-mail: sindram@hhu.de
First published on 22nd July 2021
Abstract
We report on a simple, fluorescence-based method for the investigation of the binding kinetics of polystyrene ligands, dispersed in an organic solvent, to substrate supported gold nanoparticles. For this purpose, we develop a protocol for the immobilization of gold nanoparticles on glass substrates, that yields sub-monolayers of randomly distributed particles with excellent homogeneity and reproducibility. Using fluorescently labeled polystyrene, we monitor the ligand concentration in bulk dispersion in real time and follow the binding to the particle-decorated substrates. The influence of the ligand molecular weight on the binding kinetics is investigated. We correlate the reaction rates with the diffusion coefficients of the different ligands and are able to describe the molecular weight dependency with a simple kinetic model. Both the diffusion and the activation step appear to contribute to the effective reaction rates.
Introduction
Surface functionalized gold nanoparticles (AuNPs) are a widely used tool in research and diagnostics.1–3 Thanks to their versatile surface functionalization and intense coloration, AuNPs provide an excellent platform for antibody assays with an intrinsic optical read-out, which also is the basis of SARS-CoV-2 rapid test kits.4,5 Common types of surface functionalization include short chain alkyl thiols and amines,6–8 linear and branched polymers (e.g. PEG),9–12 polypeptides and proteins, as well as nucleic acids.13–15 Such ligands are typically introduced in order to enhance colloidal stability in various environments and to introduce new functionalities to the nanoparticle surface. Many ligands address both aspects to a certain degree. Whereas small molecules tend to aid only in stabilization, larger, more specialized molecules, i.e. proteins and nucleic acids, can provide extended functionality. Modified synthetic polymers on the other hand can be tailored to combine both outstanding stabilization and functionality.16,17 We have previously investigated the structure and stabilization of polystyrene (PS) functionalized AuNPs dispersed in various organic solvents.18 Despite the promising characteristics of polymer functionalized AuNPs, the mechanism and kinetics of the ligand binding and brush formation have not yet been studied in detail – for several reasons. Firstly, while there has been extensive theoretical work on polymer brushes, pioneered by Alexander and de Gennes,19,20 the models for curved surfaces and charged polymers tend to be complex and are limited to static brushes.21–23 The continuous increase in computing power and the advent of large molecular dynamics simulations now allow more detailed computational studies of brush properties.24–28 However, there are only few models addressing the dynamics of polymer adsorption and brush formation. Whereas earlier research has been focused on non-specific polymer adsorption,29,30 a comprehensive model for the thermodynamics and kinetics of end-grafted brush formation on flat surfaces has been developed by Ligoure and Leibler in 1990.31 Their model predicts that the brush formation kinetics are governed by the reptation-like diffusion of polymer chains through the layer of already adsorbed ligands. In addition to the complexity of theoretical models, the kinetics of brush formation on nanoparticles are also difficult to investigate by lab experiments. Although established methods, such as attenuated total reflection (ATR) IR spectroscopy,29 surface plasmon spectroscopy (SPS),32 and quartz crystal microbalance (QCM),33 can be used to monitor adsorption processes on flat gold surfaces in real time, these techniques use specialized and expensive substrates. Moreover, adsorption processes on particles and rough surfaces cannot be investigated with ease. The investigation of adsorption processes on dispersed AuNPs is even more challenging, as there are few experimental techniques that can resolve potentially fast processes at the nanometer scale. Spectroscopic methods have been used successfully to investigate the adsorption of small molecules and biomacromolecules on AuNPs in dispersion and on surfaces.34–39 To the best of our knowledge, the adsorption and brush formation of linear polymers to AuNP surfaces have not been examined to date.Here, we report on a simple fluorescence spectroscopy-based approach that allows for the investigation of the adsorption kinetics and brush formation of linear PS homopolymer ligands on small AuNPs. By using substrate-supported AuNPs, the particles are contained outside the bulk sample volume, allowing us to detect fluorophores in solution with greater fidelity, while maintaining the chemical nature of the particles.
Experimental section
Materials
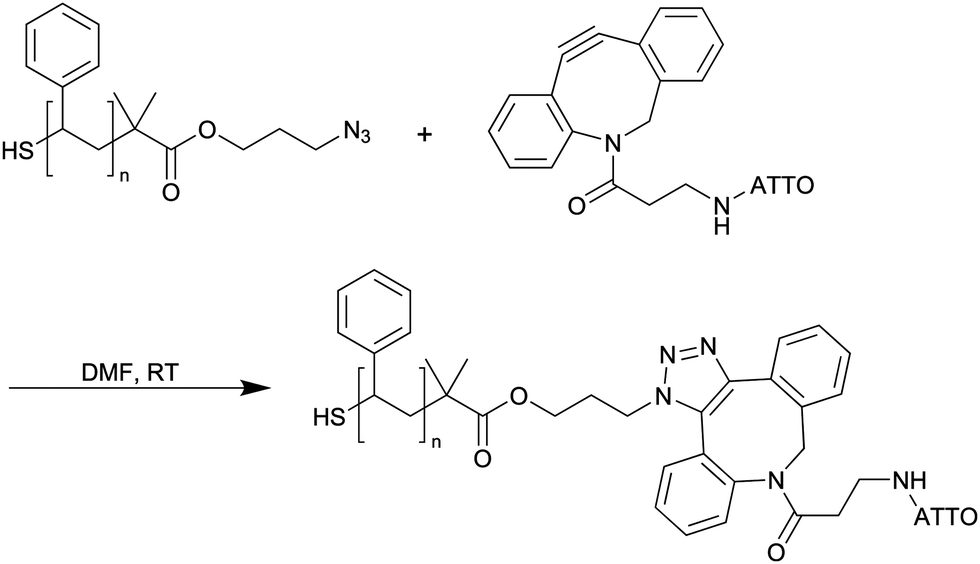
2,2′-Azobisisobutyronitrile (AIBN, 98%, Sigma-Aldrich) was recrystallized from methanol. Styrene (99%, Acros Organics) was passed over basic alumina before use. 2-(Dodecylthiocarbonothioylthio)-2-methylpropanoic acid 3-azido-1-propanol ester (CTA, 98%, Sigma-Aldrich), gold(III) chloride hydrate (HAuCl4, 99.995%, Sigma-Aldrich), trisodium citrate dihydrate (Na3Cit·2H2O, ≥99%, Sigma-Aldrich), citric acid monohydrate (H3Cit·H2O, ≥99.5%, AppliChem), ethylenediaminetetraacetic acid tetrasodium salt dihydrate (Na4EDTA, ≥99%, Sigma-Aldrich), sodium azide (99%, Acros Organics), tetrabutylammonium azide (>95%, TCI), ATTO 488-NHS (ATTO-TEC), dibenzylcyclooctyne-amine (DBCO-amine, >95%, Jena Bioscience), 3-(aminopropyl)-trimethoxysilane (APTMS, 97%, Sigma-Aldrich), N,N-dimethylformamide (p.a., Honeywell), and Sephadex LH-20 (GE Healthcare) were used as received. Ultrapure water with a resistivity of 18 MΩ cm was used for syntheses and purification.Synthesis
 | ||
| Scheme 1 Synthesis of α,ω-functionalized PS and cleavage of the trithiocarbonate group. | ||
| Batch | n(CTA) [mmol] | n(AIBN) [mmol] | n(styrene) [mmol] | T [°C] | t r [h] | M n,SEC [g mol−1] | M w/Mn |
|---|---|---|---|---|---|---|---|
| PS6.5 | 0.54 | 0.054 | 70 | 70 | 15 | 6500 | 1.10 |
| PS21 | 0.22 | 0.044 | 211 | 70 | 17 | 21![[thin space (1/6-em)]](https://www.rsc.org/images/entities/char_2009.gif) 400 400 |
1.16 |
| PS33 | 0.22 | 0.044 | 211 | 70 | 89 | 33200 |
1.15 |
The trithiocarbonate terminus was cleaved in order to obtain more reactive thiol end groups using a modified version of a protocol published by Y. Wu et al.42 Although the trithiocarbonate group has been found to bind to gold surfaces,43–45 the bulky C12 sidechain may reduce the binding strength and increase the ligand footprint compared to a truly end-on grafted chain. In order to prevent loss of the azide terminus due to nucleophilic substitution by primary amines or alcoholamines that are frequently used for trithiocarbonate cleavage, this protocol uses sodium azide as nucleophile.42 Briefly, 50 μmol of polymer were dissolved in 20 mL DMF and 60 mg of sodium azide were added. In order to overcome the low solubility of sodium azide in DMF, a solution of 10 mg of tetrabutylammonium azide in 0.5 mL of DMF was added as a phase transfer catalyst. The mixture was then stirred at room temperature for 96 h to achieve quantitative conversion of trithiocarbonate groups. Polymers were purified by triple precipitation from methanol. Successful cleavage was confirmed by the lack of the strong π → π* absorption band at approximately λ = 315 nm of the trithiocarbonate group in the UV/vis spectrum.46
 | ||
| Scheme 2 Coupling of ATTO 488-NHS to DBCO-amine. | ||
ESI-MS: m/z = 886.2 [ATTO 488-DBCO + K], 870.3 [ATTO 488-DBCO + Na], 848.1 [ATTO 488-DBCO].
1 μmol of the PS ligands were dissolved in 0.5 mL of DMF. 0.2 mL of ATTO-DBCO (0.5 mM in DMF) were added, corresponding to a maximum degree of labeling of 10%. The solution was stirred at room temperature for 5 days to ensure quantitative turnover. The polymer was precipitated by addition of 1 mL of methanol and centrifugation at 10000g relative centrifugal force (rcf.) for 90 min. It was re-dissolved in DMF and precipitated again. The labeled polymers were dried in vacuo and stored as 1 mM solutions in DMF (Scheme 3).
 | ||
| Scheme 3 Coupling of ATTO 488-DBCO to α,ω-functionalized PS. | ||
Methods
Results & discussion
The strong absorbance of AuNPs in dispersion represents an inherent challenge for their use in fluorescence spectroscopy methods. Unless there is little or no spectral overlap between the excitation and emission of the dye and the absorbance of the AuNPs, the particles will absorb a large portion of the excitation beam and the light emitted from the fluorophores. For typical particle concentrations, this can result in a significant decrease of the detected emission intensity and changes the shape of the recorded spectrum.49 It also gives rise to a dilemma, whenever AuNPs and fluorophores are used in concentrations of similar orders of magnitude: Similar to a strong inner filter effect, the overall sample concentration strongly affects emission intensity and spectral shape in a non-linear fashion.50 The effect can be minimized, for instance by reducing the path length of the light through the sample, but can never be avoided completely. In this work we follow a different approach by using substrate-supported AuNPs as a model system for the investigation of polymer ligand binding kinetics. To do so, we prepared monodisperse, spherical AuNPs according to an improved inverse Turkevich method.40 The particles obtained by this method are polycrystalline without strong faceting. As organothiols have been shown to adsorb differently to the various crystal facets and edges of gold surfaces, the morphology and crystallinity of gold particles is expected to affect the ligand binding kinetics and grafting density.26,51Fig. 1A shows a representative TEM micrograph of the as-prepared AuNPs. Aggregates shown in the image are a result of the drying process during sample preparation and are absent in dilute aqueous dispersion. The average particle diameter was determined as 12.2 ± 0.8 nm. The size histogram and corresponding Gaussian fit to the distribution are shown in Fig. 1B. | ||
| Fig. 1 (A) Representative TEM image of as-prepared AuNPs used in this work. (B) Histogram and corresponding Gaussian fit of particle diameters obtained from several TEM images. (C) SEC curves of the PS ligands obtained from RAFT synthesis. (D) Normalized excitation, emission, and synchronous spectra of PS21-ATTO. | ||
For the ligand exchange experiments, we synthesized α,ω-functionalized PS homopolymer ligands with three different molecular weights by RAFT polymerization. One chain end carries the thiol group binding to the AuNP surface, whereas the other terminus carries the dye label or otherwise the residual azide group. Fig. 1C shows the molecular weight distribution curves obtained from SEC in THF. All three polymers exhibit a single peak and a small shoulder, which corresponds to the chain–chain termination product. Due to the nature of the RAFT mechanism, these longer chains do not carry a thiol group and are therefore not relevant in our kinetics investigation. As shown in Table 1, the polymers have dispersities between 1.10 and 1.16. The polymers were partly functionalized with fluorescent ATTO 488, a Rhodamine 110 derivative, using strain-promoted azide–alkyne cycloaddition (SPAAC) coupling. For this purpose, ATTO 488-NHS was first functionalized with DBCO-amine and then coupled to the polymers. As only 0.1 equivalents of dye were used, most of the polymer chains are not functionalized. The exact degree of functionalization is not easily accessible. However, a relatively low fraction of functionalized chains is preferable in order to avoid alteration of the binding kinetics by ionic dye–dye interactions between adsorbed polymer chains. Fig. 1D shows normalized fluorescence spectra measured of PS33-ATTO. The excitation and emission spectrum exhibit the typical mirror symmetry commonly observed for Rhodamine derivatives. The synchronous spectrum is obtained by scanning through the excitation and emission wavelengths simultaneously with a fixed offset between the two. Synchronous scans are particularly helpful for systems, in which the exact excitation and emission maxima are unknown or change over time, while the Stokes shift remains constant. Consequently, the intensities measured in synchronous mode should not be affected as strongly by spectral shifts of excitation or emission maxima as, for instance, single wavelength kinetic measurements. Another advantage in this particular case is the high symmetry of the peak in the synchronous spectrum, which can be fitted by a Gaussian function. This increases the precision in the determination of fluorescence intensities, especially for poor signal-to-noise ratios. Since the effective dye concentrations during measurements are very small (∼1 nM), the inner filter effect of the dye itself can be neglected. These characteristics allow us to assume a proportionality between the measured fluorescence intensity and the concentration of dye-labeled polymer in solution.
In order to immobilize AuNPs, we functionalized the surface of soda-lime glass substrates with APTMS, which introduces primary amine groups on the surface. AuNPs are then deposited by covering the amine-functionalized glass slides with an aqueous particle dispersion. The particles are fixed to the surface by a combination of amine coordination and van der Waals forces. Fig. 2A shows a representative AFM image of a substrate after AuNP deposition and rinsing. The particles are randomly distributed and do not form clusters during deposition. The concentric rings in the FFT in the inset of Fig. 2A underlines the random distribution of the AuNPs on the substrate. The periodicity of the rings is caused by the correlation of particle size and minimum allowed distance, whereas the particle positions are fully uncorrelated. The deposition process is highly reproducible. Fig. 2B shows the particle number density from two AFM measurement series, each on five individual samples. All AFM images and further discussion of the particle arrangement can be found in Fig. S2–S7 in the ESI.† The average particle number density is 684 ± 40 μm−2, as indicated by the dashed, horizontal line and the grey area.
 | ||
| Fig. 2 (A) Representative AFM height image for AuNPs immobilized on amine-functionalized glass slides. The inset shows the corresponding FFT. (B) AuNP number densities measured from multiple samples. The dashed, horizontal line and the grey area represent the average particle number density and its standard deviation, respectively. | ||
After the AuNP deposition, the residual amine groups have to be deactivated in order to prevent non-specific adsorption of dye-labeled polymer to the glass surface. We achieved this by plasma oxidation.
The principle of our fluorescence based kinetic investigation is depicted in Scheme 4. Initially, all polymer (partially dye labeled) is in the bulk phase and the substrate carrying the AuNPs is placed at one side of the reaction volume, i.e. in the cuvette. The polymer ligands gradually diffuse to the AuNP surface, adsorb, and form a brush. Thus, the concentration of dye-labeled and unlabeled polymer in the bulk phase decreases over time, which is tracked in situ by fluorescence measurements in the bulk phase.
 | ||
| Scheme 4 Representation of the ligand binding process to substrate-supported AuNPs (red spheres). The fluorescence intensity of the bulk phase, resembled by the green coloration of the background, decreases during the reaction time Δt, due to the binding of dye-labeled polymer to the AuNP surface. | ||
We performed measurements in triplicate for ligands with molecular weights of 6.5, 21, and 33 kg mol−1 with a starting concentration of c0 = 10 nM in DMF. The development of the fluorescence intensities over time is shown in Fig. 3A–C. All intensity profiles exhibit a single exponential decrease with time. Eqn (1) is used for fitting, where I∞ is the plateau intensity for t → ∞, I0 is the starting intensity, keff is the effective rate constant and t0 is the starting time.
| I(t) = I∞ + (I0 − I∞)exp[−keff(t − t0)] | (1) |
 | ||
| Fig. 3 (A–C) Peak fluorescence intensities as a function of time measured in the bulk phase during the ligand binding to surface-immobilized AuNPs. The separate curves for each molecular weight represent repeated measurements and are deliberately offset for clarity. (D–F) Semi-logarithmic plots of the fluorescence intensities in relation to the plateau intensity I∞. (G–I) Corresponding plots of temporal evolution of the calculated number of polymer chains, NPS, per particle. | ||
The effective rate constants, keff, obtained from fits to the experimental data using eqn (1) are summarized in Table 2. There is a clear trend for decreasing effective rate constants with increasing molecular weight. However, we expect a more complex dependency of keff on various other parameters, including the polymer concentration, the total available gold surface area, the size and curvature of the AuNPs, and the spacing between the particles. Thus, the exact dimensionality of keff is unknown and depends on the reaction parameters that contribute to the full kinetic model.
| Ligand | k eff × 10−5 [s−1] |
![[k with combining macron]](https://www.rsc.org/images/entities/i_char_006b_0304.gif) eff × 10−5 [s−1]
eff × 10−5 [s−1] |
![[f with combining macron]](https://www.rsc.org/images/entities/i_char_0066_0304.gif) ∞
∞
|
|---|---|---|---|
| a Error is standard deviation from fit. b Error is standard deviation of individual fit values. | |||
| PS6.5 | 16.8 ± 0.4a | 15 ± 1b | 45 ± 3b |
| 13.7 ± 0.3a | |||
| 14.4 ± 0.3a | |||
| PS21 | 9.5 ± 0.5a | 9.1 ± 0.4b | 28 ± 4b |
| 9.1 ± 0.2a | |||
| 8.7 ± 0.2a | |||
| PS33 | 8.5 ± 0.2a | 7.8 ± 0.6b | 29 ± 2b |
| 7.0 ± 0.1a | |||
| 8.0 ± 0.1a | |||
Another interesting aspect of the ligand binding is the surface coverage or grafting density that is achieved in equilibrium. As the exact surface area of substrate supported AuNPs that is accessible by the ligands is unknown, we express the surface coverage as the average number of adsorbed chains per particle, f. We calculate f from the intensity–time curves according to eqn (2), where cPS and VPS are the concentration and volume of the ligand solution respectively, As is the surface area of the substrate, and σAuNP is the particle number density of AuNPs on the substrate.
 | (2) |
∞, are given in Table 2. The equilibrium concentration, i.e. the concentration of chains remaining in solution decreases with increasing ∞ and is therefore lowest for the 6.5 kg mol−1 ligand. The equilibrium state appears to be determined by the free energy change due to chain stretching, which we discuss in detail in the ESI.† We find a strikingly similar degree of stretching of chains within the polymer brushes formed by the three different ligands.
We now want to further investigate the influence of molecular weight and diffusion characteristics of the polymer ligands on the binding kinetics. For this purpose, we employ multi-angle DLS to directly measure the polymer diffusion coefficients in dilute solution. Fig. 4A shows plots of the average decay constants, Γ, as a function of the squared magnitude of the scattering vector, q2. The magnitude of the scattering vector is calculated using eqn (3), where n is the refractive index of the medium, λ is the wavelength of the laser used for the experiment and θ is the scattering angle.
 | (3) |
| Γ = Dtq2 | (4) |
 | ||
| Fig. 4 (A) Decay constants from angle-dependent DLS measurements. The solid lines are linear fits to the data according to eqn (4). The slope of the fit yields the diffusion coefficients. (B) Reciprocal plot of the effective rate constant against the polymer diffusion coefficient. | ||
As our kinetics appear much simpler than the one predicted by Ligoure and Leibler,31 we attempt to linearize the relationship between keff and Dt using a general approach for diffusion-controlled reactions. For reactions, in which the rate constant of the transport process, kd, and the rate constant of the activation-governed reaction step, ka, are of a similar order of magnitude, keff can be approximated following eqn (5).
 | (5) |
 | (6) |
Plotting 1/keffversus 1/Dt in Fig. 4B, we find excellent agreement with the postulated linearity.
From the linear fit we determined the reaction rates ka and kd,M, which are summarized in Table 3. The values indicate that both principal steps of the ligand binding process are indeed similarly slow. Furthermore, we can determine a crossover molecular weight, Mc, at ka = kd, for which the kinetics change from predominantly diffusion-limited to predominantly activation-limited. In our case, we find Mc ≈ 1.2 kg mol−1, corresponding to chain dimensions on the order of the Kuhn length, lK, for PS. This finding bears significance, as chains do not form random coils and cannot entangle at length scales below lK. Therefore, such a short chain will behave like a small, rod-like molecule. Moreover, it also complies with the model developed by Ligoure and Leibler, in which the repulsive interaction between an approaching chain and the brush vanishes for distances d < lK from the surface. In reverse, their theory also suggests that the diffusion of chains that are significantly larger than lK is strongly hindered by the forming brush,31 which is also supported by our data.
| k a × 10−5 [s−1] | k d,6.5 × 10−5 [s−1] | k d,21 × 10−5 [s−1] | k d,33 × 10−5 [s−1] |
|---|---|---|---|
| 50.1 ± 0.3 | 21.3 ± 0.4 | 11.1 ± 0.2 | 9.3 ± 0.1 |
Finally, we used AFM to characterize the samples after the ligand binding experiments. The AuNP number density on the substrate remained unchanged with an average of 666 ± 17 μm−2 from three scans. The AFM images are shown in Fig. S8–S10 in the ESI.† This confirms the strong adhesion of the particles to the glass substrate. In addition, we investigated the specificity of the ligand binding. We measured high resolution force maps on substrates with immobilized AuNPs before and after the ligand binding reaction. Please refer to the ESI† for details on these AFM measurements, including a step-by-step explanation of raw data analysis in Fig. S11–S15 (ESI†). Height profiles for samples prior to and after ligand binding with PS33 are shown in Fig. 5A and B respectively. The reference force, i.e. the point on the force curve from which the height information was obtained, was 50 pN. There are distinct differences between the images with and without polymer. Firstly, the height profile for the sample without polymer shows a rather abrupt height step along the edges of the particle footprint. The much smoother height profile for the sample with PS33 could be a result of softness from the ligand shell. Secondly, the sample after ligand binding shows shallow bridges between adjacent particles, which are not present for the sample without polymer. The apparent softness and the bridging between particles are both indications for the presence of polymer on the particles. Fig. 5C and D shows the corresponding adhesion plots obtained from the same force maps. The adhesion force is the minimum of the force curve during probe withdrawal. For both samples the strongest adhesion force is measured on the flat substrate, whereas the adhesion on the AuNPs appears to be weaker. This can be attributed to the high curvature of the AuNPs surface and therefore smaller effective contact area between probe and particle. Moreover, the glass substrate is prone to condensation of water, which results in capillary forces. Similar to the height image, the particles on the sample without polymer are more distinctly contrasted against the substrate. We observe much more diffuse outlines of the particles for the sample after ligand binding. The aforementioned bridges between individual particles are nearly indistinguishable from the particles themselves. The features described here can be observed for all three molecular weights (AFM images in Fig. S16–S19 in the ESI†) but are most pronounced for PS33. We therefore conclude that the polymer ligands can in fact be visualized. The accumulation of material around the AuNPs confirms that the polymer is specifically adsorbed to the gold surface rather than non-specifically to the entire sample surface. We observed non-specific adsorption on glass slides functionalized with APTMS that were not treated with plasma, as shown by the fluorescence intensity curves in Fig. S20 in the ESI.†
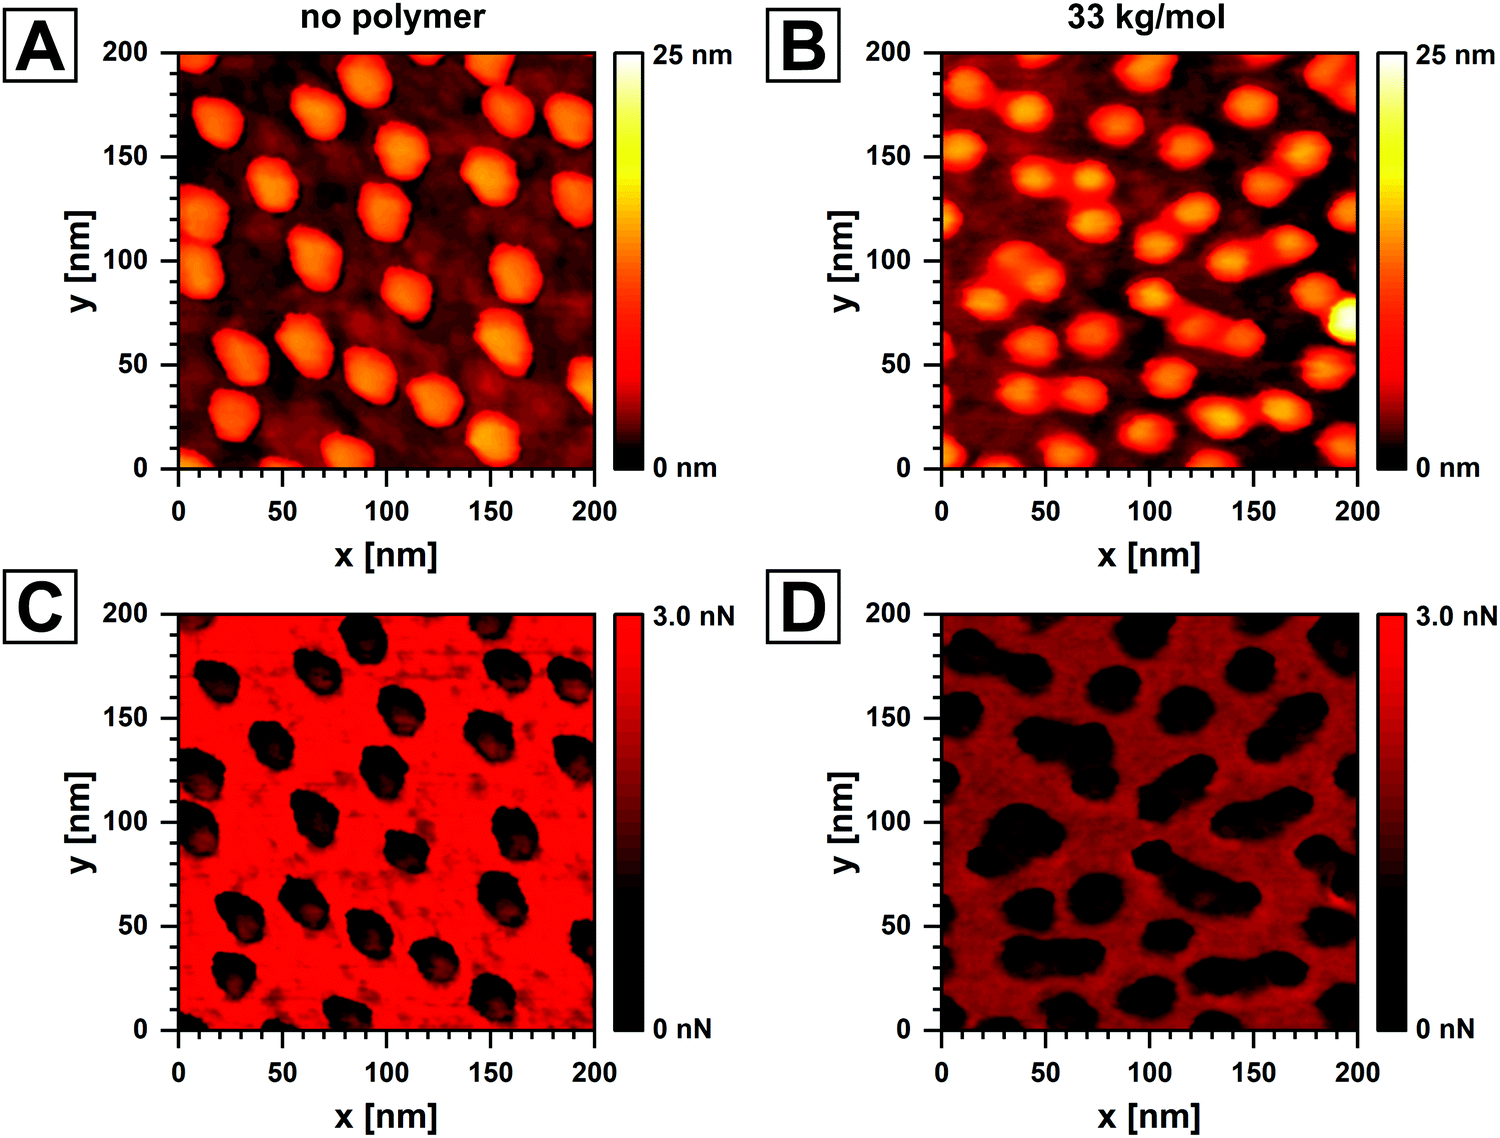 | ||
| Fig. 5 (A and B) AFM height images of AuNPs immobilized on glass before and after the ligand binding reaction with PS33 ligand respectively for a reference force of 50 pN. (C and D) Corresponding adhesion force maps measured in air. The apparent elongation of particles for the sample without polymer is a result of thermal sample creep. | ||
Conclusion
We used a simple fluorescence spectroscopy method for the investigation of the binding kinetics of PS ligands to AuNPs that were immobilized on glass substrates. Using PS ligands with different molecular weights, we found a strong dependence of the adsorption rate on the size and diffusion coefficient of the polymer chains. Based on a standard kinetic model for diffusion-limited reactions, we found similar contributions of activation- and diffusion-limited steps to the effective reaction rate. From the low diffusive rate constants we deduced a strong hindrance of chain diffusion to the AuNP surface by polymer already attached to the particle surface. The concentration–time profiles were successfully described by single exponential functions, which is in agreement with theory for a system close to equilibrium.31 Such an approximation could be justified by the relatively low starting concentration of ligands, where the chemical potential of the dissolved chains is sufficiently small. Different kinetics may be observed for larger molecular weights or higher polymer concentrations. We used AFM to visualize the polymer chains on the particles in dry state and were able to confirm the specific adsorption of PS on the AuNP surface.The substrate supported approach can be used for kinetic investigation of ligand binding kinetics by other methods, such as spectroscopic dark field microscopy. Given sufficient instrument sensitivity, the refractive index dependency of the localized surface plasmon resonance could be used to directly measure the polymer grafting in real time. Furthermore, we want to highlight that our approach can be easily extended to other polymers including more complex architectures as for example in block copolymers.
Conflicts of interest
There are no conflicts of interest to declare.Acknowledgements
MK would like to thank the DFG for funding under grant KA3880/6-1. The authors acknowledge the DFG and the state of NRW for funding the cryo-TEM (INST 208/749-1 FUGG). The authors also would like to thank Marius Otten for TEM measurements and Stephanie Scheelen from Macromolecular Chemistry for SEC measurements.References
- E. Boisselier and D. Astruc, Gold Nanoparticles in Nanomedicine: Preparations, Imaging, Diagnostics, Therapies and Toxicity, Chem. Soc. Rev., 2009, 38(6), 1759–1782 RSC.
- K. Saha, S. S. Agasti, C. Kim, X. Li and V. M. Rotello, Gold Nanoparticles in Chemical and Biological Sensing, Chem. Rev., 2012, 112(5), 2739–2779 CrossRef CAS PubMed.
- P. M. Tiwari, K. Vig, V. A. Dennis and S. R. Singh, Functionalized Gold Nanoparticles and Their Biomedical Applications, Nanomaterials, 2011, 1(1), 31–63 CrossRef CAS PubMed.
- H. N. Abdelhamid and G. Badr, Nanobiotechnology as a Platform for the Diagnosis of COVID-19: A Review, Nanotechnol. Environ. Eng., 2021, 6(1), 19 CrossRef CAS.
- C. Huang, T. Wen, F.-J. Shi, X.-Y. Zeng and Y.-J. Jiao, Rapid Detection of IgM Antibodies Against the SARS-CoV-2 Virus via Colloidal Gold Nanoparticle-Based Lateral-Flow Assay, ACS Omega, 2020, 5(21), 12550–12556 CrossRef CAS.
- K. S. Mayya and F. Caruso, Phase Transfer of Surface-Modified Gold Nanoparticles by Hydrophobization with Alkylamines, Langmuir, 2003, 19(17), 6987–6993 CrossRef CAS.
- M. Karg, N. Schelero, C. Oppel, M. Gradzielski, T. Hellweg and R. von Klitzing, Versatile Phase Transfer of Gold Nanoparticles from Aqueous Media to Different Organic Media, Chem. – Eur. J., 2011, 17(16), 4648–4654 CrossRef CAS PubMed.
- S. Ehlert, S. M. Taheri, D. Pirner, M. Drechsler, H.-W. Schmidt and S. Förster, Polymer Ligand Exchange to Control Stabilization and Compatibilization of Nanocrystals, ACS Nano, 2014, 8(6), 6114–6122 CrossRef CAS PubMed.
- W. P. Wuelfing, S. M. Gross, D. T. Miles and R. W. Murray, Nanometer Gold Clusters Protected by Surface-Bound Monolayers of Thiolated Poly(ethylene glycol) Polymer Electrolyte, J. Am. Chem. Soc., 1998, 120(48), 12696–12697 CrossRef CAS.
- K. Rahme, L. Chen, R. G. Hobbs, M. A. Morris, C. O'Driscoll and J. D. Holmes, PEGylated Gold Nanoparticles: Polymer Quantification as a Function of PEG Lengths and Nanoparticle Dimensions, RSC Adv., 2013, 3(17), 6085–6094 RSC.
- M. K. Corbierre, N. S. Cameron and R. B. Lennox, Polymer-Stabilized Gold Nanoparticles with High Grafting Densities, Langmuir, 2004, 20(7), 2867–2873 CrossRef CAS PubMed.
- G. Prencipe, S. M. Tabakman, K. Welsher, Z. Liu, A. P. Goodwin, L. Zhang, J. Henry and H. Dai, PEG Branched Polymer for Functionalization of Nanomaterials with Ultralong Blood Circulation, J. Am. Chem. Soc., 2009, 131(13), 4783–4787 CrossRef CAS.
- S. J. Hurst, A. K. R. Lytton-Jean and C. A. Mirkin, Maximizing DNA Loading on a Range of Gold Nanoparticle Sizes, Anal. Chem., 2006, 78(24), 8313–8318 CrossRef CAS.
- C. M. Niemeyer and B. Ceyhan, DNA-Directed Functionalization of Colloidal Gold with Proteins, Angew. Chem., Int. Ed., 2001, 40(19), 3685–3688 CrossRef CAS.
- J. M. Abad, S. F. L. Mertens, M. Pita, V. M. Fernández and D. J. Schiffrin, Functionalization of Thioctic Acid-Capped Gold Nanoparticles for Specific Immobilization of Histidine-Tagged Proteins, J. Am. Chem. Soc., 2005, 127(15), 5689–5694 CrossRef CAS.
- S. O. Pereira, A. Barros-Timmons and T. Trindade, Polymer@gold Nanoparticles Prepared via RAFT Polymerization for Opto-Biodetection, Polymers, 2018, 10(2), 189 CrossRef PubMed.
- J. Shan and H. Tenhu, Recent Advances in Polymer Protected Gold Nanoparticles: Synthesis, Properties and Applications, Chem. Commun., 2007,(44), 4580–4598 RSC.
- J. Sindram, M. Krüsmann, M. Otten, T. Pauly, L. Nagel-Steger and M. Karg, Versatile Route toward Hydrophobically Polymer-Grafted Gold Nanoparticles from Aqueous Dispersions, J. Phys. Chem. B, 2021 DOI:10.1021/acs.jpcb.1c03772.
- S. Alexander, Adsorption of Chain Molecules With a Polar Head a Scaling Description, J. Phys., 1977, 38(8), 983–987 CrossRef CAS.
- P. G. de Gennes, Conformations of Polymers Attached to an Interface, Macromolecules, 1980, 13(5), 1069–1075 CrossRef CAS.
- M. Daoud and J. P. Cotton, Star Shaped Polymers: A Model for the Conformation and its Concentration Dependence, J. Phys., 1982, 43(3), 531–538 CrossRef CAS.
- C. M. Wijmans and E. B. Zhulina, Polymer Brushes at Curved Surfaces, Macromolecules, 1993, 26(26), 7214–7224 CrossRef CAS.
- E. B. Zhulina, T. M. Birshtein and O. V. Borisov, Curved Polymer and Polyelectrolyte Brushes Beyond the Daoud-Cotton Model, Eur. Phys. J. E: Soft Matter Biol. Phys., 2006, 20(3), 243–256 CrossRef CAS PubMed.
- K. Binder, Scaling concepts for polymer brushes and their test with computer simulation, Eur. Phys. J. E: Soft Matter Biol. Phys., 2002, 9(3), 293–298 CrossRef CAS.
- D. Dimitrov, A. Milchev and K. Binder, Polymer Brushes on Flat and Curved Substrates: Scaling Concepts and Computer Simulations, Macromol. Symp., 2007, 252(1), 47–57 CrossRef CAS.
- T. Djebaili, J. Richardi, S. Abel and M. Marchi, Atomistic Simulations of the Surface Coverage of Large Gold Nanocrystals, J. Phys. Chem. C, 2013, 117(34), 17791–17800 CrossRef CAS.
- R. C. Hayward and W. W. Graessley, Excluded Volume Effects in Polymer Solutions. 1. Dilute Solution Properties of Linear Chains in Good and ϑ Solvents, Macromolecules, 1999, 32(10), 3502–3509 CrossRef CAS.
- F. L. Verso, L. Yelash, S. A. Egorov and K. Binder, Interactions Between Polymer Brush-Coated Spherical Nanoparticles: The Good Solvent Case, J. Chem. Phys., 2011, 135(21), 214902 CrossRef.
- P. Frantz and S. Granick, Kinetics of Polymer Adsorption and Desorption, Phys. Rev. Lett., 1991, 66(7), 899–902 CrossRef CAS PubMed.
- J. F. Douglas, H. E. Johnson and S. Granick, A Simple Kinetic Model of Polymer Adsorption and Desorption, Science, 1993, 262(5142), 2010–2012 CrossRef CAS PubMed.
- C. Ligoure and L. Leibler, Thermodynamics and Kinetics of Grafting End-Functionalized Polymers to an Interface, J. Phys., 1990, 51(12), 1313–1328 CrossRef CAS.
- K. A. Peterlinz and R. Georgiadis, In Situ Kinetics of Self-Assembly by Surface Plasmon Resonance Spectroscopy, Langmuir, 1996, 12(20), 4731–4740 CrossRef CAS.
- H. Xu and J. B. Schlenoff, Kinetics, Isotherms, and Competition in Polymer Adsorption Using the Quartz Crystal Microbalance, Langmuir, 1994, 10(1), 241–245 CrossRef CAS.
- E. M. Nelson and L. J. Rothberg, Kinetics and Mechanism of Single-Stranded DNA Adsorption onto Citrate-Stabilized Gold Nanoparticles in Colloidal Solution, Langmuir, 2011, 27(5), 1770–1777 CrossRef CAS PubMed.
- H. Li and L. J. Rothberg, Label-Free Colorimetric Detection of Specific Sequences in Genomic DNA Amplified by the Polymerase Chain Reaction, J. Am. Chem. Soc., 2004, 126(35), 10958–10961 CrossRef CAS PubMed.
- K. Siriwardana, A. Wang, K. Vangala, N. Fitzkee and D. Zhang, Probing the Effects of Cysteine Residues on Protein Adsorption onto Gold Nanoparticles Using Wild-Type and Mutated GB3 Proteins, Langmuir, 2013, 29(35), 10990–10996 CrossRef CAS.
- B. Jin, W.-J. Bao, Z.-Q. Wu and X.-H. Xia, In Situ Monitoring of Protein Adsorption on a Nanoparticulated Gold Film by Attenuated Total Reflection Surface-Enhanced Infrared Absorption Spectroscopy, Langmuir, 2012, 28(25), 9460–9465 CrossRef CAS.
- R. Dinkel, B. Braunschweig and W. Peukert, Fast and Slow Ligand Exchange at the Surface of Colloidal Gold Nanoparticles, J. Phys. Chem. C, 2016, 120(3), 1673–1682 CrossRef CAS.
- S. Perumal, A. Hofmann, N. Scholz, E. Rühl and C. Graf, Kinetics Study of the Binding of Multivalent Ligands on Size-Selected Gold Nanoparticles, Langmuir, 2011, 27(8), 4456–4464 CrossRef CAS PubMed.
- F. Schulz, T. Homolka, N. G. Bast, V. Puntes, H. Weller and T. Vossmeyer, Little Adjustments Significantly Improve the Turkevich Synthesis of Gold Nanoparticles, Langmuir, 2014, 30(35), 10779–10784 CrossRef CAS PubMed.
- T. Honold, D. Skrybeck, K. G. Wagner and M. Karg, Fully Reversible Quantitative Phase Transfer of Gold Nanoparticles Using Bifunctional PNIPAM Ligands, Langmuir, 2017, 33(1), 253–261 CrossRef CAS PubMed.
- Y. Wu, Y. Zhou, J. Zhu, W. Zhang, X. Pan, Z. Zhang and X. Zhu, Fast Conversion of Terminal Thiocarbonylthio Groups of RAFT Polymers to “Clickable” Thiol Groups via Versatile Sodium Azide, Polym. Chem., 2014, 5(19), 5546–5550 RSC.
- A.-S. Duwez, P. Guillet, C. Colard, J.-F. Gohy and C.-A. Fustin, Dithioesters and Trithiocarbonates as Anchoring Groups for the “Grafting-To” Approach, Macromolecules, 2006, 39(8), 2729–2731 CrossRef CAS.
- B. Ebeling and P. Vana, RAFT-Polymers with Single and Multiple Trithiocarbonate Groups as Uniform Gold-Nanoparticle Coatings, Macromolecules, 2013, 46(12), 4862–4871 CrossRef CAS.
- C.-A. Fustin and A.-S. Duwez, Dithioesters and Trithiocarbonates Monolayers on Gold, J. Electron Spectrosc. Relat. Phenom., 2009, 172(1), 104–106 CrossRef CAS.
- K. Skrabania, A. Miasnikova, A. M. Bivigou-Koumba, D. Zehm and A. Laschewsky, Examining the UV-vis Absorption of RAFT Chain Transfer Agents and Their Use for Polymer Analysis, Polym. Chem., 2011, 2(9), 2074–2083 RSC.
- W. P. Kern and A. David, Cleaning Solutions Based on Hydrogen Peroxide for use in Silicon Semiconductor Technology, RCA Rev., 1970, 31(2), 187–206 CAS.
- B. J. Frisken, Revisiting the Method of Cumulants for the Analysis of Dynamic Light-Scattering Data, Appl. Opt., 2001, 40(24), 4087–4091 CrossRef CAS.
- L. Xu, B. Li and Y. Jin, Inner Filter Effect of Gold Nanoparticles on the Fluorescence of Quantum Dots and its Application to Biological Aminothiols Detection, Talanta, 2011, 84(2), 558–564 CrossRef CAS.
- M. Kubista, R. Sjöback, S. Eriksson and B. Albinsson, Experimental Correction for the Inner-Filter Effect in Fluorescence Spectra, Analyst, 1994, 119(3), 417–419 RSC.
- L. Strong and G. M. Whitesides, Structures of Self-Assembled Monolayer Films of Organosulfur Compounds Adsorbed on Gold Single Crystals: Electron Diffraction Studies, Langmuir, 1988, 4(3), 546–558 CrossRef CAS.
Footnote |
| † Electronic supplementary information (ESI) available. See DOI: 10.1039/d1sm00892g |
| This journal is © The Royal Society of Chemistry 2021 |