DOI:
10.1039/D1SM00315A
(Paper)
Soft Matter, 2021,
17, 4826-4833
Spatio-temporally controlled suppression of the coffee-ring phenomenon by cellulose nanofibers
Received
1st March 2021
, Accepted 25th March 2021
First published on 20th April 2021
Abstract
Sessile droplets of colloidal dispersions tend to exhibit the coffee-ring phenomenon in the drying process. The suspended particles are transported especially at the final stage of the drying process, which is called the rush hour. Conventional inkjet printers require the ink liquid to have a sufficiently low viscosity for inkjet discharge, but such liquids tend to be subject to the coffee-ring effect. The coffee-ring effect is an issue for conventional printing applications and drawing wires in printed electronics. We show by microscopy movie data analysis based on single particle tracking that the addition of a small amount of cellulose nanofibers (CNFs) to the colloidal dispersion works in such a way that the initial low concentration satisfies the low viscosity requirement, and the three-dimensional structural order of the CNFs formed during the final stage of droplet drying owing to the high concentration hinders the transport of particles to the periphery, suppressing the coffee-ring effect. This is a spatio-temporally controlled process that makes use of the inherent process of ordinary ink printing situations by the simple protocol. This is also an approach to seamlessly link the ink and substrate since CNFs are regarded as a promising substrate material for flexible devices in printed electronics because of their fine texture that keeps conductive nanoparticles on the surface.
1 Introduction
Drying of a sessile droplet is a key process in inkjet printing technologies. The dried films that consist of a collection of dots or lines are not only recognized by the human eye as characters and pictures, but also the printed lines can be employed as electric circuits when the ink is conductive.1–3 The technologies to draw wires of conductive inks are the fundamentals of the printed electronics.4–6 Although screen printing has the advantage of compatibility with viscous ink, it has the drawbacks of the higher cost of wasted ink and the need for masks for each circuit design. In contrast, printing based on conventional inkjet printers does not require masks and the amount of waste ink is negligible compared with screen printing. The drawback is that conventional inkjet printers require a sufficiently low viscosity of the ink liquid to achieve stable discharge from the nozzles. When sessile droplets of ink liquid with a low viscosity dry, they tend to be subject to the coffee-ring effect.7–9 Namely, colloidal particles suspended in a liquid are transported to the periphery of the sessile droplet in the drying process. This transport is most drastic at the final stage of the drying process, which is sometimes referred to as the “rush hour”.8 The final state of the dried up film is ring-shaped. However, the surface coating of paints and inks is, in general, desired to be uniform after drying. The electric wires formed by inkjet printing with conductive ink are no exception. Usually, it is preferred that the coffee-ring effect is avoided for achieving sufficient electrical conductivity since the conductivity is affected by the cross sectional shape of the wire.10
The sufficient electric conductivity of the ink wire also calls for substrate materials that keep the conductive nanoparticles in the ink on the substrate surface. While it is difficult for conventional copy papers to satisfy this condition, the so-called nanopapers11–15 made of cellulose nanofibers (CNFs)16 show good performance on this aspect.17 In fact, nanopapers are already recognized as promising substrate materials for flexible devices, and numerous demonstrations of functionalities have been reported.17–19 Nanopapers made of pure CNFs or cellulose-related materials are highly environmentally friendly as there is an abundance of raw materials.20,21 Therefore, the long-term pursuit of printed electronics and flexible device technologies in turn expects innovations in the area of conductive inks. There are several types of conductive inks that are well-recognized in the research field, and the most typical are those based on conductive nanoparticles that consist mainly of Ag2,22 or PEDOT:PSS23–26 for conductive colloidal particles. There are commercial products for both types of conductive ink. The main dispersant/solvent is water, but several other components are usually added to avoid the coffee-ring effect. It is desired that these components are also sufficiently environmentally friendly.
In our previous work, we proposed that the coffee-ring effect of a sessile droplet containing colloidal particles can be suppressed by the addition of a small dose of CNFs.27 The micro particle image velocimetry (μPIV) approach revealed the suppression of particle transport in the rush hour. While our previous work demonstrated that CNFs work as such, the mechanism for wide-spread application remains to be fully addressed. Although we had shown that only a small amount of CNFs is sufficient, it is a finite value larger than zero. Although the coffee-ring effect was suppressed beyond a certain initial CNF concentration, too small an initial concentration left some non-uniformity of the radial distribution. It does not make much sense merely to state a specific numerical value of the optimal concentration because there is no uniform standard for CNFs but there are several types depending on the fabrication protocol.28 Therefore, it is important to clarify how CNFs work at the mesoscale between the molecular scale and the full continuum scale viewpoint. If the addition of CNFs was just a matter of achieving a preset viscosity from an overall perspective, this is not novel in physical principle although environmental friendliness is a clear advantage in industrial applications. We show in this article that this approach is more than that. The role of the initial concentration is important in the nonequilibrium process of drying. Whereas the earlier work focused solely on the consequent phenomenon in the rush hour, this study reveals the drying process from the initial stage with a focus on the mesoscopic state of the aqueous CNF dispersion.
We reveal the mechanism of suppression of the coffee-ring effect by CNFs by resorting to microscopy movie data analysis in the drying process. Microscopic observations of CNFs are usually conducted by scanning electron microscopy (SEM), but SEM is not compatible with the fully wet state. Atomic force microscopy (AFM) is compatible with wet state but it basically probes surface of the structure, and the existence of the tip interferes with the physical process that is relevant to the coffee-ring effect. Optical microscopy is compatible with the wet state and is non-invasive; however, the limitation is the space resolution of observation, and single CNFs are not visible using optical microscopy. Nevertheless, the colloidal particle to be transported or not in the drying droplets can be observed using standard optical microscopy. We focus on the dynamics of suspended Brownian particles in the drying droplets with different concentrations of CNFs. We have already established the approach for revealing the basic characteristics of the surrounding media to the particles through trajectories obtained by single particle tracking (SPT).29 The stark contrast with our previous study,27 originating from this difference of approach, is that this study reveals the mesoscopic state of CNF dispersion without flow. In this study, we intermittently capture the movie data in the droplet drying process, and uncover the spatio-temporally controlled process that is highly advantageous for implementation in inkjet printing technologies.
2 Methods
2.1 Sample preparation
The colloidal particles used in this study were polystyrene particles (Chemisnow, SX-130H, Soken Chemical & Co., Ltd) with a diameter of 1.4 μm. The particles were dispersed in purified water (purified water, Kenei Pharmaceutical Co., Ltd). The CNFs were diluted from a 2.1 wt% aqueous dispersion (I-2SX, DKS Co., Ltd). The polystyrene particle concentration was always 0.05 wt%, and the CNF concentrations were 0, 0.01, 0.02, 0.03, and 0.05 wt% in the overall dispersion samples. First, a 1.0 wt% polystyrene particle dispersion was prepared by dilution with purified water. Separately, a 0.42 wt% CNF dispersion was prepared by dilution with purified water. Each dispersion was mixed by first shaking the sealed container (1.5 mL screw cap tube, AsOne Corporation) by hand and then applying the ultrasonic homogenizer (NR-50M-MT2, Microtec. Co., Ltd) for 30 s at 30% power under PWM control. Second, the target concentration was attained by mixing of the pure polystyrene dispersion and the pure CNF dispersion in water by micropipette. The sample liquids were mixed again by the same protocol as that for preparation of the pure CNF dispersions.
2.2 Measurement
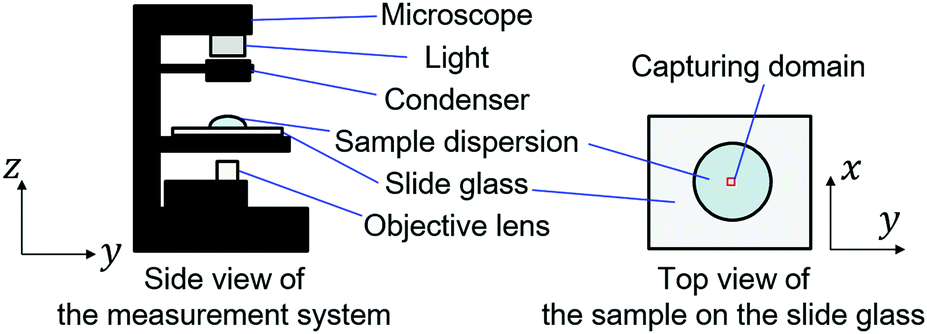
4.0 μL aliquots of the prepared sample liquids were placed on glass slides (silane-coated slide glass, 5196, Muto pure chemicals Co., Ltd) using a micropipette. The surface-coated glass slide was employed for its moderate wettability. The drying process of the droplets was observed from the vertical direction using an inverted microscope (IX73, Olympus Corp.) and captured by a camera (Zyla5.5, Andor Technology Ltd) as shown in Fig. 1. The horizontal position of the observation was the center of the sessile droplet. The observation height was 50 μm away from the focus of a 1.4 μm particle adhered on the glass slides, which is approximately 50 μm away from the surface of the glass slide. The height was tuned based on the dial of the microscope. The measurement and analysis are limited within the time range where the air–liquid interface is significantly beyond the observation height of 50 μm. The objective lens was ×20, and the pixel pitch of the camera was 6.5 μm. The image size of the captured movie data was 512 × 512 px2, corresponding to an observation domain of 166 × 166 μm2. The frame interval Δtfrm of the camera was 10−2 s, and the exposure time Δtexp was 9.0 × 10⁻⁴ s. A single movie consisted of 103 frames. The movie was captured intermittently. The first movie of a sample started 60 s after the droplet was placed on the substrate. Thereafter, the movie data were obtained at intervals of 80 s, where the interval was defined from the final frame of the last movie. The movie data were recorded as time-sequential 16-bit gray-scale TIFF images. Measurement for the same condition was repeated for three sample droplets to confirm the reproducibility. The dried films were captured by a digital microscope (VHX-6000, Keyence Corp.) at a magnification of ×50. The measurement was conducted under ambient conditions, where room temperature was in the range of 26.9–29.0 °C and the humidity was in the range of 31–38%.
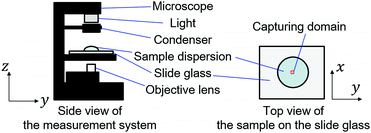 |
| | Fig. 1 Schematic diagram of the experimental measurement system. | |
2.3 Data analysis
The first step of the data analysis was single particle tracking (SPT)29–32 to obtain the trajectory data sets. The tracking algorithm was that of Sbalzarini and Koumoutsakos.33 The input parameters for the SPT were determined by systematic examination of the dependence on the results for the benchmark system of a pure colloidal dispersion without CNFs. The specific values of the parameters are as follows: radius, 4 px; intensity percentile, 0.1%; cutoff score, 0; link range, 1; and displacement threshold, 2 px. We have shown in our previous study29 that the SPT approach reveals the microscopic characteristics of the CNF dispersion beyond the effective viscosity and provides information including the confinement effect by CNFs. The generalized diffusion coefficient34 is useful for the elucidation of superdiffusive and subdiffusive characteristics:35| | | 〈|r(t) − r(0)|2〉 ≃ 2ndDαtα, | (1) |
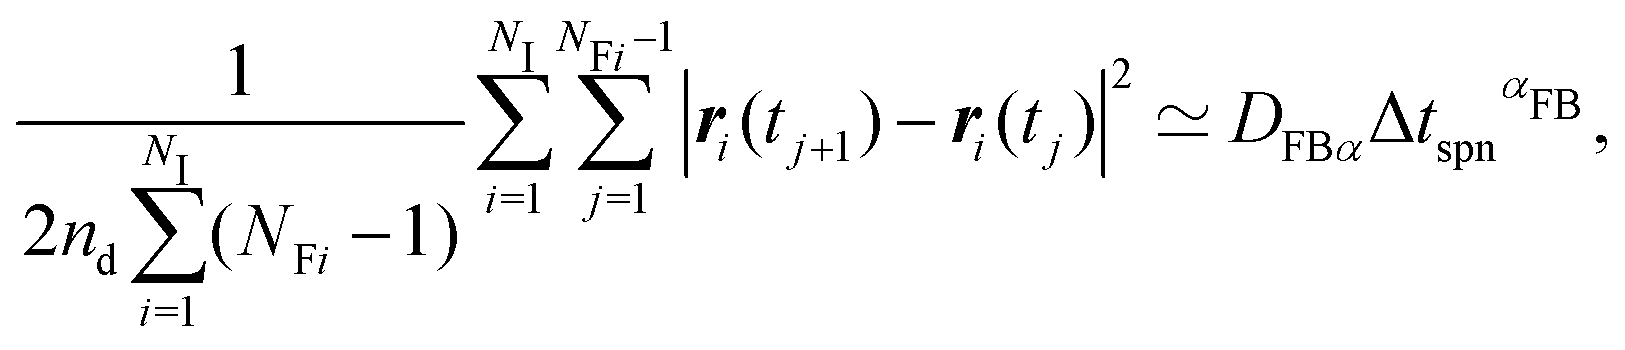
where nd is the dimension, r(t) is the position of the particle of interest at time t, 〈⋯〉 indicates the ensemble average, and we call Dα the generalized diffusion coefficient in this article. The term 〈|r(t) − r(0)|2〉 is called the mean squared displacement (MSD). The scaling exponent α = 1 indicates normal diffusion, and α < 1 and α > 1 indicate the subdiffusive and superdiffusive behaviors, respectively. The generalized diffusion coefficient Dα and the scaling exponent α were evaluated from the finite amount of data in the frame-based (FB) manner:29| | 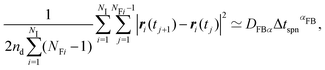 | (2) |
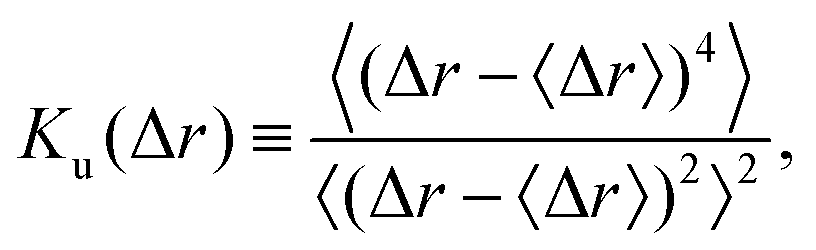
where the subscript FB indicates the frame-based average, NI is the total number of individual particles, ri(tj) is the position of the i-th particle at the j-th frame, Δtspn = tj+1 − tj is the time span to evaluate the MSD, and NFi is the number of the frames during which i-th particle is consecutively tracked. In this article, two types of displacements to derive the MSDs are defined: one is the overall displacement that includes the possible flow component, and the other is the displacement perpendicular to the flow direction. The quantities derived from the latter are labelled with a subscript “n”, e.g., the generalized diffusion coefficient and the scaling exponents in the latter framework are denoted as DnFBα and αnFB, respectively. The flow direction of the observation domain was evaluated for each time span Δtspn to evaluate the specific displacements. We try to summarize the time evolution of the distribution of displacements in such a way that the MSD is summarized by Dα and α. First, the shape of the distribution is represented by the kurtosis Ku of the displacement Δr, defined as:| |  | (3) |
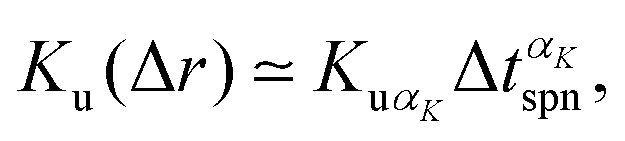
where Ku = 3 indicates the Gaussian distribution. Then, the time evolution of Ku is modelled as:| |  | (4) |
where KuαK and αK are the coefficient and scaling exponent in this model, respectively.
3 Results and discussion
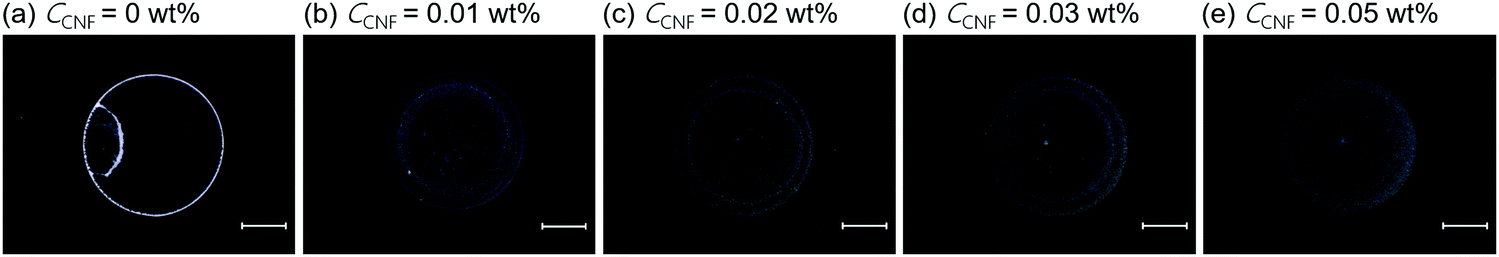
First, we show the optical microscopy images of the dried films from sessile droplets of aqueous dispersions of polystyrene particles with and without CNFs in Fig. 2. The colloidal dispersion without CNFs forms a ring-like structure through the coffee-ring effect (cf.Fig. 2(a)). There is also partial aggregation inside the ring structure of the droplet size, which is indicative of depinning and pinning during the drying process. Details of pinning and depinning are dominated by interactions with the substrate surface, which is out of the scope of this article. The clear ring-like structure is blurred by the addition of the lowest amount of CNFs among the studied concentrations (cf.Fig. 2(b)). The slight but significant increase in the initial CNF concentration CCNF leads to a substantially uniform distribution of the colloidal particles (cf.Fig. 2(e)). The parameter CCNF refers to the initial CNF concentration of the droplet throughout this article. As each CNF has a diameter of several nanometers, it is transparent and negligible in the digital microscope images. From these images we can observe that the small portion of CNFs is indeed effective for suppressing the coffee-ring phenomenon, but the initial concentration matters as well. Hereafter, we focus on this aspect from the mechanism revealed by the microscopy movie data analysis. As we defined in the Methods section, we pay attention to multiple time scales: the time span Δtspn to evaluate the displacements and the mean squared displacements (MSDs), and the drying time scale t* defined as the dimensionless quantity scaled by the time τdry to complete the drying, i.e., t* = 1 is defined as the completion of the drying. τdry was in the range from 17 min to 22 min in this article. Δtspn is a multiple of the frame interval Δtfrm of the camera to capture the movie data. Since Δtspn/τdry ≪ 1, the diffusion coefficients are evaluated based on the equilibrium viewpoint within a unit of movie data.
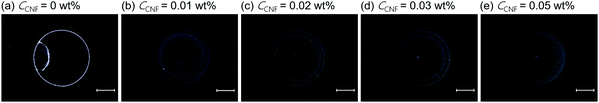 |
| | Fig. 2 Digital microscopy images of dried colloidal films with and without CNFs. The initial CNF concentration CCNF of (a) to (e) is 0, 0.01, 0.02, 0.03, and 0.05 wt%, respectively. The scale bars indicate 1 mm. | |
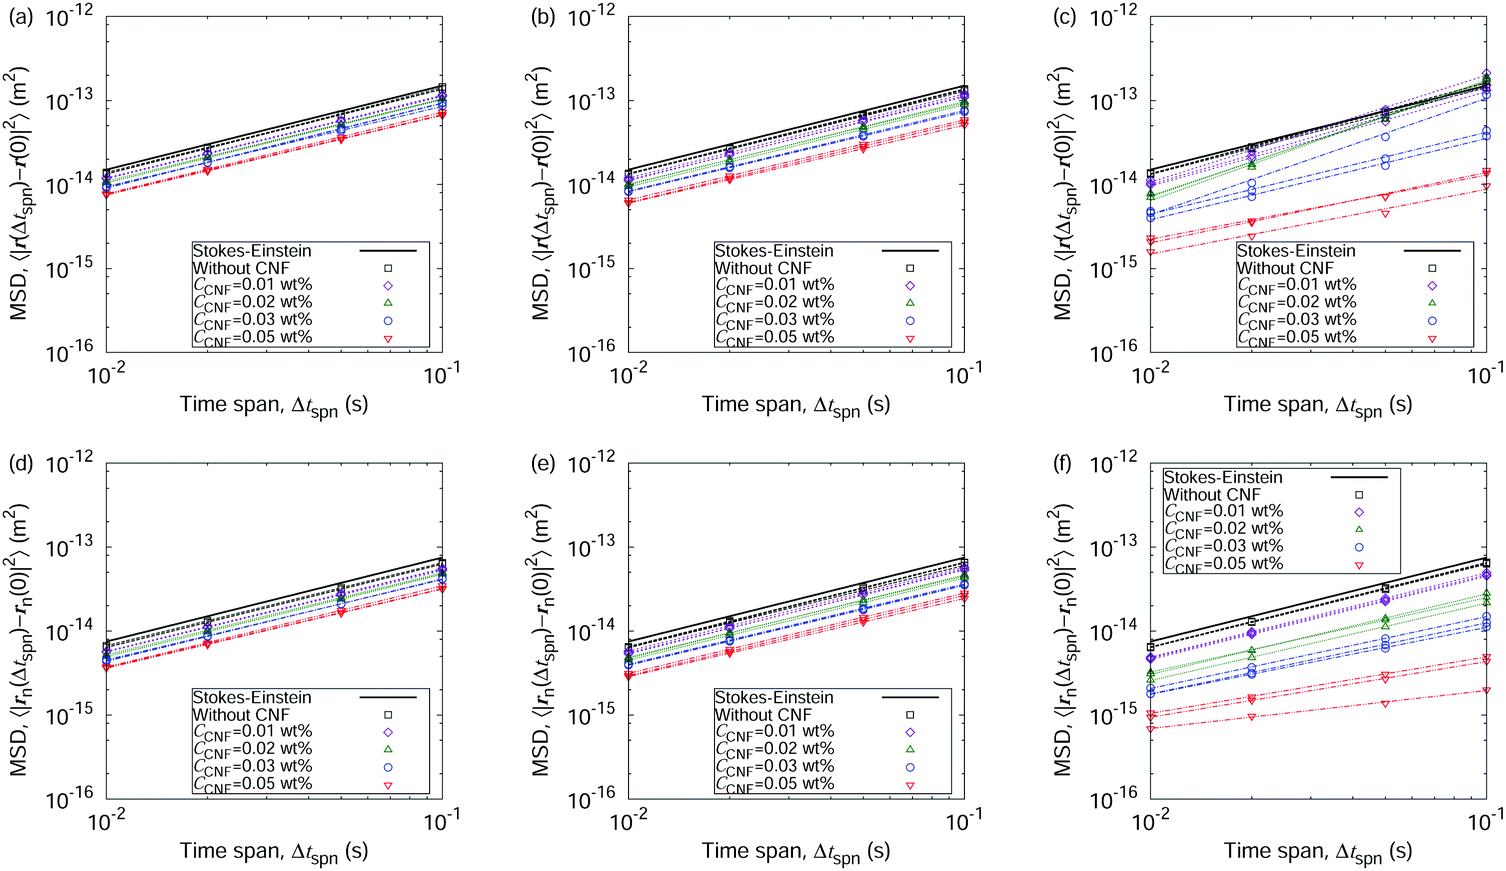
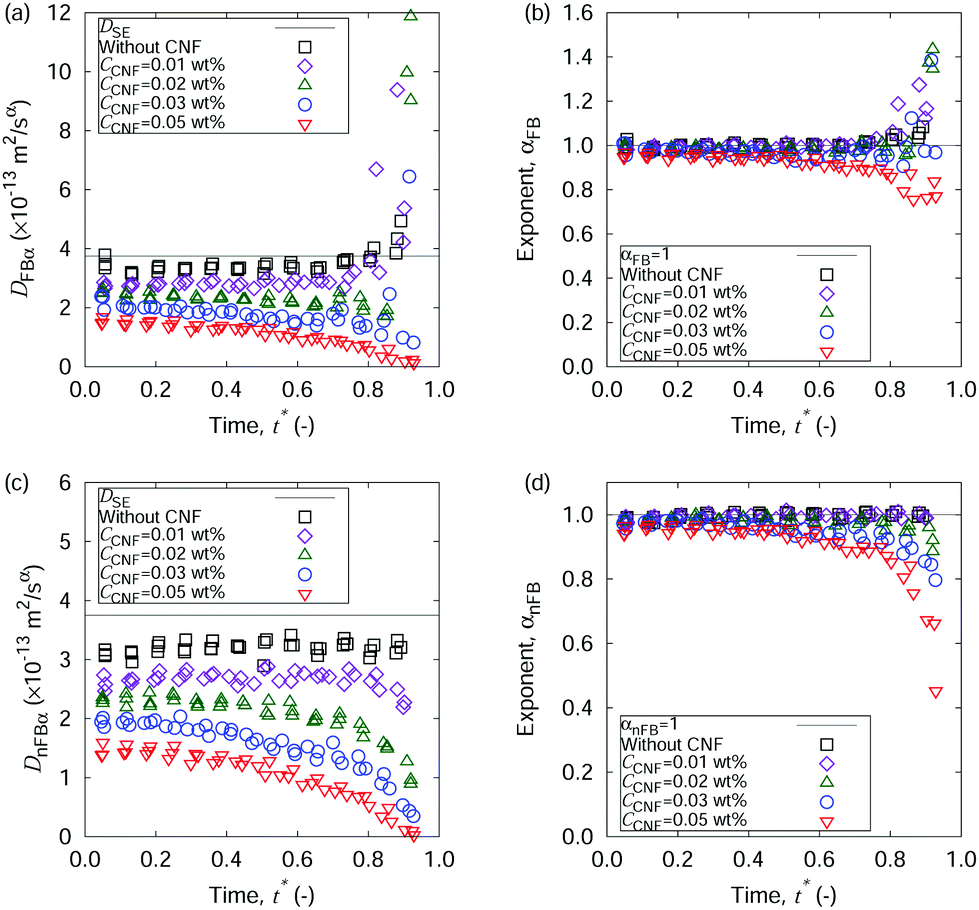
Fig. 3 shows the MSDs as a function of time, based on two types of displacements, i.e., the overall displacement that includes possible flow transport, and the displacement perpendicular to the flow direction. The addition of CNFs causes a decrease of the MSDs at the same time span. The final stage of the drying process (t* = 0.9) shows a variation in the slopes of the MSDs for the overall displacements (Fig. 3(c)) and a monotonic decease in the slope for the MSDs without flow components (Fig. 3(f)). These characteristics are summarized by the framework of the generalized diffusion coefficients and the scaling exponents (cf.eqn (1) and (2)) as shown in Fig. 4. Fig. 4(a) and (b) clearly show the drastic increase in DFBα and αFB at the final stage of the drying process when the droplets did not include CNFs or when CCNF was too small. This is a hallmark of the coffee-ring phenomenon, where the flow transport is most active at the final stage of the drying process. Here, αFB > 1 corresponds to the directed persistent motion caused by the flow. On the other hand, evaluation of the pure Brownian component by the displacement perpendicular to the flow reveals the microrheological state of the drying droplets (cf.Fig. 4(c) and (d)). The generalized diffusion coefficient DnFBα shows a significant difference depending on the CCNF. DnFBα further decreases with t*. It is manifested more for higher CCNF values, whereas it is constant when CCNF = 0 wt%. Furthermore, αnFB ≈ 1 for most of the time t*, and αnFB drastically decreases at the final stage of drying process for a sufficiently high CCNF. This indicates the subdiffusive behavior of the particles because of the confinement effect from the structural order made of the collection of CNFs. Thus, the confimement effect plays a vital role besides the viscocity effect. The viscocity effect is considered to play a more important role before network structure formation, and confinement effect by the network structure is considered to be stronger once it is formed. This difference originates from whether CNFs themselves significantly diffuses or not. It should be noted that the boundary of sol and gel is not completely clear in general36 compared with the liquid and solid state of water or metals. Overall, the scaling exponent αFB being substantially smaller than 1 at the late stage of the drying process indicates the existence of the collective structural order of the CNFs. The concentration-dependent variation of the rheological characteristics is basically consistent with the existing reports with a specific focus on the aqueous CNF dispersion37,38 including the gelation.39 In fact, many of the existing reports on the rheological characterization of CNFs are based on an invasive protocol in the experimental setup. Therefore, details on the collective structures are the future scope in the field of CNFs.
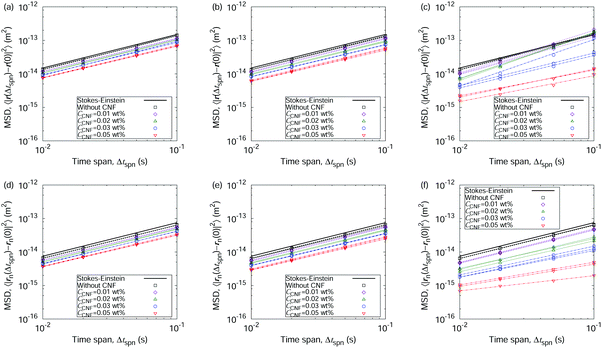 |
| | Fig. 3 Time evolution of the mean squared displacements (MSDs) based on the overall displacements ((a)–(c)) and displacements perpendicular to the flow direction ((d)–(f)) when t* = 0.05 ((a) and (d)), 0.5 ((b) and (e)), and 0.9 ((c) and (f)), respectively. The solid line indicates the prediction by the Stokes–Einstein relation for bulk system without CNFs. | |
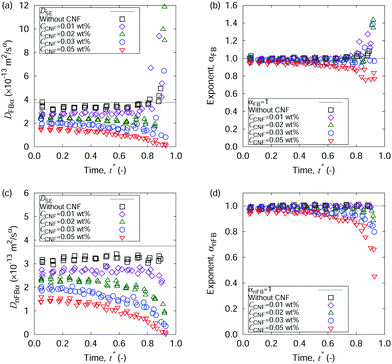 |
| | Fig. 4 Time evolution of the generalized diffusion coefficients ((a) and (c)) and the scaling exponent ((b) and (d)) based on the overall displacements ((a) and (b)) and the displacements perpendicular to the flow direction ((c) and (d)), respectively. The solid line indicates the prediction by the Stokes–Einstein relation for bulk system without CNFs. | |
The suppression of the coffee-ring phenomenon for a sufficiently high CCNF is attained by the hindrance of particle transport, mainly at the final stage of the drying process, as we have observed in Fig. 4. Since the dispersant water disappears in the drying process and the final stage of the drying process is the main contribution, it is worth noting how the initial concentration CCNF matters in deciding whether suppression of the coffee-ring effect is substantial or not. When the CCNF is too low, a substantial portion of the CNFs are transported to the periphery of the sessile droplets before the rush hour by the preliminary part of the coffee-ring phenomenon. On the other hand, a sufficiently high CCNF resists flow transport before the rush hour after drying has proceeded to some extent. Therefore, the choice of CCNF matters in such a way that drying before the rush hour enables a suitable concentration to be reached for forming the hydrogen bond network, which increases the structural order of the CNFs, which in turn hinders the transport of particles to the droplet periphery. From the viewpoint of industrial applications, this mechanism is highly advantageous for implementation with conventional inkjet printers. The initial state of the working fluid satisfies the need for a sufficiently low viscosity, and the confinement effect by the CNFs emerges after inkjet discharge. Thus, this is a spatio-temporally controlled process making use of the function of timing besides the structural order.
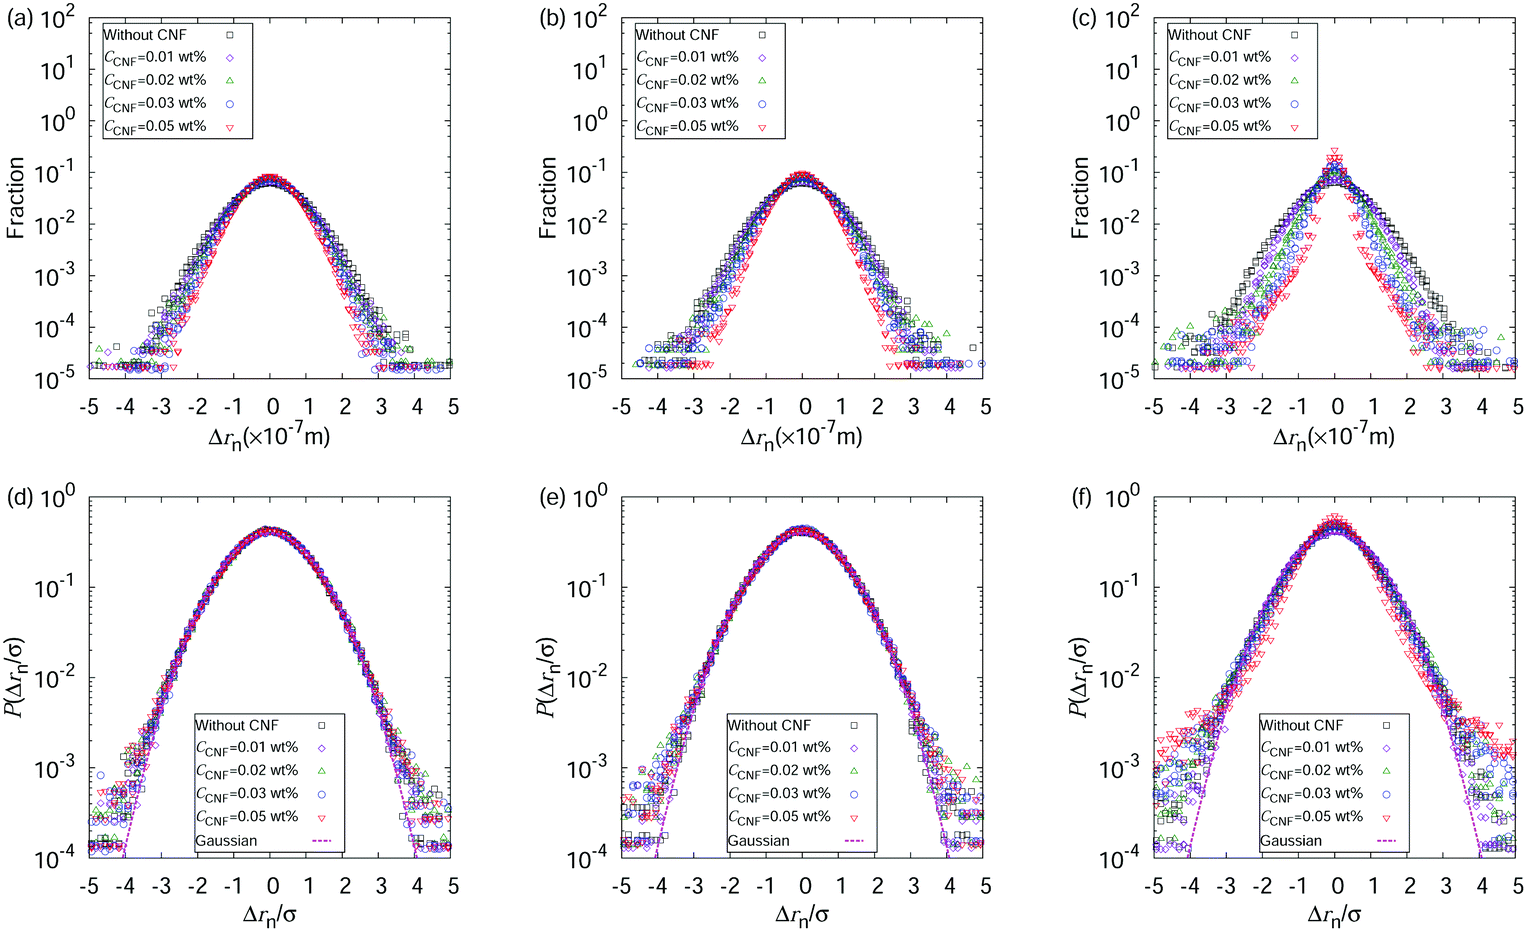
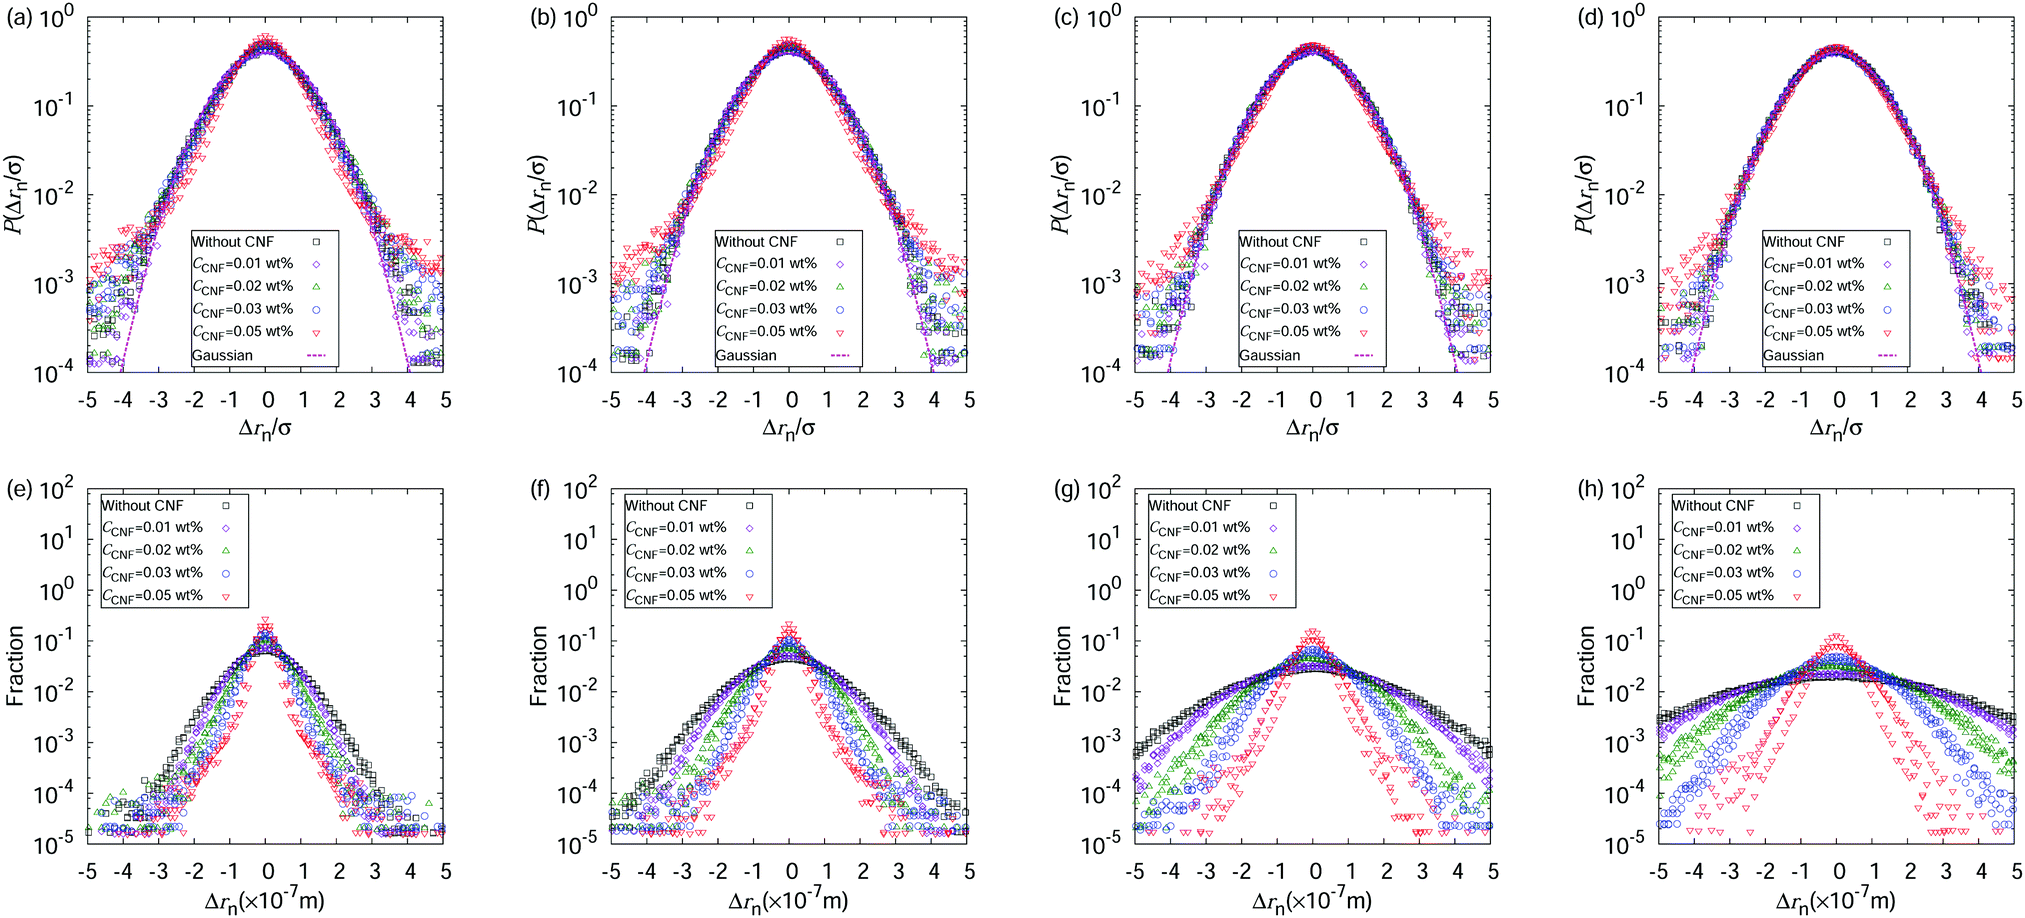
So far, we have focused on the time evolution of the MSDs. We now move onto the ensemble characteristics while paying attention to the time dependent behaviors. We show the displacement distributions based on those perpendicular to the flow directions at t* = 0.05, 0.5, and 0.9 in Fig. 5. The displacements always show a Gaussian distribution when the water droplet contains only the polystyrene particles. The particle dispersions with CNFs also show a Gaussian distribution of displacements before the final stage of the drying process. At t* = 0.9, the displacements tend to be closer to zero, indicating the confinement effect by the CNFs. This significant deviation of displacement distribution from Gaussian suggests the emergence of structural order by the network of CNFs with hydrogen bonds. These results are consistent with the discussion on the generalized diffusion coefficients and the scaling exponents (cf.Fig. 4). A more detailed inspection of the displacement distribution reveals the nature of the confinement. Fig. 6 shows that non-Gaussian behavior with a higher probability of smaller displacements is more prominent when the displacements are evaluated with a smaller time span Δtspn. In other words, the longer time span shows a greater fraction of released particle motion from the temporary confinements. On the other hand, the final stage of the drying process also shows a higher fraction of larger displacements over typical (i.e., root mean square) lengths besides the smaller displacements. This is attributed to the characteristics where the particles released from confinement temporarily tend to have a larger kinetic energy than that which corresponds exactly to the temperature. It should also be noted that the smaller MSDs indicate that the overall motion is confined compared with the condition without CNFs. The events of particle release from confinement are more rare compared with the motion under the confined states. The precise estimation of the trapping potential is nontrivial since the escape time depends not only on the height but also on the shape of the potential.40
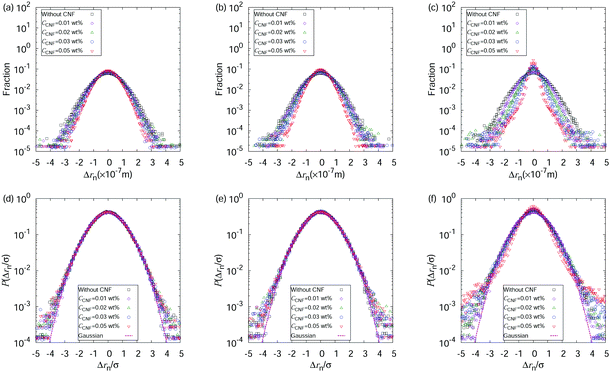 |
| | Fig. 5 Displacement distributions perpendicular to the flow direction when Δtspn = 0.01 s at t* = 0.05 ((a) and (d)), 0.5 ((b) and (e)), and 0.9 ((c) and (f)) shown as dimensional values (a–c) and dimensionless values (d–f) scaled by standard deviations for each condition. | |
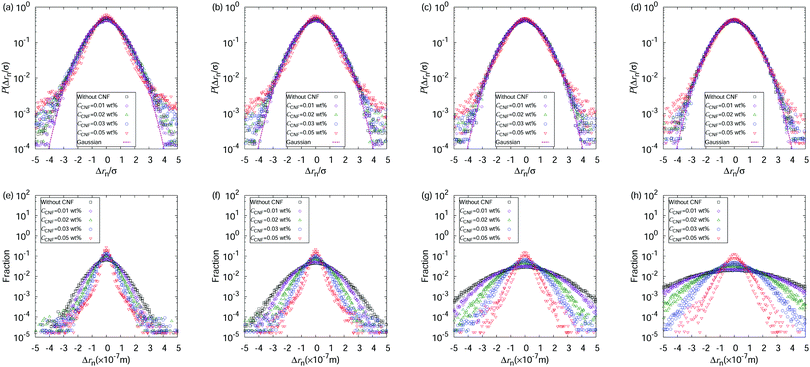 |
| | Fig. 6 Displacement distributions perpendicular to the flow direction when t* = 0.9 for Δtspn = 0.01 s ((a) and (e)), 0.02 s ((b) and (f)), 0.05 s ((c) and (g)), and 0.1 s ((d) and (h)) shown as dimensional values ((a)–(d)) and dimensionless values ((e)–(h)) scaled by standard deviations for each condition. | |
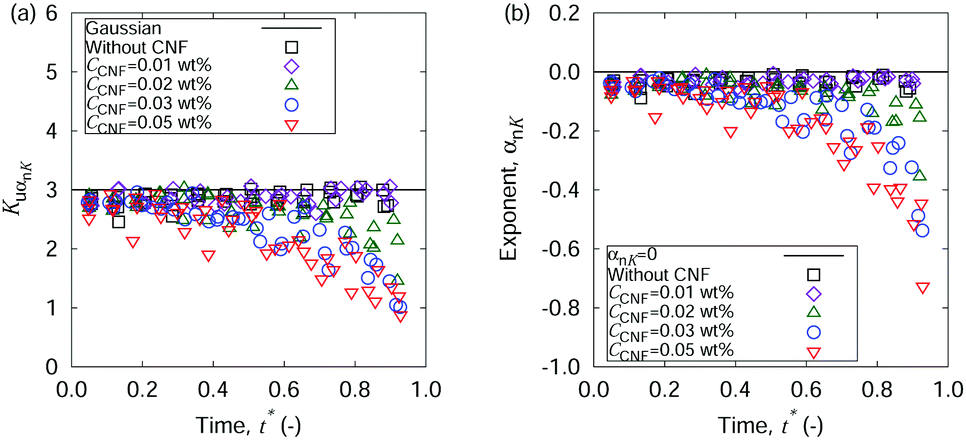
The above-mentioned characteristics of the time evolution of the displacement distributions are summarized as that of the kurtosis Ku as shown in Fig. 7. Ku converges to 3 corresponding to the Gaussian shape (cf.eqn (3)) within 10−1 s for most of the cases except for the final stage of the drying process when CCNF is sufficiently high. Fig. 8 summarizes these behaviors based on the model of eqn (4). The effect of CNFs until the middle stage of the drying process for sufficiently low initial concentrations is mainly the net increase of viscosity. This is consistent with the roughly constant scaling exponent of the generalized diffusion coefficient (cf.Fig. 4). This includes those conditions where the suppression of the coffee-ring phenomenon is attained. The convergence to the Gaussian distribution indicates that the central limit theorem holds. The displacements are independently and identically distributed (I.I.D.), and sufficient collection of the finite sum of displacements at shorter time scales results in the Gaussian distribution. In other words, these particles were not fixed at a specific position with reference to the substrate coordinate but had some room to explore the space scale accessible at the time scale of 10−1 s. Last but not least, it should be noted that the observation and measurement are sufficiently away from the substrate surface to avoid the hydrodynamic slowing down effect of the diffusion.41–46 The measurement finishes at t* = 0.9 before the air–liquid interface significantly enters the observation depth. Therefore, it is expected that the confinement effects by CNFs will be more obvious for t* > 0.9. Furthermore, we did not examine a higher CCNF than 0.05 wt%. If more importance is to be placed on the uniformity of the dried film than shown in Fig. 2(e), there is still room to increase the CCNF.
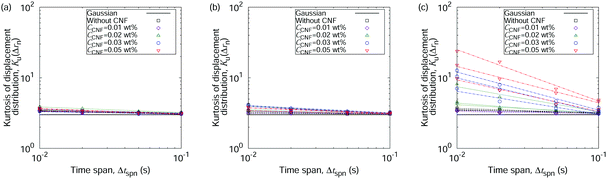 |
| | Fig. 7 Time evolution of the kurtosis of displacement distribution when t* = 0.05, 0.5 and 0.9, respectively. The displacement distribution perpendicular to the flow direction is employed in this analysis. | |
 |
| | Fig. 8 Time evolution of the generalized coefficients of (a) kurtosis and (b) its exponent. The displacement distribution perpendicular to the flow direction is employed in this analysis. | |
4 Conclusions
We have revealed the mechanism to suppress the coffee-ring phenomenon of sessile colloidal droplets by the addition of a small amount of cellulose nanofibers (CNFs). This is not merely a difference of viscosity in equilibrium, but a confinement effect by the structural order formed by the CNFs in the nonequilibrium process of the drying time scale. The confinement effect of CNFs emerges at the final stage of the drying process when the CNF concentration is sufficient to form collective structural order. Therefore, the initial condition of the aqueous dispersion with CNFs does not have to be highly viscous. As a result, this approach is advantageous for implementation with conventional inkjet printing that requires a sufficiently low viscosity of the sample liquid. As the coffee-ring effect is also dominated at the final stage of the drying process, i.e., the so-called rush hour, the proposed approach is based on the spatio-temporally controlled process. In contrast to the limitation that μPIV can discuss the role of dispersed CNFs only when there is a difference in the flow velocity field, the SPT-based analysis in this study proved this mechanism by clearly addressing the mesoscopic state of the aqueous CNF dispersion including the time before the rush hour when significant flow is not observed regardless of whether the CNFs are added or not. There is a single subtlety in the initial condition of the CNF concentration. Although the drying process increases the CNF concentration, the emergence of structural order should not be too late for the suppression of the coffee-ring phenomenon. While the necessary initial CNF concentration is sufficiently low with respect to conventional inkjet implementation, the CNF concentration needs to be sufficiently high before the rush hour to form structural order. This is a key to turn the initial condition into the control of the transient process.
Author contributions
Conceptualization and methodology, I. H.; software and validation, N. K. and I. H.; formal analysis and visualization, N. K.; investigation and data curation, N. K. and I. H.; writing – original draft, N. K. and I. H.; writing – review and editing, I. H.; supervision and project administration, I. H.; resources and funding acquisition, I. H.
Conflicts of interest
The authors declare no competing interests.
Acknowledgements
This work was partly supported by the Japan Society for the Promotion of Science (JSPS) KAKENHI, Grant No. 18H01365 and Grant No. 20K20956.
References
- S. Ohira, D. Mizumura and I. Hanasaki, AIP Adv., 2020, 10, 045122 CrossRef CAS.
- T. T. Nge, M. Nogi and K. Suganuma, J. Mater. Chem. C, 2013, 1, 5235–5243 RSC.
- C. Kim, M. Nogi, K. Suganuma, Y. Saitou and J. Shirakami, RSC Adv., 2012, 2, 8447–8451 RSC.
- C. Cano-Raya, Z. Z. Denchev, S. F. Cruz and J. C. Viana, Appl. Mater. Today, 2019, 15, 416–430 CrossRef.
- A. J. Bandodkar, R. Nunez-Flores, W. Jia and J. Wang, Adv. Mater., 2015, 27, 3060–3065 CrossRef CAS.
- M. Singh, H. M. Haverinen, P. Dhagat and G. E. Jabbour, Adv. Mater., 2010, 22, 673–685 CrossRef CAS PubMed.
- A. F. Routh, Rep. Prog. Phys., 2013, 76, 046603 CrossRef PubMed.
- Á. G. Marín, H. Gelderblom, D. Lohse and J. H. Snoeijer, Phys. Rev. Lett., 2011, 107, 085502 CrossRef PubMed.
- R. D. Deegan, O. Bakajin, T. F. Dupont, G. Huber, S. R. Nagel and T. A. Witten, Nature, 1997, 389, 827–829 CrossRef CAS.
- C. Kim, M. Nogi and K. Suganuma, J. Micromech. Microeng., 2012, 22, 035016 CrossRef.
- H. Zhu, Z. Fang, C. Preston, Y. Li and L. Hu, Energy Environ. Sci., 2014, 7, 269–287 RSC.
- D. Mizumura, I. Hanasaki, Y. Ooi and Y. Horikawa, Micro Nano Lett., 2017, 12, 516–519 CrossRef CAS.
- M. Nogi, N. Komoda, K. Otsuka and K. Suganuma, Nanoscale, 2013, 5, 4395–4399 RSC.
- S. Li and P. S. Lee, Sci. Technol. Adv. Mater., 2017, 18, 620–633 CrossRef CAS PubMed.
- H. Koga, M. Nogi, N. Komoda, T. T. Nge, T. Sugahara and K. Suganuma, NPG Asia Mater., 2014, 6, e93 CrossRef CAS.
- O. Nechyporchuk, M. N. Belgacem and J. Bras, Ind. Crops Prod., 2016, 93, 2–25 CrossRef CAS.
- A. Penttila, J. Sievanen, K. Torvinen, K. Ojanpera and J. A. Ketoja, Cellulose, 2013, 20, 1413–1424 CrossRef.
- L. Wang, D. Chen, K. Jiang and G. Shen, Chem. Soc. Rev., 2017, 46, 6764–6815 RSC.
- F. Hoeng, A. Denneulin and J. Bras, Nanoscale, 2016, 8, 13131–13154 RSC.
- M. J. Tan, C. Owh, P. L. Chee, A. K. K. Kyaw, D. Kai and X. J. Loh, J. Mater. Chem. C, 2016, 4, 5531–5558 RSC.
- H. Zhu, W. Luo, P. N. Ciesielski, Z. Fang, J. Y. Zhu, G. Henriksson, M. E. Himmel and L. Hu, Chem. Rev., 2016, 116, 9305–9374 CrossRef CAS.
- K.-Y. Shin, S.-H. Lee and J. H. Oh, J. Micromech. Microeng., 2011, 21, 045012 CrossRef.
- G. Lanzani, Nat. Mater., 2014, 13, 775–776 CrossRef CAS PubMed.
- D. J. Lipomi, J. A. Lee, M. Vosgueritchian, B. C. K. Tee, J. A. Bolander and Z. Bao, Chem. Mater., 2012, 24, 373–382 CrossRef CAS.
- M. ElMahmoudy, S. Inal, A. Charrier, I. Uguz, G. G. Malliaras and S. Sanaur, Macromol. Mater. Eng., 2017, 302, 1600497 CrossRef.
- M. Strange, D. Plackett, M. Kaasgaard and F. C. Krebs, Sol. Energy Mater. Sol. Cells, 2008, 92, 805–813 CrossRef CAS.
- Y. Ooi, I. Hanasaki, D. Mizumura and Y. Matsuda, Sci. Technol. Adv. Mater., 2017, 18, 316–324 CrossRef CAS PubMed.
- H. Yagyu, T. Saito, A. Isogai, H. Koga and M. Nogi, ACS Appl. Mater. Interfaces, 2015, 7, 22012–22017 CrossRef CAS PubMed.
- R. Motohashi and I. Hanasaki, Nanoscale Adv., 2019, 1, 421 RSC.
- N. Chenouard, I. Smal, F. de Chaumont, M. Maška, I. F. Sbalzarini, Y. Gong, J. Cardinale, C. Carthel, S. Coraluppi, M. Winter, A. R. Cohen, W. J. Godinez, K. Rohr, Y. Kalaidzidis, L. Liang, J. Duncan, H. Shen, Y. Xu, K. E. G. Magnusson, J. Jaldén, H. M. Blau, P. Paul-Gilloteaux, P. Roudot, C. Kervrann, F. Waharte, J.-Y. Tinevez, S. L. Shorte, J. Willemse, K. Celler, G. P. van Wezel, H.-W. Dan, Y.-S. Tsai, C. O. de Solórzano, J.-C. Olivo-Marin and E. Meijering, Nat. Methods, 2014, 11, 281–289 CrossRef CAS PubMed.
- R. Motohashi, I. Hanasaki, Y. Ooi and Y. Matsuda, Micro Nano Lett., 2017, 12, 506–510 CrossRef.
- I. Hanasaki, T. Shoji and Y. Tsuboi, ACS Appl. Nano Mater., 2019, 2, 7637–7643 CrossRef CAS.
- I. F. Sbalzarini and P. Koumoutsakos, J. Struct. Biol., 2005, 151, 182–195 CrossRef CAS PubMed.
- R. Metzler, J.-H. Jeon, A. G. Cherstvy and E. Barkai, Phys. Chem. Chem. Phys., 2014, 16, 24128–24164 RSC.
- I. Hanasaki and C. Hosokawa, Jpn. J. Appl. Phys., 2019, 58, SDDK07 CrossRef CAS.
- T. Yasuda, N. Sakumichi, U. Chung and T. Sakai, Phys. Rev. Lett., 2020, 125, 267801 CrossRef CAS PubMed.
- R. Tanaka, T. Saito, D. Ishii and A. Isogai, Cellulose, 2014, 21, 1581–1589 CrossRef CAS.
- R. Tanaka, T. Saito, H. Hondo and A. Isogai, Biomacromol., 2015, 16, 2127–2131 CrossRef CAS PubMed.
- L. Mendoza, W. Batchelor, R. F. Tabor and G. Garnier, J. Colloid Interface Sci., 2018, 509, 39–46 CrossRef CAS PubMed.
- I. Hanasaki, T. Nemoto and Y. Tanaka, Phys. Rev. E, 2019, 99, 022119 CrossRef CAS PubMed.
- H. Brenner, Chem. Eng. Sci., 1961, 16, 242–251 CrossRef CAS.
- A. J. Goldman, R. G. Cox and H. Brenner, Chem. Eng. Sci., 1967, 22, 637–651 CrossRef CAS.
- P. Huang and K. S. Breuer, Phys. Rev. E: Stat., Nonlinear, Soft Matter Phys., 2007, 76, 046307 CrossRef PubMed.
- M. D. Carvajal-Tinoco, R. Lopez-Fernandez and J. L. Arauz-Lara, Phys. Rev. Lett., 2007, 99, 138303 CrossRef PubMed.
- C. K. Choi, C. H. Margraves and K. D. Kihm, Phys. Fluids, 2007, 19, 103305 CrossRef.
- P. Holmqvist, J. K. G. Dhont and P. R. Lang, J. Chem. Phys., 2007, 126, 044707 CrossRef PubMed.
|
| This journal is © The Royal Society of Chemistry 2021 |
Click here to see how this site uses Cookies. View our privacy policy here. 
 Open Access Article
 This Open Access Article is licensed under a
  *b
*b