
 Open Access Article
 This Open Access Article is licensed under a Creative Commons Attribution-Non Commercial 3.0 Unported Licence
Rheology of bacterial superfluids in viscous environments†
Jane Y. Y.
Chui
 a,
Carine
Douarche
b,
Harold
Auradou
*b and
Ruben
Juanes
*ac
a,
Carine
Douarche
b,
Harold
Auradou
*b and
Ruben
Juanes
*ac
aDepartment of Civil and Environmental Engineering, Massachusetts Institute of Technology, Cambridge, MA 02139, USA. E-mail: juanes@mit.edu
bUniversité Paris-Saclay, CNRS, FAST, 91405, Orsay, France. E-mail: harold.auradou@u-psud.fr
cDepartment of Earth, Atmospheric and Planetary Sciences, Massachusetts Institute of Technology, Cambridge, MA 02139, USA
First published on 29th June 2021
Abstract
Viscous environments are ubiquitous in nature and in engineering applications, from mucus in lungs to oil recovery strategies in the earth's subsurface – and in all these environments, bacteria also thrive. The behavior of bacteria in viscous environments has been investigated for a single bacterium, but not for active suspensions. Dense populations of pusher-type bacteria are known to create superfluidic regimes where the effective viscosity of the entire suspension is reduced through collective motion, and the main purpose of this study is to investigate how a viscous environment will affect this behavior. Using a Couette rheometer, we measure shear stress as a function of the applied shear rate to define the effective viscosity of suspensions of Escherichia coli (E. coli), while varying both the bacterial density within the suspension and the viscosity of the suspending fluid. We document the remarkable observation that E. coli decreases the effective suspension viscosity to near-zero (superfluidic regime) for all solvent viscosities tested (1–17 mPa s). Specifically, we observe that the bacterial density needed to trigger this superfluidic regime and the maximum shear rate under which this regime can be sustained both decrease with increasing solvent viscosity. We find that the resulting rheograms can be well approximated by the Carreau–Yasuda law. Using this, we propose a constitutive model as a function of the solvent viscosity and the bacterial concentration only. This model captures the onset of the superfluidic regime and offers promising avenues for the modelling of flow of bacterial suspensions in viscous environments.
1 Introduction
The physics of active fluids consisting of ensembles of self-propelled particles in suspension has attracted increased interest in recent years because of its application in many fields such as soft matter physics,1,2 biology,3 medicine,4 and ecology.5 These active fluids exhibit many interesting properties, including enhanced diffusion of passive tracers6 and the emergence of collective motion (bio-turbulence),7 which leads to behavior like shear banding8 and spontaneous directional flows.9,10 A particularly surprising feature is reduction of the effective viscosity11–14 and the associated superfluid-like behavior.14,15Reduction of the effective viscosity through bacterial motility was first proposed theoretically by Hatwalne et al.16 and Haines et al.,17 then inferred by Chen et al.18 and later confirmed by Sokolov et al.,11 validating theoretical predictions.19 This phenomenon was subsequently confirmed by microfluidic measurements,12,20 extensional rheometry,13 and viscosity measurements in a Couette rheometer.14,15 The latter study also uncovered the existence of a superfluid regime of zero effective viscosity at low shear rates. In this regime, the effective viscosity reduction emerges due to (1) the competition between orientation in the flow due to shear and the natural ability of the bacteria to tumble during swimming,21 and (2) the net active stresslet produced by extensile (pusher) swimmers that reinforces the applied flow and reduces the overall shear stress needed to drive the flow.22–25 Pushers produce a net negative stresslet due to thrust from their flagellar bundle in the direction of flow (as opposed to the net positive stresslet produced by pullers like Chlamydomonas)26 and they must reach a critical bacterial density before collective motion (arising from interaction between active stresslets) occurs, resulting in a superfluidic regime where the negative active viscosity from swimming activity cancels out the intrinsic fluid viscosity.23,27,28
Thus far, all of the experiments for active fluid behavior employ an environment synonymous with water, which is a low-viscosity ambient fluid representative of only a subset of the wide range of natural and engineered environments, which can include high-viscosity fluids. Berg and Turner,29 Schneider and Doetsch30 and Martinez et al.31 have studied how viscosity affects the swimming speed and rotational speed of a single bacterium moving through fluids of different viscosities. Here, we extend these studies to understand the effect that more viscous environments have on the collective behavior of a dense pusher-type bacterial suspension, and evaluate the bacteria's ability to reach superfluid behavior in these environments.
As it is often impractical to solve the equations of motion governing the microscopic dynamics of every single swimming bacterium or their collective motion, here we seek a coarse-grained continuum model describing the rheology of an active fluid in terms of bacterial density, shear rate, and viscosity of the ambient fluid. This constitutive model would find direct applicability in the development of computational models of active bacterial suspensions in viscous environments.
2 Materials and methods
2.1 Rheological measurements
The shear stress is measured in a low-shear Couette rheometer (Contraves 30), especially designed for precision in probing low-viscosity fluids.14 The central bob (radius Rbob = 5.5 mm, length 8 mm, underside cone angle 20°) is suspended concentrically into an outer cup (inner radius Ri = 6 mm). This outer cup rotates at an angular rate Ω set via a signal on the computer, and the corresponding shear rate is given with a precision of 0.5% (inset Fig. 1a). The central bob is kept fixed by a feedback counter-rotation of the suspending wire and the instrument measures the compensating torque required to keep the torsion wire at its zero position. The torque required to keep the inner bob stationary is then converted into shear stress every second with a sensitivity of 10−3 mPa. All the experiments are performed at a temperature of 25 °C.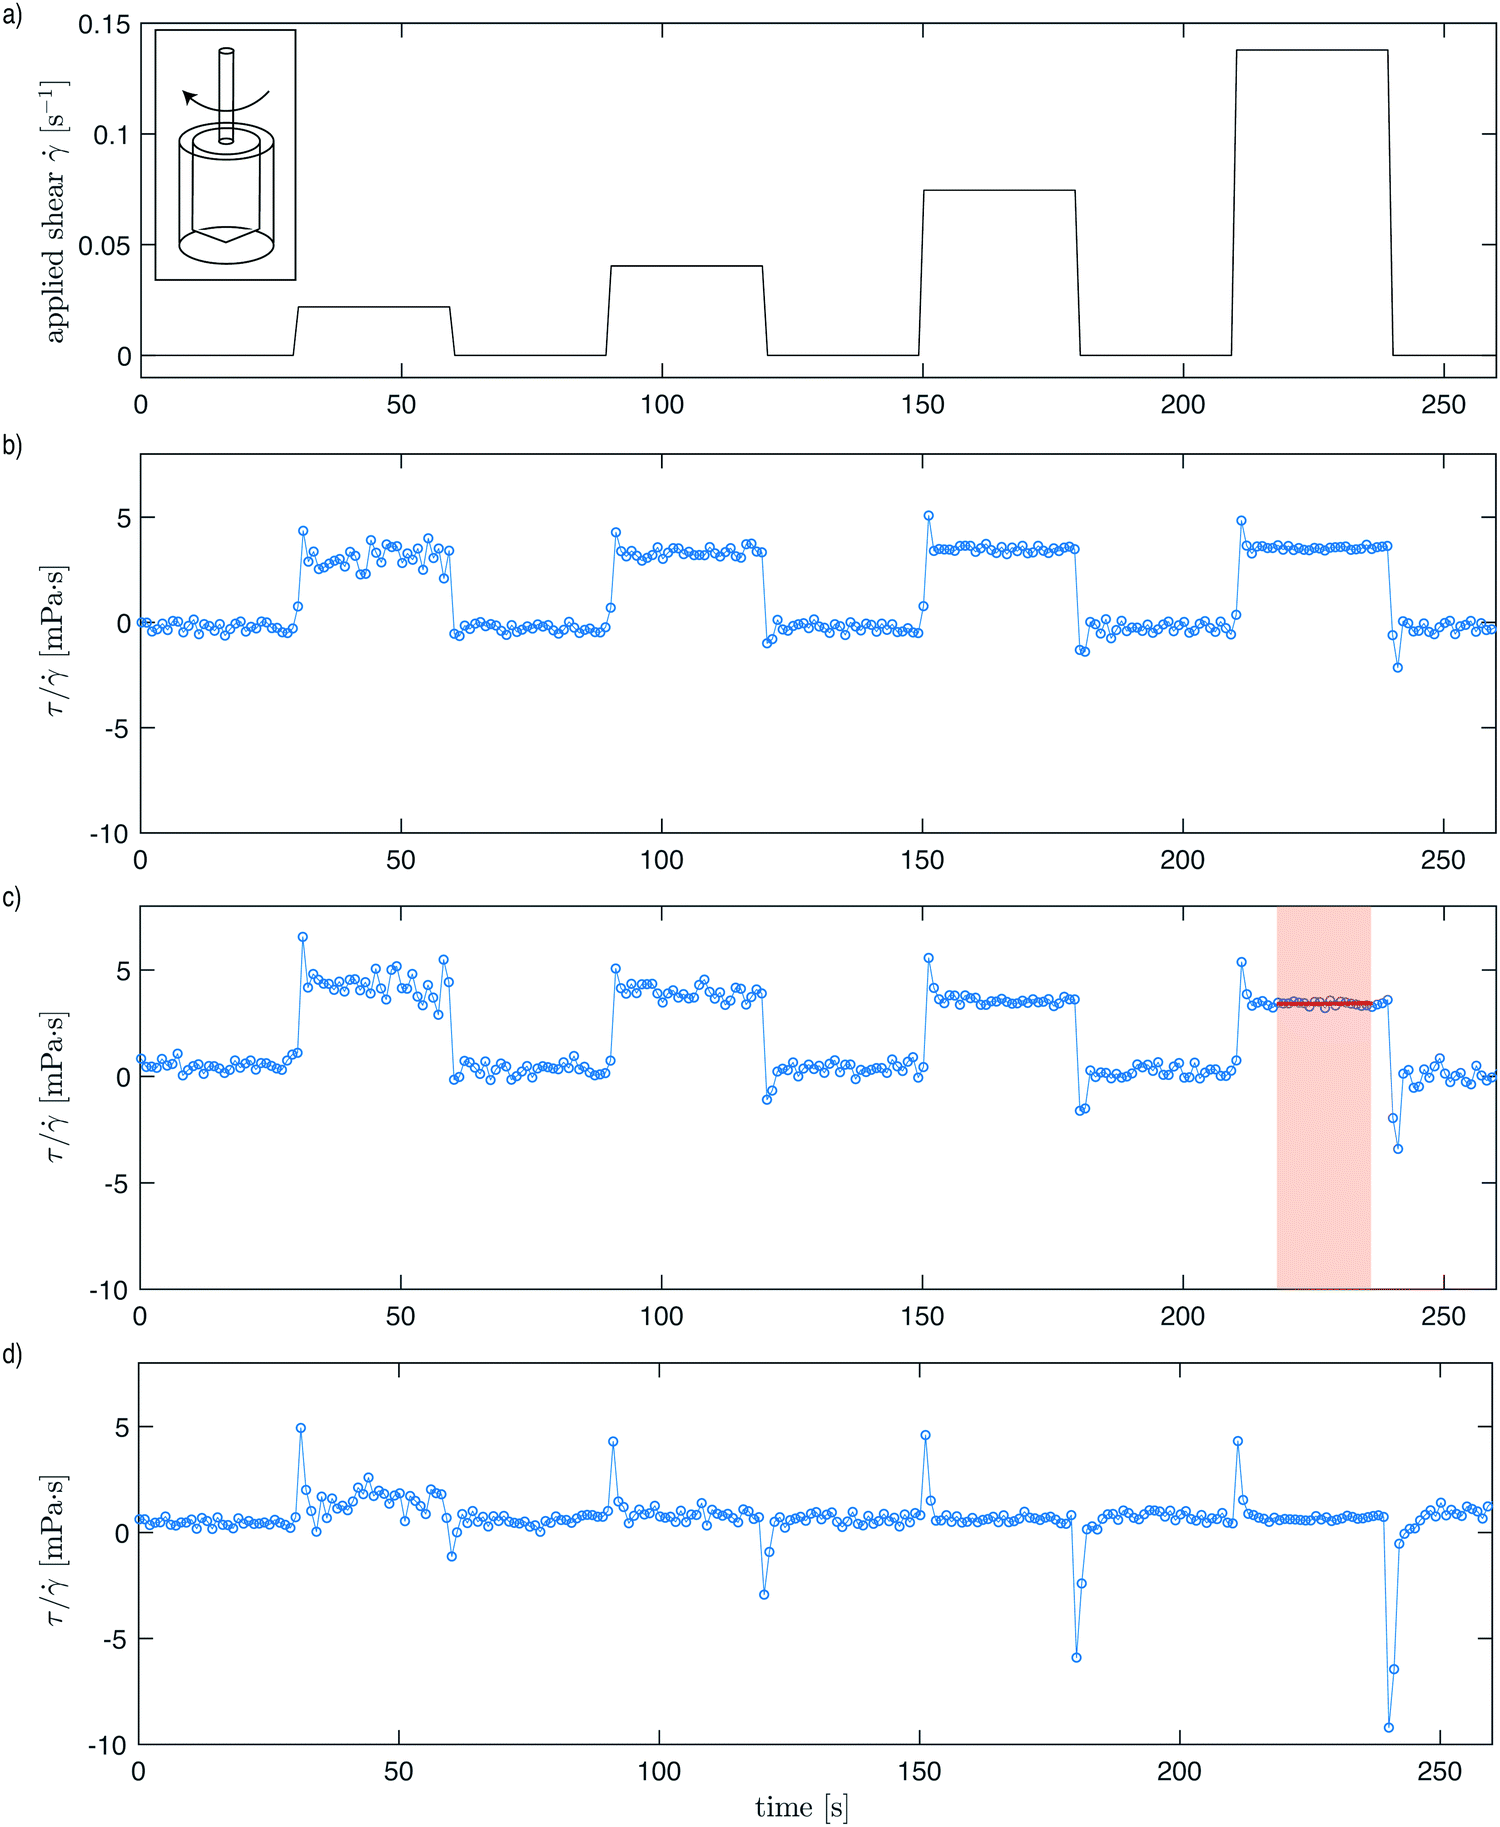 | ||
Fig. 1 Shear stress response for E. coli suspended in an environment four times more viscous than water (1% concentration solution of PVP360k). (a) The first four stages (0.02, 0.04, 0.075 and 0.14 s−1) of the applied shear rate. Each shear-rate stage is applied for a period of 30 s, followed by a period of zero shear rate, also over a period of 30 s. (b–d) The corresponding shear stress (τ) normalized by the applied shear rate (![[small gamma, Greek, dot above]](https://www.rsc.org/images/entities/i_char_e0a2.gif) ) of: (b) dilute suspension of non-motile bacteria (OD = 3), (c) dilute suspension of motile bacteria (OD = 6), and (d) suspension of motile bacteria (OD = 30) in a superfluidic regime. OD = 1 corresponds to a concentration of 8 × 10⁸ cells per mL. The average effective viscosity of each stage is obtained by averaging the values that make up the plateau of each 30 s period (indicated by red shading and horizontal red line). ) of: (b) dilute suspension of non-motile bacteria (OD = 3), (c) dilute suspension of motile bacteria (OD = 6), and (d) suspension of motile bacteria (OD = 30) in a superfluidic regime. OD = 1 corresponds to a concentration of 8 × 10⁸ cells per mL. The average effective viscosity of each stage is obtained by averaging the values that make up the plateau of each 30 s period (indicated by red shading and horizontal red line). | ||
To obtain a full shear stress versus shear rate curve, the following protocol is used: (i) a volume ∼1 mL of the suspension is poured into the cup and the bob is lowered; (ii) after 60 s at rest, the cup is rotated at a constant shear rate for a fixed amount of time, and then the rotation is stopped and the fluid is allowed to relax for the same fixed amount of time. Step (ii) is repeated with increasing shear-rate values. In these experiments, the shear rate is ramped up from = 0.022 s−1 to a maximum shear rate of = 63 s−1, and the procedure is repeated also in reverse order until the lowest shear rate is reached. Fig. 1 shows the applied shear rate and typical measurements by the rheometer for a non-motile suspension, a dilute motile suspension, and a concentrated motile suspension that is behaving as a superfluid.
2.2 Solvent preparation and rheology
The suspending fluid (or solvent) is prepared by dissolving the polyvinylpyrrolidone 360k polymer (PVP) (Sigma-Aldrich) into motility buffer (MB) (prepared according to the recipe in López et al.14). Rheology measurements are performed to obtain the viscosity of the PVP-MB mixture for different polymer concentrations (Fig. 2). In the range of shear rates probed here, viscosity does not depend on the shear rate, and so the solutions can be considered Newtonian for this range. The viscosity of the different PVP-MB solvent solutions ηs(c) is defined as the measured viscosity averaged over the shear rates used, as a function only of the concentration c of the PVP dissolved. The error Δηs(c) is defined as the root mean square (RMS) deviation of the values of ηs(c). The values of ηs for the different polymer solutions are given in Table 1 as a function of the different polymer concentrations used. | ||
| Fig. 2 Viscosity ηs as function of the shear rate for a solution of MB containing different PVP360k concentrations. From top to bottom: 3%, 2% and 1% wt/vol of MB. For each rate, the Couette rheometer measurements are performed twice. | ||
 : average swimming velocity of the bacteria in a dilute suspension. Dr: rotational diffusion coefficient of bacteria
| c [wt%] | η s [mPa s] |
|
D r [s−1] |
|---|---|---|---|
| 0 | 0.97, 0.1 | 13.9 | 0.182 |
| 1 | 3.93, 0.1 | 9.9 | 0.161 |
| 2 | 10.39, 0.2 | 7.1 | 0.063 |
| 3 | 16.70, 1 | 5.8 | 0.036 |

2.3 Bacterial suspension preparation
Motile wild-type E. coli bacteria (MG1655, CGSC# 7740) are grown overnight in standard tryptone broth (1% tryptone, 0.5% NaCl) at 25 °C and aerated at 160 rpm until early stationary phase is reached. This is determined by measuring the optical density (OD) using a spectrophotometer (Eppendorf D30 BioPhotometer) set at the standard of 600 nm. In these experiments, an OD measurement of 1 corresponds to a concentration of 8 × 10⁸ cells per mL. The growth medium is then removed by centrifuging the culture at 2303 × g (Hettich Rotofix 32A) and removing the supernatant. The bacteria are then resuspended into a motility buffer (MB),14 which is supplemented with L-serine at 0.08 g mL−1 to maintain high levels of motility on the order of hours even in the absence of oxygen. This bacterial suspension is then mixed into a PVP-MB mixture of known viscosity for the experiment.We created a fluorescent non-motile version of the E. coli MG1655 strain for control purposes. This derived strain (KAF602) has a mutation in a component of the export apparatus, FliI (K188I), that inactivates the ATPase activity necessary for export of external flagellar components, rendering it non-motile.
2.4 Characterization of the bacterial activity as a function of the viscosity of the suspending fluid
The changes in swimming activity of the bacteria induced by the viscosity of the solvent are determined from an analysis of bacteria trajectories. We prepared solutions of bacteria suspended in MB containing different amounts of PVP360k. A drop is then placed between a glass slide and a cover slip. Using sequences of 2000 images acquired at a frame rate of 16 images per second with a 10× objective, every bacterium in these suspensions is tracked using the Trackmate plug-in32 of the image analysis free-ware Fiji33 to obtain the swimming trajectory of each bacterium through a given viscous quiescent fluid. From these trajectories, we determined the average swimming speed of the bacteria and the characteristic reorientation time of a bacterium due to its active tumbling. A reorientation time tr is defined here as the amount of time it takes for a bacterium to experience no influence from its previous orientation along the trajectory, as calculated from its positional auto-correlation function.34 The inverse of the reorientation time is then subsequently used to define a rotational diffusion coefficient Dr = 1/tr, and these values, along with the corresponding average velocity , are calculated for all of the different viscosities used in this study (Table 1).
In addition to a bacterium's natural reorientation due to its run-and-tumble swimming style, background flow can also influence the reorientation of each bacterium. The specific orientation of the bacterium (and hence the orientation of the negative stresslet produced from its swimming activity) is critical to the overall rheology of the suspension. For elongated rod-shaped bacteria like those used here, this reorientation time due to applied shear scales as 1/.35 Thus, we can take the ratio of reorientation frequency due to advection () to reorientation frequency due to natural swimming activity (Dr) as a Péclet number,21,36 defined here as:
 | (1) |
3 Results
3.1 Impact of bacteria swimming on viscosity at low shear rate
Our rheometer experiments demonstrate the striking influence of bacteria swimming on the effective viscosity of the suspension. In Fig. 1, we show the signals recorded during three experiments; only the first four steps of the measurements are plotted. Between any two steps, the rheometer is stopped for 30 s to record the baseline signal (Fig. 1a). This ensures that the stress prior to any measurement is zero. We note that for dilute suspensions, the signals for non-motile bacteria (Fig. 1b) and motile bacteria (Fig. 1c) are very similar. When the cup is set in rotation, the stress peaks to a value close to the one observed in the absence of bacteria, and then it relaxes in a few seconds to a constant value. When shear stops, the stress decreases abruptly and quickly returns to zero. We observe that for each step of the applied shear rate, the shear stress τ normalized by the applied shear rate (the effective viscosity) remains the same.
When a large concentration of motile bacteria is added to the suspension, however, the signal becomes very different. For these higher concentrations of motile bacteria (Fig. 1d), the signature on the stress signal of the different shear steps are difficult to discern from the background signal. The value recorded fluctuates around zero stress, whether the cup rotates or is at rest. This zero-stress measurement indicates that the bacterial suspension is in a superfluidic regime where the stress, and subsequently the effective viscosity, is reduced down to zero due to swimming activity. However, once the shear is further increased beyond the shear rate that corresponds with Pe ∼ 1, we recover a signal similar to the one measured at low bacterial concentration, which corresponds to an effective viscosity equal to the background viscosity.
In these rheometer measurements (Fig. 1), we also observe stress undershoots (negative peaks) each cycle after shear cessation, which decay quickly to the steady effective viscosity. This transient negative stress is a signature of active bacterial activity, as has been similarly observed in ref. 14, and is therefore more pronounced with higher OD suspensions (Fig. 1d). Active pusher-type motile organisms like the E. coli used in these experiments generate extensile force dipoles under shear (as opposed to the net contractile dipoles arising from the shearing of passive rods), and this negative transient stress is associated with the relaxation time needed for the dispersal in orientation of these dipoles after shear cessation.37
3.2 Impact of bacterial concentration and solvent viscosity on the suspension viscosity
We acquired a total of more than 30 stress vs shear rate curves using suspensions containing various concentrations of bacteria (between OD = 2 and 40) resuspended in fluids of viscosities ranging between 1 and 15 mPa s.For each shear rate, the measured viscosity is first averaged over the part of the signal that has reached a plateau. The time from which the signal is considered to be in that regime could be determined visually or by a fit using a decreasing exponential function. For all the experiments reported here the average is calculated over a window ranging between 10 and 28 s. This condition ensures that all signals have transitioned to the steady-state regime.
In Fig. 3, we plot the effective viscosity η as function of the shear rate for different bacterial concentrations. The error on the viscosity measurement, shown by vertical bars, is taken as the standard deviation of 10–18 measurements performed under the same conditions (same suspending fluid and same shear rate). At the lowest concentration (OD = 0.8), no variation of the viscosity with the shear rate is measured, and its value is close to the viscosity of the suspending fluid ηs ∼ 4 mPa s (see Table 1). For higher bacterial concentrations, and at the lowest applied shear rate of 0.2 s−1, a net effective viscosity reduction is observed. This drop in effective viscosity increases with an increase in bacterial concentration in the fluid. For OD = 3, the drop in effective viscosity at the lowest shear rate is approximately 40%, and for the two highest OD experiments, ∼100% reduction is observed, in agreement with López et al.14 for a similar bacterial concentration. While measurements done by López et al.14 show a superfluidic regime at a single fixed shear rate of = 0.04 s−1 and a single solvent viscosity (∼1 mPa s), here we show that the superfluidic regime extends above and below the previously observed shear rate, even for higher solvent viscosities. For bacterial suspensions with higher solvent viscosity ηs, the absolute drop in shear stress down to the superfluidic regime, measured using the same rheometer as in ref. 14, is even more dramatic. For instance, for a background viscosity of 4 mPa s, the superfluidic regime is achieved for ∼ 0.02–0.1 s−1 for the OD = 15 and OD = 30 suspensions (Fig. 3).
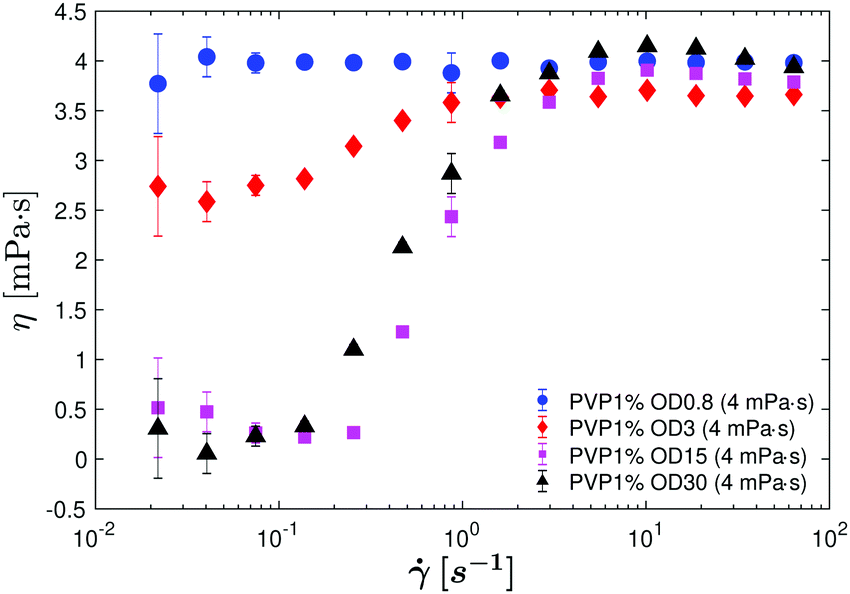 | ||
| Fig. 3 Effective viscosity η as a function of the shear rate of suspensions containing different bacterial concentrations swimming in suspending fluid with a viscosity of ηs = 4 mPa s. Circles: OD = 0.8, diamonds: OD = 3, squares: OD = 15 and triangles: OD = 30. A superfluidic regime is observed for the two highest bacterial concentration suspensions (squares and triangles). | ||
At high shear rates, bacterial activity of the swimmers becomes negligible, and the bacteria behave as passive rods in suspension. As has been shown for complex fluids with passive rod-like particles, the effective viscosity of these suspensions at high shear rates exhibit a shear thinning effect due to the particles orienting with the applied flow,21,25 leading to a viscosity plateau (η∞) that is slightly less than that of the solution with no bacteria or particles (ηs). Prior to reaching this high shear plateau, a slight peak can be observed at ∼ 10–20 s−1 (i.e. OD = 30 suspension in 4 mPa s, leftmost graph of Fig. 7) where the suspension reaches a maximum viscosity. This peak has been observed in previous studies,12,14 and is unique to pushers. This shear-thickening response to increasing applied shear rates between the two plateaus occurs as the active stresses of the active pushers decay much more quickly than the passive contributions from the flow and Brownian rotations, and is well-predicted by theoretical models.21,25 For the purposes of the Carreau–Yasuda model presented here, we do not factor in this nonmonotonic dependence on shear rate at high shear rates as the focus of the study is the superfluidic regime at low shear rates. We instead simplify to a high shear plateau value (η∞) for this model, taken at very high shear rates where the bacteria are fully behaving as passive rods in the shear-thinning regime.
Similar characteristics are observed for different suspending fluid viscosities ηs (Fig. 4): two Newtonian plateaus of constant viscosities at low and high shear rates separated by a transition zone of increasing viscosity. This transition zone between the upper and lower plateaus broadens with increasing ηs: from ∼ 0.1–2 s−1 for PVP0% and PVP1% to ∼ 0.02–4 s−1 for PVP3%. The upper plateau is always found to be of similar magnitude to the viscosity ηs of the fluid without bacteria.
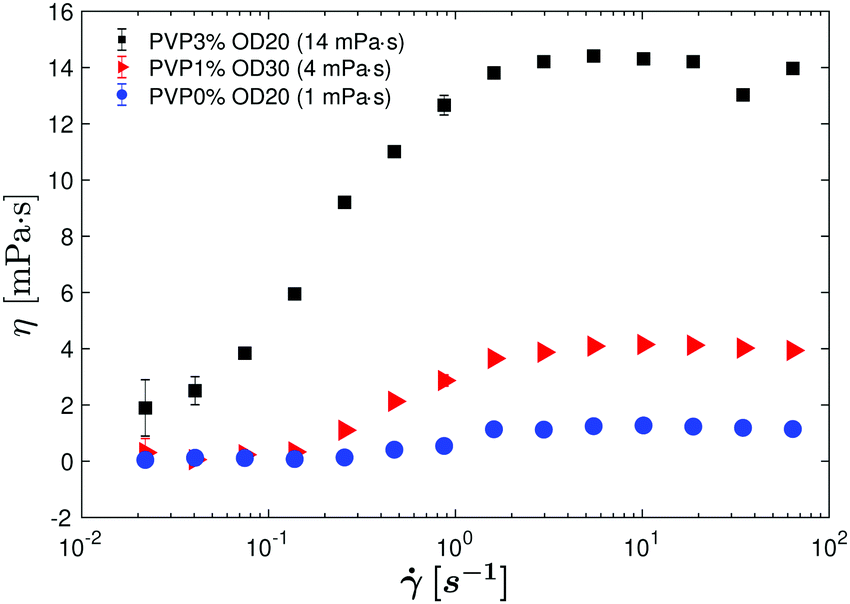 | ||
| Fig. 4 Effective viscosity η as a function of the shear rate for suspensions containing similar bacterial concentrations (OD = 20 to 30) but suspended in solutions of different viscosity. Squares: ηs = 16.7 mPa s. Triangles: ηs = 3.93 mPa s. Circles: 0.97 mPa s. | ||
We also observe that the curves shift to the left when ηs increases, indicating that the maximum shear rate at which the superfluidic regime can be maintained decreases as the solvent viscosity increases. As long as the E. coli in the suspension are still active, as pushers they continue to produce a net negative stresslet making the superfluidic regime possible. The increase in ambient viscosity results in a decline of overall bacterial activity, reducing both the average speed of the bacteria as well as its reorientation frequency. To demonstrate that the shift with ηs arises from a change in activity, we plot η vs curves by normalizing η by η∞ (the upper viscosity plateau reached at high shear rates) and by Dr (the rotational diffusion coefficient). By choosing this normalization, we observe that all the curves collapse on a master curve (Fig. 5).
 | ||
| Fig. 5 Normalized effective viscosity/_ as function of the Péclet number Pe = /Dr for various concentrations and background viscosities. Blue circles: (ηs = 1 mPa s, OD = 20). Red squares: (ηs = 4 mPa s, OD = 15). Red triangles: (ηs = 4 mPa s, OD = 30). Black circles: (ηs = 17 mPa s, OD = 20). Black diamonds: (ηs = 17 mPa s, OD = 25). The solid line is a fit using the Carreau–Yasuda equation (eqn (2)), and the dashed line indicates the value of the fitting parameter Pe* = 4.35. | ||
3.3 Characterizing bacterial superfluid rheograms with the Carreau–Yasuda equation
Non-Newtonian fluids for which the variation of viscosity with shear rate shows a power law domain bounded by two Newtonian plateaus are often modeled by a Carreau–Yasuda equation:38,39 | (2) |
 | (3) |
In López et al.,14 the Carreau equation (same as eqn (2) but with the fitting parameter a fixed at a value of 2) was used to fit suspensions swimming in motility medium (η ∼ 1) with the following parameters: n = −1, Pe* = 3.3, and a = 2 (fixed). When we applied the Carreau–Yasuda equation to fit the collapsed data shown in Fig. 5, we obtained comparable values: n = −1.05, Pe* = 4.35, and a = 1.67.
3.4 Constitutive model for effective bacterial-suspension viscosity
Having demonstrated that the Carreau–Yasuda equation is a good model for describing the rheology of our bacterial suspensions, we make use of our experimental data to further model the values of η0 and η∞. The purpose of this constitutive model is to capture the onset of the superfluidic regime for any given suspension, knowing only the solvent viscosity and bacterial concentration (OD).We first extract the viscosity values at the lowest and highest shear (lower and upper plateaus respectively) for each experimental run, and use piecewise functions to model these data (Fig. 6). Empirically, we establish the following functions for the two plateaus: η0 = ηs(1–0.99 min(OD/OD*, 1)), η∞ = ηs(1–0.2 min(OD/OD∞*, 1–0.0155 OD)). For both equations, the only input variables are the solvent viscosity ηs and the bacterial concentration OD, and by substituting the resulting two plateau values into the Carreau–Yasuda equation (eqn (3)), we obtain the estimated effective viscosity across a range of shear rates.
 | ||
| Fig. 6 Empirical model for Newtonian plateau values at low and high shear. Piecewise functions are used in the empirical model (dotted lines) to recover the viscosity values measured experimentally (solid circles) at (a) low shear (η0) and (b) high shear (η∞) for all bacterial concentrations (OD) tested. | ||
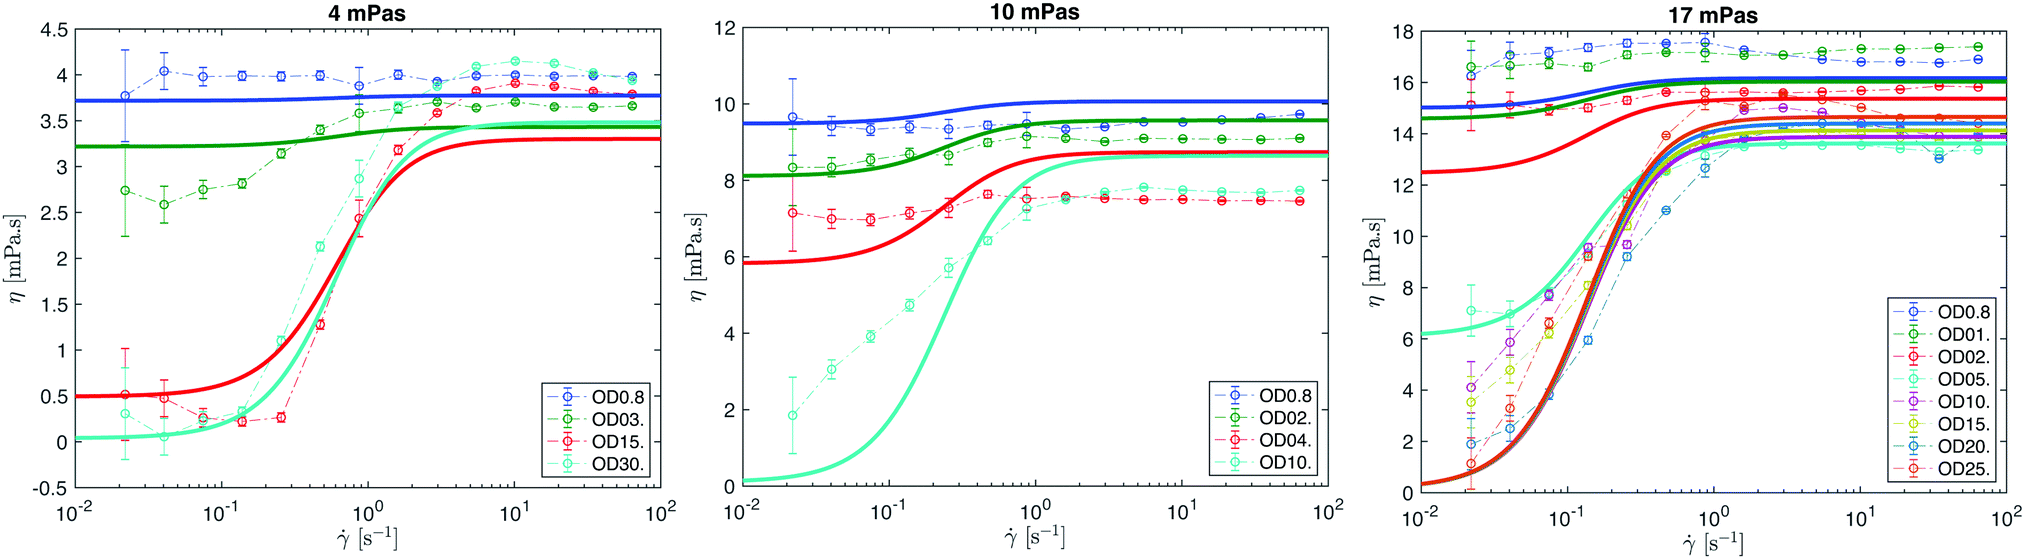 | ||
| Fig. 7 Effective viscosity η as a function of shear rate for different solvent viscosities (ηs = 4, 10 and 17 mPa s) and different bacterial concentrations (OD). The empirical model is overlaid as a solid line. | ||
For the lower plateau η0, we observe a linear decrease with increasing bacterial density (OD) up until the threshold concentration (OD*), at which the superfluidic regime is achieved. This linear decrease of effective viscosity at dilute volume fractions can in fact be predicted analytically, by accounting for the increasingly dominant negative active stress contributions as the volume fraction of pushers increases.21 We also observe that the threshold concentration (OD*) at which the superfluidic regimes can be achieved decreases with increased background viscosity.
For the upper plateau η∞, one would expect that those values would be close to the solvent viscosity ηs at all concentrations OD because high shear rates should effectively render the bacteria as passive particles. This is the behavior observed for the two lower-viscosity solvents (1 and 4 mPa s), but for the two higher-viscosity solvents (10 and 17 mPa s) we observe a drop in η∞ up to a concentration of OD∞* ≈ 5, and then an approximately constant η∞ at this lower value for higher bacterial concentrations. In previous work by Gachelin et al.,12 in which the effective viscosity of active suspensions were measured in microfluidic Y-channels, a maximum viscosity was measured at ∼ 20 s−1, which compares well with the shear rates at which we see slight peaks in our Couette rheometer experiments. The viscosities of the upper plateau η∞ in our study were estimated using measurements taken at Pe = 1600 (applied shear rate of 60 s−1), which is well beyond the reported applied shear at which a peak is expected. Furthermore, there was also no observed shift in the shear rate at which this maximum viscosity occurred across several different volume fractions (ODs) in the two studies in which the nonmonotonic viscosity at high shear rate was observed,12,14 so we believe the unexpected dependence of η∞ with bacterial density has other origins. While these effects are not yet fully understood and require further investigation, in all cases η∞ is much higher than η0, and thus the superfluidic behavior is unaffected.
The result of substituting the submodel for the two plateau values (η0 and ηs) into the Carreau–Yasuda equation is superposed on top of the experimental data for different solvent viscosities, ηs = 4, 10 and 17 mPa s, and different bacterial concentrations, OD (Fig. 7). To recover the applied shear rates in these rheograms for each solvent viscosity from the range of Péclet numbers used in the constitutive model, we substituted in the corresponding rotational diffusion coefficients (Table 1) previously calculated into the expression for Pe number (eqn (1)). The model does not fit the data quite as precisely as a tailored fit using values from individual experiments (Fig. 5), but our model succeeds in capturing the point at which superfluidic regimes are observed, and overall reproduces the rheogram across a wide range of conditions with only the background solvent viscosity and the bacterial concentration (OD) as input variables.
3.5 Measured stress
We can also visualize the superfluidic behavior of the bacterial suspensions by noting how measured stress (τ = η) changes with increasing Péclet number (Fig. 8). We observe two regimes. For Pe < 1, τ is constant, independent of the shear rate, and approximately equal to 0. For Pe > 1, τ is an increasing function of the shear rate. This behavior is observed only in suspensions at high OD (>10). At low OD and at low shear rate, the stress is τ = η0. Thus, under those conditions of low bacterial concentrations, the normalized stress can be expressed as τ/τ* = η0/η∞Pe, and a linear dependence of the normalized stress on the Péclet number is then expected, rather than the two-regime behavior observed at higher bacterial concentrations. This behavior supports earlier theoretical43 and constitutive models44 of the relationship between stress and shear rate in active suspensions.
 | ||
| Fig. 8 Normalized stress τ/τ*, where τ* = η∞Dr as function of the Péclet number Pe = /Dr Blue circles: (OD = 20, ηs = 1 mPa s). Blue triangles: (OD = 40, ηs = 1 mPa s). Red squares: (OD = 15, ηs = 4 mPa s). Red triangles: (OD = 30, ηs = 4 mPa s). Black circles: (OD = 20, ηs = 14 mPa s). Black diamonds: (OD = 25, ηs = 14 mPa s). | ||
4 Discussion
For bacterial concentrations corresponding to OD<10, we recover results reported in literature: swimming activity of a bacterial suspension can lower the effective viscosity.14 In this domain, the variation of the viscosity is well fitted by the Carreau–Yasuda equation, with a ≈ 1.67 and n ≈ −1. The viscosity shows a power-law domain at intermediate shear rates with η ∼ bounded by two Newtonian plateaus of viscosities η0 and η∞ reached at low and high shear rates, respectively.
The effective viscosity reduction is a function of the bacterial concentration in the suspended fluid. For OD > 10, the low-shear-rate portion of the rheograms levels to zero effective viscosity. Observations made under a microscope in a fluid at rest reveal collective motion of bacteria in this range of bacterial density. This concentration of bacteria needed for the onset of collective motion is consistent with those reported in literature,8,11 strongly suggesting that bioturbulence is the physical mechanism at the origin of the superfluidic behavior,14,15 also in viscous environments.
For bacterial concentrations corresponding to OD > 10, the transition between the regime dominated by the viscosity of the suspending fluid (at high shear rate) and a regime controlled by the swimming activity of the bacteria (at low shear rate) is fitted reasonably well by the Carreau–Yasuda equation with the following parameters: exponents a ≈ 1.67, n ≈ −1, viscosity of the lower plateau η0 = 0, and viscosity of the infinite-shear plateau η∞ ≈ ηs where ηs is the viscosity of the suspending fluid. In contrast to what is observed at small OD, the transition to the zero viscosity plateau is fairly sharp and not very well captured by a Carreau–Yasuda function, which assumes a smooth transition between the viscous active plateau and the power law domain. The transition between the two regimes occurs at Pec = c/Dr ∼ 1. The viscosity of the suspending fluid ηs affects the shear rate, c, at which the transition between the two plateaus occurs. An increase of ηs results in a decrease of c. Consequently, a lower shear rate should be applied to the suspension in order to observe the superfluidic regime. Despite these effects of viscosity, it has been possible to collapse all the rheograms reasonably well by normalizing the shear rate by Dr – the rotational diffusion coefficient of bacteria swimming in a fluid of viscosity ηs at rest.
5 Summary
Although additional experiments are needed to obtain a complete picture of the rheology of active fluids, our experiments fill a critical gap in the knowledge of the behavior of active suspensions in viscous environments. By changing the viscosity of the suspending fluid, we find that the transition to the superfluidic regime occurs below the critical Péclet number Pec =c/Dr ∼ 1, which depends on both the applied shear rate and the rotational diffusion coefficient Dr for the bacteria swimming in a quiescent fluid of viscosity ηs. After an initial near-zero viscosity plateau for Pe < 1, the effective viscosity of the fluid follows a power-law-fluid behavior for intermediate shear rates, until it reaches the upper plateau for Pe > 10, which is referred to as the infinite-shear viscosity (maximum viscosity of the fluid with bacteria). For solvent fluids with higher viscosities, the reduction in effective viscosity caused by collective behavior is more drastic (still achieving near-zero despite starting at a higher initial viscosity), but occurs for a more restricted window of shear rates. At these higher viscosities, the critical shear rate shifts to lower values, as adjusted by the correspondingly lower rotational diffusion coefficient due to decreased bacteria activity.
With this set of experiments, we provide experimental data that supports the use of the Carreau–Yasuda law for a reasonable representation of the behavior of bacterial suspensions capable of effective viscosity reduction when introduced to a viscous environment, for a wide range of bacterial concentrations. The constitutive model presented here does not provide as close a fit to the data as a full reparameterization of the Carreau–Yasuda equation for each individual experiment, but allows for a reasonable approximation of the expected superfluidic plateaus and critical shear rates for the wide range of parameters tested here, using only background viscosity and bacterial concentration as parameters. This is a first step towards modeling the rheology of active bacterial suspensions under complex flow conditions and environments, including its interplay with fluid-mechanical instabilities such as viscous fingering.
Conflicts of interest
There are no conflicts to declare.Acknowledgements
We thank Howard Berg (Harvard U.), Jeff Guasto (Tufts U.), Pietro de Anna (U. of Lausanne), Amir Pahlavan (Princeton U.), and Bauyrzhan Primkulov (MIT) for insightful discussions. We would especially like to thank Karen Fahrner (Harvard U.) for providing the bacterial strains and expertise on their growth and maintenance. RJ acknowledges support by the US Department of Energy (grant DE-SC0018357). RJ and HA acknowledge support from the MIT-France Seed Fund project titled ‘Impact of Bacterial Swimming on Viscous Fingering Dynamics’. HA and CD acknowledge support by public grants overseen by the French National Research Agency (ANR): (i) ANR Bacflow AAPG 2015 and (ii) from the ‘Laboratoire d'Excellence Physics Atom Light Mater’ (LabEx PALM) as part of the ‘Investissements d'Avenir’ program (reference: ANR-10-LABX-0039).References
- A. Bricard, J. B. Caussin, D. Das, C. Savoie, V. Chikkadi and K. Shitara, et al., Emergent vortices in populations of colloidal rollers, Nat. Commun., 2015, 6(1), 7470 CrossRef CAS PubMed.
- A. Sokolov and I. S. Aranson, Physical properties of collective motion in suspensions of bacteria, Phys. Rev. Lett., 2012, 109, 248109 CrossRef PubMed.
- J. C. Anderson, E. J. Clarke, A. P. Arkin and C. A. Voigt, Environmentally controlled invasion of cancer cells by engineered bacteria, J. Mol. Biol., 2006, 355(4), 619–627 CrossRef CAS PubMed.
- O. Felfoul, M. Mohammadi, S. Taherkhani, D. de Lanauze, Y. Zhong Xu and D. Loghin, et al., Magneto-aerotactic bacteria deliver drug-containing nanoliposomes to tumour hypoxic regions, Nat. Nanotechnol., 2016, 11(11), 941–947 CrossRef CAS PubMed.
- N. M. Oliveira, K. R. Foster and W. M. Durham, Single-cell twitching chemotaxis in developing biofilms, Proc. Natl. Acad. Sci. U. S. A., 2016, 113(23), 6532–6537 CrossRef CAS PubMed.
- X. L. Wu and A. Libchaber, Particle diffusion in a quasi-two-dimensional bacterial bath, Phys. Rev. Lett., 2000, 84(13), 3017–3020 CrossRef CAS PubMed.
- H. P. Zhang, A. Be'er, E. L. Florin and H. L. Swinney, Collective motion and density fluctuations in bacterial colonies, Proc. Natl. Acad. Sci. U. S. A., 2010, 107(31), 13626–13630 CrossRef CAS PubMed.
- S. Guo, D. Samanta, Y. Peng, X. Xu and X. Cheng, Symmetric shear banding and swarming vortices in bacterial superfluids, Proc. Natl. Acad. Sci. U. S. A., 2018, 115(28), 7212–7217 CrossRef CAS PubMed.
- E. Lushi, H. Wioland and R. E. Goldstein, Fluid flows created by swimming bacteria drive self-organization in confined suspensions, Proc. Natl. Acad. Sci. U. S. A., 2014, 111(27), 9733–9738 CrossRef CAS PubMed.
- A. A. Pahlavan and D. Saintillan, Instability regimes in flowing suspensions of swimming micro-organisms, Phys. Fluids, 2011, 23(1), 011901 CrossRef.
- A. Sokolov and I. S. Aranson, Reduction of viscosity in suspension of swimming bacteria, Phys. Rev. Lett., 2009, 103(14), 148101 CrossRef PubMed.
- J. Gachelin, G. Miño, H. Berthet, A. Lindner, A. Rousselet and E. Clément, Non-Newtonian viscosity of Escherichia coli suspensions, Phys. Rev. Lett., 2013, 110(26), 268103 CrossRef PubMed.
- A. G. McDonnell, T. C. Gopesh, J. Lo, M. O'Bryan, L. Y. Yeo and J. R. Friend, et al., Motility induced changes in viscosity of suspensions of swimming microbes in extensional flows, Soft Matter, 2015, 11(23), 4658–4668 RSC.
- H. M. López, J. Gachelin, C. Douarche, H. Auradou and E. Clément, Turning bacteria suspensions into superfluids, Phys. Rev. Lett., 2015, 115(2), 028301 CrossRef PubMed.
- V. A. Martinez, E. Clément, J. Arlt, C. Douarche, A. Dawson and J. Schwarz-Linek, et al., A combined rheometry and imaging study of viscosity reduction in bacterial suspensions, Proc. Natl. Acad. Sci. U. S. A., 2020, 117(5), 2326–2331 CrossRef CAS PubMed.
- Y. Hatwalne, S. Ramaswamy, M. Rao and R. Simha, Rheology of active-particle suspensions, Phys. Rev. Lett., 2004, 92(11), 118101 CrossRef PubMed.
- B. M. Haines, I. S. Aronson, L. Berlyand and D. A. Karpeev, Effective viscosity of dilute bacterial suspensions: a two-dimensional model, Phys. Biol., 2008, 5(4), 046003 CrossRef PubMed.
- D. T. N. Chen, A. W. C. Lau, L. A. Hough, M. F. Islam, M. Goulian and T. C. Lubensky, et al., Fluctuations and rheology in active bacterial suspensions, Phys. Rev. Lett., 2007, 99(14), 148302 CrossRef CAS PubMed.
- M. C. Marchetti, J. F. Joanny, S. Ramaswamy, T. B. Liverpool, J. Prost and M. Rao, et al., Hydrodynamics of soft active matter, Rev. Mod. Phys., 2013, 85(3), 1143–1189 CrossRef CAS.
- Z. Liu, K. Zhang and X. Cheng, Rheology of bacterial suspensions under confinement, Rheol. Acta, 2019, 58(8), 439–451 CrossRef CAS.
- D. Saintillan, The dilute rheology of swimming suspensions: A simple kinetic model, Exp. Mech., 2010, 50(9), 1275–1281 CrossRef.
- D. Saintillan and M. J. Shelley, Instabilities and pattern formation in active particle suspensions: Kinetic theory and continuum simulations, Phys. Rev. Lett., 2008, 100(17), 1–4 CrossRef PubMed.
- D. Saintillan and M. J. Shelley, Instabilities, pattern formation, and mixing in active suspensions, Phys. Fluids, 2008, 20(12), 123304 CrossRef.
- D. L. Koch and G. Subramanian, Collective hydrodynamics of swimming microorganisms: Living fluids, Annu. Rev. Fluid Mech., 2011, 43, 637–659 CrossRef.
- D. Saintillan, Rheology of active fluids, Annu. Rev. Fluid Mech., 2018, 50(1), 563–592 CrossRef.
- K. Drescher, J. Dunkel, L. H. Cisneros, S. Ganguly and R. E. Goldstein, Fluid dynamics and noise in bacterial cell-cell and cell-surface scattering, Proc. Natl. Acad. Sci. U. S. A., 2011, 108(27), 10940–10945 CrossRef CAS.
- G. Subramanian and D. L. Koch, Critical bacterial concentration for the onset of collective swimming, J. Fluid Mech., 2009, 632, 359–400 CrossRef.
- A. Baskaran and M. C. Marchetti, Statistical mechanics and hydrodynamics of bacterial suspensions, Proc. Natl. Acad. Sci. U. S. A., 2009, 106(37), 15567–15572 CrossRef CAS.
- H. C. Berg and L. Turner, Movement of microorganisms in viscous environments, Nature, 1979, 278(5702), 349–351 CrossRef CAS.
- W. R. Schneider and R. N. Doetsch, Effect of viscosity on bacterial motility, J. Bacteriol., 1974, 117(2), 696–701 CrossRef CAS.
- V. A. Martinez, J. Schwarz-Linek, M. Reufer, L. G. Wilson, A. N. Morozov and W. C. K. Poon, Flagellated bacterial motility in polymer solutions, Proc. Natl. Acad. Sci. U. S. A., 2014, 111(50), 17771–17776 CrossRef CAS PubMed.
- J. Y. Tinevez, N. Perry, J. Schindelin, G. M. Hoopes, G. D. Reynolds and E. Laplantine, et al., TrackMate: An open and extensible platform for single-particle tracking, Methods, 2017, 115, 80–90 CrossRef CAS PubMed.
- J. Schindelin, I. Arganda-Carreras, E. Frise, V. Kaynig, M. Longair and T. Pietzsch, et al., Fiji: an open-source platform for biological-image analysis, Nat. Methods, 2012, 9(7), 676–682 CrossRef CAS.
- J. Saragosti, P. Silberzan and A. Buguin, Modeling E. coli tumbles by rotational diffusion. Implications for chemotaxis, PLoS One, 2012, 7(4), e35412 CrossRef CAS PubMed.
- G. B. Jeffery, The motion of ellipsoidal particles immersed in a viscous fluid, Proc. R. Soc. A, 1922, 102(715), 161–179 Search PubMed.
- S. C. Takatori and J. F. Brady, Superfluid behavior of active suspensions from diffusive stretching, Phys. Rev. Lett., 2017, 118, 018003 CrossRef CAS PubMed.
- S. Nambiar, P. R. Nott and G. Subramanian, Stress relaxation in a dilute bacterial suspension, J. Fluid Mech., 2017, 812, 41–64 CrossRef.
- K. Yasuda, R. C. Armstrong and R. E. Cohen, Shear flow properties of concentrated solutions of linear and star branched polystyrenes, Rheol. Acta, 1981, 20(2), 163–178 CrossRef CAS.
- C. W. Macosko, Rheology Principles, Measurements, and Applications, Wiley-VCH, New York, 1994 Search PubMed.
- I. Lashgari, J. O. Pralits, F. Giannetti and L. Brandt, First instability of the flow of shear-thinning and shear-thickening fluids past a circular cylinder, J. Fluid Mech., 2012, 701, 201–227 CrossRef.
- J. Boyd, J. M. Buick and S. Green, Analysis of the Casson and Carreau-Yasuda non-Newtonian blood models in steady and oscillatory flows using the lattice Boltzmann method, Phys. Fluids, 2007, 19(9), 093103 CrossRef.
- J. C. Weddell, J. H. Kwack, P. I. Imoukhuede and A. Masud, Hemodynamic analysis in an idealized artery tree: Differences in wall shear stress between Newtonian and non-Newtonian blood models, PLoS One, 2015, 10(4), 0124575 CrossRef.
- M. E. Cates, S. M. Fielding, D. Marenduzzo, E. Orlandini and J. M. Yeomans, Shearing active gels close to the isotropic-nematic transition, Phys. Rev. Lett., 2008, 101, 068102 CrossRef CAS PubMed.
- L. Giomi, T. B. Liverpool and M. C. Marchetti, Sheared active fluids: Thickening, thinning, and vanishing viscosity, Phys. Rev. E: Stat., Nonlinear, Soft Matter Phys., 2010, 81(5), 051908 CrossRef PubMed.
Footnote |
| † Electronic supplementary information (ESI) available. See DOI: 10.1039/d1sm00243k |
| This journal is © The Royal Society of Chemistry 2021 |