Air mediates the impact of a compliant hemisphere on a rigid smooth surface†
Siqi
Zheng
 a,
Sam
Dillavou‡
b and
John M.
Kolinski
 *a
*a
aThe Institute of Mechanical Engineering, École Polytechnique Fédérale de Lausanne, 1015 Lausanne, Switzerland. E-mail: john.kolinski@epfl.ch
bDepartment of Physics, Harvard University, Cambridge, Massachusetts 02138, USA
First published on 11th March 2021
Abstract
Fleeting contact between solids immersed in a fluid medium governs the response of critically important materials, from coffee to soil. Rapid impact of soft solids occurs in systems as diverse as car tires, soft robotic locomotion and suspensions, including soil and coffee. In each of these systems, the dynamics are fundamentally altered by the presence of a fluid layer mediating solid contact. However, observing this class of interactions directly is challenging, as the relevant time and length scales are extremely small. Here we directly image the interface between a soft elastic hemisphere and a flat rigid substrate during rapid impact over a wide range of impact velocities V at high temporal and spatial resolution using the Virtual Frame Technique (VFT). In each experiment, a pocket of air is trapped in a dimple between the impactor and the substrate, preventing direct solid–solid contact at the apex of the hemisphere. Thus, unlike the quasi-static Hertzian solution where contact forms in an ellipse, in each rapid air-mediated impact, contact forms in an annular region which rapidly grows both inward toward the impact axis, and rapidly outward away from the impact axis. We find that the radius of initial contact varies non-monotonically with V, indicating a transition between elastically dominated dynamics to inertially dominated dynamics. Furthermore, we find that for slower impact speeds, where the outer contact front cannot outpace the Rayleigh velocity, contact expands in a patchy manner, indicating an elasto-lubricative instability. These behaviors, observed using the VFT, occur in regimes relevant to a wide variety of soft systems, and might modulate frictional properties during contact. The size of the air pocket varies with V and impactor stiffness. Our measurements reveal an unanticipated, sudden transition of the air pocket's size as V increases beyond 1 m s−1 and multiple modes of air entrainment at the advancing solid–solid contact front that depend on the front's velocity.
1 Introduction
Solids immersed in a fluid play an essential role in many phenomena in our daily lives, from coffee extraction to the friction of our tires on a wet road. Furthermore, ongoing developments in the field of soft robotics establish the broad applicability of solid–solid contact between materials that undergo substantial deformation.1 Universally, these interactions are fleeting, and their mechanics are critically governed by the intervening fluid via lubrication stresses that can deform the solid. Despite the ubiquity and technological relevance of such interactions, our understanding of their mechanics remains strikingly limited, due in part to their complexity, and in part to the challenges of observing these phenomena at the diminutive time and length scales attained during impact. Indeed, in classical treatments the intervening fluid is often ignored entirely to avoid this complexity.2–4More recent theoretical treatments of impact include fluid–particle interaction, but are conducted in the slow-impact limit, that is, where the material's sound speed vastly exceeds the impact velocity.5,6 Even in this regime, the stress in the fluid plays a vital role, causing the morphology of the solid body to undergo dramatic changes in concavity, which in turn substantially modifies the real area of contact. Experimental data on the dynamics of close contact is likewise limited to relatively slow approach velocities and small solid deformation,7 or alternatively focused on whether rebound will occur, without direct observation of the interface during the collision.5,8,9 The recent direct measurements of a soft hemisphere colliding with a rigid substrate using the Virtual Frame Technique (VFT)10 indicate the presence of novel behaviors during rapid impact; the large deformations observed are qualitatively reminiscent of the dimple that forms beneath an impacting liquid droplet.11–13 The large deformation of soft materials and their low sound speeds break fundamental assumptions of existing calculations and move beyond the scope of existing experimental work; experiments that fully explore impact phenomenology with large deformations and low material sound speeds are required to advance our understanding of solid–solid contact.
Here, we probe the solid–fluid–solid interaction in the initial moments of impact of a soft solid at high velocity. Using a microscope and frustrated TIR12,14 in tandem with the virtual frame technique (VFT),10 we directly observe the solid–solid contact region between a compliant hemispherical elastomer and a rigid smooth glass surface in air. Imaging is performed for the first several hundred microseconds after impact, at rates exceeding 25 MHz. For all impact velocities (V < 0.1 to V > 5 m s−1) the initial contact between the impactor and the glass surface forms in the shape of an annular ring, and the impactor entrains air in a central dimple, whose lateral extent depends on the impactor's elastic modulus and V. This ring then expands both outward and inward, and we observe two distinct modalities of contact front advancement. Contact fronts moving faster than the Rayleigh velocity cR§ of the elastomer result in smooth contact, uninterrupted by air. Slower expansion, by contrast, instead creates patchy contact, and small pockets of air remain trapped as the contact front expands over a sub-micron-scale air layer.15 Both modes of contact advancement can be observed in a single impact event, wherein the front undergoes a striking transition from smooth to patchy expansion accompanied by air entrainment.
2 Experimental methods and results
Rapid impacts are initiated by launching a compliant impactor into a flat glass prism using a pneumatic cannon, as shown in Fig. 1(a).¶ The impactor's tip is hemispherical with a radius R = 7.1 mm. Two types of Zhermack Brand duplication silicone are used to directly probe the role of elasticity in rapid impact: either ‘Elite Double 8’ (E = 250 kPa, ‘soft,’ cR = 7.9 m s−1), or ‘Elite Double 32’ (E = 1.1 MPa, ‘hard,’ cR = 16.6 m s−1). Impact velocity V is measured by filming the impactor with a fast camera from the side.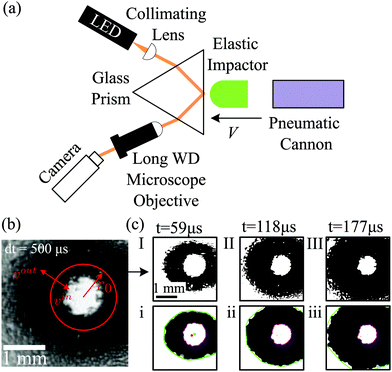 | ||
| Fig. 1 Experimental set-up and imaging methodology. (a) A hemispherical elastic impactor is launched toward a flat glass prism. Collimated and pulsed light emitted from the LED totally internally reflects from the impact surface, and is then captured by the camera's imaging sensor. Contact appears black in the resulting image. (b) A single blurred image, the ‘compressed frame stack’ (CFS), is recorded during the LED pulse. More CFS images of elastic impactor at different impact velocities are included in the ESI.† The instantaneous position of the advancing contact front is determined from the CFS using the VFT;10 here, intensity encodes the temporal dynamics. (c) Examples of virtual frames are extracted from the CFS in (b) at time t = 59 μs, 118 μs and 177 μs after the first instant of contact show the principle of the VFT for the two contact fronts. The outer (green) and inner (purple) fronts are determined from the virtual frames using a series of morphological operations. | ||
The prism's surface near the impact area is uniformly illuminated from below over an area of (9 mm2) using a collimated, pulsed white LED light source (400–700 nm) at a glancing incidence angle. The light pulse totally internally reflects from the prism's surface, and is imaged onto the camera's imaging sensor (Hamamatsu ORCA-Flash 4.0 V3, 16-bit grayscale) using a long-working distance microscope objective (Mitutoyo 5×). The Scheimpflug principle16 ensures that the entire field of view is in focus despite the large incidence angle. Contact between the impactor and the prism disrupts the reflection of light, resulting in a dark region in the captured images. The short exposure time τ = 250–750 μs is achieved with a square current pulse applied to the LED, serving as an electronic shutter. Light emission is triggered when the impactor crosses a photogate immediately above the impact area.
The dynamics of impact occur over diminutive lengthscales and fleeting timescales, and their characterization thus requires a high-speed, high-resolution imaging modality. To estimate the required length- and time-scales during impact, we evaluate the lateral scale of contact, given by  , where Δt is the time elapsed since the impactor first deforms near the surface. With a 1 mm × 1 mm field of view and V = 1 m s−1, the impactor completely covers the field of view about 150 microseconds. Conventional high-speed imaging modalities impose a trade-off between field of view and imaging rate that makes these experiments otherwise impossible to carry out; in order to acquire our data, we require the novel Virtual Frame Technique (VFT).10 During impact, a single exposure of the contact plane is recorded, resulting in a blurred image called the compressed frame stack (CFS), as shown in Fig. 1(b). Due to the binary nature of the optical configuration (contact/no contact) and the monotonicity of the dynamics during initial impact (contact grows but does not shrink), the grayscale of the CFS encodes the time the contact front passed a given pixel in the image. During rapid impact, we obtain almost perfect contrast between the regions where the impactor is in contact with the surface, and where it is not; thus, the dynamics are instantaneously binary. Furthermore, we deliberately limit the exposure time to ensure that the impactor is not rebounding from the surface during the experiment; this ensures that the dynamics are monotonic in time, and that once the impactor contacts the surface, it does not break contact until after the CFS acquisition is complete. As a result, the CFS may be deconvolved into instantaneous snapshots known as virtual frames. The virtual frame at a desired time t is extracted by thresholding the CFS at a value I0(t) given by
 | (1) |
3 Analysis of contact front dynamics and contact initiation
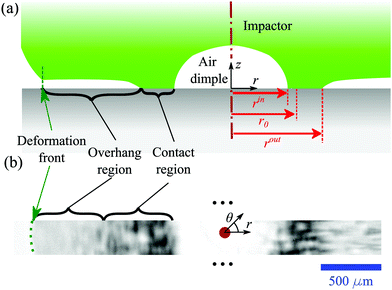
In each experiment, the impact dynamics exhibit a common feature: air squeezed between the two approaching solids deforms the center of the impactor, forming an air dimple, and causing contact to initiate in the shape of a ring. This air dimple prevents contact at the center of the impactor as shown in Fig. 1(b and c), in striking contrast with quasi-static compression using the same system, where the solid material makes contact at the center first.2,3 These dynamics however mirror behavior seen in rapid liquid droplet impact.11–13,17 The two contact fronts formed by the boundary of this ring then spread both inwards and outwards as time advances.Tracking these inward- and outward-moving contact fronts can be complicated by the patchy nature of contact.** To recover the advancing front position, morphological operations using image processing software18 are applied to each virtual frame to create a single, coherent inner and outer contact front, as shown in Fig. 1(c). While the fronts are often more patchy than a simple expanding circle, fluctuations in radius are small compared to the overall movement.
The initial radius of the contact ring r0 varies strongly with V.†† In the quasi-static limit V = 0 and r0 = 0;2–4 this is confirmed with a CFS image of the impactor's contact at V = 1 mm s−1, shown in the ESI.† For slow V < 1 m s−1 impacts, the lateral scale of the dimple is approximately twice as large for the soft impactor, as shown in Fig. 2(a). In this regime, r0 rapidly grows with V for both materials. For the fastest impacts V > 1 m s−1 however, r0 decreases slightly with V. As a result, a clear peak in the air pocket scale r0 emerges for the soft impactor at V ∼ 1 m s−1. The maximum in r0 for the hard impactor is less pronounced, but occurs at a similar V, as seen in Fig. 2(b).
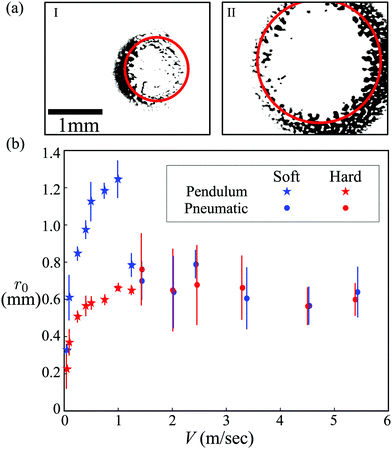 | ||
| Fig. 2 Advancing front dynamics and contact initiation. (a) The virtual frame for the hard (I) and soft (II) elastomer with the impact velocity at V = 0.5 m s−1. The median initial contact ring radius r0 is indicated by the red circle. Note that initial contact is not always perfectly centered around the impact axis due to small-scale misalignment of the impactor. (b) The median initial contact ring radius r0 is plotted as a function of the impact velocity V for the two elastomer materials tested. While the contact ring radius is nearly identical for the two materials at high impact velocities, the softer material initiates contact at a much larger radius for low impact velocities. Inset: The same data are shown on a log–log scale. A comparison of the data with theoretical predictions for the lateral scale arising from a balance of lubrication pressure with elastic stresses (∼V1/5) or impactor inertia (∼V−1/4), including prefactors determined from the experimental parameters, is provided in the Section 4.2, and plotted on a log–log scale in Fig. 6. | ||
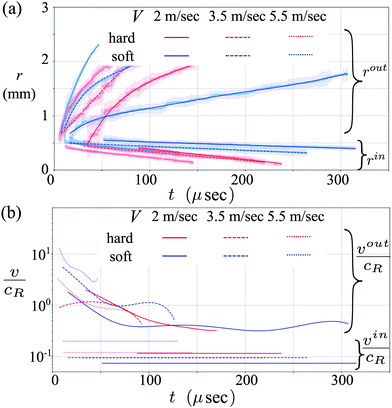
After the initial ring is established, the outward contact front expands, but does not strictly follow the expected  -scaling anticipated from the impactor's geometry. Notably, the contact front velocities are distinct for the hard and soft impactors; this behavior highlights the important interplay between the elasticity of the impactor and the lubrication pressure in the air. At low V the outer-moving contact front velocity vout of the rigid impactor markedly exceeds vout of the softer impactor; however, at large V, this trend is reversed, as shown in Fig. 3(a). Inward moving fronts for both impactors are far slower than their outer-moving counterparts, typically closing with velocity vin ∝ cR/10, as can be seen in Fig. 3(b).
For the soft impactor at low V, a significant ‘overhang’ leads the contact front. The overhang feature leads the outward-moving contact front, but trails behind the deformation front. We call this feature an overhang because the impactor material in this region skates over the glass surface of the prism upon a thin film of air. The air prevents contact between the impactor and the prism, similar to the dynamics beneath an impacting liquid droplet.12 These dynamics, recorded here with the VFT, are independently observed by direct imaging with a high-speed camera, as shown in the ESI.† Such a feature appears as an intermediate intensity in an instantaneous image, and is thus convolved with the temporal evolution of the contact front in the CFS; in order to disambiguate the overhang feature from the contact front, we image a thin strip of material at high acquisition rates using high-speed FTIR microscopy recorded with a conventional high-speed camera. The deformation front observed with the high-speed camera expands as  , as expected from the geometry. A section-view schematic is depicted with an instantaneous snapshot in Fig. 4. The FTIR gray scale signal introduces the error indicated in Fig. 3a. While the error in the contact front measurement is small, the size of the overhang region is not, and this leads to a measurable discrepancy between the predicted front position due to the impactor's geometry, and the measured rout. This discrepancy is most pronounced for low-V impacts with the soft elastomer material. Details of the error in the measured rout due to the FTIR gray scale corresponding to the overhang are provided in the ESI.†
The impactor's geometry ensures that vout always decreases in time. For experiments where vout/cR > 1 in the initial stages of the impact, we observe a critical transition in the air entrainment dynamics, depicted schematically in Fig. 5(a). For vout/cR > 1, Rayleigh waves cannot outrun the contact front, and thus the deformation from impact cannot be felt prior to the arrival of the contact front. As a result, contact grows smoothly with no apparent air entrainment. For vout < cR, Rayleigh waves propagate ahead of the contact front, destabilizing the air–solid interface, and enhancing air entrainment. This transition can be seen in the contact morphology; outside of the critical radius r*, where vout/cR = 1, contact abruptly becomes patchy, as shown in Fig. 5(b). At larger V, r* increases the transitional radius occurs at larger r, consistent with the hypothesis that this transition is governed by cR, and not by other factors such as the geometry of the impactor.
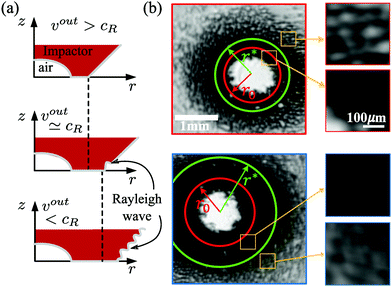 | ||
| Fig. 5 Air entrainment at the contact front. (a) A schematic illustration of the impact dynamics for three stages of impact: vout > cR (top), vout ∼ cR (middle) and vout < cR (bottom). Only in the final scenario can Rayleigh waves outrun the contact front and propagate along the free surface of the indenter; in this case, the contact front destabilizes, and air entrainment is enhanced. (b) Compressed frame stacks for the soft elastomer with impact velocities at v = 2 m s−1 (outlined in red) and at v = 2.5 m s−1 (outlined in blue). The radial location where vout = cR first time is indicated by the green circle. For vout/cR > 1, between the dimple and the green circle, the contact front progresses smoothly, with no apparent air entrainment. For vout/cR < 1, outside of the green circle, significantly more air is entrained in small pockets as the contact front progresses along the surface. These dynamics are also clearly visible in individual radial traces, as shown in the ESI.† | ||
4 Scaling analysis of lubricated elastic impacts
Many of these observations we report here challenge existing theory; however, scaling analysis can provide some insight into the non-monotonic trend of the dimple scale r0 with impact velocity V.4.1 Elastic-lubrication stress balance at low V
At low velocities, inertia is negligible. Lubrication (fluid pressure) stress in the fluid pL increasingly resists the impactor's motion as the vertical gap size z decreases. Along the central axis at r = 0, this stress is given by , where μ is the dynamic viscosity of the air, and R is the radius of the impactor. This lubrication stress consequently deforms the impactor, and the axial elastic stress scales with axial deformation d as
  , where θ = (1 − ν2)/E is an inverse elastic modulus. Here, ν is the Poisson's ratio and E is the Young's modulus. Balancing the pressure scales and assuming the length scales from lubrication and elasticity are similar, such that pL ∼ pE and d ∼ z, we find an axial scale:
  . From Taking into account the impactor's spherical geometry, we can relate the axial scale to this corresponds to a lateral scale
  ; upon substituting the expression for z0, we obtain:
 | (2) |
We find that the scaling of ![[small script l]](https://www.rsc.org/images/entities/char_e146.gif) E is consistent with our data for r0 for over a decade of V ≤ 1 m s−1. Furthermore, the trend with elastic modulus is consistent with our observations, because where r0 for the soft impactor exceeds r0 for the hard impactor over all V in this range, as shown in Fig. 6 however,
E is consistent with our data for r0 for over a decade of V ≤ 1 m s−1. Furthermore, the trend with elastic modulus is consistent with our observations, because where r0 for the soft impactor exceeds r0 for the hard impactor over all V in this range, as shown in Fig. 6 however, ![[small script l]](https://www.rsc.org/images/entities/char_e146.gif) E however always under-predicts r0, warranting further detailed analysis beyond the scaling argument presented here. A comparison of
E however always under-predicts r0, warranting further detailed analysis beyond the scaling argument presented here. A comparison of ![[small script l]](https://www.rsc.org/images/entities/char_e146.gif) E with data is included in the ESI.† Notably, this scaling deviates significantly from that of an impacting liquid droplet whose dynamics are governed by a balance of surface-tension and gas lubrication, resulting in
E with data is included in the ESI.† Notably, this scaling deviates significantly from that of an impacting liquid droplet whose dynamics are governed by a balance of surface-tension and gas lubrication, resulting in ![[small script l]](https://www.rsc.org/images/entities/char_e146.gif) liquid ∝ V1/2.13
liquid ∝ V1/2.13
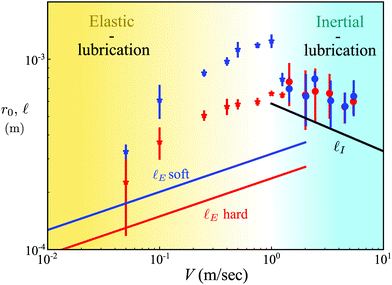 | ||
Fig. 6
r
0(V) is shown along with the calculated lateral scale ![[small script l]](https://www.rsc.org/images/entities/char_e146.gif) in both the elastic and inertial regime. Data for the soft impactor are shown in blue points while the data for the hard impactor are shown in red points; symbols indicate the means of impact as described in the legend of Fig. 2. Calculated in both the elastic and inertial regime. Data for the soft impactor are shown in blue points while the data for the hard impactor are shown in red points; symbols indicate the means of impact as described in the legend of Fig. 2. Calculated ![[small script l]](https://www.rsc.org/images/entities/char_e146.gif) for the elastic (blue and red lines) and inertial (black line) regimes are plotted and labelled accordingly. The scaling regimes are illustrated using the background color – yellow corresponds to the elastic-lubrication stress balance, whereas cyan corresponds to the inertial-lubrication stress balance. for the elastic (blue and red lines) and inertial (black line) regimes are plotted and labelled accordingly. The scaling regimes are illustrated using the background color – yellow corresponds to the elastic-lubrication stress balance, whereas cyan corresponds to the inertial-lubrication stress balance. | ||
4.2 Inertial-lubrication stress balance at large V
At large V, the solid impactor's behavior is governed by inertia. As a result, r0 is independent of impactor stiffness softness in this regime, as shown by the overlapping curves in Fig. 6 above V ≈ 1.5 m s−1. Balancing inertial pressure pI = ρV2/2 where ρ is the density of the elastomer, with lubrication pressure , stress yields a lateral scale
 | (3) |
5 Discussion and conclusions
We have shown that the dynamics of impact for soft elastomers impacting on a rigid substrate are surprisingly rich. Unlike the quasi-static or no-fluid approximations, we observe a consistent air pocket feature in all impacts. The existence of this central dimple was predicted in numerical calculations,5,6 albeit at lesser values of the Stokes number St,‡‡ where inertial effects can be ignored. As impact velocity increases beyond this regime, we in fact observe a non-monotonic trend in the lateral scale of the air this dimple, indicating a previously unexplored transition in the dynamics. Finally, we observe a second unanticipated transition between smooth and patchy contact formation expansion associated with the deceleration of the expanding contact front below the Rayleigh velocity.Several of the features we have identified in this work bear strong resemblance to the phenomena uncovered in studies of droplet impact,12,13 particularly for viscous droplets;19 here, however, the impactor is elastic – and thus has a reference configuration that fundamentally alters the impact dynamics and observed interfacial instability. Any stress that accumulates in the solid arises due to deformation from the reference state, not solely from shear rate, as occurs in liquid droplet impact. Further differentiation between elastomer impact and droplet impact can be seen from the sensitivity to the material's sound speed, as identified in several of the observed impact phenomenology. While the air film formation and destabilization dynamics appear similar to those observed beneath liquid droplets, they are very different – for example, the scaling for the growth of r0 with V shown in Fig. 2 depends only on the elastic modulus of the solid, and not surface tension.
The optimum of r0(V) observed in the experimental data coincides with the cross-over of the lateral scales ![[small script l]](https://www.rsc.org/images/entities/char_e146.gif) E and
E and ![[small script l]](https://www.rsc.org/images/entities/char_e146.gif) I, as shown in Fig. 6. The pronounced maximum for the soft impactor cannot be accounted for by the scaling analysis; this large decrease in r0 coincides with V/cR = 0.1, and (V/cR)1/5 approaches 1 at V = 0.79 m s−1 for the soft impactor, suggesting that finite sound speed effects could play a role in large-V impacts. For the hard impactor, this ratio is achieved at V = 1.6 m s−1, when the inertial pressure is already dominant; thus the pronounced maximum is not present for the hard impactor.
I, as shown in Fig. 6. The pronounced maximum for the soft impactor cannot be accounted for by the scaling analysis; this large decrease in r0 coincides with V/cR = 0.1, and (V/cR)1/5 approaches 1 at V = 0.79 m s−1 for the soft impactor, suggesting that finite sound speed effects could play a role in large-V impacts. For the hard impactor, this ratio is achieved at V = 1.6 m s−1, when the inertial pressure is already dominant; thus the pronounced maximum is not present for the hard impactor.
After contact is initiated, how do sub-Rayleigh contact fronts generate a plethora of smaller bubble features during patchy contact formation? In this regime, the elastomer is in fact deforming and skating outward on a thin film of air, as shown in Fig. 4 in detail in the ESI.† In this modality, it is unclear how the solid initiates contact with the glass. The high impact stresses may compresses the air vertically until it has near zero volume, or instead squeeze the gas laterally outward and out of the way. The patchy nature of contact advancement suggests an instability that merits further exploration.
With each of our observations, a consistent, unexplored pattern of sensitivity to the Rayleigh velocity of the material emerges. As soft materials are finding increasing applicability in robotics,1,20 these effects may become relevant, particularly for tasks where robotic systems must rapidly form contact with their surroundings, such as locomotion through complex environments. Given the dramatic effect of impact velocity on the contact area, frictional grip and stability could even be modulated by altering the rate at which a ‘foot’ initiates contact with a surface, leading to modified control strategies for locomotion.
The deformation of elastic solids during contact through an intervening fluid occurs in many systems, including dense suspensions such as saturated soil and brewing coffee. Depending on the flow configuration of interest, our observations can be relevant to these systems, provided the elasticity parameter matches; given the size difference between our impactors and coffee grounds or soil particles, it is likely that the velocity of the flow in the dense suspension should be much higher to correspond to the impact events studied here.
Conflicts of interest
There are no conflicts to declare.Acknowledgements
We thank Shreyas Mandre for helpful discussions.Notes and references
- G. M. Whitesides, Angew. Chem., Int. Ed., 2018, 57, 4258–4273 CrossRef CAS PubMed.
- H. Hertz, J. Reine Angew. Math., 1881, 5, 12–23 Search PubMed.
- J. A. Greenwood and K. L. Johnson, Philos. Mag. A, 1981, 43, 697–711 CrossRef CAS.
- K. L. Johnson, Contact Mechanics, Cambridge University Press, Cambridge, UK, 1985 Search PubMed.
- G. Barnocky and R. H. Davis, J. Fluid Mech., 1989, 209, 501–519 CrossRef CAS.
- N. J. Balmforth, C. J. Cawthorn and R. V. Craster, J. Fluid Mech., 2010, 646, 339–361 CrossRef.
- E. Verneuil, B. Ladoux, A. Buguin and P. Silberzan, J. Adhes., 2007, 83, 449–472 CrossRef CAS.
- G. Joseph, R. Zenit, M. Hunt and A. Rosenwinkel, J. Fluid Mech., 2001, 433, 329–346 CrossRef CAS.
- P. Gondret, M. Lance and L. Petit, Phys. Fluids, 2002, 14, 643–652 CrossRef CAS.
- S. Dillavou, S. M. Rubinstein and J. M. Kolinski, Opt. Express, 2019, 27, 8112–8120 CrossRef CAS PubMed.
- S. T. Thoroddsen, T. G. Etoh, K. Takehara, N. Ootsuka and Y. Hatsuki, J. Fluid Mech., 2005, 545, 203–212 CrossRef CAS.
- J. M. Kolinski, S. M. Rubinstein, S. Mandre, M. P. Brenner, D. A. Weitz and L. Mahadevan, Phys. Rev. Lett., 2012, 108, 074503 CrossRef PubMed.
- W. Bouwhuis, R. C. A. van der Veen, T. Tran, D. L. Keij, K. G. Winkels, I. R. Peters, D. van der Meer, C. Sun, J. H. Snoeijer and D. Lohse, Phys. Rev. Lett., 2012, 109, 264501 CrossRef PubMed.
- S. M. Rubinstein, G. Cohen and J. Fineberg, Nature, 2004, 430, 1005–1009 CrossRef CAS PubMed.
- See ESI† at [URL will be inserted by publisher] for measurement method of r0, air entrainment at the advancing contact front and comparison of r0 with the theoretical predictions of
![[small script l]](https://www.rsc.org/images/entities/char_e146.gif) .
. - T. Scheimpflug, Improved Method and Apparatus for the Systematic Alteration or Distortion of Plane Pictures and Images by Means of Lenses and Mirrors for Photography and for other purposes, US Pat., 751347, 1904 Search PubMed.
- S. T. Thoroddsen, M.-J. Thoraval, K. Takehara and T. G. Etoh, Phys. Rev. Lett., 2011, 106, 034501 CrossRef CAS PubMed.
- S. van der Walt, J. L. Schönberger, J. Nunez-Iglesias, F. Boulogne, J. D. Warner, N. Yager, E. Gouillart and T. Yu, The Scikit-image Contributors, PeerJ, 2014, 2, e453 CrossRef PubMed.
- K. Langley, E. Li and S. T. Thoroddsen, J. Fluid Mech., 2017, 813, 647–666 CrossRef CAS.
- J. Paik, Nat. Rev. Mater., 2018, 3, 81–83 CrossRef.
Footnotes |
| † Electronic supplementary information (ESI) available. See DOI: 10.1039/d0sm02163f |
| ‡ Present address: Department of Physics and Astronomy, Philadelphia, PA 19104, USA. |
§ Rayleigh velocity CR ≃ 0.95cS, where the shear velocity  . . |
| ¶ At lower impact velocity, a pendulum is used to control the alignment during impact. |
| || To compensate for variation in the background illumination, is compensated for by dividing the CFS is normalized by an image of the impact surface experiment prior to contact, and setting a = 1. |
| ** The texture of the contact area arises from the dynamics, and is not intrinsic to the impactor's surface, as can be readily observed in the profilometry image in the ESI.† |
| †† r0 is measured from the distribution of the earliest contact patches as described in the ESI.† |
| ‡‡ St = mV/6πμR2, where m = 10 g is the mass of the impactor, V is the impact velocity, μ is the dynamic viscosity of the air and R = 7.1 mm is the radius of the impactor. |
| This journal is © The Royal Society of Chemistry 2021 |

