 Open Access Article
Creative Commons Attribution 3.0 Unported Licence
Static and dynamic features of granular material failure due to upward pulling of a buried sphere by a slowly increasing force†
Payman
Jalali
 *ab,
Yuchen
Zhao
 b and
Joshua E. S.
Socolar
b
aSchool of Energy Systems, 53851 Lappeenranta-Lahti University of Technology, Lappeenranta, Finland. E-mail: pjalali@lut.fi
bDepartment of Physics, Duke University, Durham, NC 27708, USA. E-mail: yz172@phy.duke.edu; socolar@duke.edu
First published on 3rd February 2021
Abstract
A spherical intruder embedded in a confined granular column is extracted by pulling it upward by an attached string. As the tension of the string gradually increases, a failure event occurs at a certain pulling force, leading to rapid upward acceleration of the intruder. The threshold force and the dynamics of the failure event are experimentally investigated for different filling heights and column diameters, using Ottawa sand and glass beads. For the Ottawa sand, we find that the failure force can be fit by a model describing the weight of the granular material in a cone with the vertex at the bottom of the intruder and a vertex angle of 72°. The agreement between the model and experiments is good for heights less than the column (tube) diameter, but measured values deviate from the model for larger heights. We also report on experiments with glass beads that reveal unexpected effects for relatively small ratios of tube diameters to grain size. The dynamics of the intruder during the failure event is studied using high-speed video analysis. The granular drag force monotonically decays during the pullout for sufficiently large tube diameters. In narrow columns, a monotonic decay of drag force after failure is observed for low heights, whereas a secondary peak can be seen in sufficiently deep and narrow columns, indicating the existence of different mechanisms of failure. The normalized drag force declines with intruder displacement closely for all tube diameters within small displacements.
1 Introduction
Solid objects buried in granular media can be pulled out if sufficiently large upward forces are applied. Several decades ago, practical studies focused on the extraction of solid objects from sediment at the bottom of the ocean1 or the pullout of marine anchors from sand.2 A more exotic application involves the sampling of comet surfaces using harpoons.3 The fluidization of static granular materials also plays a role in many industrial processes, including those involved in energy production, drying and chemical reactions in packed beds, soil mechanics, and many others.4–6 The pullout of a spherical object from a confined granular material constitutes a model system in which the threshold force for fluidization and the dynamics of motion through a fluidized region can be studied in detail.A thorough understanding of the physics involved in the pullout process requires examination of the forces inside the granular medium. Studies of details of the force distributions in confined granular channels and columns have been done in the past two decades.7–10 For static compressed granular materials, experiments show that the distribution of contact force magnitude is nearly uniform below the mean force magnitude and decay exponentially above the mean.7,9 A probabilistic model is proposed10 for channel flows where the difference between the shear stress and yield stress was found to act like an energy barrier the system must overcome in order to yield. In another effort, experimental studies of the dynamic Janssen effect in confined granular columns with moving wall8 showed that Janssen's model11,12 is valid over a broad range of velocities.
Some two-dimensional (2D) studies have addressed the failure of a confined granular material subjected to force applied to an internal object.13–16 Since the visualization of force chain dynamics in three-dimensional (3D) experiments is nearly impossible, very specific experiment has introduced a quasi-static, slowly sheared assembly of hydrogel particles immersed in a refractive index matched solution.17 Experiments and simulations of 2D systems (monolayers of grains) suggest that the arching and branching of force chains can make the material particularly strong. However, if the force network interacts with the boundaries, it can display a completely different behavior than a semi-infinite medium.13–15 In a recent paper,13 the dynamics of the force network was studied in 2D packings of photoelastic disks during the pullout of large intruder from a vertical channel, and geometric features of the network were seen to affect the dependence of the pullout dynamics on the channel width. In related experiments and simulations, a small intruder driven through a 2D annular channel was seen to exhibit either stick-slip or clogging-like behaviors, depending on the packing density and the strength of basal friction, though the details of the force network structures have not yet been fully analyzed.14,15
One might consider the pullout of an object from a granular medium as an inverse impact process.18 However, the applied forces and relevant boundary conditions are different in the two cases, and there is no obvious relation between the force networks involved. A recent numerical study of the failure of glass beads within a narrow tube due to the pullout of a spherical object revealed the role played by boundary and particle forces in the failure process.19 The limited number of particles in those simulations, however, did not allow study of the regime appropriate for modeling sand in typical experimental systems.
In earlier 2D experiments on the pullout of an intruder from granular material,16 the velocity of the intruder was held constant in each run. This velocity was varied somewhat for different runs, but only the low velocity regime below 10 mm s−1 was explored. Our focus in the present work is on a complementary process in which the external force on the intruder is held fixed just after it exceeds the threshold required to initiate material failure.
We report measurements of the threshold force required to extract a spherical intruder from a cylindrical tube filled with sand, focusing on the dependence on the tube diameter. We also study the dynamics of the intruder during the failure event. In Section 2, we describe the experimental setup and discuss key features of the failure process. In Section 3, we present the results for critical pulling forces and the dynamics of pullout for granular media comprised of sand or glass beads. Section 4 contains some concluding remarks.
2 Experimental setup
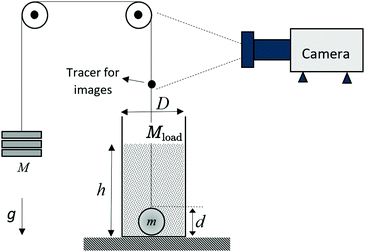
Our experimental setup is shown schematically in Fig. 1. A spherical intruder of mass m = 172 g and diameter d = 3.49 cm is placed at the bottom of a plastic tube of inner diameter D and centered. The intruder is connected to a hanging weight via a string looped over two pulleys. A small tracer is fixed on the string outside the tube, allowing for monitoring of the intruder position. The mass of the tracer is 0.08 g, which corresponds to a gravitational force of about 0.2% of the smallest pullout force observed in this study and is smaller than the uncertainty in our measurement of the intruder mass. The weight consists of a hanging bucket that can be slowly filled with sand. The static friction in the pulleys is sufficient to hold the system steady for a maximum mass imbalance of 7 g.The tube is then filled with granular material of a total mass Mload to a height h by slowly pouring from the top. The height of the surface of the granular column varies on the order of 5 mm or less. A gap between bottom of the tube and the base that it rests on allows air to flow in to avoid the development of a low pressure in the region under the intruder during pullout. The upward force on the intruder is increased by slowly adding mass to the hanging bucket, and the tube is held still during the entire process.
Table 1 summarizes the granular material parameters and tube dimensions used in our experiments. Note that using the mean bulk density ρ and loaded mass Mload, the column height h can be expressed as
 | (1) |
| Granular material | Mean diameter dp (mm) | Bulk density ρ (g cm−3) | Tube diameter D (cm) | Loaded mass Mload (g) | Column height h (cm) | Pullout force F (N) |
|---|---|---|---|---|---|---|
| Standard Ottawa Sand | 0.5 | 1.8 | 20 | 2000–8000 | 3.6–14.2 | 0.4–28 |
| 10.1 | 600–2300 | 4.4–16.2 | 1–30 | |||
| 6.1 | 180–660 | 4.2–13.2 | 0.8–31 | |||
| 5.2 | 120–351 | 4.2–10.2 | 0.9–25 | |||
| Glass beads (rough surface) | 4.0 | 1.6 | 6.1 | 200–690 | 5.3–15.8 | 1.7–29 |
| 5.2 | 150–420 | 5.6–13.7 | 2.8–32 | |||
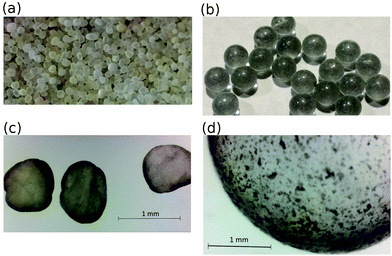 | ||
| Fig. 2 Granular material used in experiments. Bulk view of (a) sand, and (b) glass beads. Microscopic view of (c) sand particles, and (d) a glass bead. | ||
2.1 Onset of pullout failure
In a single run of the experiment, the hanging mass is slowly increased at a rate between 1 g s−1 and 10 g s−1. As the hanging mass increases, the granular material fails suddenly, and the intruder is pulled from the bed in roughly 0.25 s. We stop increasing the hanging mass immediately upon pullout, and denote its final value by M. The pullout force at failure is defined as:| F = (M − m)g | (2) |
The absolute error in the measurement of F for each run is due to static friction in the pulley system, as well as a small amount of material that is unavoidably added to the hanging weight shortly after pullout has started. In order to quantify the static friction, in an independent set of experiments, we replace the granular media and the intruder with a known constant weight and slowly increase the weight Mg until motion just starts. The difference between the two weights, T, is the static friction in the pulley system. T can be viewed as a function of Mg and it is shown in Fig. 3. We capture the trend using a simple linear relation T = μMg + c, and the fitting parameters are μ = 0.013 and c = 0.06 N, capturing the bearings' rolling friction and the effect of lubricant. Finally, the static friction T is subtracted off from F based on the same Mg value. The additional hanging mass is between 0.005–0.05 N depending on the rate of pouring, and in experiments with small F (on the order of 1 N), the rate of increase of the hanging mass is set at a very low value to minimize its effect. So its error contribution is negligible.
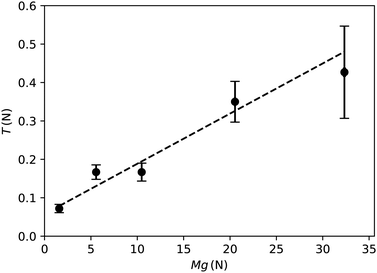 | ||
| Fig. 3 Static friction T in the pulley system as a function of pullout weight Mg. The dashed line is a linear fit to the data. | ||
2.2 Pullout dynamics
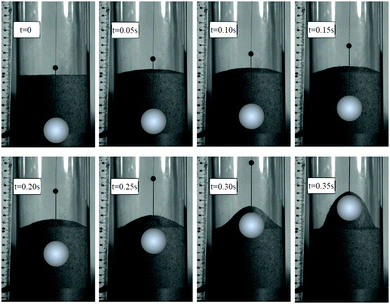
The onset of granular failure is identified as the moment at which the intruder begins an upward motion that continues through the exit from the granular material. In most cases, the intruder remains stationary before the onset of failure. In some cases, however, finite slip events on the order of a grain diameter occur prior to the failure event, with such events being more probable for larger fill heights. For all tested D and h, the finite slip events that occur before the onset of failure produce a total displacement of less than ten grain diameters.Before the onset of failure, a high-speed camera (Photron FASTCAM SA5) begins recording the displacement of the small tracer (and thus the intruder) as a function of time t at 2000 frames per second (0.5 ms between consecutive frames). Fig. 4 displays a sequence of video frames in a specific experiment with a transparent sidewall, with a time interval of 50 ms between successive images. The tube diameter is 10 cm, and the position of the intruder is manually superimposed on each frame as a guide to the eye. These pictures reveal that the surface of the granular bed rises roughly uniformly as the intruder moves up to the middle of the bed (t < 0.15 s), and the central region of the bed rises dramatically as the intruder approaches the granular surface (0.15 s < t < 0.25 s). Beyond this limit (t > 0.25 s), the intruder has been removed from the bed, being covered only by a thin, falling layer of granular material. Sample videos of the failure of sand due to the pullout of intruder are provided in the ESI†![[thin space (1/6-em)]](https://www.rsc.org/images/entities/char_2009.gif) 20 for the four tube diameters D given in Table 1.
20 for the four tube diameters D given in Table 1.
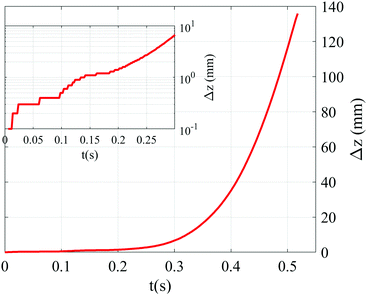
A typical graph of the displacement Δz of the tracer with t after the onset of failure (at t = 0) is shown in Fig. 5. The tracer motion does not precisely match the intruder motion due to the compliance of the pulling string, which is 7 × 10⁻⁴ N−1 (elongation strain per Newton). Given the distance between the tracer and the intruder of about 20 cm, this implies a difference between tracer displacement and intruder displacement of approximately 1 mm when the force changes by 8 N, a typical pullout force. This complicates attempts to obtain precise data on the velocity of the intruder during a failure event. We note, however, that the slow loading of the system prior to failure results in a series of extremely small incremental tracer displacements, and the onset of failure remains unambiguous. The sharp onset of pullout observed here is consistent with experimental observations of the pullout of a disk from a vertical layer of photoelastic disks, in which force chains pattern do not change before the onset of failure.13 In addition, the small discrete rises of the order of 0.1 mm in Δz that are visible in the inset must represent motion of the intruder itself.
The vertical force exerted on the intruder by the granular material is obtained from Newton's second law of motion applied to the pulley system:
 | (3) |
3 Results and discussions
In this section, we first show the results on the pullout force F for various filling heights h and confining tube diameters D with sand or glass beads, all listed in Table 1, and present an intuitive picture for the pullout force for intruder in sand in a wide tube. We then present the results on the intruder dynamics during pullout. Finally, we discuss the physics that may underlie our observations.3.1 Pullout failure
Fig. 6 shows the experimentally measured dependence of the pullout force F on the height h for four tubes with different diameter D filled with Ottawa sand.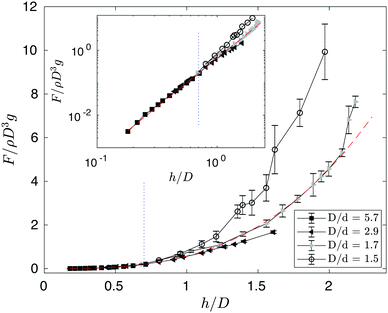 | ||
| Fig. 6 Dimensionless pullout force at failure F/(ρgD3) vs. dimensionless filling height h/D for different tube diameter D: D/d = 1.5 (open circles), 1.7 (light gray triangles), 2.9 (dark gray triangles) and 5.7 (black squares). The red dashed line represents a cubic polynomial fitting to the D/d = 5.9 data based on eqn (4). Blue dotted lines indicate h/D = 0.7. Error bars show run-to-run fluctuations. Inset: Data on a log–log scale, highlighting the agreement between the model and the experiments. | ||
The error bars show run-to-run fluctuations. We choose to work with dimensionless quantities defined based on a rough picture of what might be expected when both D and h are much larger than the intruder diameter. In that regime, we conjecture that F is approximately determined by the weight of a cone of granular material opening upwards from the intruder at some angle 2θ. As long as this cone does not reach the tube wall, the force it exerts on the intruder is approximately  , where r = h
![[thin space (1/6-em)]](https://www.rsc.org/images/entities/char_2009.gif) tan
tan![[thin space (1/6-em)]](https://www.rsc.org/images/entities/char_2009.gif) θ is the radius of the cone's intersection with the surface of the column. This leads us to expect a pullout force of
θ is the radius of the cone's intersection with the surface of the column. This leads us to expect a pullout force of
 | (4) |
![[thin space (1/6-em)]](https://www.rsc.org/images/entities/char_2009.gif) tan
tan![[thin space (1/6-em)]](https://www.rsc.org/images/entities/char_2009.gif) θ)h/D ∼ 1. We therefore choose to divide both sides of eqn (4) by ρgD3 and plot F/(ρgD3) as a function of h/D, as shown in Fig. 6.
θ)h/D ∼ 1. We therefore choose to divide both sides of eqn (4) by ρgD3 and plot F/(ρgD3) as a function of h/D, as shown in Fig. 6.
For h/D ≲ 0.7, the data appears to collapse to a single curve, and the dimensionless pullout force is indeed proportional to (h/D)3, as displayed in the log–log plot of the inset in Fig. 6. Based on fitting eqn (4) to the D = 20 cm (D/d = 5.7) data, we find θ ≈ 36°, for which the expected crossover would indeed occur at h/D ∼ 1/(2![[thin space (1/6-em)]](https://www.rsc.org/images/entities/char_2009.gif) tan
tan![[thin space (1/6-em)]](https://www.rsc.org/images/entities/char_2009.gif) θ) = 0.7. The fit is self-consistent in the sense that all the data points used for it do have h/D < 0.7. We note, however, that the experiments are not in the regime h ≫ d, making strict interpretation of our crude model for the cubic dependence difficult. We note also that θ = 36° is not far from the values reported for 2D photoelastic disk experiments.22
θ) = 0.7. The fit is self-consistent in the sense that all the data points used for it do have h/D < 0.7. We note, however, that the experiments are not in the regime h ≫ d, making strict interpretation of our crude model for the cubic dependence difficult. We note also that θ = 36° is not far from the values reported for 2D photoelastic disk experiments.22
For h/D ≳ 0.7, we find that F/(ρgD3) deviates from the simple relation in eqn (4), as expected, and the dependence on h/D is complicated. For D = 5.2 cm (D/d = 1.5), F/(ρgD3) increases much faster than what eqn (4) describes. For D = 6.1 cm (D/d = 1.7), the rapid increase in F/(ρgD3) seems also present, but starts at about h/D = 2, which is beyond the regime of validity of our model. However for even larger D = 10.1 cm (D/d = 2.9), we find F/(ρgD3) is smaller than what eqn (4) would predict.
In our simple model, the presence of the confining tube is irrelevant for cases with h/D ≲ 0.7, and F increases with h/D as it would be in an infinitely wide medium. Here the cubic dependence between F/(ρgD3) and h/D implies that F is independent of D. For larger h/D, we would expect the wall friction to come into play, and its effect on F is difficult to predict. We show in Fig. 6 that wall friction can cause either an increase or decrease of F compared to the extrapolation of the trend. (We note that this crude model ignores the effects associated with the size of the intruder.) This implies non-monotonic behavior of F at fixed h as a function of D. For h = 10.2 cm, for example, and D = 5.2 cm, 6.1 cm, 10 cm and 20 cm we have F = 10.9 N, 8.0 N, 7.5 N, and 8.5 N, respectively.
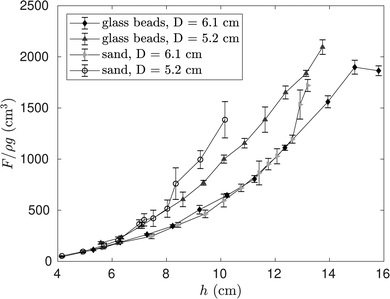
As a step toward determining the effects of particle properties on the critical force required for pullout, experiments were performed using glass beads for the two smallest tube diameters, D = 5.2 cm and 6.1 cm, and the results compared with those for sand. Fig. 7 displays F/(ρg) as a function of h for both sand and glass beads loaded into the two tubes.
For D = 6.1 cm, the data for both materials follow the same curve up to h ≈ 12.5 cm, after which F/(ρg) increases faster for sand than for glass beads. For sand, the increase in F/(ρg) beyond this point is so fast that for h ≥ 13 cm, the pullout force exceeds the measurement limit of our apparatus. For D = 5.2 cm, the data for both materials follows the same curve up to h ≈ 8 cm. In this case, the failure force exceeds the measurement limit of our apparatus for h > 10 cm. Here again, F/(ρg) increases faster for sand than for glass beads.
3.2 Dynamics of pullout
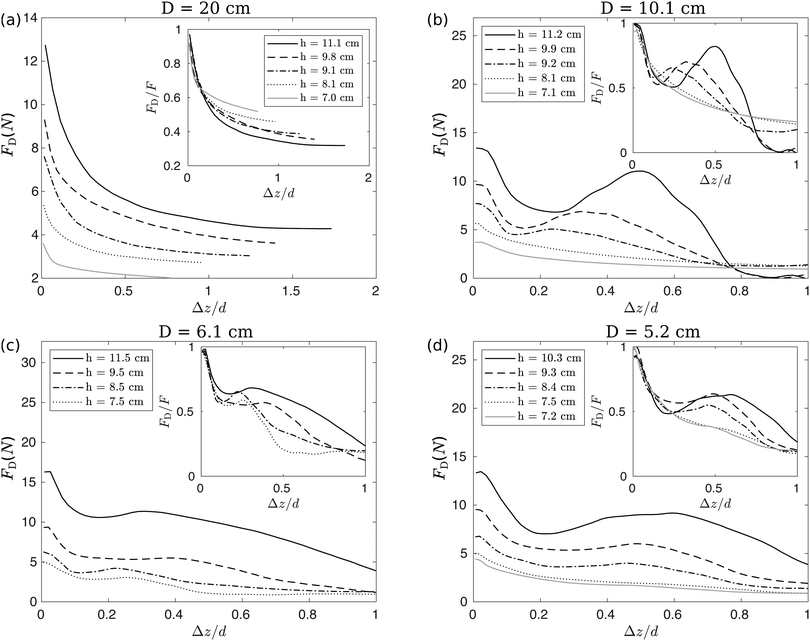
Fig. 8 shows the drag force FD as a function of the vertical displacement Δz divided by the intruder diameter d, for different tube diameters and filling heights. For the largest tube diameter, D = 20 cm, FD continuously decreases as the intruder moves upward (Fig. 8a) for all values of h. For the other three tube diameters, FDvs. Δz/d is shown in Fig. 8(b)–(d). Interestingly, FDvs. Δz/d can be non-monotonic, depending on h. For example, in Fig. 8(b) and h = 11.2 cm, FD first decreases and then increases again as the intruder moves through the sand, developing a peak in FD during the pullout process.To further analyze the non-monotonic behavior in FD, we plot the rescaled drag force FD/F vs. Δz/d in the inset of Fig. 8(a)–(d) and provide the value of FD/F at the peak and the minimum FD/F before the peak in Table 2. We find that for all D and h, the curves roughly collapse for Δz/d < 0.1, and beyond Δz/d = 0.1 the curves diverge from each other.
| D (cm) | Peak FD/F value | Minimum FD/F before the peak | h (cm) | F (N) |
|---|---|---|---|---|
| 10.1 | 0.82 | 0.51 | 11.2 | 13.4 |
| 0.70 | 0.52 | 9.9 | 9.7 | |
| 0.65 | 0.58 | 9.2 | 7.7 | |
| 6.1 | 0.68 | 0.63 | 11.5 | 16.2 |
| 0.57 | 0.55 | 9.5 | 9.3 | |
| 0.65 | 0.57 | 8.5 | 6.3 | |
| 0.59 | 0.55 | 7.5 | 5.0 | |
| 5.2 | 0.63 | 0.48 | 10.3 | 13.3 |
| 0.64 | 0.56 | 9.3 | 9.6 | |
| 0.54 | 0.50 | 8.4 | 6.8 | |
As noted above, interpretation of the measured values of Δz during pullout is complicated by the difficulty of accounting for the compliance of the string. For nonzero accelerations, there are small differences between the displacement of the tracer and the displacement of the intruder. Nevertheless, the monotonic increase of the velocity of the tracer (shown in ESI†![[thin space (1/6-em)]](https://www.rsc.org/images/entities/char_2009.gif) 23) implies a monotonic correction to Δz, so that the observed nonmonotonic variation of FD with Δz can be taken as evidence of a nontrivial interaction of the granular material with the walls of the confining tube.
23) implies a monotonic correction to Δz, so that the observed nonmonotonic variation of FD with Δz can be taken as evidence of a nontrivial interaction of the granular material with the walls of the confining tube.
3.3 Discussions
Our results for static pullout force F vs. filling height h (Fig. 6) suggest the validity in assuming the granular matter responsible for F lying in an inverted cone above the intruder, as long as the cone does not intercept the tube wall. These experiments may resemble pulling out an intruder from an infinitely wide medium, hence we call them the reference cases. In this regime, the key feature is the cubic dependence of F on h. Because the intruder is not a point particle, the position of the vertex of the cone in our model is not unambiguously determined. We have tested several choices ranging from the bottom of the intruder to the top, and we do not find any significant differences in the fitting the data. It appears that the finite size of the intruder and spatial distribution of forces on it have only small influences for the intruder sizes in our experiments, and the cone approximation is therefore useful.Beyond the reference cases, the measured critical pullout force deviates notably from the cubic dependence, as expected. The form of the deviation, however, including its sign, depends sensitively on the tube diameter. There is large gap in F/(ρgD3) for the narrowest tube and the next tube size which is only 5 mm larger in radius (about 10 sand particle diameters). This sensitivity points to the important role of the tube wall, which contributes frictional forces similar to those in the standard Janssen model.11 In this context, studying force chain orientation, curvature and their connections to normal and tangential forces on the column wall may reveal why such a sharp transition occurs.
For the pullout dynamics, our primary results are the derived drag forces FD. When FD is re-scaled by the pullout failure force F (which is also the maximum of FD) and plotted as a function of tracer displacement Δz, curves with different filling heights collapse roughly within the range Δz/d ≤ 0.1. In other words, the initial change in FD/F is independent of the filling height. This may suggest the existence of a common mechanism associated with grain motion in the vicinity of the intruder. In addition to FD, the following observations suggest that different mechanisms may come into play for different tube diameters. For the largest D, there is a crater remaining after the pullout, with a diameter of roughly D/3, and there is no indication of any motion of the granular material near the confining tube wall. For smaller tube diameters, grain motion relative to the wall causes both static and dynamic frictional forces to come into play. After the initial drop in fD in the first stage of the failure event, it appears the nonmonotonic behavior may signal an increase in normal forces at the wall and a consequent increase in the frictional force. Alternatively, grains near the wall may initially move upward, and a transient clogging event may occur as they reverse direction to flow around the rising intruder. The initial drop happens during intruder displacements of up to 0.2d, second peak in FD occurs at a displacement between 0.2d and 0.6d, depending on filling height.
Our experiments using glass beads provide evidence that the failure force may not depend on the grain size or type in larger tubes, as the re-scaled failure force F/(ρg) vs. h coincided for sand and glass beads for large D up to large h (Fig. 7).
4 Conclusions
We have experimentally studied the pullout of a spherical intruder from the bottom of confined granular (Ottawa sand) columns. Four tube diameters were used, with tube-to-intruder diameter ratios of 5.7, 2.9, 1.7 and 1.5. For each tube diameter, the amount of loaded granular material was varied. We obtain the minimum force required for pullout, as well as the intruder dynamics and drag force FD during its post-failure motion through the bed. Our measurement of the failure force can be partially explained by a simple model in which a cone of material is lifted by the intruder, and the predictions for h/D ≲ 0.7 are in good agreement with our data (Fig. 6) when the vertex of the cone is placed at the bottom of the intruder. However, the precise conditions for applicability of this model need further investigation. For h/D ≳ 0.7, the trend of dimensionless failure force F/(ρgD3) vs. h/D depends on D. For the two tubes with the smallest diameters, we also studied the pullout process from a material comprised of glass beads. Our results showed that the re-scaled failure force F/(ρg) vs. h coincided for sand and glass beads in the larger tube of the two used here up to high values of h.The dynamics of the pullout process is also studied by analyzing the high-speed videos taken from the onset to the end of the process. Analysis reveals that for the large tube diameter (D/d = 5.7), the drag force FD decreases monotonically. For smaller tube diameters, FD has a peak following the initial decaying period, and such peak disappears at small h. The origin of this peak is an interesting topic for future research.
Author contributions
The authors made contributions to this work in the following areas: Payman Jalali – conceptualization, formal analysis, funding acquisition, investigation, and writing of the original draft; Yuchen Zhao – formal analysis, investigation, and writing of the original draft; Joshua Socolar – supervision, formal analysis, funding acquisition, and review and editing of the manuscript.Conflicts of interest
There are no conflicts to declare.Acknowledgements
This work is dedicated to Bob Behringer, who will be always remembered. This paper would not be possible without his initiation of the idea of this work and all the supports he provided for the accomplishment of this research in his lab. PJ acknowledges the financial support by the Academy of Finland under grant no. 311138. PJ also gratefully acknowledges the personal fellowship granted by the Walter-Ahlström foundation (Finland) to his visit to Duke University and conduct most parts of this research. YZ and JS received support from the US National Science Foundation (NSF) under grant no. DMR-1206351 and DMR-1809762.References
- A. S. Vesic, Breakout resistance of objects embedded in ocean bottom, Duke univ durham nc technical report, 1969.
- E. H. Kalajian and S. M. Bemben, The vertical pullout capacity of marine anchors in sand, Massachusetts univ amherst school of engineering technical report, 1969.
- M. B. Quadrelli, M. Ono and A. Jain, Acta Astronaut., 2017, 138, 512–529 CrossRef.
- P. Jalali, M. Nikku, J. Ritvanen and T. Hyppänen, Powder Technol., 2018, 339, 569–584 CrossRef CAS.
- J. Wang, Chem. Eng. Sci., 2020, 215, 115428 CrossRef CAS.
- C. Agu, L. Tokheim, M. Eikeland and B. Moldestad, Chem. Eng. J., 2017, 328, 997–1008 CrossRef CAS.
- T. S. Majmudar and R. P. Behringer, Nature, 2005, 435, 1079 CrossRef CAS.
- Y. Bertho, F. Giorgiutti-Dauphiné and J.-P. Hulin, Phys. Rev. Lett., 2003, 90, 144301 CrossRef.
- D. M. Mueth, H. M. Jaeger and S. R. Nagel, Phys. Rev. E: Stat. Phys., Plasmas, Fluids, Relat. Interdiscip. Top., 1998, 57, 3164 CrossRef CAS.
- O. Pouliquen and R. Gutfraind, Phys. Rev. E: Stat. Phys., Plasmas, Fluids, Relat. Interdiscip. Top., 1996, 53, 552 CrossRef CAS.
- H. Janssen, Z. Ver. Dtsch. Ing., 1895, 39, 1045–1049 Search PubMed.
- J. Duran, Sands, powders, and grains: an introduction to the physics of granular materials, Springer Science & Business Media, 2012 Search PubMed.
- Y. Zhang and R. Behringer, EPJ Web Conf., 2017, 03040 CrossRef.
- R. Kozlowski, C. M. Carlevaro, K. E. Daniels, L. Kondic, L. A. Pugnaloni, J. E. S. Socolar, H. Zheng and R. P. Behringer, Phys. Rev. E, 2019, 100, 032905 CrossRef CAS.
- C. M. Carlevaro, R. Kozlowski, L. A. Pugnaloni, H. Zheng, J. E. S. Socolar and L. Kondic, Phys. Rev. E, 2020, 101, 012909 CrossRef CAS.
- A. Seguin and P. Gondret, Phys. Rev. E, 2017, 96, 032905 CrossRef CAS.
- J. A. Dijksman, F. Rietz, K. A. Lörincz, M. van Hecke and W. Losert, Rev. Sci. Instrum., 2012, 83, 011301 CrossRef.
- A. H. Clark, A. J. Petersen, L. Kondic and R. P. Behringer, Phys. Rev. Lett., 2015, 114, 144502 CrossRef.
- S. Shah, C. Cheng, P. Jalali and L. Kondic, Soft Matter, 2020, 16, 7685–7695 RSC.
- ESI:† Videos of pullout failure in sand for 4 tube diameters: (a) D = 20 cm; (b) D = 10.1 cm; (c) D = 6.1 cm; (d) D = 5.2 cm. The camera is looking down from the top of the tube, and the intruder is moving towards the camera. These videos are recorded at 120 frame per second.
- I. Daubechies, Ten Lectures on Wavelets, SIAM, 1992 Search PubMed.
- J. Geng, D. Howell, E. Longhi, R. Behringer, G. Reydellet, L. Vanel, E. Clément and S. Luding, Phys. Rev. Lett., 2001, 87, 035506 CrossRef CAS.
- ESI:† Variation of rescaled drag force FD/F with intruder upward velocity dz/dt for different tube diameters D and filling heights h. (a) D = 20 cm; (b) D = 10.1 cm; (c) D = 6.1 cm; (d) D = 5.2 cm. Note that each color represents a filling height in one run.
Footnote |
| † Electronic supplementary information (ESI) available. See DOI: 10.1039/d0sm01914c |
| This journal is © The Royal Society of Chemistry 2021 |

