
Gel rupture during dynamic swelling†
Kelsey-Ann
Leslie‡
a,
Robert
Doane-Solomon‡
ab,
Srishti
Arora
a,
Sabrina J.
Curley
 c,
Caroline
Szczepanski
c and
Michelle M.
Driscoll
*a
c,
Caroline
Szczepanski
c and
Michelle M.
Driscoll
*a
aDepartment of Physics and Astronomy, Northwestern University, Evanston, IL, USA. E-mail: michelle.driscoll@northwestern.edu
bDepartment of Physics, University of Oxford, Oxford, UK
cDepartment of Chemical Engineering and Materials Science, Michigan State University, East Lansing, MI, USA
First published on 14th December 2020
Abstract
Hydrogels have had a profound impact in the fields of tissue engineering, drug delivery, and materials science as a whole. Due to the network architecture of these materials, imbibement with water often results in uniform swelling and isotropic expansion which scales with the degree of cross-linking. However, the development of internal stresses during swelling can have dramatic consequences, leading to surface instabilities as well as rupture or bursting events. To better understand hydrogel behavior, macroscopic mechanical characterization techniques (e.g. tensile testing, rheometry) are often used, however most commonly these techniques are employed on samples that are in two distinct states: (1) unswollen and without any solvent, or (2) in an equilibrium swelling state where the maximum amount of water has been imbibed. Rarely is the dynamic process of swelling studied, especially in samples where rupture or failure events are observed. To address this gap, here we focus on rupture events in poly(ethylene glycol)-based networks that occur in response to swelling with water. Rupture events were visualized using high-speed imaging, and the influence of swelling on material properties was characterized using dynamic mechanical analysis. We find that rupture events follow a three-stage process that includes a waiting period, a slow fracture period, and a final stage in which a rapid increase in the velocity of crack propagation is observed. We describe this fracture behavior based on changes in material properties that occur during swelling, and highlight how this rupture behavior can be controlled by straight-forward modifications to the hydrogel network structure.
1 Introduction
Polymer materials formed with a significant degree of cross-linking, thus creating a network structure, have specific and unique advantages when compared to linear analogues that have no cross-linking.1 Most significantly, network architectures are associated with additional rigidity and stability of three-dimensional shape and structure. These changes correspond to an increase in mechanical integrity, typically measured by the elastic modulus, as well as an enhanced resistance to thermal degradation and dissolution in solvents. Over the past 20 years, hydrophilic polymer networks that swell but do not dissolve when immersed in water, e.g. hydrogels, have been exploited heavily as platforms for biomaterials and synthetic mimics of tissues, most commonly with poly(ethylene glycol) (PEG) derivatives employed as the polymer network building block.2,3 Hydrogels have proven valuable for these applications, as they can imbibe a significant amount of water, thus generating a soft material that is mostly comprised of water yet has a defined structure dictated by the polymer network. While the research literature is rich with examples of biomaterials developed from PEG,2,4–7 there are still challenges associated with this platform: there remains a need to better understand the physical behavior and transient dynamics associated with swelling and how it contributes to observed phenomena such as surface instabilities and rupturing.8–14 To address these limitations, here we employ high-speed imaging of rupture events during hydrogel swelling to determine what factors lead to catastrophic failure.A major disadvantage of hydrogel platforms is their associated brittle behavior and overall lack of toughness,15,16 which can limit their use in emerging applications. Considerable effort and research has sought to address this drawback.17 Notably, recent strategies based in dual-networks have led to hydrogel systems with enhanced toughness18 and stretchability.19 However, the lack of toughness is still a major issue impacting hydrogels formed from free radical polymerization of monomer solutions, including rapid, on-demand photopolymerizations of acrylate- or methacrylate-PEG derivatives. Hydrogels formed from these precursors typically have heterogeneity in their network architectures20 and display failure responses that are highly subjective to the type of applied load or stress.21,22 A variety of responses including fast fracture, delayed fracture, fatigue fracture, and catastrophic fracture23 have all been documented, yet little work has been done to identify a fundamental relationship that governs these different mechanisms. Despite this gap, the ease of applying free-radical polymerizations and more specifically the advantages associated with photo-initiated free-radical polymerizations (e.g. spatio-temporal control, ambient temperature processing24) makes it a heavily-relied upon approach that is employed across numerous application fields. Therefore, this approach is necessary for future innovations and developments such as complex and patterned hydrogels,4,25,26 but the mechanics of these materials must be understood.
One specific shortcoming when assessing failure events or instabilities of gels is that they are typically studied in one of two distinct and separate states: (1) unswollen, i.e. in a virgin state without any solvent; or (2) at an equilibrium swelling state. In the unswollen regime, the network is in a collapsed state and there are no polymer/solvent interactions. In contrast, equilibrium swelling assumes the material is in thermodynamic equilibrium with a solvent that has an affinity for the polymer network; it is commonly assumed that the swollen network is in a stress-free state.12,27 The ability of a network to expand isotropically and be impregnated with an attractive solvent is correlated to the relative degree of cross-linking, and thus more densely cross-linked networks swell to a lesser extent than loosely cross-linked analogues. Characterization of polymer gels in just these two distinct and separate states (swollen and unswollen) can be sufficient for certain application purposes, as well as to understand the physics of these two endmember regimes. Prior works have used these distinct states to determine how boundary conditions during swelling21 or solvent cycling (i.e. repeated swelling and drying)27 impact mechanical behavior, revealing that in an unswollen state, standard viscoelastic behavior associated with polymer networks is evident, whereas at equilibrium swelling the gel behaves as a non-linear elastic material.27 Unfortunately, while these studies provide critical insight into the behavior of gel materials, they do not capture the mechanics in dynamic or evolving environments, particularly during the swelling process, nor do they account for any failure events or instabilities encountered as a direct consequence of swelling.
The mechanical behavior of swelling has been studied from a theoretical perspective, initially through the development of Flory–Rehner model,28 which considered the free energies associated both with polymer stretching as well as the mixing of polymer and solvent (as previously derived in the Flory–Huggins solution theory29,30). Since this foundational work, others including Tanaka and Fillmore have combined theoretical considerations with experimental analyses to understand the swelling of gel materials.8 In Tanaka and Fillmore's analysis, it is assumed that positive osmotic pressure forces a gel to expand when transferred to a compatible fluid, and that the speed of swelling is proportional the diffusion coefficient (D) of the polymer network. Furthermore, while approaching the equilibrium swelling state the internal stresses of the polymer network approach zero. This was shown to be a reasonable assumption for polyacrylamide gels in water having spherical shapes.8 However, later studies observed phenomena such as surface instabilities31 and self-rupturing9 in response to swelling. Therefore, the assumption of internal stresses approaching zero and the appropriateness of theoretical regimes to account for geometrical constraints, mechanical loads, and non-idealities or heterogeneity associated with polymer networks used in practice has come into question.32 Phenomena such as in situ surface structuring and self-rupturing are interesting and relevant for interfacial design and drug delivery applications. Unfortunately, given the prior analyses of failure modes and mechanisms only in static states of swollen or unswollen, limited knowledge exists regarding the failure events of polymer gels in response to internal stresses developing in real-time. Furthermore, while growing interest has led to theoretical analyses that take into account the swelling process,8,21,33 an experimentally-driven approach to characterizing and understanding swelling-induced instabilities and failures will better inform these models and provide ab initio predictions of failure events in gels.
In this work, we demonstrate the necessity of probing gel properties in dynamic environments, e.g. during the swelling process, and not just in the swollen and unswollen states. We study in particular how fluid imbibement leads to material failure, and how this rupture is controlled both by dynamically changing material properties, as well as the imbibement-induced stress that builds up due to osmotic pressure gradients and inhomogeneous material properties. Our measurements demonstrate that material properties such as density decrease while internal stress increases due to swelling-induced fluid flow. The magnitude of this changes, particularly during the early stages of swelling control the non-linear development of crack velocity. This work highlights the rich spectrum of behavior that can occur during the swelling process, and we expect this to motivate further investigations of this under-explored regime.
2 Materials and methods
2.1 Materials
All experiments were conducted using photopolymerized polymer networks. Networks were formed from poly(ethylene glycol) (PEG) monomers, specifically: poly(ethylene glycol) methyl ether acrylate (Mn ≈ 480, PEGMEA) and poly(ethylene glycol) diacrylate (Mn ≈ 700, PEGDA). A photoinitiator was included in all monomer formulations at 0.5 wt% (relative to the total mass of monomers) to enable on-demand photopolymerization. In all cases, the photoinitiator employed was 2,2-dimethoxyphenylacetophenone (DMPA). All monomers and the photoinitiator were purchased from Sigma-Aldrich and used as received and without further purification. For all swelling experiments Milli-Q water was employed.2.2 Methods
![[thin space (1/6-em)]](https://www.rsc.org/images/entities/char_2009.gif) :PEGMEA was varied to systematically modify the mechanical properties of the PEG-networks, similar to approaches described in prior works.3,34 The mol percent of PEGDA was varied over a range of 1–40%; for example a formulation labeled 20% PEGDA indicates that of the monomers included in the formulation, 20 mol percent is the cross-linker, PEGDA, and the remaining 80 mol percent is PEGMEA. To prepare monomer formulations, a given ratio of PEGDA:PEGMEA was determined and appropriate masses of each monomer were placed into a clean glass vial. The appropriate mass of photoinitiator (DMPA) corresponding to a 0.5% (w/w) loading level, was introduced and magnetic stirring and/or vortexing was applied until a homogeneous, clear solution was obtained upon visual inspection (typically after 5–10 minutes of mixing). If not employed immediately, monomer formulations were placed in a refrigerator and covered in aluminum foil to prevent premature UV exposure during storage.
:PEGMEA percent, the sample mass was first measured in the dry, unswollen state. Immediately after recording this mass, samples were immersed in 500 mL of Milli-Q water (at ambient temperature, T = 27 °C). At pre-defined measurement times (typically every 30 s), specimens were removed from the water and the elapsed swelling time was paused. Specimens were gently dried with a Kimwipe to ensure that no excess water was included in the measurements, and then weighed using the same balance as initial mass measurements. After weighing, specimens were then placed in a fresh batch of Milli-Q water and the elapsed swelling time was re-initiated. The swelling ratio was calculated at each timepoint as the ratio of swollen mass at time t to initial, dry mass.3
:PEGMEA was varied to systematically modify the mechanical properties of the PEG-networks, similar to approaches described in prior works.3,34 The mol percent of PEGDA was varied over a range of 1–40%; for example a formulation labeled 20% PEGDA indicates that of the monomers included in the formulation, 20 mol percent is the cross-linker, PEGDA, and the remaining 80 mol percent is PEGMEA. To prepare monomer formulations, a given ratio of PEGDA:PEGMEA was determined and appropriate masses of each monomer were placed into a clean glass vial. The appropriate mass of photoinitiator (DMPA) corresponding to a 0.5% (w/w) loading level, was introduced and magnetic stirring and/or vortexing was applied until a homogeneous, clear solution was obtained upon visual inspection (typically after 5–10 minutes of mixing). If not employed immediately, monomer formulations were placed in a refrigerator and covered in aluminum foil to prevent premature UV exposure during storage.
:PEGMEA percent, the sample mass was first measured in the dry, unswollen state. Immediately after recording this mass, samples were immersed in 500 mL of Milli-Q water (at ambient temperature, T = 27 °C). At pre-defined measurement times (typically every 30 s), specimens were removed from the water and the elapsed swelling time was paused. Specimens were gently dried with a Kimwipe to ensure that no excess water was included in the measurements, and then weighed using the same balance as initial mass measurements. After weighing, specimens were then placed in a fresh batch of Milli-Q water and the elapsed swelling time was re-initiated. The swelling ratio was calculated at each timepoint as the ratio of swollen mass at time t to initial, dry mass.3
3 Results and discussion
3.1 Mechanical properties
PEGDA:PEGMEA networks were formed via bulk photopolymerization (i.e. with no solvent present), and afterwards probed for mechanical properties such as tensile storage modulus (E′) via dynamic mechanical analysis (DMA). As expected, E′ was directly set by the ratio of PEGDA:PEGMEA. As shown in Fig. 1a, increasing PEGDA percent results in an roughly linear increase in the value of E′, with an order of magnitude increase observed as the amount of PEGDA was varied from 3–20 mol percent. The measurement of E′ provides an estimate of stored energy within a viscoelastic material, and confirms the expected increases in rigidity and mechanical integrity with increasing PEGDA mol percent in the unswollen state. This increase in E′ with PEGDA mol percentage is consistent at both ambient (27 °C) and elevated temperatures (90 °C), as shown in Fig. 1a. The gel mechanical properties we measure are additionally confirmed by our observations: all samples had a gel-like consistency when photopolymerized in bulk, indicating rubbery behavior even at ambient temperatures. Other thermomechanical data (see Fig. S2, ESI†) was collected during these experiments, such as the loss modulus, E′′, and tanδ. Over the temperature range explored, E′′ was stable and consistently three orders of magnitude lower than E′ for all samples. Viscoelastic materials are expected to have significant variations over orders of magnitude in both storage (E′) and loss (E′′) modulii when going through the glass transition, followed by a rubbery plateau region characterized by relatively consistent moduli values above the glass transition temperature (Tg). The consistent moduli values at both 27 °C and 90 °C observed here, as well as the qualitative observations noted above, indicate that all samples are indeed in the rubbery regime of the viscoelastic profile at ambient temperatures or higher, meaning the Tg's of all samples are well below ambient conditions. This was confirmed by additional DMA scans that were conducted from −50 C to 100 C (see Fig. S2, ESI†). These scans revealed that the Tg of 20% PEGDA networks was roughly −45 °C, consistent with previously reported literature values for PEGDA-based networks.36,37 Given that this sample has the highest cross-link density of the materials investigated, all other networks will have lower Tgs.
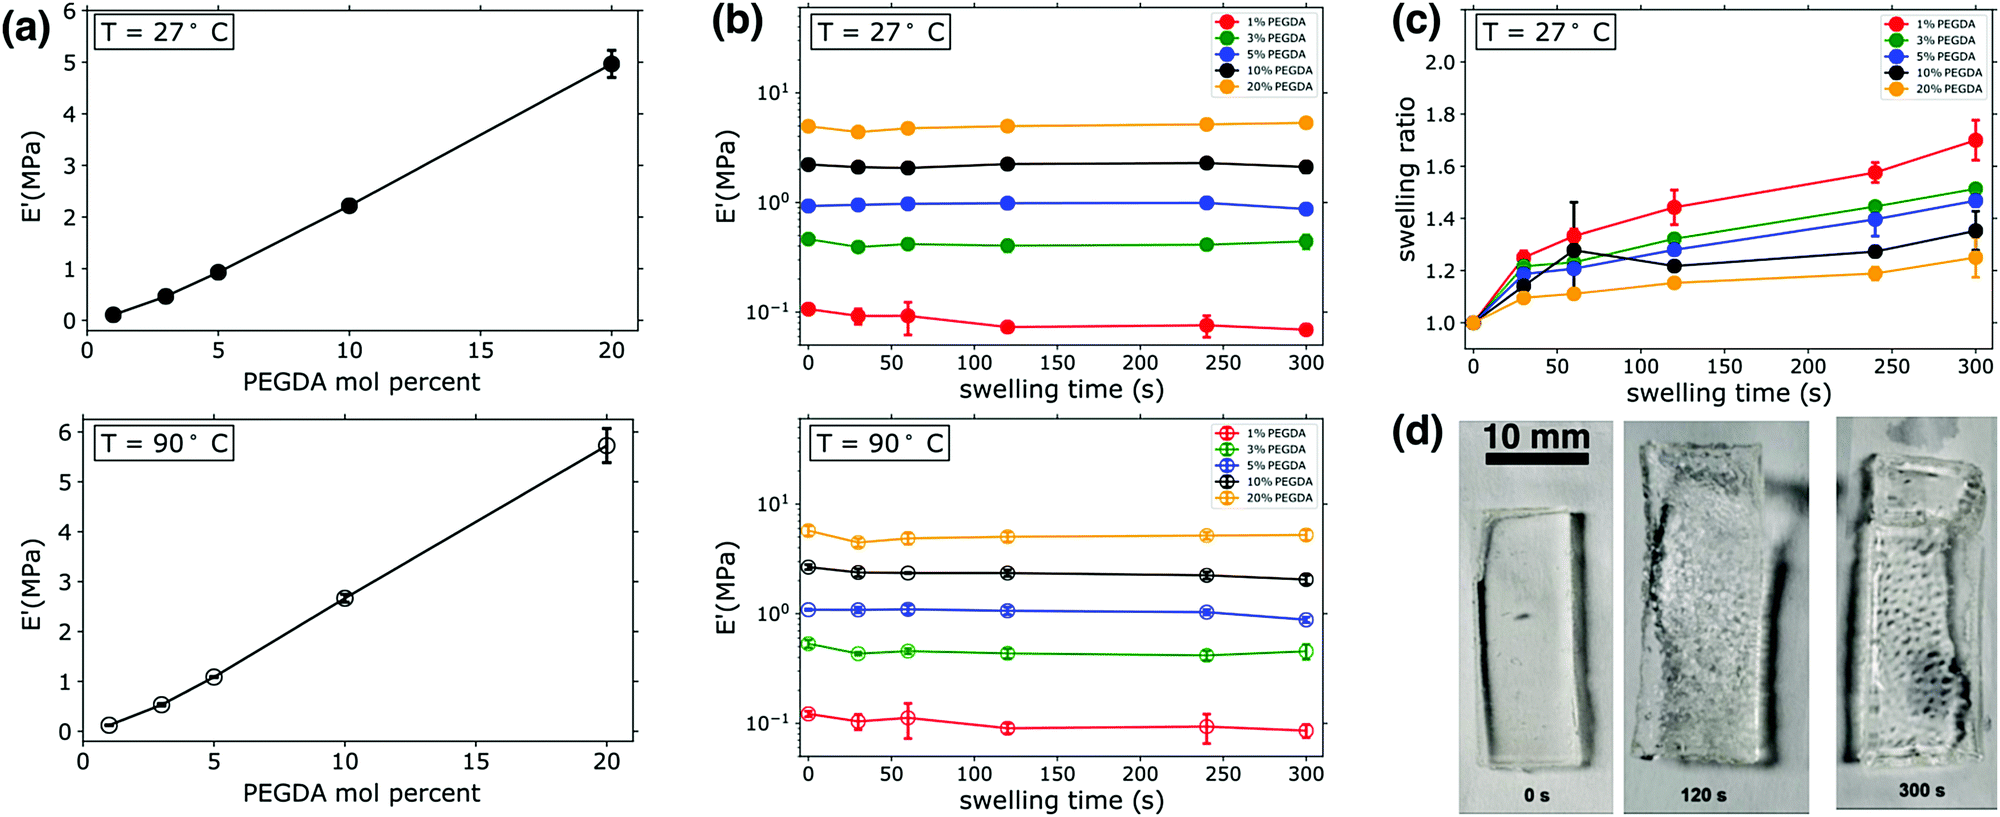 | ||
| Fig. 1 (a) Gel storage modulus vs. PEGDA mol percent at T = 27 °C (upper panel) and T = 90 °C (lower panel). (b) Gel storage modulus as a function of swelling time at T = 27 °C (upper panel) and T = 90 °C (lower panel). (c) Swelling ratio at T = 27 °C. (d) Images of a PEG-hydrogel (3:97 PEGDA:PEGMEA) during the swelling process; the last panel shows the ruptured gel. This rupturing occured in samples having 3–20 mol percent PEGDA, with rupturing occuring in roughly 10–20% of specimens. | ||
DMA was also employed to determine the impact of transient swelling and how E′ varied as samples were swollen prior to any macroscopically observed fracture or failure events, as illustrated in Fig. 1b. As Fig. 1d highlights, some of the specimens would rupture during swelling. The frequency of rupture events varied with cross-link density; no rupture was observed for samples with 1 mol percent PEGDA, 10% of samples containing 3 or 20 mol percent PEGDA ruptured, and 20% of samples containing 5 or 10% PEGDA ruptured. These variations in frequency of rupture events are also observed in specimens analyzed by high speed imaging, as will be discussed in a subsequent section. Loss moduli values (E′′) were also measured in these experiments, however for clarity and to better compare all samples at varying swelling times this data is not included in Fig. 1. A representative scan of E′′ for an uswollen, 20 mol percent PEGDA network is given in the supplemental information (see Fig. S2, ESI†), showing an E′′ value of 2 × 10⁻² MPa in the rubbery plateau region (a similar analysis of a 5 mol percent PEGDA network revealed an E′′ value of 5 × 10⁻³ MPa in the rubbery plateau).
Samples were loaded immediately after the prescribed swelling period, and a temperature sweep was initiated from 24 °C. Therefore, the E′ data in the upper panel of 1b is an estimate of the modulus in the swollen state. No significant variations in E′ were observed across swelling times up to 300 s. With the least cross-linked materials (1 mol percent PEGDA), a slight variation in E′ is observed between 0 s swelling (i.e. unswollen) and 30 s. While the observed variation is quite small, it is attributed to the increased swellability of the 1 mol percent PEGDA sample due to its low cross-link density. We massed all samples after thermomechanical characterization (i.e. after having completed the temperature sweep from 24 °C to 100 °C), and it was determined that water loss resulted from the temperature variation and environment inside the DMA chamber, bringing the samples back to their original mass prior to swelling. The kinetics of drying was not probed directly, and thus the temperature at which specimens reverted to their nonswollen mass was not determined precisely. It is for this reason that we present data from two discrete points of the DMA experiments. We present data from onset of the temperature sweep (27 °C) with the assumption that minimal water evaporation from the specimens occurs in the short period it takes to mount specimens and begin the DMA. We also present the data from the end of the temperature sweep (90 °C), since we know shortly after this point the samples are back to their unswollen masses and thus we can reasonably assume that samples are dried at this point of the experiment. The similarities in the E′ data at 90 °C (Fig. 1b, lower panel) and the measurements in the swollen state at 27 °C highlight two significant points. First, no significant breakdown of the network structure occurs in the early stages of swelling, as the network maintains similar E′ values. If damage to the network architecture was occurring in the early stages of swelling one would expect a reduction in E′. Secondly, since similar moduli values were recorded for swollen specimens (i.e. the E′ measurements at 27 °C) and specimens that were swollen and dried (i.e. the E′ measurements at 90 °C), it is evident that swelling does not have a major impact on E′. The water uptake was measured for all DMA specimens, and it scaled with the PEGDA mol percent and increased with swelling time, as expected (see Fig. 1c); Fig. 1d shows images of the gel during the swelling process. A maximum swelling ratio of ∼1.7 was measured after 300 s swelling for 1 mol percent PEGDA samples, whereas the most cross-linked sample (20 mol percent PEGDA) had a swelling ratio of ∼1.2 after 300 s. Significant decreases in E′ with swelling have been reported in other studies of hydrogels, however this is often observed in samples swelling on the scale of hours or days and with swelling ratios significantly larger than those measured here (on the order of 10–100).38 Due to these relatively small swelling ratios, we can conclude that the fluctuations in E′ are minimal and only visually observed in the “softest” or least cross-linked sample.
3.2 Dynamic fracture
When immersed in water, PEGDA:PEGMEA gels begin to absorb fluid (see Fig. S3, ESI† for more details). This swelling occurs at a slow rate, resulting in a buildup of compressive stresses at the gel boundary (see ESI† for further discussion).12 We observed that this swelling occurred with no damage to the gel samples for a time period τ; after this time, the samples fractured; one such event is illustrated in Fig. 2a. In the softest gels that fractured, crack bifurcation was always observed. This bifurcation was observed less often as the gel modulus was increased (increasing PEGDA mol percent); for the stiffest gels crack branching was not observed (see Fig. S6, ESI†).
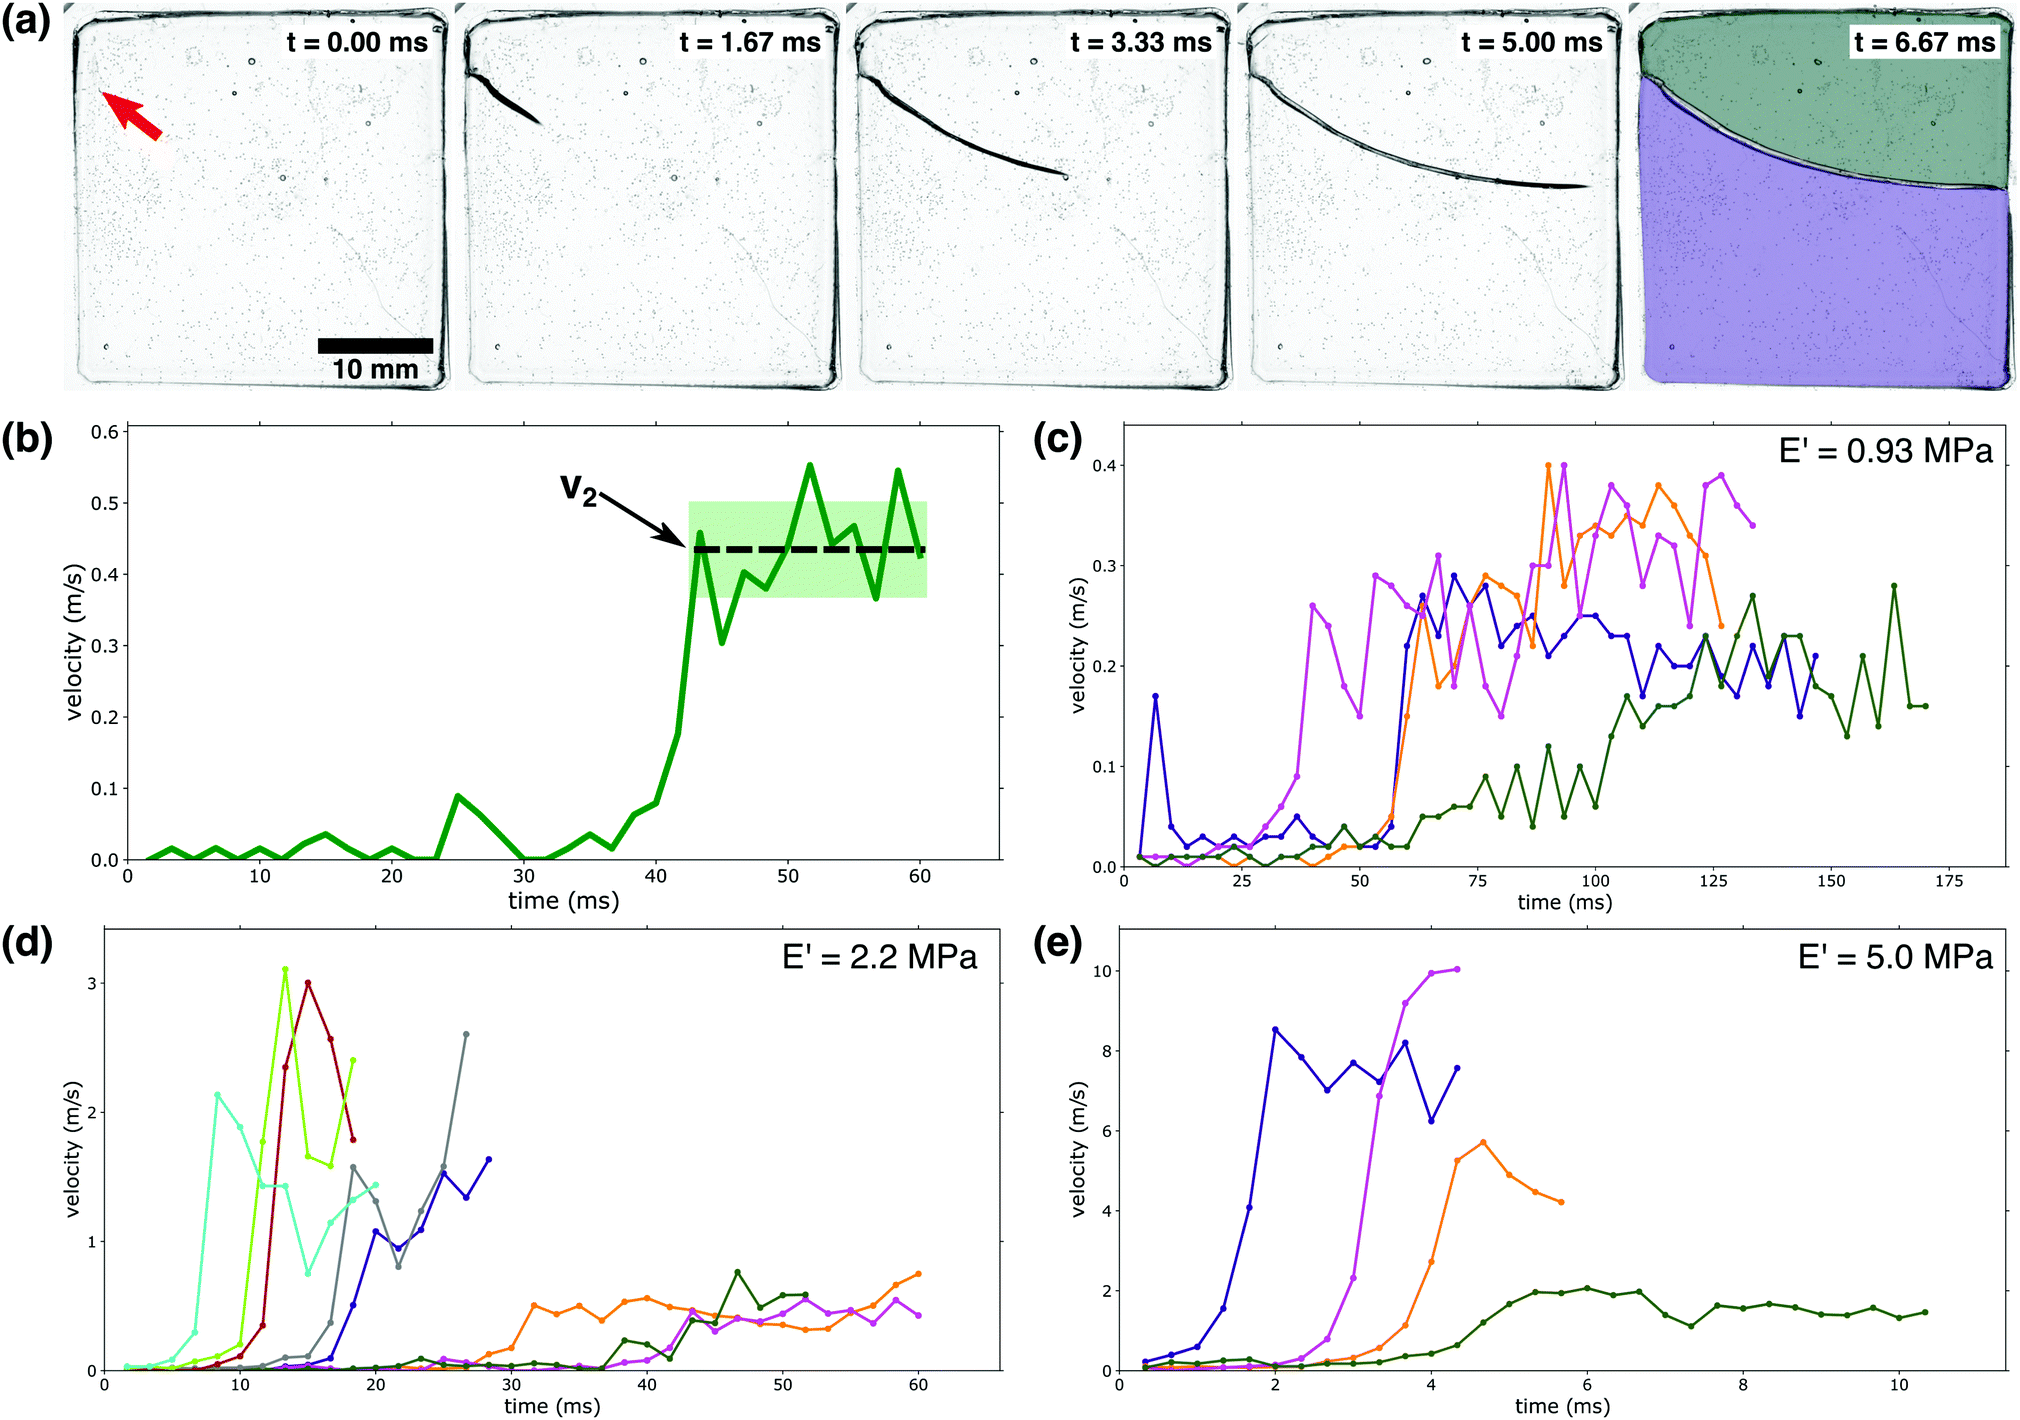 | ||
| Fig. 2 Crack velocity profiles: (a) a high-speed camera was used to capture a PEG-hydrogel (E′ = 5.0 MPa) rupturing violently due to fluid-induced compressive stress. The red arrow in the first panel indicates the initiation point of the running crack. In the final stage, the gel has broken into two separate pieces as indicated by the colored overlays. (b) Identification of v2: as indicated by the dashed line, v2 is demarcated by a large velocity jump followed by a near-constant velocity region. The shaded area indicates the fluctuations in v2; these fluctuations are used to calculate the error bars in Fig. 3a. (c–e) Crack velocity profiles for (c) E′ = 0.93 MPa, (d) E′ = 2.2 MPa, and (e) E′ = 5.0 MPa. Only the first 80% of growth is shown to avoid edge interactions.39 It should be noted that the waiting time is not indicated in c–e; the time depicted here indicates the time elapsed since fracture began. | ||
Fracture behavior was only observed for a limited range of gel moduli, 0.5–5 MPa (3–20 mol percent PEGDA). Softer samples, with moduli below 0.5 MPa (3 mol percent PEGDA) were observed to uniformly swell without fracturing. Samples with moduli above 5 MPa (20 mol percent PEGDA) exhibited little swelling and remained intact, though rare fracture events were observed. These two extremes can be explained by considering the viscoelasticity associated with PEG-networks. As the mol percent of PEGDA decreases, the contribution of the viscous portion of the complex modulus is significantly increased. This is supported by the data in Fig. 1a, where an obvious decrease in E′ is observed with decreasing PEGDA percent. The opposite trend is observed with respect to the loss modulus (E′′). As previously stated, E′′ for a 20 mol percent PEGDA network is roughly 2 × 10⁻² MPa (Fig. S2, ESI†) at ambient conditions while a 5 mol percent PEGDA network has an E′′ value of 5 × 10t – 3 MPa at the same conditions. With this increased contribution of the viscous contribution to the complex modulus at lower PEGDA percents, dissipation of applied stresses and internal relaxations can occur without damage to the network, meaning rupture events or instabilities are not observed at mol percentss below 3 percent PEGDA. At the other extreme, above 20 mol percent PEGDA, the cross-link density and associated E′ are so high that swelling is severely limited and thus no significant stresses build up internally; this eliminates the instabilities that result from swelling.
The rupture of our hydrogel samples was observed to occur as a three-stage process: first the gel imbibes fluid for a ‘waiting time’, τ, with no visible rupture; second, fracture begins as a slow, creep-like process; finally, the rupture velocity rapidly increases to a new higher velocity, v2. The waiting time, τ, occurs on a timescale of hundreds of seconds, while the two-stage rupturing occurs on a time scale of ms; we note that due to the large difference in these timescales, the velocity vs. time plots in Fig. 2c–e do not indicate the waiting time τ. First, we will consider the final two stages of the rupture process where the crack is actively expanding; Fig. 2b illustrates how we define the final crack velocity v2. As shown in Fig. 2c–e, we observed large fluctuations from sample to sample in both the value of v2 as well as the initiation time of the third stage of the rupture process.
To understand the complex rupture process that occurs in our hydrogels, we must first consider how rupture proceeds in a more standard elastic material. All materials are embedded with microscopic cracks, voids, or other flaws; it is the growth of these ‘micro-cracks’ that causes brittle materials to crack into pieces under an applied load. As first derived by Griffith in 1921,40 and later refined by many others,41,42 an energy balance argument can be used to determine lc, the maximum length of a stable microcrack as a function of the boundary stress, σ, elastic modulus, Y, and the energetic cost of creating new surfaces, γ:
| lc ∼ γY/σ2. | (1) |
Cracks that are smaller than lc are stable, while those longer than this are not; it is energetically favorable for cracks larger than lc to spontaneously elongate (we note that eqn (1) may contain a pre-factor that is determined by the precise loading and fracture geometry). Using literature parameters in addition to our measurements, we estimate the order of magnitude of lc to be 0.1 microns (see ESI† for details); this value is consistent with other observations of brittle fracture, e.g. fracture which initiates from a microscopic flaw. The first stage of the gel rupture process is exactly a reflection of this mechanism: the hydrogel samples experience compressive stress when they are immersed in water due to the osmotic pressure gradient; this stress increases as the gel imbibes more fluid and its elastic properties become highly non uniform. Eventually, these stresses become large enough to initiate rupture via expansion of a crack.
Once a crack begins to run in a brittle material, fracture mechanics predicts that it will accelerate until it is growing at the Rayleigh velocity, cR:42
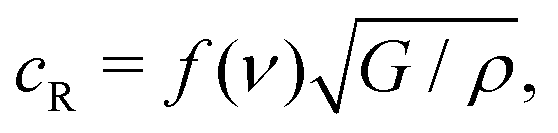 | (2) |
What sets the value of v2? Eqn (2) suggests that the physical parameters that set the value of v2 are the gel modulus and density. As is common for gels, one can assume ν = 0.5, and thus f(ν) = 0.95.43 Using ρ = 1.1 g cm−3 in the unswollen gels, and taking G = E′/3, eqn (2) gives a Rayleigh velocity of 16–37 m s−1 for the range of elastic moduli used in these experiments. We note that the velocities observed in our experiments are significantly lower than this (∼ 0.1cR), but this is quite common in fracture experiments; the Rayleigh velocity is generally thought of as the ‘speed limit’ for a crack, e.g. it represents an upper bound.
Fig. 3a shows that v2 indeed does increase as the gel becomes stiffer, but this increase does not follow the square root dependence predicted by eqn (2). This scaling can be partially understood by considering the uptake of fluid into the gel that occurs during the waiting time τ. The gel swells and imbibes fluid; this does not have an appreciable effect on the gel's modulus (see Fig. 1b), but the gel does decrease in density as it absorbs water. This occurs because the polymer network expands as it imbibes fluid, increasing the gel's volume; additionally, the bulk PEGDA:PEGMEA networks in the unswollen state and immediately after photopolymerization are all more dense than water, so the water absorbed by the network reduces the overall density as the material transitions from an unswollen gel to a hydrogel. These combined effects cause a reduction in density of 10–20% on the timescales associated with the waiting time before fracture occurs, see Fig. S4 (ESI†). The waiting time fluctuated from sample to sample, and is uncorrelated with gel modulus, see inset in Fig. 3a. However, we found that τ was strongly correlated with v2. As shown in Fig. 3b, v2 increases linearly with τ. Though the functional form is incorrect, this behavior is consistent with eqn (2): a larger τ implies more imbibement, and thus a lower density, and therefore a larger crack velocity. We note that while imbibement-induced rupture has not been well-explored, there is a rich literature on the fracture of gels and other polymeric materials in dry environments, and in several studies delayed fracture was observed.46,47 The community has not reached a consensus as to the cause of this delayed fracture; both network inhomogeneities and the timescale of solvent migration have been invoked to explain these phenomena. It is possible that these effects may translate to our system and, coupled with density and modulus changes additionally set the values of τ that we observe.
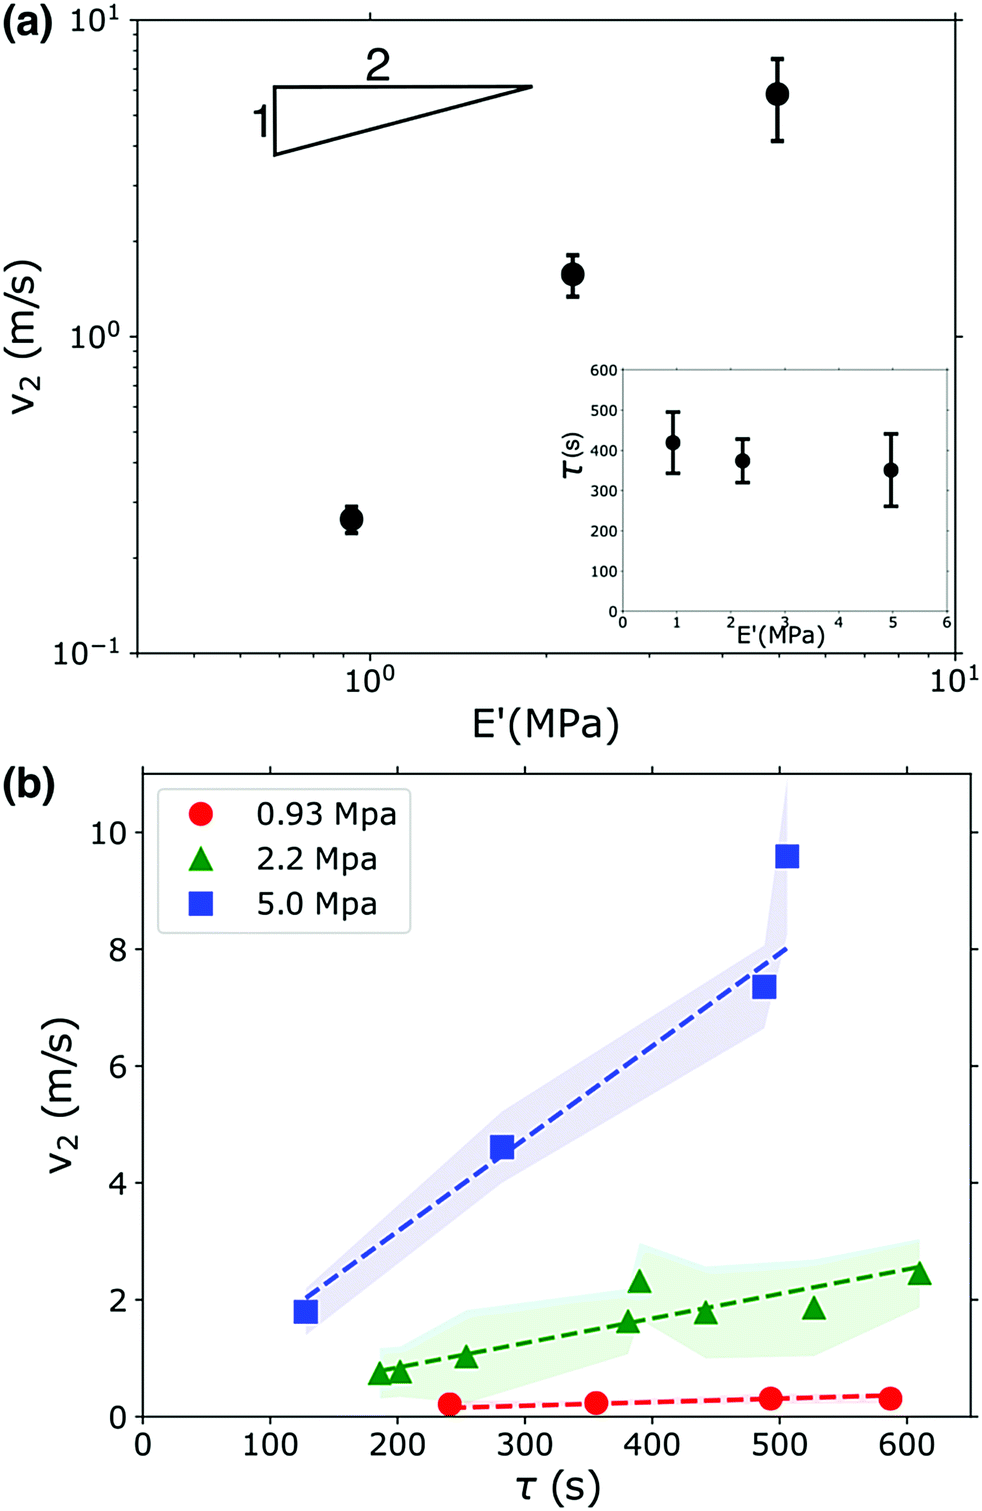 | ||
| Fig. 3 (a) The mean crack velocity, v2, increases with increasing gel modulus. However, v2 does not follow the square root scaling expected for a brittle material (square root slope is indicated by the inset triangle). The lower right inset shows that the waiting time, τ, is uncorrelated with gel modulus. (b) v2 increases linearly with increasing fracture start time, τ; the fluctuations in v2 are indicated by the shaded region. | ||
The dynamic imbibement process studied here is highly complex, resulting in both continuously changing as well as non-uniform material properties, which are potentially competing effects. This complexity is reflected in the atypical fracture behavior we observe, even though (static) unswollen hydrogels are often considered to behave as traditional brittle materials. This work complements prior studies investigating the toughness of hydrogels at different degrees of swelling, which also reveals non-uniform behavior.48 However, as this study reveals, this behavior has been quantified and characterized by engineering fracture (e.g. notching) in swollen specimens and applying a cyclic load. Here we highlight how fracture events arise from the swelling process. This work lays the foundation to fully understand the degree of swelling and internal stress at the onset of fracture during swelling, which may aid in developing a quantitative analysis of imbibement-induced failure events in a future work.
4 Conclusions
Previous studies on PEG-hydrogels have largely focused on characterizing these materials in one of their two equilibrium states: unswollen or swollen. Here, we have examined these materials during the swelling process, with a particular focus on characterizing the dynamics of swelling-induced rupture.As these materials begin to imbibe water, they swell. In highly cross-linked gels (above 20 mol percent PEGDA), this swelling is limited, and little excess stress is built up. In loosely cross-linked gels (below 3 mol percent PEGDA), a large amount of swelling occurs, but this does not lead to a build-up of excess stress, as it is mitigated via viscous dissipation. In between these two extremes however, imbibement leads to accumulation of enough excess stress to cause material failure. This failure is markedly different that what is observed in standard brittle materials, reflecting the complex dynamics that occurs during the swelling process. We observe that fracture occurs as a three-stage process, that includes a waiting period, a slow fracture period, and a final stage in which a rapid increase in the velocity of crack propagation is observed. We find that v2, the crack velocity during the third stage, is controlled by both the material's elastic modulus, and additionally by the duration of the waiting period, which reflects the large changes in material properties that occur during the imbibement and swelling processes.
This work highlights some of the diversity of behaviors that occur during the non-equilibrium swelling process. While we have focused on rupture here, other works have demonstrated that a variety of elastic instabilities occur during the dynamical swelling process.31 Using these results as a starting point, further studies can illuminate how to control or prevent these instabilities and rupture processes, perhaps via material patterning or by altering the nature of the material cross-links.
Conflicts of interest
There are no conflicts to declare.Acknowledgements
During this study, SJC was supported by the College of Engineering Distinguished Scholar Fellowship from Michigan State University.Notes and references
- C. Creton, Macromolecules, 2017, 50, 8297–8316 CrossRef CAS.
- J. Zhu, Biomaterials, 2010, 31, 4639–4656 CrossRef CAS.
- O. Okay, Hydrogel sensors and actuators, Springer, 2009, pp. 1–14 Search PubMed.
- S. Nemir, H. N. Hayenga and J. L. West, Biotechnol. Bioeng., 2010, 105, 636–644 CrossRef CAS.
- M. S. Shoichet, Macromolecules, 2010, 43, 581–591 CrossRef CAS.
- S. R. Caliari and J. A. Burdick, Nat. Methods, 2016, 13, 405–414 CrossRef CAS.
- J. H. Galarraga and J. A. Burdick, Nat. Mater., 2019, 18, 914–915 CrossRef CAS.
- T. Tanaka and D. J. Fillmore, J. Chem. Phys., 1979, 70, 1214–1218 CrossRef CAS.
- U. K. de Silva and Y. Lapitsky, ACS Appl. Mater. Interfaces, 2016, 8, 29015–29024 CrossRef CAS.
- A. Ilseng, V. Prot, B. H. Skallerud and B. T. Stokke, J. Mech. Phys. Solids, 2019, 128, 219–238 CrossRef CAS.
- Y. Wang, Q. Chen, M. Chen, Y. Guan and Y. Zhang, Polym. Chem., 2019, 10, 4844–4851 RSC.
- M. Curatolo, P. Nardinocchi, E. Puntel and L. Teresi, J. Appl. Phys., 2017, 122, 145109 CrossRef.
- R. Takahashi, Y. Ikura, D. R. King, T. Nonoyama, T. Nakajima, T. Kurokawa, H. Kuroda, Y. Tonegawa and J. P. Gong, Soft Matter, 2016, 12, 5081–5088 RSC.
- Z. Liu, W. Toh and T. Y. Ng, Int. J. Appl. Mech., 2015, 7, 1530001 CrossRef.
- A. B. Imran, T. Seki and Y. Takeoka, Polym. J., 2010, 42, 839–851 CrossRef.
- J. Guo, A. T. Zehnder, C. Creton and C.-Y. Hui, Soft Matter, 2020, 16, 6163–6179 RSC.
- X. Zhao, Soft Matter, 2014, 10, 672–687 RSC.
- J. Gong, Y. Katsuyama, T. Kurokawa and Y. Osada, Adv. Mater., 2003, 15, 1155–1158 CrossRef CAS.
- J.-Y. Sun, X. Zhao, W. R. K. Illeperuma, O. Chaudhuri, K. H. Oh, D. J. Mooney, J. J. Vlassak and Z. Suo, Nature, 2012, 489, 133–136 CrossRef CAS.
- A. R. Kannurpatti, J. W. Anseth and C. N. Bowman, Polymer, 1998, 39, 2507–2513 CrossRef CAS.
- S. A. Chester, Soft Matter, 2012, 8, 8223–8233 RSC.
- J. Cheng, Z. Jia, H. Guo, Z. Nie and T. Li, J. Mech. Phys. Solids, 2019, 124, 143–158 CrossRef CAS.
- J. Tang, J. Li, J. J. Vlassak and Z. Suo, Extreme Mech. Lett., 2017, 10, 24–31 CrossRef.
- S. Chatani, C. J. Kloxin and C. N. Bowman, Polym. Chem., 2014, 5, 2187–2201 RSC.
- N. M. Cativa, M. S. Alvarez Cerimedo, J. Puig, G. F. Arenas, F. Trabadelo, M. A. Ayude, M. A. Zensich, G. M. Morales, W. F. Schroeder, H. E. Romeo and C. E. Hoppe, Mol. Syst. Des. Eng., 2019, 4, 133–143 RSC.
- S. J. Bryant, K. D. Hauch and B. D. Ratner, Macromolecules, 2006, 39, 4395–4399 CrossRef CAS.
- N. Bosnjak, S. Nadimpalli, D. Okumura and S. A. Chester, J. Mech. Phys. Solids, 2020, 137, 103829 CrossRef CAS.
- P. J. Flory and B. Erman, Macromolecules, 1982, 15, 800–806 CrossRef CAS.
- P. J. Flory, J. Chem. Phys., 1941, 9, 660 CrossRef CAS.
- M. L. Huggins, J. Chem. Phys., 1941, 9, 440 CrossRef CAS.
- T. Tanaka, S.-T. Sun, Y. Hirokawa, S. Katayama, J. Kucera, Y. Hirose and T. Amiya, Nature, 1987, 325, 796–798 CrossRef CAS.
- D. Okumura, A. Kondo and N. Ohno, J. Mech. Phys. Solids, 2016, 90, 61–76 CrossRef.
- N. Cohen and R. M. McMeeking, J. Mech. Phys. Solids, 2019, 125, 666–680 CrossRef CAS.
- K.-I. Hoshino, T. Nakajima, T. Matsuda, T. Sakai and J. P. Gong, Soft Matter, 2018, 14, 9693–9701 RSC.
- K. S. Anseth, L. M. Kline, T. A. Walker, K. J. Anderson and C. N. Bowman, Macromolecules, 1995, 28, 2491–2499 CrossRef CAS.
- S. Kalakkunnath, D. S. Kalika, H. Lin and B. D. Freeman, J. Polym. Sci., Part B: Polym. Phys., 2006, 44, 2058–2070 CrossRef CAS.
- T. Keim and K. Gall, J. Biomed. Mater. Res., Part A, 2010, 92, 702–711 CrossRef.
- R. Subramani, A. Izquierdo-Alvarez, P. Bhattacharya, M. Meerts, P. Moldenaers, H. Ramon and H. Van Oosterwyck, Front. Mater., 2020, 7, 212 CrossRef.
- T. Goldman, A. Livne and J. Fineberg, Phys. Rev. Lett., 2010, 104, 114301 CrossRef.
- A. A. Griffith, Philos. Trans. R. Soc., A, 1921, 163–198 Search PubMed.
- J. Fineberg and M. Marder, Phys. Rep., 1999, 313, 1–108 CrossRef CAS.
- L. B. Freund, Dynamic fracture mechanics, Cambridge university press, 1998 Search PubMed.
- L. Rayleigh, Proceedings of the London Mathematical Society, 1885, s1-17, 4–11 CrossRef.
- A. Livne, G. Cohen and J. Fineberg, Phys. Rev. Lett., 2005, 94, 224301 CrossRef CAS.
- R. D. Deegan, P. J. Petersan, M. Marder and H. L. Swinney, Phys. Rev. Lett., 2001, 88, 014304 CrossRef.
- D. Bonn, H. Kellay, M. Prochnow, K. Ben-Djemiaa and J. Meunier, Science, 1998, 280, 265–267 CrossRef.
- X. Wang and W. Hong, Soft Matter, 2012, 8, 8171–8178 RSC.
- E. Zhang, R. Bai, X. P. Morelle and Z. Suo, Soft Matter, 2018, 14, 3563–3571 RSC.
Footnotes |
| † Electronic supplementary information (ESI) available. See DOI: 10.1039/d0sm01718c |
| ‡ Joint first authors. |
| This journal is © The Royal Society of Chemistry 2021 |