 Open Access Article
Creative Commons Attribution 3.0 Unported Licence
Molecular dynamics and crystallization in polymers based on ethylene glycol methacrylates (EGMAs) with melt memory characteristics: from linear oligomers to comb-like polymers†
Olga
Vassiliadou
 a,
Varvara
Chrysostomou
 b,
Stergios
Pispas
 b,
Panagiotis A.
Klonos
 a and
Apostolos
Kyritsis
 *a
*a
aDepartment of Physics, National Technical University of Athens, Zografou Campus, 15780, Athens, Greece. E-mail: akyrits@central.ntua.gr
bTheoretical and Physical Chemistry Institute, National Hellenic Research Foundation, 48 Vassileos Constantinou Avenue, 11635 Athens, Greece
First published on 24th November 2020
Abstract
In this article we present results on the glass transition, crystallization and molecular dynamics in relatively novel oligomers, oligo-ethylene glycol methacrylate (OEGMA), with short and long chains, as well as in the corresponding nanostructured comb-like polymers (POEGMA, short and long), the latter being prepared via the RAFT polymerization process. For the investigation we employed conventional and temperature modulated differential scanning calorimetry in combination with high resolving power dielectric spectroscopy techniques, broadband dielectric relaxation spectroscopy (BDS) and thermally stimulated depolarization currents (TSDC). Under ambient conditions short OEGMA (475 g mol−1, ∼4 nm in length) exhibits a remarkable low glass transition temperature, Tg, of −91 °C, crystallization temperature Tc = −24 °C and a significant crystalline fraction, CF, of ∼30%. When doubling the number of monomers (OEGMA-long, 950 g mol−1, chain length ∼8 nm) the Tg increases by about 20 K and CF increases to ∼53%, whereas, the Tc migrates to a room-like temperature of 19 °C. Upon formation of comb-like POEGMA structures the grafted OEGMA short chains, strikingly, are not able to crystallize, while in POEGMA-long the crystallization behaviour changes significantly as compared to OEGMA. Our results indicate that in the comb-like architecture the chain diffusion of the amorphous fractions is also strongly affected. The semicrystalline systems exhibit significant melt memory effects, this being stronger in the comb-like architecture. It is shown that these effects are related to the inter- and intra-chain interactions of the crystallizable chains. The dielectric techniques allowed the molecular dynamics mapping of these new systems from the linear oligomers to POEGMAs for the first time. BDS and TSDC detected various dynamics processes, in particular, the local polymer dynamics (γ process) to be sensitive to the Tg, local dynamics triggered in the hydrophilic chain segments by water traces (β), as well as the segmental dynamics (α) related to glass transition. Interestingly, both the short and long linear OEGMAs exhibit an additional relaxation process that resembles the Normal-Mode process appearing in polyethers. In the corresponding POEGMAs this process could not be resolved, this being an effect of the one-side grafted chain on the comb backbone. The revealed variations in molecular mobility and crystallization behavior suggest the potentially manipulable diffusion of small molecules throughout the polymer volume, via both the molecular architecture as well as the thermal treatment. This ability is extremely useful for these novel materials, envisaging their future applications in biomedicine (drug encapsulation).
1. Introduction
Poly(oligo ethylene glycol methacrylate) (POEGMA), the material of interest here, belongs to a class of polymers demonstrating ‘graft-like’ structures composed of carbon–carbon backbones (hydrophobic) and multiple oligo(ethylene glycol) side-chains (branches)1–3 which are hydrophilic. Such materials are usually addressed as brush- or comb-like polymers4–8 being the nonlinear poly(ethylene glycol) (PEG) analogues.2 For short side chains, which occur for less than ∼10 ethylene glycol units, the POEGMA homopolymers are considered thermoresponsive, as upon thermally induced dehydration they undergo a nano-phase transition.2,9 This transition is due to the distinct chemical nature between the backbone and the branches so that, in the presence of solvents, selective chain associations are favored (nano-domain formation).10–13 The nano-phase transition occurs, however, without POEGMA exhibiting formation of inter- and/or intra-chain hydrogen bonds between the side chains (branches, ethylene glycol-like). Nevertheless, for longer side chains, POEGMA homopolymers lose their thermoresponsive character due to the domination of side chain associations and the formation of crystalline domains above a critical length of PEG side chains. The specific features of PEG side chain crystallization in the morphology of brush copolymers has gained significant attention during the last few years,6,14 indicating the continued interest in the morphological behavior of this rather unique polymer.Brush copolymers consisting of an amorphous main chain and crystallizable side chains can phase separate into a variety of morphologies resulting in copolymers with interesting properties.5,8,15–17 The crystallization behavior of such brush polymers has been investigated in the past decades by various groups, and according to the generally most accepted model the main chain and a fraction of side chains in the vicinity of the main chain constitute the amorphous phase whereas the side chains are incorporated into crystalline lamella separated by amorphous domains.5,16 It is widely accepted that factors such as the backbone rigidity, the nature of the linking groups, and the length of the side chains affect significantly the side chain crystallization.5,18 In the case of PEG side chains, the reported results have indicated that the crystallization temperature, Tc, decreases as compared to linear long PEG [poly(ethylene oxide), PEO] macromolecular chains and the degree of supercooling depends strongly on the length of the side chains, with Tc ranging from slightly below 0 °C to about 65 °C.6,14–16 Furthermore, it has been shown that crystallization in the brush copolymers was hindered by frustration in packing of the crystallizable PEG chains which can be realized either in the interdigitating or the end-to-end form.5,15
PEO has been widely employed as a crystallizable block copolymer component, in various polymer architectures like, for example, block-copolymers and star-like structures, leading to a great diversity of literature reports on its crystallization temperature as a function of morphology,6 usually far below the PEO equilibrium melting temperature, Tm, of 76 °C.19 The dynamic crystallization of homogeneously nucleated PEO nanodroplets has been reported in the range between −30 and −45 °C (peak crystallization temperatures during cooling from the melt), i.e. quite close to the glass transition temperature, Tg, for small PEO microdomains.20 Interestingly, when confining bulk PEO in self-ordered nanoporous anodic aluminum oxide (AAO) with a pore diameter of 25 nm, the homogeneous nucleation crystallization temperature has been observed to be as low as −38.8 °C.21 Strong PEO supercooling effects have usually been interpreted as manifestations of the homogeneous nucleation process for PEO chains. For PEO homopolymers, similarly to other macromolecules, the heterogeneous nucleation process has been suggested as the main crystallization mechanism.22 However, it has been demonstrated that ‘melt memory effects’ lead to a special case of homogeneous nucleation for PEO homopolymers as well as other macromolecules.2 The melt memory is a common phenomenon in polymer crystallization where recrystallization of a semicrystalline polymer depends strongly on the existence of the so-called “melt structure” of its previous molten state.22–25 Depending on the temperature of the melt and/or the annealing time in the molten state, the molten state may retain a “melt structure” with preserved orientation of the chains. This orientation originates initially from the chain conformations in the crystalline structures or is produced by sticky chain associations of the chains in the melt, due to inter-chain segmental contacts, for example via formation of inter/intramolecular hydrogen bonds or other types of weak forces.22,26,27 During re-crystallization of the macromolecular chains, an increase in Tc (and the crystallization rate) is observed, caused by a self-nucleation process, and the effect is known as the melt memory effect. The strength and specific features of the melt memory effect may offer an additional tool for assessing the degree of complexity in the macromolecular structure and dynamics of various chain architectures due to the existing chain associations and structural constraints.
In the present work we investigate, for the first time, the crystallization behavior, thermal transitions and molecular dynamics of POEGMA homopolymers with PEG side chains of two different and rather short lengths. Such materials aim at drug delivery applications, therefore the deeper scope here is the extraction of information on the ability to tune the crystallinity parameters as well as the diffusion of small molecules (ions, water, drug solutions) via these materials. In order to study the chain architecture effects, i.e. that the crystallizable chain is anchored to the polymer backbone, the corresponding free oligomeric chains (OEGMA) will be studied in parallel. The results of this study will be discussed also in the light of recent findings in similar oligomers.28,29 Among the most effective tools for studying molecular dynamics in polymers are the dielectric spectroscopy techniques30–34 and, thus, this technique is employed here. To the best of our knowledge experimental results concerning the molecular dynamics, crystallization behavior and thermal transitions (glass transition), demonstrating the changes from OEGMAs to comb-like POEGMAs with very short PEG chains, have not been reported yet. More specifically, we investigate the crystallization, glass transition and molecular dynamics of linear OEGMA with short (degree of polymerization, dp = 8–9) or longer (dp = 19) chains in parallel with comb-like POEGMAs consisting of short or long OEGMA branches (i.e. totally four compositions). For this work, we employ differential scanning calorimetry (DSC), of the conventional as well as the temperature-modulation mode (TMDSC), and broadband dielectric relaxation spectroscopy (BDS), supplemented by another special dielectric technique in the temperature domain, thermally stimulated depolarization currents (TSDC). Emphasis is given also on memory effects recorded on the crystallization behaviour of both the oligomers and the brush copolymers, where inter-chain interactions and structural constraints are expected to play a dominant role. The systems are studied upon equilibration unde room conditions (temperature and humidity), upon subjection to different melting/crystallization conditions and, especially for molecular dynamics, upon mild drying.
2. Materials and methods
2.1. Materials and synthesis
Four samples are studied here, shown schematically in Scheme 1, namely two commercial linear OEGMAs (Sigma-Aldrich) with short (475 g mol−1, dp = 8–9, ∼4 nm, OEGMA-short)35 and long (950 g mol−1, dp = 19 ∼8 nm, OEGMA-long) chains and two comb-like polymers, POEGMA-short and POEGMA-long, consisting of 10 branches on average, that are the linear OEGMA-short and OEGMA-long, respectively. The POEGMAs were synthesized using the abovementioned short and long oligomers via the reversible addition–fragmentation chain transfer (RAFT) polymerization process (Scheme 2). It should be noted that PMMA/PEG polymer blends are reported to be miscible above the Tm for PEG,15 therefore, the main and side chains in these graft copolymers are expected to be molecularly homogeneous when PEG is melted.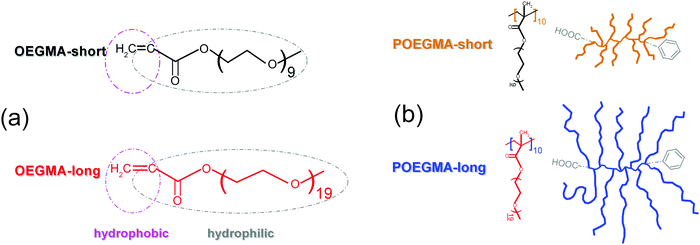 | ||
| Scheme 1 Structure of the systems under investigation, namely (a) the linear oligomers OEGMA-short and OEGMA-long and (b) the corresponding comb-like polymers POEGMA-short and POEGMA-long. | ||
The OEGMAs were purified by mixing with inhibitor remover resins (Aldrich #311332), via stirring for 5 min, and subsequently the inhibitor remover resins were removed by filtration.
In order to prepare POEGMA polymers with short35 and long side chains, reversible addition fragmentation chain transfer polymerization (RAFT polymerization) was employed, using 4-cyano-4-(phenylcarbonothioylthio)pentanoic acid (CPAD) as the chain transfer agent (CTA), 2,2-azobis(isobutyronitrile) (AIBN) as the radical source, to a CTA to initiator ratio ([CTA]0/[I]o) of 5![[thin space (1/6-em)]](https://www.rsc.org/images/entities/char_2009.gif) :
:![[thin space (1/6-em)]](https://www.rsc.org/images/entities/char_2009.gif) 1 and 1,4-dioxane as the polymerization solvent. Before the polymerization reaction, the OEGMA monomers (Mn = 475 g mol−1 and Mn = 950 g mol−1) were purified using a filled column including inhibitor removers (butylated hydroxytoluene and hydroquinone monomethyl ether, obtained from Sigma-Aldrich). AIBN was purified by recrystallization from methanol, CTA was used as received (Sigma-Aldrich) and 1,4-dioxane (99.8%) was dried over molecular sieves. The reaction was carried out for 24 h, under an inert atmosphere, at 70 °C (Scheme 2). After the polymerization, the reaction was quenched by cooling the solution at low temperature (−20 °C) and upon exposure to air. The resulting polymers were purified by precipitation in n-hexane excess twice. In the case of POEGMA-long, further purification was required, hence it was dialyzed against distilled water using a dialysis tubing cellulose membrane of 3500 Da MWCO to remove unreacted oligomer. The polymers were dried in a vacuum oven for 48 h at room temperature and then size exclusion chromatography (SEC) was implemented to determine the average molecular weights and molecular weight distributions.
1 and 1,4-dioxane as the polymerization solvent. Before the polymerization reaction, the OEGMA monomers (Mn = 475 g mol−1 and Mn = 950 g mol−1) were purified using a filled column including inhibitor removers (butylated hydroxytoluene and hydroquinone monomethyl ether, obtained from Sigma-Aldrich). AIBN was purified by recrystallization from methanol, CTA was used as received (Sigma-Aldrich) and 1,4-dioxane (99.8%) was dried over molecular sieves. The reaction was carried out for 24 h, under an inert atmosphere, at 70 °C (Scheme 2). After the polymerization, the reaction was quenched by cooling the solution at low temperature (−20 °C) and upon exposure to air. The resulting polymers were purified by precipitation in n-hexane excess twice. In the case of POEGMA-long, further purification was required, hence it was dialyzed against distilled water using a dialysis tubing cellulose membrane of 3500 Da MWCO to remove unreacted oligomer. The polymers were dried in a vacuum oven for 48 h at room temperature and then size exclusion chromatography (SEC) was implemented to determine the average molecular weights and molecular weight distributions.
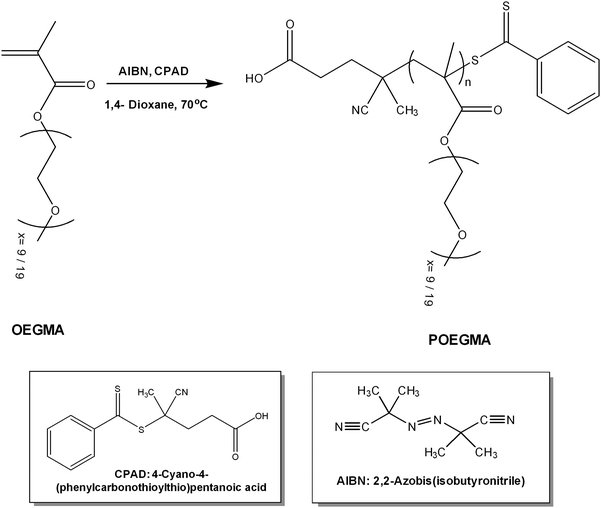 | ||
| Scheme 2 Synthesis route for poly(oligo ethylene glycol methacrylate) via RAFT polymerization (POEGMA short x = 9, POEGMA long x = 19). | ||
All samples were studied mainly as received (ambient conditions), whereas in selected cases they were studied upon further drying. The latter was achieved by letting the sample to equilibrate at a low relative humidity of ∼2 rh%, over phosphorus pentoxide (P2O5) in a sealed glass desiccator.
The main structural characteristics of the samples under investigation are listed in Table 1.
| Sample | M w (g mol−1) | L chain (nm) | Scan 1 | Scan 2 | TMDSC | ||||||||
|---|---|---|---|---|---|---|---|---|---|---|---|---|---|
| T g (°C) | Δcp (J g−1 K−1) | T g (K) | Δcp (J g−1 K−1) | T c (°C) | ΔHc (J g−1) | CFPEG (wt) | T m (°C) | ΔHm (J g−1) | T g (°C) | Δcp (J g−1 K−1) | |||
| OEGMA-short | 475 | 3.9 | −91 | 0.16 | −91 | 0.17 | −24 | 58 | 0.30 | −31/−7 | 52 | −90 | 0.22 |
| OEGMA-long | 950 | ∼8 | −71 | 0.13 | −70 | 0.13 | 19 | 104 | 0.53 | 34 | 107 | −73 | 0.16 |
| POEGMA-long | 9500 | ∼8 | −61 | 0.24 | — | — | −4 | 93 | 0.47 | 36 | 106 | −63 | 0.19 |
| POEGMA-short | 5000 | 3.9 | −70 | 0.89 | −70 | 0.89 | — | 0 | 0 | — | 0 | −69 | 0.85 |
2.2. Characterization methods
Totally three (3) thermal protocols for conventional DSC were applied and are described in the following: (scan 1, partial melting for some samples) Cooling from 40 °C to −140 °C at 10 K min−1 and heating to 70 °C at 10 K min−1, (scan 2, well melting) cooling from 70 °C to −140 °C at 10 K min−1 and heating to 70 °C at 10 K min−1, (scan 3, isothermal annealing above melting) melting of the samples for 10 min at different temperatures (e.g. 0–40 K) above their melting temperature, cooling to −150 °C at 10 K min−1 and subsequent heating at 10 K min−1. The measurements indicated as scan 3 aimed at the study of melt memory effects in the polymers of this work. Finally, all samples were investigated by DSC of the Temperature-Modulation mode37 (TMDSC) with a heating rate of 2 K min−1, a temperature amplitude of 1 K, and a modulation period of 60 s, in the temperature range from −140 to 40 °C, on fresh samples of ∼12 mg in mass placed into Tzero aluminium TA pans.
BDS results were analyzed by fitting model functions30,38 to the experimental data in order to evaluate the time scale (temperature dependence of the frequency maxima of dielectric loss), the dielectric strength and the shape parameters of the recorded relaxations.30 To that aim, we employed the Havriliak–Negami (HN) equation39
 | (1) |
 | (2) |
 | (3) |
3. Results and discussion
3.1. Crystallization and glass transition – calorimetry
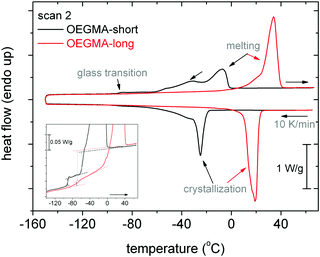
Fig. 1 shows the DSC thermograms of scan 2, i.e. cooling from 70 °C to −140 °C at 10 K min−1 and heating to 70 °C at 10 K min−1, during heating and cooling for OEGMA-short and OEGMA-long. Both samples exhibit crystallization (exothermic peaks) during cooling and glass transition (step) and melting (endothermic peaks) during heating. The respective characteristic values by DSC can be found in Table 1.OEGMA-short crystallizes at Tc = −24 °C, exhibits a glass transition at a remarkable very low temperature, Tg ∼ −91 °C, and complex melting peaks between −60 and −2 °C, with the maxima being located at Tm1 = −31 °C and Tm2 = −7 °C. The enthalpy of crystallization, ΔHc, is equal to 58 J g−1. To make an estimation of the crystalline fraction, CF, we compare ΔHc with the enthalpy of fusion of a known polymer with the more similar structure to that of OEGMA, namely PEG, with ΔHPEG = 197 J g−1.36 We may report that in the literature different ΔHPEG values have been used, for example 188 J g−1![[thin space (1/6-em)]](https://www.rsc.org/images/entities/char_2009.gif) 8 (and references therein), being however in a similar range to the value employed here. Thus, the crystalline fraction of OEGMA-short is estimated based on PEG to equal CFPEG = 0.30 wt (Table 1). In the inset to Fig. 1, the glass transition step of OEGMA-short is quite sharp and demonstrates an overshoot at the high-temperature side. Such overshoots are generally observed for flexible chains (polymers) and have been correlated with structural relaxation.41 These characteristics along the low Tg, in general, denote the expected enhanced mobility for OEGMA-short chains in the glassy state.42
8 (and references therein), being however in a similar range to the value employed here. Thus, the crystalline fraction of OEGMA-short is estimated based on PEG to equal CFPEG = 0.30 wt (Table 1). In the inset to Fig. 1, the glass transition step of OEGMA-short is quite sharp and demonstrates an overshoot at the high-temperature side. Such overshoots are generally observed for flexible chains (polymers) and have been correlated with structural relaxation.41 These characteristics along the low Tg, in general, denote the expected enhanced mobility for OEGMA-short chains in the glassy state.42
On the other hand, the OEGMA-long chain (Fig. 1) crystallizes at the significantly elevated temperature Tc = 19 °C, i.e. more than 40 K higher than that of OEGMA-short. It should be marked that the latter Tc value is highly suppressed as compared to that of linear PEO chains.6 OEGMA-long demonstrates a larger degree of crystallinity, equal to CFPEG = 0.53 wt (Table 1). Then, Tg of OEGMA-long is −70 °C, i.e. by 21 K higher than that of OEGMA-short, accompanied by a quite more broad range of relaxation times, as reflected in the wide glass transition step. At higher temperatures, ∼34 °C (Fig. 1), the melting of crystals is recorded for OEGMA-long, which is ∼40 K higher than OEGMA-short.
The first clear effect recorded by DSC is that of the additive contribution of linear chain length on the degree (CFPEG increases) as well as the nucleation (Tc elevates) of crystallinity. The increased Tg in OEGMA-long should be the combined result of the longer chain length43 (according to the Fox-Flory prediction of MW dependence of Tg) and that of the increased crystallinity,44 with the second factor expected to impose the most serious constraints on the amorphous chain diffusion.
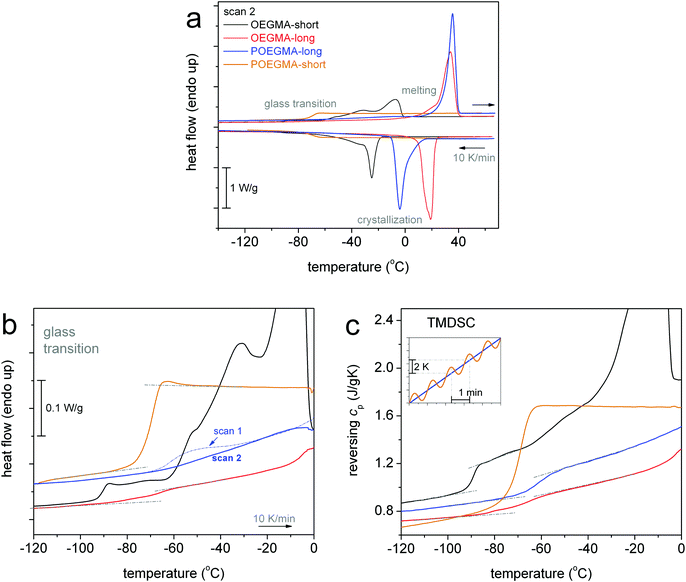
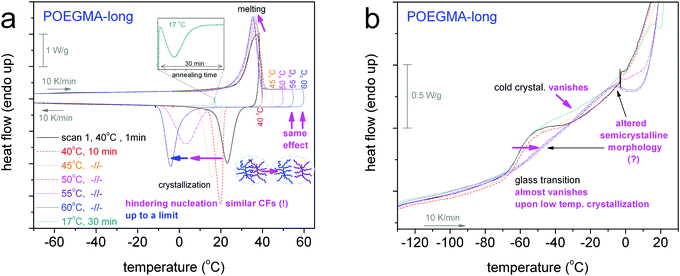
The focus in now turned on the thermal transitions of the comb-like polymers viaFig. 2. Therein, the cooling/heating DSC scans for the two POEGMAs are comparatively shown with those for OEGMAs. In Fig. 2a, POEGMA-long exhibits a single crystallization peak at −4 °C, i.e. 23 K lower than its homologue oligomer OEGMA-long, and melting at ∼36 °C. Surprisingly, we cannot distinguish a clear glass transition step in Fig. 2b for PEOGMA-long during scan 2 despite the fact that CFPEG equals 0.47 wt, being smaller than that of the corresponding oligomer. Interestingly, when looking back at the results for scan 1 for the same sample (dashed–dotted line in Fig. 2b), a clear glass transition step is revealed at −61 °C (Table 1). We recall that the only difference between the measurements of scan 1 and scan 2 is that of the different initial temperature prior to the cooling, namely, 40 °C and 70 °C for scan 1 and scan 2, respectively. A full temperature range comparison between scans 1 and 2 (as well as upon fast cooling) can be found in Fig. S1 in the ESI.† Therein, the difference in the initial temperature, from 40 to 70 °C, had resulted also in a significant change in Tc, namely from 21 to −4 °C, respectively. We will come back to this interesting point in the next section (melt memory effect).
Coming to POEGMA-short in Fig. 2, the sample demonstrates a completely amorphous character, as neither crystallization nor melting peaks are recorded. Instead, a strong glass transition step at Tg = −70 °C with a large change in heat capacity Δcp = 0.89 J g−1 is recorded as the unique thermal transition of POEGMA-short. The values are identical for scans 1–3 (not shown) denoting independency of the glass transition from the initial temperature and the cooling rate, in contrast to POEGMA-long. The values for the Tg and Δcp have been checked also by the more advanced technique of TMDSC (Fig. 2c) and were found to be similar to those by the conventional DSC (Table 1). Interestingly, the recorded value of Δcp for the fully amorphous POEGMA-short is in perfect agreement with the Δcp value calculated for the amorphous PEG chains of the brush polymer taking into account the value that has been suggested for fully amorphous PEO (0.97 J g−1 K−1)45 and the weight fraction of PEG side chains in the POEGMA-short macromolecule (∼0.82 wt).
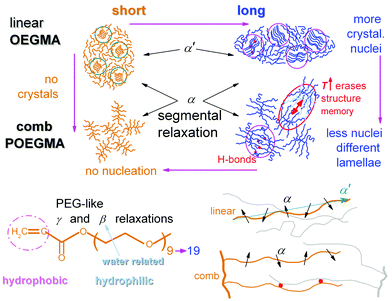
Combining all results on crystallization together up to this point, we conclude to Fig. 3. In Fig. 3a, it becomes clear that by doubling the length of linear OEGMAs from ∼4 to ∼8 nm both the Tc and CFPEG increase, indicating that the number of crystal nuclei increases and, most probably, the thickness of the crystalline lamella, as is also suggested by the simultaneous increase of Tm (Fig. 3b). Nucleation seems to be hindered when going from linear OEGMA-long to comb-like POEGMA-long, as Tc decreases along with CFPEG. At the same time Tm seems to be almost unchanged in Fig. 3b. The effect can be rationalized considering the different morphologies of the two samples (inset schemes in Fig. 3a) and, consequently, the different constraints imposed on the spatial distribution of the polymer chains and their packing manners, along with the impact of these morphologies on the expected inter-chain interactions (polar interactions) between the OEGMA chains.2 Coming to POEGMA-short, again on the basis of the schematic scenario of Fig. 3a, we propose that the short-branched comb entities of POEGMA-short preclude the formation of similar lamellar packing, in contrast to the rest of the cases, including that of OEGMA-short. In addition, in the case of POEGMA-short we could conclude that either no nucleation takes place, due to quite a small number of initial contact points, or that the crystallizable chains fail to be integrated into growing crystals due to significant geometrical constraints.14
3.2. Melt memory effects in crystallization behavior
Previously we commented on the different Tc between the semicrystalline samples and the effect of the cooling rate for a given sample; more interestingly, on the effect of different initial temperatures, Tinitial, above Tm (40 °C for scan 1 and 70 °C for scan 2) on the Tc for POEGMA-long. Looking back to the data for all semicrystalline samples and comparing between scans 1 and 2, we observed similar behaviors.To follow further this phenomenon, we performed for all semicrystalline samples further DSC measurements (scans 3), namely by increasing gradually Tinitial by 5 K (always in the molten state), performing 10 min isothermal annealing there, and cooling to −150 °C at 10 K min−1. For POEGMA-long, we additionally performed a 30 min isothermal annealing at 17 °C, i.e. below its melting point and almost at the onset of its crystallization (melt- or hot-crystallization annealing). The results by these measurements are shown in Fig. 4–6.
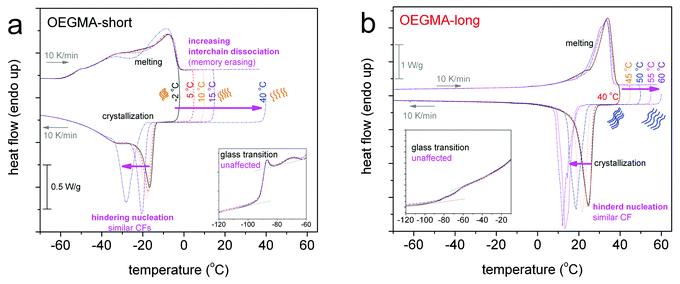
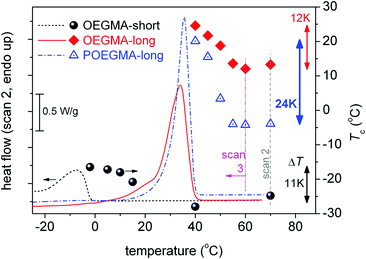
Fig. 4 shows the results by scans 3 for the two linear oligomers. In both cases the elevation of Tinitial results in the significant lowering of Tc by up to 11 K for OEGMA-short and 12 K for OEGMA-long (vertical double arrows in Fig. 5). At the same time CFPEG remains unchanged and Tm decreases by a few K. This effect can be understood by invoking the concept of annealing in a non-isotropic melt and subsequent recrystallization of the semi-crystalline polymers via the self-nucleation mechanism (melt memory effect). Annealing at Tinitial (Tinitial being close to, however, above the melting peak in DSC scans) the thermal history of the sample is not completely erased and the recrystallization during cooling is accelerated via a self-nucleation process. The lower the value of Tinitial, the higher the Tc upon cooling from the annealing stage, indicating a stronger nucleation effect.22,24 Thus, the observed suppressions in Tc with an increase in the annealing temperature denote the retarded self-nucleation process that, in our case, may be correlated with the inter-chain interactions and chain–chain associations.22,26 With increasing Tinitial above Tm, the linear OEGMA chains seem to be gradually dissociated from each other (inset schemes in Fig. 4 and 6), revealing, thus, a structured molten state. The crystallization behavior of the oligomers is more clearly shown in Fig. 5, where the heating DSC scans of the oligomers (scan 2) are plotted together with the Tc values recorded during cooling after annealing for 10 min at various temperatures (Tinitial, in scan 3). The data of Tinitial in Fig. 5 are in the so-called self-nucleation domain, i.e. Tinitial is at temperatures where the endothermic melting peak completely disappears in the DSC heating scan.22,27 We observe that for OEGMA-long the thermal history is erased by annealing at temperatures of about 20 K above the end of the melting event, whereas, interestingly, for OEGMA-short the corresponding critical temperature elevation seems to be higher than 20 K in Fig. 5. The strength of the melt-memory effect can be indicated by the maximum recorded value of ΔT = Tc − Tc,isomelt, where Tc is the value recorded in scan 3 measurements and Tc,isomelt the saturated value of Tc when the sample is cooled from its isotropic melt, i.e. with no “memory structure”.22,27 The data in Fig. 5 suggest that melt-memory effects are of comparable strength in the oligomers.
Since Tm does not change significantly and, furthermore, glass transition is also unchanged (neither in the position nor in strength, insets to Fig. 4), we expect similar semicrystalline morphology, namely in the size, number, and distribution of crystals,46–48 for different Tinitial.
The situation in the semicrystalline comb-like polymer POEGMA-long (Fig. 6) is even more interesting. The increase of Tinitial up to 45 °C leads to similar effects to that in the linear oligomers. For a further increase in Tinitial to 50 and 55 °C, Tc drops rapidly to 3 and −4 °C, respectively. The phenomenon does not proceed with a further increase in Tinitial to be 60 and 70 °C, suggesting that 55 °C is the lower temperature for complete chain–chain dissociation (Fig. 5). In other words, for the comb-like POEGMA-long 55 °C is the lower temperature for fully erasing the sample's structure memory in the melt. Furthermore, although the critical temperature for erasing thermal history in POEGMA-long is only 15 K above the melting event, i.e. lower than in OEGMA-long (please see Fig. 5), the strength of the melt-memory effect as indicated by the maximum of ΔT = Tc − Tc,isomelt is double than in the linear homopolymer (about 24 K, a vertical double arrow in Fig. 5). These features imply that due to complex topological constraints existing in the brush polymers, different mechanisms may drive the memory effect between the linear and comb-like polymer architectures. Simultaneously, for Tinitial ≥ 55 °C, Tm decreases slightly, the melting profile exhibits a qualitative change and CFPEG remains almost unchanged. Nevertheless, the glass transition vanishes in Fig. 6b, indicating in this case that the semicrystalline morphology is severely altered, leading to more serious constraints on the mobility of the amorphous polymer fraction. A final point with respect to the data of Fig. 5 refers to the width of the region wherein the Tc changes with Tinitial. Based on the self-nucleation theory,49 the said region is called the ‘self-nucleation domain (DII)’.22 The self nucleation domain is wider for OEGMA-short, whereas more short in the case of longer OEGMA and POEGMA.
More work is needed, for example, by wide angle X-ray scattering (WAXS) to identify the proposed alternations in the crystal structure as well as by small angle X-ray scattering (SAXS) for the presence of large nanoscopic domains due to the amphiphilic character of the OEGMAs. Regarding the suggested alternation in the semicrystalline morphology between the different samples or between the different thermal protocols for the same sample, polarized light microscopy (PLM) measurements,50 again at low temperatures, could shed more light.
3.3. Molecular dynamics – dielectric spectroscopy
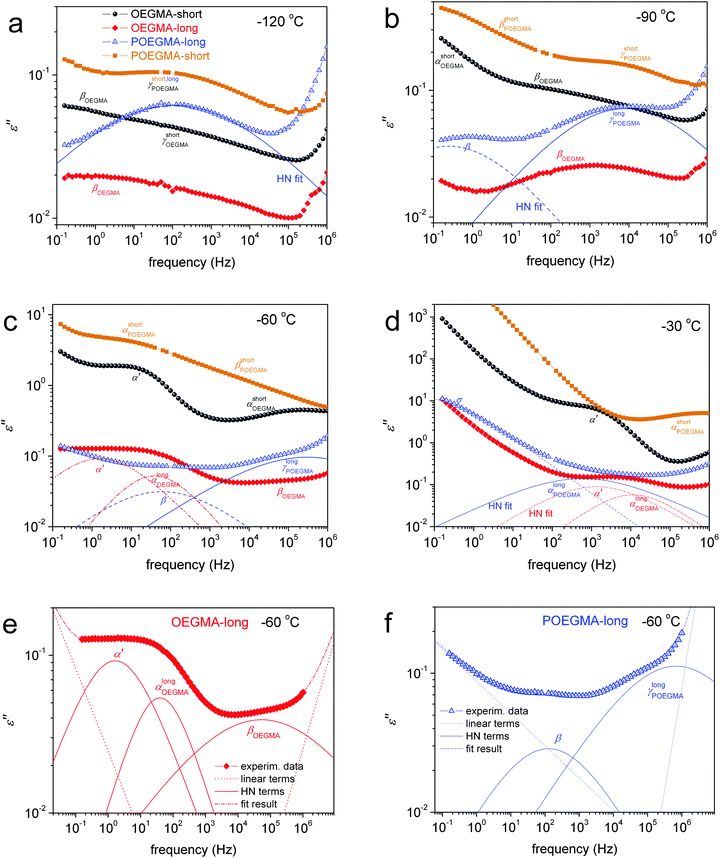
To more easily follow the temperature evolution of the ε′′ isotherms, data from Fig. S2 (ESI†) for selected temperatures both below and above Tg are reproduced in Fig. 7 and shown comparatively for all samples. Along with these data we added results by the employed fitting of ε′′(f) peaks in terms of HN models (HN, eqn (1), Section 2.2.3) for POEGMA-long and OEGMA-long.
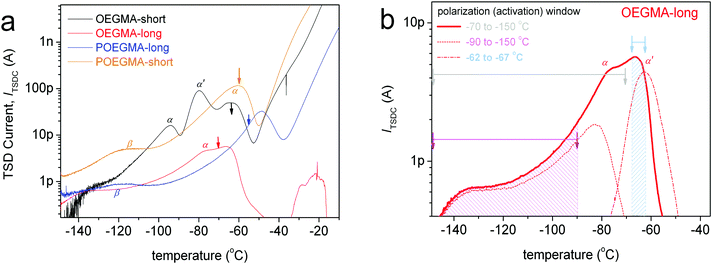
At temperatures lower than the Tg, we record for all samples the secondary γ and weak β relaxation (Fig. 7a and b), whereas at temperatures above Tg we record the segmental α (Fig. 7c and d) relaxation which is the dielectric analogue of the calorimetric glass transition.30 In the case of linear OEGMAs, an additional quite strong process is recorded closely to α, however at lower frequencies. This is the case of the slightly slower process α′ in Fig. 7c and d. For a further increase of the temperature, the frequency response signal is dominated, especially at the low-f side, by strong phenomena related to ionic conductivity (electrical carrier motion, σ peak) and, possibly, interfacial polarization effects.30
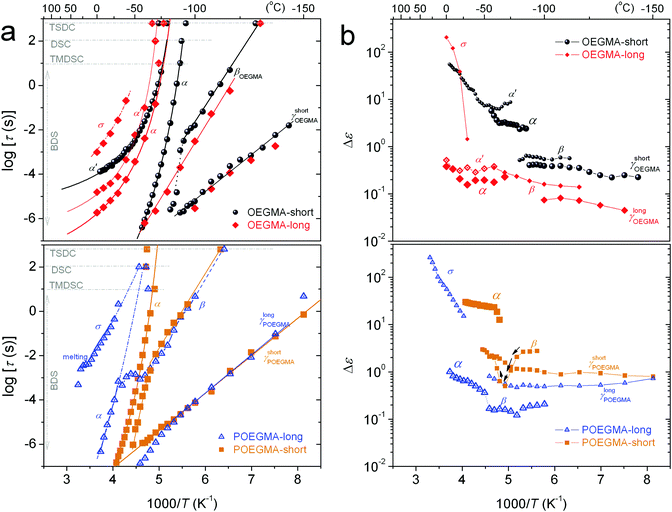
The various effects in molecular dynamics will be discussed in the next section on the basis of comparative dielectric maps (Arrhenius plots) determined via the employed fitting. The parameters of fitting as well as additional evaluation, namely the activation energy, Eact, of local relaxations, the fragility (or else cooperativity) index, m,51 and the dielectrically estimated glass transition temperature, Tg,diel (extrapolated time scale of α at the relaxation time τ = 100 s)30 are listed in Table 2 for all samples.
| Sample | γ Relaxation | β Relaxation | α Relaxation | α′ Relaxation | ||||||||||
|---|---|---|---|---|---|---|---|---|---|---|---|---|---|---|
| α HN | β HN | E act (eV) | E act (kJ mol−1) | α HN | β HN | E act (eV) | E act (kJ mol−1) | α HN | β HN | m α | T g,diel (°C) | α HN | β HN | |
| a Changes with temperature that cannot be sufficiently represented by an average value. | ||||||||||||||
| OEGMA-short | 0.3 | 1 | 0.3 | 29 | 0.3 | 1 | 0.65 → 1.00a | 63 → 96 | 0.5 | 0.6 | 96 | −92 | 0.8 | 1 |
| OEGMA-long | 0.3 | 1 | 0.31 | 30 | 0.3 | 1 | 0.68 | 66 | 0.7 | 1 | 141 | −81 | 0.6 | 1 |
| POEGMA-long | 0.4 | 1 | 0.38 → 0.55a | 37 → 53 | 0.4 | 1 | 0.67 | 65 | 0.7 | 1 | 86 | −53 | — | — |
| POEGMA-short | 0.3 | 1 | 0.33 | 32 | 0.4 | 1 | 0.63 → 1.8a | 61 → 174 | 0.4 | 0.5 | 96 | −70 | — | — |
Regarding local dynamics in general, it is clear that both types of processes are recorded faster in the linear oligomers. Considering the probable molecular origins for these dynamics as described above we can rationalize this effect via the concept of less inter-molecular interactions in the OEGMAs and, on the other hand, of more geometrical constraints in the mobility of side chains in the comb-like POEGMAs. Consequently, we expect the γ and β processes to be activated, on the one hand, from the same molecular groups,35 however, in the comb-like entities of POEGMA under more ‘constraints’.
The magnitude (Δε) of α′, in BDS measurements, lies on a similar order to that of α. α′ was fitted with the HN equation, giving the shape parameters αHN ∼0.6–0.8 and βHN = 1 (Table 2) which are indicative of a symmetric and quite narrow peak (similar to the corresponding TSDC peak in Fig. 9b). The results for the time scale of this process have been included in our dielectric maps. α′ obeys the VFTH law, with however significantly different fragility as compared to α. The extrapolation of the VFTH curves to the equivalent DSC relaxation time (100 s) makes the process to approach the calorimetric Tg.
Combining all the above results we suspect that the dipolar and very narrow process α′ might be the manifestation of the Normal Mode (NM) relaxation, hardly observed in PEG macromolecules due to enhanced crystallinity.63–65 It is supposed that the particular molecular structure of OEGMAs, i.e. the amphiphilic nature of chains that have no “active” end-groups, may be the cause of the activation of the NM relaxation process, which arises from the fluctuation of the polymer chain end-to-end vector (parallel to the OEGMA chain, Scheme 3, bottom-right). Upon critical analysis such contribution could not be resolved for the POEGMAs. On the basis of Scheme 3 again, this can be understood via the one-side grafted OEGMA chains in the comb-like entities, which makes the ‘global dipole’ fluctuation quite more weak (very low Δε).65 Moreover, the one-side-grafted chain is expected to exhibit a faster NM, in particular, of ∼4 times smaller relaxation time as compared to the corresponding free chain, due to the tethered chain end.65,66 In this case, the NM here may demonstrate the same time scale as the segmental α relaxation. Similar processes have been recorded by Kozanecki et al.29 in poly(2-(2-methoxyethoxy)ethyl methacrylate) and, more recently, by Czaderna-Lekka et al. in POEGMEA networks,28 however they did not extensively discuss its behavior. For the time being, we wish to not further comment on the interpretation of α′.
At the higher temperature/lower frequency side of Fig. 7d and 8, the strong σ process is recorded. σ is exceptionally narrow (αHN = 0.7) and symmetric (βHN = 1). σ is most probably related to long range charge transport through the amorphous regions and subsequent charge accumulation at interfaces in the semi-crystalline structures.67 With an increase in temperature we observe in Fig. 8a (bottom) a disturbance in the time scale of σ, which is most probably the effect of melting of the crystals and restructuring of the morphology (please compare with Fig. 2a).
So far, the results of the present study could be interpreted by employing a combination of the existing knowledge, similar effects from the literature and schematic models developed in the frame of this investigation. From the methodological point of view, the widely used combination of the techniques here, DSC and BDS, were once again proved quite useful and effective in illuminating aspects regarding the molecular dynamics and possible structure, even at the nanoscopic scale. Obviously more work is needed to shed more light on specific raised questions, for example, with respect to the crystallization and structuring of the linear OEGMAs and comb-like POEGMAs. Measurements on these systems by wide/small angle X-ray scattering (WAXS/SAXS) in combination with Fourier transform infrared (FTIR) spectroscopy are expected to provide further insight, for example by the monitoring of crystal structuring, identification of probably ordered structures in larger domains and record changes of the inter- and intra-chain interactions. Also, PLM measurements under various conditions could be found useful for studying the semicrystalline morphology.
4. Conclusions
In this paper we show results on thermal transitions and molecular dynamics in new amphiphilic linear oligomers with short and longer chains, OEGMA (-short ∼4 nm, -long ∼8 nm), in direct comparison with their homologue comb-like polymers, POEGMAs (-short and -long), with ∼10 OEGMA-branches. The investigation involved measurements by calorimetry (DSC) and dielectric spectroscopy (BDS, TSDC). With the exception of POEGMA-short, all samples are semicrystalline, with the amount of crystallinity (0 to 53 wt%) and the nucleation being favored (elevated Tc) for the longer chains. The semicrystalline systems exhibit also ‘memory’ characteristics related to the nucleation of crystals, the effect being more pronounced for the comb-like architecture. These results are rationalized in terms of the role of expected inter-chain interactions, namely hydrogen bonds, on the initial polymer ordering (nucleation) and further on crystal growth. The changes in Tg (−91 to −61 °C) seem to follow those of CF especially when the latter is high (>40 wt%). The direct chain length effects cannot be resolved here, as the samples cannot be kept in the amorphous state.BDS in combination with TSDC enabled the molecular dynamics mapping of these systems for a wide temperature range (−150 to 50 °C). All samples demonstrated two sub-Tg local relaxations (γ and β), interestingly, resembling those of the more similar polymer, PEG. Especially β is a water-related process and arises from the hydrophilic part of OEGMA. The dielectric analogue of glass transition, α relaxation is recorded here for all samples, with its time scale being in close agreement between the three techniques. Obviously, α arises from the chains not merged into the crystals, equivalently, not suffering serious interactions by neighboring chains. In the comb-like polymers, the mobile chains (braches) suffer additional constraints due to their ‘grafting’ onto the backbone of the comb, this being reflected on the retardation of α as compared to the linear OEGMAs, the effect being more pronounced for the short chains. Finally, the OEGMAs demonstrate an additional segmental-like relaxation (α′) which exhibits the characteristics of the normal-mode process, namely screening the fluctuation of the chain end-to-end vector. The latter process is not recorded in the POEGMAs, most probably due to the constraints imposed by the one-side ‘grafting’ of the branches.
Overall, the deeper scope of the design of these materials is achieved, as the expected information on the possibility of tuning crystallization and polymers chain diffusion was successfully extracted by the direct and indirect dielectric techniques. The latter is quite interesting, also from the methodological point of view, and proves once again the dielectric techniques quite power tools with respect to the structure–property relationship investigations.
Conflicts of interest
There are no conflicts to declare.Acknowledgements
O. V. and P. A. K. would like to thank Dr Daniel Fragiadakis (Naval Research Laboratory, Polymer Physics Section, Washington DC, USA) for providing his sophisticated data analysis software ‘Grafity’ (http://grafitylabs.com/).References
- F. Hua, X. Jiang, D. Li and B. Zhao, J. Polym. Sci., Part A: Polym. Chem., 2006, 44, 2454–2467 CrossRef CAS.
- J. F. Lutz, J. Polym. Sci., Part A: Polym. Chem., 2008, 46, 3459–3470 CrossRef CAS.
- A. Miasnikova and A. Laschewsky, J. Polym. Sci., Part A: Polym. Chem., 2012, 50, 3313–3323 CrossRef CAS.
- R. C. Advincula, W. J. Brittain, K. C. Caster and J. Rühe, Polymer Brushes, Wiley-VCH, Weinheim, 2004 Search PubMed.
- H. Shi, Y. Zhao, X. Dong, Y. Zhou and D. Wang, Chem. Soc. Rev., 2013, 42, 2075–2099 RSC.
- S. Kripotou, Ch Psylla, K. Kyriakos, K. N. Raftopoulos, J. Zhao, G. Zhang, S. Pispas, C. M. Papadakis and A. Kyritsis, Macromolecules, 2016, 49, 5963–5977 CrossRef CAS.
- I. Yildririm, T. Bus, M. Sahn, T. Yildirim, D. Kalden, S. Hoeppener, A. Traeger, M. Mesterhausen, C. Weber and U. S. Schubert, Polym. Chem., 2016, 7, 6064–6074 RSC.
- E. Barnard, R. Pfukwa, J. Maiz, A. J. Müller and B. Klumperman, Macromolecules, 2020, 53, 1585–1595 CrossRef CAS.
- Z. Hu, T. Cai and C. Chi, Soft Matter, 2010, 6, 2115–2123 RSC.
- H. Lomas, I. Canton, S. MacNeil, J. Du, S. P. Armes, A. J. Ryan, A. L. Lewis and G. Battaglia, Adv. Mater., 2007, 19, 4238–4243 CrossRef CAS.
- E. S. Gil and S. M. Hudson, Prog. Polym. Sci., 2004, 29, 1173–1222 CrossRef CAS.
- Z. An, Q. Shi, W. Tang, C. K. Tsung, C. J. Hawker and G. D. Stucky, J. Am. Chem. Soc., 2007, 129, 14493–14499 CrossRef CAS.
- A. Kyritsis, A. Laschewsky and C. M. Papadakis, Self-assembling of thermo-responsive block copolymers: structural, thermal and dielectric investigations, in Thermodynamics and biophysics of biomedical nanosystems. Series in bioengineering, ed. C. Demetzos and A. Pippa, Springer, Singapore, 2019, ch. 12, p. 397 Search PubMed.
- H. Sun, D. M. Yu, S. Shi, Q. Yuan, S. Fujinami, X. Sun, D. Wang and T. P. Russell, Macromolecules, 2019, 52, 592–600 CrossRef CAS.
- K. Inomata, E. Nakanishi, Y. Sakane, M. Koike and T. Nose, J. Polym. Sci., Part B: Polym. Phys., 2005, 43, 79–86 CrossRef CAS.
- D. Neugebauer, M. Theis, T. Pakula, G. Wegner and K. Matyjaszewski, Macromolecules, 2006, 39, 584–593 CrossRef CAS.
- C. Nikovia, L. Theodoridis, S. Alexandris, P. Bilalis, N. Hadjichristidis, G. Floudas and M. Pitsikalis, Macromolecules, 2018, 51, 8940–8955 CrossRef CAS.
- H. Xu, Y. Gao, J. Li, H. Wang and H. Shi, Polymer, 2018, 153, 362–368 CrossRef CAS.
- P. C. Ashman and C. Booth, Polymer, 1975, 16, 889–896 CrossRef CAS.
- A. J. Müller, V. Balsamo and M. L. Arnal, Adv. Polym. Sci., 2005, 190, 1–63 CrossRef.
- Y. Suzuki, H. Duran, M. Steinhart, H. J. Butt and G. Floudas, Soft Matter, 2013, 9, 2621–2628 RSC.
- L. Sangroniz, D. Cavallo and A. J. Müller, Macromolecules, 2020, 53, 4581–4604 CrossRef CAS.
- A. T. Lorenzo, M. Arnal, J. J. Sanchez and A. J. Müller, J. Polym. Sci., Part B: Polym. Phys., 2006, 44, 1738–1750 CrossRef CAS.
- M. J. Muthukumar, Chem. Phys., 2016, 145, 031105 CAS.
- M. Muthukumar, Prog. Polym. Sci., 2020, 100, 10184 CrossRef.
- X. Liu, Y. Wang, Z. Wang, D. Cavallo, A. J. Müller, P. Zhu, Y. Zhao, X. Dong and D. Wang, Polymer, 2020, 188, 122117 CrossRef CAS.
- L. Sangroniz, A. Sangroniz, L. Meabe, A. Basterretxea, H. Sardon, D. Cavallo and A. J. Müller, Macromolecules, 2020, 53, 4878–4881 Search PubMed.
- A. Czaderna-Lekka, K. Piechocki, M. Kozanecki and L. Okrasa, J. Phys. Chem. Solids, 2020, 140, 109359 CrossRef CAS.
- M. Kozanecki, M. Pastorczak, L. Okrasa, J. Ulanski, J. A. Yoon, T. Kowalewski, K. Matyjaszewski and K. Koyonov, Colloid Polym. Sci., 2015, 293, 1357–1367 CrossRef CAS.
- F. Kremer and F. Schönhals, Broadband dielectric spectroscopy, Springer-Verlag, Berlin, 2002 Search PubMed.
- D. Fragiadakis, P. Pissis and L. Bokobza, Polymer, 2005, 46, 6001–6008 CrossRef CAS.
- M. Füllbrandt, P. J. Purohit and A. Schönhals, Macromolecules, 2013, 46, 4626–4632 CrossRef.
- A. Alegria and J. Colmenero, Soft Matter, 2016, 12, 7709–7725 RSC.
- E. Christodoulou, P. A. Klonos, K. Tsachouridis, A. Zamboulis, A. Kyritsis and D. N. Bikiaris, Soft Matter, 2020, 16, 8187–8201 RSC.
- A. Karatza, P. Klonos, S. Pispas and A. Kyritsis, Polymer, 2019, 181, 121794 CrossRef.
- Y. Wang, C. B. Liu, L. Y. Fan, Y. Sheng, J. Mao, G. T. Chao, J. Li, M. J. Tu and Z. Y. Qian, Polym. Bull., 2005, 53, 147–154 CrossRef CAS.
- P. S. Gill, S. R. Sauerbrunn and M. Reading, J. Therm. Anal. Calorim., 1993, 40, 931–939 CrossRef CAS.
- Y. Suzuki, H. Duran, W. Akram, M. Steinhart, G. Floudas and H. J. Butt, Soft Matter, 2013, 9, 9189–9198 RSC.
- S. Havriliak and S. Negami, Polymer, 1967, 8, 161–210 CrossRef CAS.
- J. Van Turnhout, Front. Chem., 2016, 4, 22 CAS.
- N. M. Alves, J. F. Mano, E. Balaquer, J. M. Meseguer Dueñas and J. L. Gómez Ribelles, Polymer, 2002, 43, 4111–4122 CrossRef CAS.
- S. Montserrat, J. L. Gómez Ribelles and J. M. Meseguer, Polymer, 1998, 39, 3801–3807 CrossRef CAS.
- J. M. G. Cowie and I. J. McEwen, Polymer, 1973, 14, 423–426 CrossRef CAS.
- J. Dobbertin, A. Hensel and C. Schick, J. Therm. Anal. Calorim., 1996, 47, 1027–1040 CrossRef CAS.
- U. Gaur and B. Wunderlich, J. Phys. Chem. Ref. Data, 1981, 10, 1001–1049 CrossRef CAS.
- R. Androsch, C. Schick and A. M. Rhoades, Macromolecules, 2015, 48, 8082–8089 CrossRef CAS.
- A. Toda, R. Androsch and C. Schick, Polymer, 2016, 91, 239–263 CrossRef CAS.
- P. A. Klonos, S. N. Tegopoulos, C. S. Koutsiara, E. Kontou, P. Pissis and A. Kyritsis, Soft Matter, 2019, 18, 1813–1824 RSC.
- R. M. Michell, A. Mugica, M. Zubitur and A. J. Müller, Adv. Polym. Sci., 2017, 276, 215–256 CrossRef CAS.
- Z. Terzopoulou, P. A. Klonos, A. Kyritsis, A. Tziolas, A. Avgeropoulos, G. Z. Papageorgiou and D. N. Bikiaris, Polymer, 2019, 166, 1–12 CrossRef CAS.
- R. Boehmer, K. Ngai, C. A. Angell and D. J. Plazek, J. Chem. Phys., 1993, 99, 4201–4209 CrossRef CAS.
- P. Klonos, P. Pissis, V. M. Gun’ko, A. Kyritsis, N. V. Guzenko, E. M. Pakhlov, V. I. Zarko, W. Janusz, J. Skubiszewska-Zięba and R. Leboda, Colloids Surf., A, 2010, 360, 220–231 CrossRef CAS.
- P. Klonos, S. Kaprinis, V. I. Zarko, V. Peoglos, E. M. Pakhlov, P. Pissis and V. M. Gun’ko, J. Appl. Polym. Sci., 2013, 128, 1601–1615 CAS.
- S. Kripotou, P. Pissis, P. Sysel, V. Sindelar and V. A. Bershtein, Polymer, 2006, 47, 357–366 CrossRef CAS.
- D. R. Figueroa, J. J. Fontanella, M. C. Wintersgill, J. P. Calame and C. G. Andeen, Solid State Ionics, 1988, 28–30, 1023–1028 CrossRef.
- I. M. Kalogeras, M. Roussos, I. Christakis, A. Spanoudaki, D. Pietkiewicz, W. Brostow and A. Vassilikou-Dova, J. Non-Cryst. Solids, 2005, 351, 2728–2734 CrossRef CAS.
- M. Miyara, I. Takashima, K. Sasaki, R. Kita, N. Shinyashiki and S. Yagihara, Polym. J., 2017, 49, 1–8 CrossRef.
- M. Dionísio and M. T. Viciosa, Polymer, 2018, 148, 339–350 CrossRef.
- M. Carsi, M. J. Sanchis, R. Diaz-Calleja, E. Riande and M. J. D. Nugent, Macromolecules, 2012, 45, 3571–3580 CrossRef CAS.
- G. P. Johari and M. Goldstein, J. Chem. Phys., 1970, 53, 2372–2388 CrossRef CAS.
- G. Tammann and W. Hesse, Z. Anorg. Allg. Chem., 1926, 156, 245–257 CrossRef CAS.
- D. Fragiadakis and P. Pissis, J. Non-Cryst. Solids, 2007, 47–51, 4344–4352 CrossRef.
- J. Ren, O. Urakawa and K. Adachi, Polymer, 2002, 44, 847–855 CrossRef.
- A. Schönhals, H. Goering and C. Schick, J. Non-Cryst. Solids, 2002, 305, 140–149 CrossRef.
- A. Kyritsis, P. Pissis, S. M. Mai and C. Booth, Macromolecules, 2000, 33, 4581–4595 CrossRef CAS.
- W. W. Graessley in Synthesis and degradation rheology and extrusion. Advances in Polymer Science, ed. H. J. Cantow, et al., Springer, Berlin Heidelberg, 1982, vol. 47, pp. 67–117 Search PubMed.
- R. Richert, A. Agapov and A. P. Sokolov, J. Chem. Phys., 2011, 134, 104508 CrossRef.
Footnote |
| † Electronic supplementary information (ESI) available. See DOI: 10.1039/d0sm01666g |
| This journal is © The Royal Society of Chemistry 2021 |

