
 Open Access Article
 This Open Access Article is licensed under a
 Creative Commons Attribution 3.0 Unported Licence
LCST polymers with UCST behavior†
Marzieh
Najafi
a,
Mehdi
Habibi
 b,
Remco
Fokkink
c,
Wim E.
Hennink
a and
Tina
Vermonden
*a
b,
Remco
Fokkink
c,
Wim E.
Hennink
a and
Tina
Vermonden
*a
aDepartment of Pharmaceutics, Utrecht Institute for Pharmaceutical Sciences (UIPS), Science for Life, Faculty of Science, Utrecht University, P. O. Box 80082, 3508 TB Utrecht, The Netherlands. E-mail: T.Vermonden@uu.nl
bPhysics and Physical Chemistry of Foods, Wageningen University & Research, 6708 WG Wageningen, Wageningen, The Netherlands
cPhysical Chemistry and Soft Matter, Wageningen University & Research, Stippeneng 4, 6708 WE Wageningen, The Netherlands
First published on 5th January 2021
Abstract
In this study, temperature dependent behavior of dense dispersions of core crosslinked flower-like micelles is investigated. Micelles were prepared by mixing aqueous solutions of two ABA block copolymers with PEG B-blocks and thermosensitive A-blocks containing PNIPAM and crosslinkable moieties. At a temperature above the lower critical solution temperature (LCST), self-assembly of the polymers resulted in the formation of flower-like micelles with a hydrophilic PEG shell and a hydrophobic core. The micellar core was stabilized by native chemical ligation (NCL). Above the LCST, micelles displayed a radius of ∼35 nm, while a radius of ∼48 nm was found below the LCST due to hydration of the PNIPAM core. Concentrated dispersions of these micelles (≥7.5 wt%) showed glassy state behavior below a critical temperature (Tc: 28 °C) which is close to the LCST of the polymers. Below this Tc, the increase in the micelle volume resulted in compression of micelles together above a certain concentration and formation of a glass. We quantified and compared micelle packing at different concentrations and temperatures. The storage moduli (G′) of the dispersions showed a universal dependence on the effective volume fraction, which increased substantially above a certain effective volume fraction of φ = 1.2. Furthermore, a disordered lattice model describing this behavior fitted the experimental data and revealed a critical volume fraction of φc = 1.31 close to the experimental value of φ = 1.2. The findings reported provide insights for the molecular design of novel thermosensitive PNIPAM nanoparticles with tunable structural and mechanical properties.
1. Introduction
Poly(N-isopropylacrylamide) (PNIPAM) is an attractive polymer for biomedical, biotechnological and pharmaceutical applications due to its thermo-responsive phase transition at a temperature close to body temperature.1–4 This polymer exhibits a lower critical solution temperature (LCST) in aqueous solution at 32 °C. Below this temperature, the polymeric chains are hydrated and therefore soluble in water, while upon increasing the temperature above the LCST, dehydration occurs and thus the polymer becomes insoluble.2 Amphiphilic di- or triblock (co)polymers of PNIPAM and polyethylene glycol (PEG) have been extensively studied for the preparation of thermosensitive polymeric micelles as potential drug delivery vehicles.5–8 During the past years, there is a growing interest in strategies to convert PNIPAM based hydrogels into micelles for drug delivery applications.9–11Unlike micelles, several studies have been devoted to the rheological characterization of dense dispersions of PNIPAM based microgels.12–15 PNIPAM (sub)micron gel particles are usually synthesized using free radical precipitation polymerization to yield small hydrogel particles (∼0.2 to 0.5 μm radius).16 These PNIPAM based microgels display thermosensitivity17 and a volume phase transition temperature (VPTT),18 which is close to the LCST of the polymer.19 This reversible transition temperature plays a crucial role in the viscoelastic behavior of dense dispersions of PNIPAM microgels. In general, when the temperature is below the VPTT, soft PNIPAM microgels are swollen resulting in high repulsive interparticle interactions caused by the steric hindrance of swollen polymer chains. At this temperature, the hydrated particles can be packed well above the random close packing fraction Φrcp ≈ 0.6420,21 due to compression and deformation of the particles. This leads to the formation of a glass exhibiting viscoelastic properties, which resembles pastes and colloidal glasses of hard spheres.22–24 At temperatures above the VPTT, dehydration of PNIPAM chains leads to shrinkage of the microgels and in this state, a raise in hydrophobic and van der Waals interactions due to high polymer density results in increased attractive interparticle interactions.13 A variety of states depending on the magnitude of repulsive and attractive interactions have been reported for PNIPAM based microgel particles. A balance between attractive and repulsive interactions results in the formation of colloidal gels,25 while excessive repulsive interactions lead to a stable liquid dispersion of the microgels,26 whereas when the attractive forces exceed the repulsive interactions, macroscopic precipitation occurs.27 Dominancy and magnitude of repulsive or attractive interparticle interactions can be altered by introducing hydrophobic and/or hydrophilic monomers into PNIPAM based microgels.28 For instance, gelation properties of PNIPAM microgels have been tuned by changing surface charge density through copolymerization of NIPAM with monomers such as acrylic acid,25,29 and fumaric acid.26 At a pH < pKa, microgels composed of copolymers of NIPAM and fumaric acid behaved similarly as PNIPAM microgels without the comonomer and displayed colloidal gel behavior at T > VPTT. On the other hand, at a pH > pKa, the surface of the particles is negatively charged due to deprotonation of the carboxylic groups, which in turn led to significant charge repulsion between the microgel particles. Consequently, due to the high repulsive forces at this pH, the microgels displayed liquid behavior at T > VPTT.26 Very recently, Es Sayed et al. reported on the synthesis of NIPAM based microgel particles by surfactant-free precipitation copolymerization of NIPAM and PEG-methacrylate. In the so-obtained microgel particles, PEG chains are present on their surface, however, this arrangement is not likely in a well-defined core–shell structure. They demonstrated that this microgel system has a higher colloidal stability than non-PEGylated ones.30 However, the effect of PEG on rheological characteristics of microgels was not described in this publication.13,30 In contrast to microgels, PNIPAM based micelles are nanosized particles (10–100 nm diameter) formed by self-assembly of amphiphilic block copolymers of PNIPAM-PEG in aqueous solutions at concentrations above the critical micelle concentration (CMC) and above the LCST of the PNIPAM block. Therefore, PNIPAM based micelles with a PEG shell have a great potential as a well-defined core–shell structure particle for investigating the effect of PEG on rheological properties of dense PNIPAM based colloids.
In the present contribution, mechanical properties of concentrated dispersions of core crosslinked flower-like micelles having a PEG shell and a thermosensitive PNIPAM core were explored. Hydrodynamic radius of micelles was studied in their dilute dispersions at temperatures above and below the LCST of the polymers using dynamic light scattering (DLS). Subsequently, the rheological properties (dynamical moduli in both linear and non-linear regime) of a series of concentrated micellar dispersions were studied over a temperature range of 10 to 40 °C. A theoretical model31,32 was used to describe the observed rheological behavior of the dispersions.
2. Materials and methods
2.1. Materials
All commercial chemicals were obtained from Sigma-Aldrich (Zwijndrecht, The Netherlands) and used as received unless indicated otherwise. N-(2-hydroxypropyl)methacrylamide (HPMA) was synthesized by a reaction of methacryloyl chloride with 1-aminopropan-2-ol in dichloromethane according to a literature procedure.33N-(2-hydroxypropyl)methacrylamide-Boc-S-acetamidomethyl-L-cysteine (HPMA-Boc-Cys-(Acm)) and N-(2-hydroxypropyl)methacrylamide-ethylthioglycolate succinic acid (HPMA-ETSA) were synthesized according to previously reported procedures.5,34 Viscous Blue 420 Maleimide™ was obtained from Ursa BioScience (Maryland, USA). Phosphate buffered saline 10× (PBS) pH 7.4 (1.37 M NaCl, 0.027 M KCl and 0.119 M phosphates) BioReagents was purchased from B. Braun (Melsungen, Germany). Poly(ethylene glycol) bis(2-bromoisobutyrate) with a molecular weight of 6 kDa was synthesized by a method previously reported.5 Dialysis tubes (molecular weight cutoff (MWCO) 10 kDa) were obtained from Fisher Scientific (Bleiswijk, The Netherlands). PD-10 desalting columns were purchased from GE Healthcare (Uppsala, Sweden). PEG standards (molecular weights ranging from 106 to 969![[thin space (1/6-em)]](https://www.rsc.org/images/entities/char_2009.gif) 000 Da) for GPC characterization were purchased from Agilent Technologies BV (Santa Clara, US).
000 Da) for GPC characterization were purchased from Agilent Technologies BV (Santa Clara, US).
2.2. Polymer synthesis and characterization
:1 v/v, 10 mL) and stirred for 1 hour at room temperature. Next, the solvent was evaporated under reduced pressure and the crude product was dissolved in 2 mL DCM followed by precipitation in 60 mL of cold diethyl ether. The Acm protecting group of cysteines was removed by dissolving 250 mg of the Boc deprotected polymer in a mixture of methanol (MeOH) and water (1:1 v/v, 10 mL) under a nitrogen atmosphere. Next, 500 μL HCl (1 M) and 1 mL iodine 0.2 M in MeOH were added and left to react while stirring for 1 h at room temperature. Subsequently, 1 mL of ascorbic acid (1 M) in water was added to the reaction flask to quench the excess of iodine followed by addition of excess of tris(2-carboxyethyl)phosphine (TCEP) (250 mg) to reduce the formed disulfide bonds and the reaction mixture was subsequently stirred overnight. Finally, the mixture was dialyzed against water for 2 days at room temperature (MWCO, 10 kDa) and the final product was obtained after lyophilization and characterized by 1H-NMR and GPC.
2.3. Micelle preparation and characterization
:1 volume ratio (i.e. 1:1 molar ratio of HPMA-Cys to HPMA-ETSA) and heated to 50 °C using an oil bath. The mixture was stirred at 50 °C overnight. The resulting micellar dispersion was dialyzed against water (MWCO, 10 kDa) for two days at room temperature and subsequently lyophilized.
:20 v/v) in HEPES (20 mM, pH 7.0) to a final concentration of 0.5 mg mL−1 and the zeta potential was measured at 10 and 40 °C using a Zetasizer Nano Z (Malvern Instruments Ltd, Malvern, UK).
2.4. Micelle dispersion preparation and characterization
The yield stress measurements were performed using 12.5 and 30 wt% dispersions, at temperatures of 10 and 40 °C, respectively. The samples (70 μL) were subjected to a strain sweep from 1 to 40% at oscillation frequency of 1 Hz.
3. Results and discussions
3.1. Polymer synthesis and characterization
Fig. 1 shows the structures of polymers investigated in this study synthesized using atom transfer radical polymerization (ATRP).39 As reported previously,5PNE and protected PNC were obtained by copolymerization of NIPAM/HPMA-ETSA and NIPAM/HPMA-Boc-Cys-(Acm), respectively. The feed molar ratio of the monomers in both polymerizations was 93:7 and a poly(ethylene glycol) bis(2-bromoisobutyrate) with a number-average molecular weight (Mn) of 6 kDa was used as bifunctional ATRP initiator.5 The protected PNC triblock copolymer was obtained with a yield of 94% and the Mn of the polymer was ∼42 kDa as determined by 1H-NMR5 and ∼69 kDa (PDI 1.5) by GPC analysis (Table 1).5 The purified PNE was obtained with a yield of 85% and had an Mn of ∼41 kDa as determined by 1H-NMR analysis5 and Mn of ∼64 kDa (PDI of 1.8) as determined by GPC (Table 1).5 The difference in the recorded Mn's by GPC and NMR analysis of these polymers can be ascribed to the presence of strong inter- and intramolecular hydrogen bonding in PNIPAM based polymers as reported before.40,41
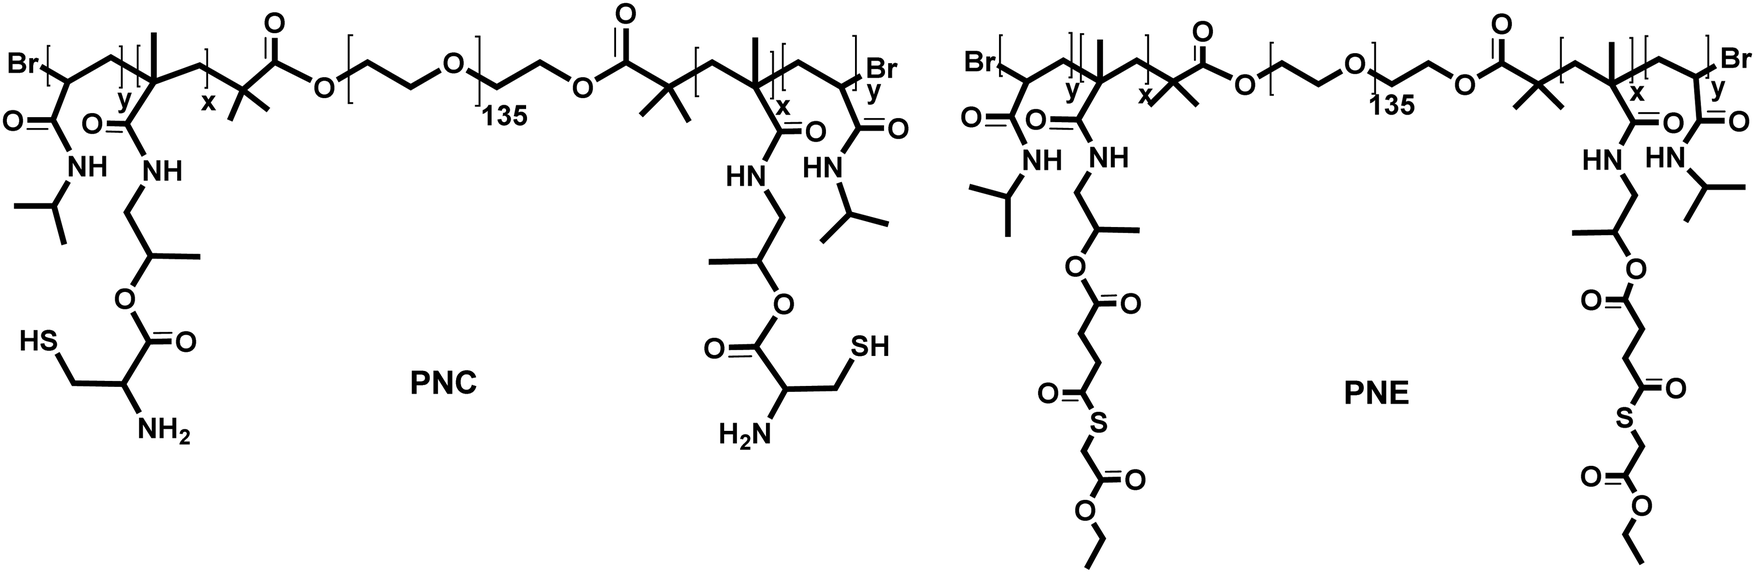 | ||
| Fig. 1 Chemical structures of deprotected PNC and PNE. | ||
:7
The incorporation of HPMA-Cys and HPMA-ETSA units in the thermosensitive domains of the polymers provides terminal cysteine and thioester functionalities that can be exploited for native chemical ligation (NCL).42PNC underwent a deprotection procedure34 to remove Acm and Boc protecting groups to yield a polymer with free cysteine moieties. 1H-NMR analysis showed that the deprotection of cysteines indeed was successful and GPC analysis showed an Mn of ∼72 kDa for the deprotected polymer.5 As expected, both polymers exhibited a cloud point of 34.1 °C for PNC and 29.2 °C for PNE due to the presence of thermosensitive PNIPAM-blocks and the obtained values were similar as reported before for similar polymers5 (Table 1).
3.2. Micelle formation and characterization
Micelles were prepared following a previously reported method by mixing PNC and PNE solutions (10 mg mL−1) at a volume ratio of 1:1 (i.e. molar ratio 1:1 for HPMA-Cys and HPMA-ETSA) followed by increasing the temperature to 50 °C.5,43 The close proximity of thioester and thiol functionalities in the micellar core induces native chemical ligation leading to the stabilization of the micellar structures (Fig. 2A). Fig. 2B shows the radius of the micelles as a function of temperature in a dilute dispersion (3 mg mL−1) as measured by DLS. By varying the temperature from 10 to 40 °C, the radius of the micelles changed from ∼48 to ∼35 nm with an inflection point at approximately 28 °C, which is close to the LCST of both polymers. Static light scattering at 10 and 40 °C demonstrated that the micelle's molecular weights (∼15.5 × 10⁶ kDa) and aggregation number (Nagg) (∼400) were equal within the experimental error confirming the formation of core crosslinked micelles. SLS data have been reported before for this type of micelles,5 but for sake of readability are also shown in SI-Table S1 (ESI†) at the relevant temperatures here. The micelles displayed a ζ-potential of −2.3 ± 0.4 and −4.2 ± 0.2 mV at 10 and 40 °C, respectively, showing a slight negative charge of the micelles above and below the LCST, in line with findings for other pegylated polymeric nanoparticles.44
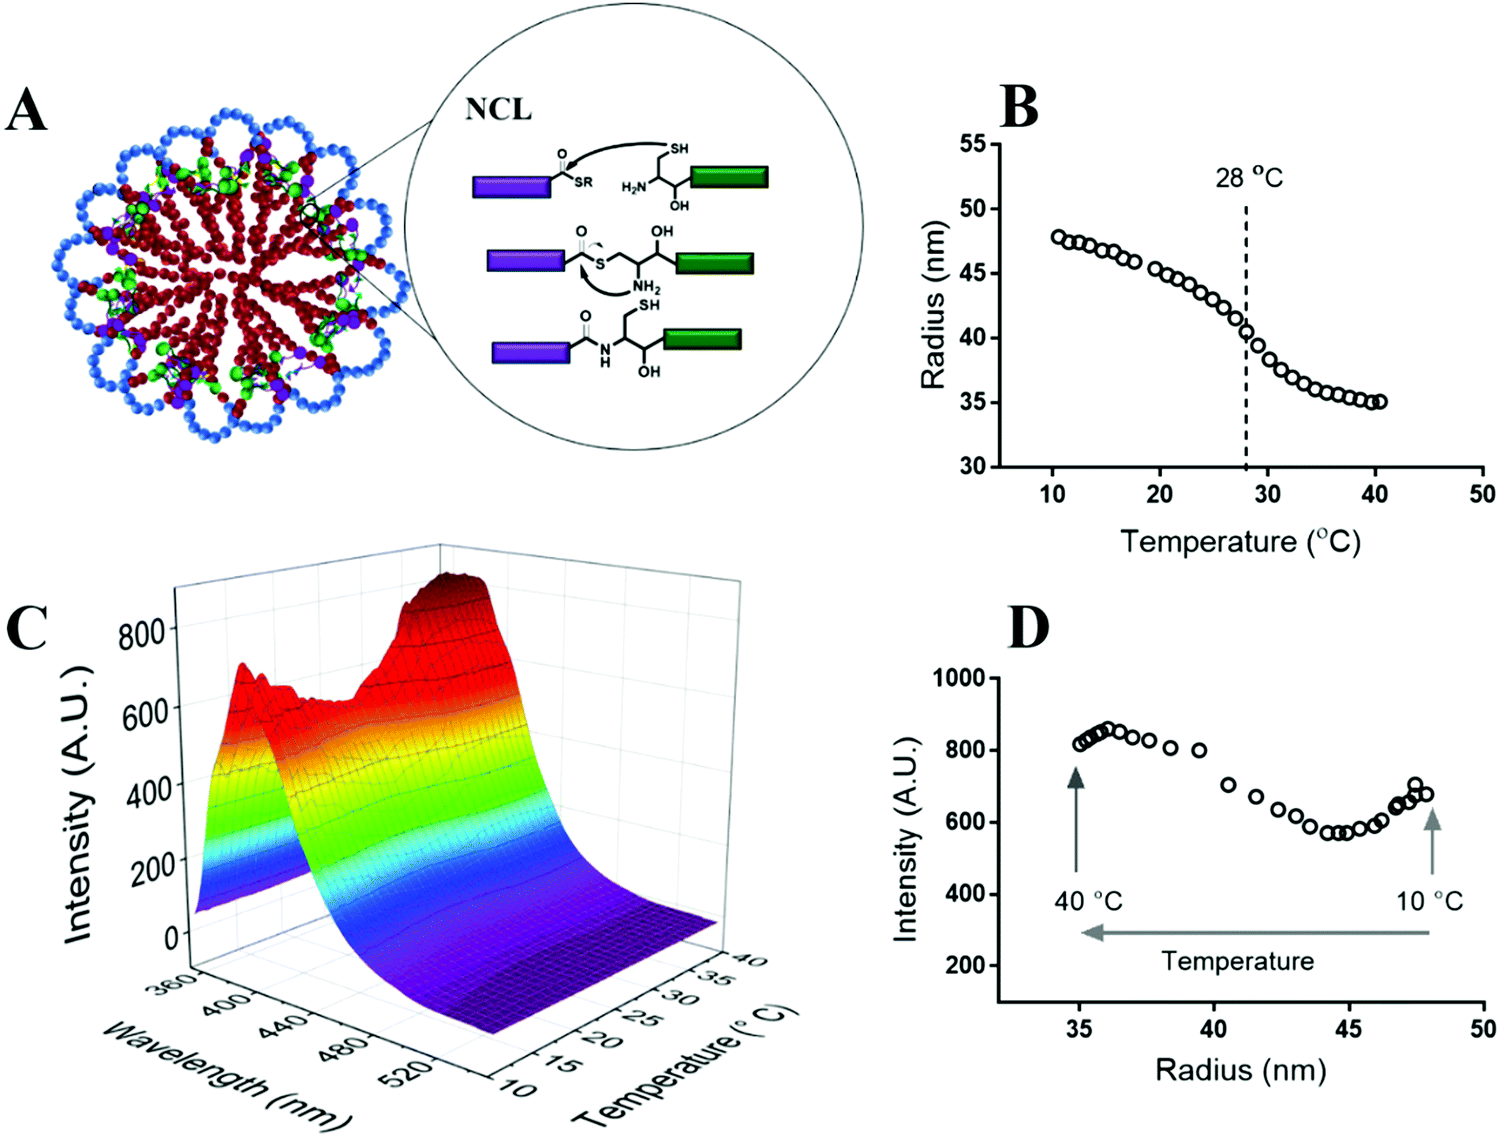 | ||
| Fig. 2 (A) Schematic view of the flower-like micelles crosslinked by native chemical ligation.5 (B) The change in the hydrodynamic radius (Rh) of micelles as a function of temperature at a micelle concentration of 3 mg mL−1 measured by DLS. (C) Change in the dye intensity as a function of temperature at different wavelengths. (D) Change in the dye fluorescence intensity as a function of the micelle radius at the wavelength of 387 nm. | ||
To visualize the shrinking of the micellar core due to dehydration of PNIPAM chains above the LCST, a rigidochromic fluorescent probe was used.38,45 Rigidochromic fluorescent probes are excited by absorbing a photon of a specific wavelength. After excitation, there are two possible pathways to deactivate the excited-state: non-radiative and radiative. The non-radiative pathway (non-fluorescent) results in rotation of a specific bond that prevents effective π conjugation in the molecule. When this pathway is hampered by confinement induced by molecular structural changes or enhanced viscosity of the environment, the probe is forced to follow the radiative pathway and emit light to the deactivated excited state.46 To this end, the maleimide functionalized rigidochromic dye (Viscous Blue 420 Maleimide™) was conjugated to free thiol groups in the micellar core remaining after native chemical ligation and/or to non-reacted cysteine moieties in the micellar core. This conjugation positioned the rigidochromic molecule as a confinement probe in the PNIPAM core of the micelles. The fluorescence intensity of dye conjugated micelles was monitored as a function of temperature (Fig. 2C). First, a decrease in the fluorescence intensity with increasing temperature from 10 to 25 °C was observed, as it has been observed before for this dye in aqueous solution which was attributed to the decrease in viscosity of water with temperature.37 Since the core in this temperature range (10 to 25 °C) is highly hydrated, the lower fluorescence intensity with increasing temperature can be explained by the low local viscosity in the micellar core. Interestingly, by further increasing the temperature from 25 to 40 °C, the fluorescence intensity did not further decrease but instead increased. Most likely, the dehydration of PNIPAM and accordingly shrinkage of the micellar core resulted in an increase in the confinement of the rigidochromic probes. Therefore, these molecules follow the radiative pathway which in turn resulted in an increase in fluorescence intensity. Fig. 2D shows the change in fluorescence intensity as a function of the radius of the micelles. From 10 to 25 °C, when the radii are hardly changed (from 47 to 45 nm), a decrease in fluorescence intensity from 680 to 590 a.u. was observed as explained above. With decreasing the radius from 45 to 35 nm (from 25 to 35 °C) a significant change in intensity from 590 to 850 a.u. was observed, which shows that indeed shrinkage of micelles due to the dehydration of PNIPAM chains increased dye confinement and consequently increased dye intensity. Subsequently, when the radius of the micelles remained relatively constant, (35.7 to 35.0 nm) at a temperature from 35 to 40 °C, fluorescence intensity slightly decreased again, which indicates a slight decrease in viscosity of the dye microenvironment. According to Wu et al. PNIPAM based nanoparticles retain water (∼70%) in their hydrophobic core even in a highly collapsed state at temperatures above the LCST.18 Therefore, probably a decrease in the viscosity of water in the micellar core upon increasing temperature resulted in an overall decrease in the viscosity of dye microenvironment, which led to a slight decrease in dye intensity.
3.3. Rheological characterization of dense micellar dispersions
The rheological properties of dense micellar dispersions were investigated as a function of temperature. The number of micelles (n) in different dispersions was calculated based on the concentration of samples and the molecular weight of the micelles (the details are shown in ESI,† Section S2, SI-Table 2). This number was used to calculate the total volume of micelles (Vm) in each dispersion based on the radius of the micelles in a dilute dispersion (3 mg mL−1). In addition, an effective volume fraction (i.e. packing fraction) φ = Vm/Vt is defined, where Vt is the volume of a micelle dispersion (see ESI,† Section S2, SI-Table 2).The calculations show that the total volume of micelles (Vm) at concentrations ≥7.5 wt% and at 10 °C is larger than Vt (SI-Table 2, ESI†). This indicates that the effective volume fraction (φ) can be even above the maximum random packing fraction for monodisperse hard spheres Φrcp ≈ 0.6420,21 possibly due to compressible deformation of the relatively soft micelles. Consequently, at the same temperature the volume of a given micelle in a dilute dispersion is larger than its volume in a concentrated dispersion as visualized schematically in Fig. 3.
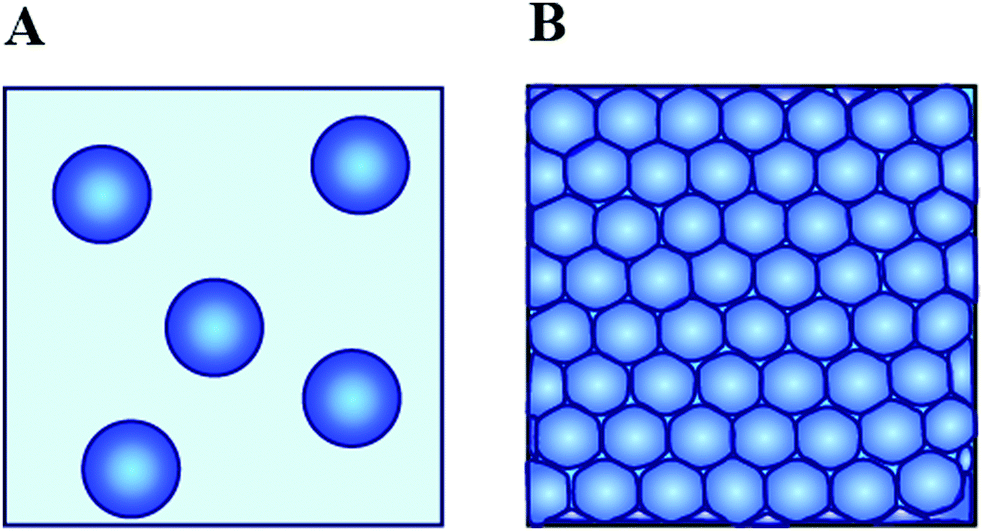 | ||
| Fig. 3 (A) Micelles in a dilute dispersion (B) compression of micelles in a concentrated dispersion. | ||
The storage modulus (G′) of several micellar dispersions was measured while the temperature was increased from 10 to 40 °C (Fig. 4A). The sample at a concentration of 7.5 wt% displayed a low G′ of ∼10 Pa with tanδ ≈ 0.85 at 10 °C. By increasing temperature to 40 °C, this sample displayed a liquid state (tanδ ≈ 4). Below the LCST (10 °C), samples at concentrations of 10, 12.5, and 15 wt% showed G′ values of ∼700, 3000, and 6000 Pa, respectively with tan δ ≈ 0.05, demonstrating solid-like behavior with a concentration dependent G′. By increasing the temperature above the LCST (40 °C), the G′ values decreased significantly to about a few pascals (<2 Pa) with tanδ ≥ 1, indicating a transition from solid-like to liquid-like. The samples with 20 and 30 wt% micelles exhibited substantial G′ values of ∼17000 and ∼28000 Pa, respectively, with tan δ ∼ 0.05 below the LCST (10 °C). At temperatures above the LCST (40 °C), their G′ decreased to ∼150 Pa (tanδ ∼ 0.5) and ∼3000 Pa (tanδ ∼0.2), respectively, meaning that no transition to liquid-like behavior had occurred.
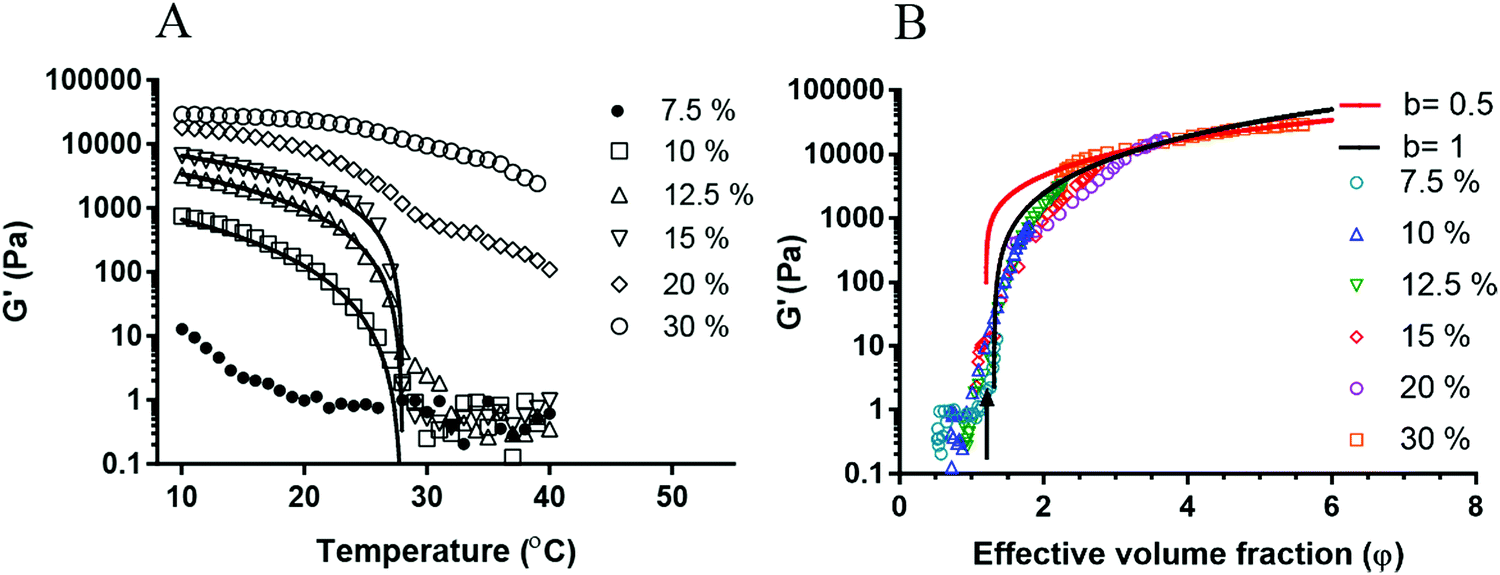 | ||
| Fig. 4 (A) Storage moduli (G′) of micellar dispersions as a function of temperature and for different concentrations in PBS. The solid curves are the best fit of G′ ∼ (Tc − T)γ to the data of samples with concentrations 10, 12.5, and 15%. (B) G′ as a function of effective volume fraction (φ) at different micellar concentrations at different temperatures. The solid curve is the best fit of G′ ∼ φ(φ − φc) with φc = 1.31. | ||
The temperature dependency of storage modulus for micellar dispersions differing in concentrations can be described by critical-like behaviour: G′ ∼ (Tc − T)γ,47,48 in which Tc is the critical temperature and γ is the critical exponent. The critical temperature Tc is set at 28 ± 0.5 °C as evidenced from the sharp decrease in the experimental values of G′ in samples with 10, 12.5, and 15 wt% (Fig. 4A). The critical temperature is the same for different concentrations considering 0.5 °C error in measuring the temperature. This temperature coincides with the inflection point of the size–temperature curve in Fig. 2 and is close to the LCST of PNC (∼34 °C) and PNE (∼29 °C). The solid curves in Fig. 4A show the best fits of the above equation to data points of samples 10, 12.5, and 15 wt% with a fixed Tc = 28 °C and yielded γ values of 2.1, 1.6, and 1.3 (all with an absolute error of ∼0.1), respectively. This demonstrates that the critical exponent γ decreases with increasing concentration of the samples. Below the critical temperature, the core of micelles is hydrated, which results in an increase in micelle size (∼35 nm vs. ∼48 nm at 40 and 10 °C, respectively, Fig. 2B). Consequently, micelles were jammed together (φ ≥ 1.8) and formed a colloidal glass with a substantial value of G′. Increasing temperature above Tc and consequent reduction in the size of micelles resulted in a decrease in the effective volume fraction (φ ≤ 1), and thus the average number of neighbors in direct contact with each other decreases31 resulting in a lower G′value and also in flow (tanδ ≥ 1). This observation suggests that φ is the sole parameter controlling the rheological properties of the system. The samples with concentrations of 20 and 30 wt% did not show a sharp transition at 28 °C but represented a solid-like behavior above and below this temperature. This is due to the fact that at these concentrations φ values are so high (1.4 ≤ φ ≤ 5.6) that the reduction in the size of micelles is not significant enough to result in a glass-liquid transition (tanδ ≤ 0.5 below and above Tc). Therefore, the reduction in the size of micelles only reduces the extend of compression of micelles into each other which results in a lower G′ and a higher tanδ above Tc (e.g. micellar dispersion 20 wt% displayed a G′ of 150 (tanδ of 0.5) and 17000 Pa (tanδ of 0.05) at 40 and 10 °C, respectively).
Fig. 4B shows G′ as a function of φ for micellar dispersions of different concentrations and temperatures. This figure shows that data points of different samples coincide on a master curve demonstrating that φ is the sole parameter controlling the transition behavior of the system. As shown in this figure, G′ substantially increases at a φ of ∼1.2 (black arrow) above which the system shows solid-like behavior with 0.05 ≤ tanδ ≤ 0.85. To quantitatively link the sharp transition of G′ to φ, a disordered lattice model for hard-sphere colloidal glasses was used that gives the non-affine expression of the storage modulus as G′ ∼ φ(z − zc), in which z is the average number of neighbors of one micelle in the dispersion (coordination number)31,32 and zc = 4 is the critical number at the glass transition when φ = φc.31φc is the critical volume fraction at which the glass transition occurs. According to Zaccone et al.,31φ and z are related via z − zc = (φ − φc)b, therefore it reads G′ = kφ(φ − φc)b. The exponent b depends on the micelle-micelle interaction, including steric contributions. The best fit with three fitting parameters to the data points of Fig. 4B, yields the fitting parameters b = 0.98, k = 1821 Pa and φc = 1.31. b = 1 indicates that φ and z are linearly proportional. By fixing the exponent b at one, k = 1769 Pa and φc = 1.31 will be achieved as shown by the solid black curve in Fig. 4B. In addition, b = 0.5 has also been used in the literature for describing mechanical properties of soft micro particle systems.49–51 By fixing the exponent b at 0.5 and fitting the data using the above function k = 2584 Pa and φc = 1.2 will be achieved. The result of this fit is shown by the red solid curve in Fig. 4B. As it is shown in Fig. 4B, b = 1 provides a better description of all the experimental data while b = 0.5 describes the behavior of the highest concentration (30%) series. Although our model predicts well the behavior of the system at high volume fractions, however, at lower volume fractions (φ < 1.3) it cannot capture well the straight evolution of G′. In the literature, an exponential growth is observed for increasing G′ as a function of the volume fraction for the low volume fractions ranges52 which can be explained by the DooLittle equation.53 This exponential model might predict the evolution of G′ at lower volume fractions in our system.
Furthermore, data of Fig. 4B show that the two high concentration micellar dispersions display 1.4 ≤ φ ≤ 5.6 over the whole temperature range which is well above φc. Therefore, these two samples only display solid state behavior above and below Tc and do not exhibit a transition from solid- to liquid state.
The behavior of our micellar system is in contrast with previous studies on PNIPAM microgels. For example, Weitz et al.29 observed that a dense dispersion of PNIPAM microgel particles (radius of 260 nm at 41 °C) first showed a glass transition and then after liquefication formed a gel upon an increase in temperature above the LCST which is ascribed by the authors to the formation of stable clusters of aggregated PNIPAM microgels above the LCST.29 The different behavior of the micelle dispersion system described in this study compared to the previous microgel systems could be attributed to the presence of the PEG corona that covers the micelles. Hence, above the LCST the hydrophilic PEG corona is exposed (SI-Fig. 1, ESI†), which avoids hydrophobic interactions between the dehydrated and hydrophobic PNIPAM cores and consequent particle aggregation. Besides, the slightly negative zeta potential (−4.2 ± 0.2 mV) may also contribute to the stability of the dispersions of micelles by preventing their aggregation due to charge repulsion. A similar observation was made for micelles based on poly(ethylene oxide)–polystyrene–poly(ethylene oxide) triblock copolymers in ionic liquids, where increasing the concentration led to the formation of a soft elastic material with a reduced nanoparticle size attributed here to compression of the PEG corona.54
To clarify the storage modulus dependency on φ shown in Fig. 4B, G′ of six dispersions of different concentrations of 7.5, 10, 12.5, 15, 20, and 30 wt% at 10 and 40 °C were compared. Fig. 5A shows the total volume of micelles (Vm) for each sample which increases linearly with concentration. As expected, the slope is higher for samples at 10 °C than at 40 °C due to the hydration of the PNIPAM chains in the micellar core. A horizontal dashed line in Fig. 5A shows that Vm of the 12.5 wt% dispersion at 10 °C (2.2 mL) is very close to Vm of 30 wt% dispersion at 40 °C (2.1 mL) (SI-Table 2, ESI†). According to the model presented in Fig. 4B it is expected that these two samples display similar G′ although their concentration and temperatures are very different. Fig. 5B shows that G′ of the 12.5 wt% micellar dispersion at 10 °C (∼2600 Pa) is indeed very close to G′ ∼ 2400 Pa found for the 30% sample at 40 °C (horizontal dashed line in Fig. 5B). These results indicate a concentration-temperature equivalence principle in our system.
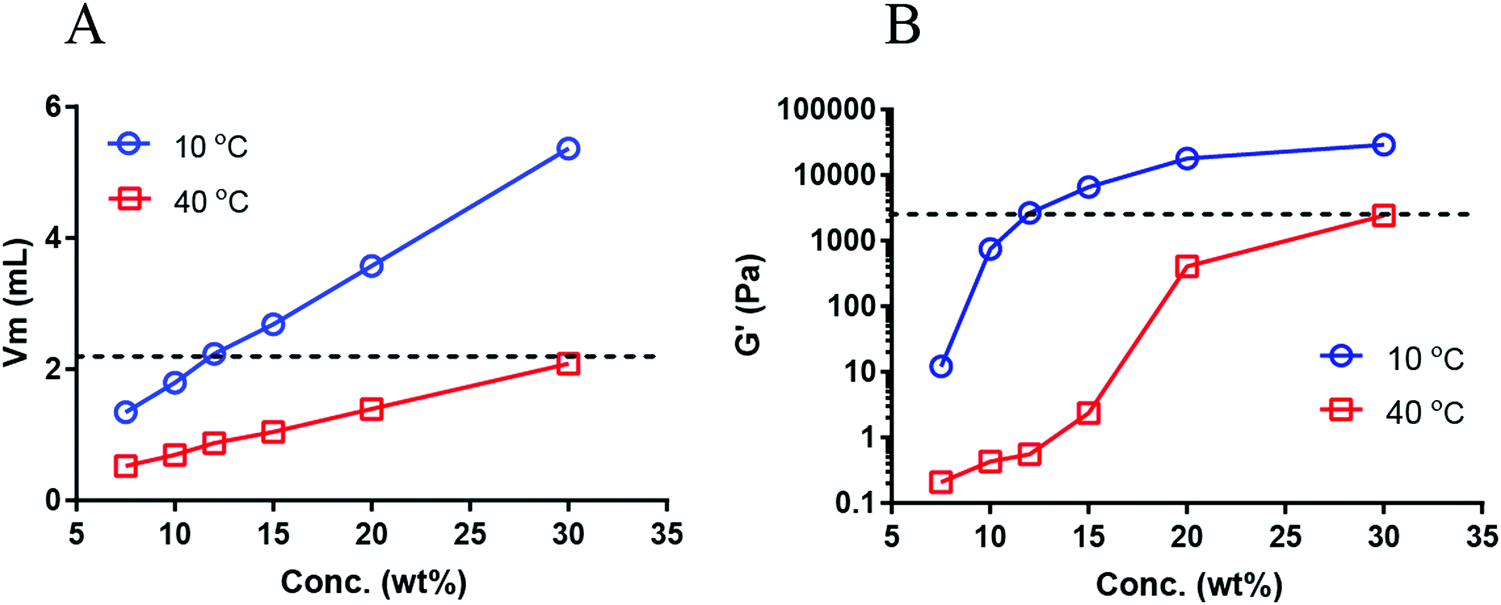 | ||
| Fig. 5 (A) Total volume of micelles (Vm) as a function of concentration at 10 and 40 °C. Vm for each dispersion was calculated based on the radius of micelles in a diluted micellar dispersion (3 mg mL−1) (see SI-Table 2, ESI†). (B) G′ as a function of the concentration of micellar dispersion for the two temperatures. | ||
Yield stress is an important parameter for materials that need to undergo extrusion processes such as 3D-printing. Fig. 6A shows that a micellar dispersion with a concentration of 20 wt% can be easily extruded through a nozzle even below the Tc. When the applied stress is larger than the yield stress of the material, the dispersion flows and can thus be extruded. However, after extrusion when the applied stress is below the yield stress the material retains its shape and shows solid-like behavior.55 To investigate the yield behavior of the micellar dispersions, amplitude sweep rheology measurements were performed on micellar dispersions of 12.5 and 30 wt% concentrations. In Fig. 6B, G′ and G′′ are shown as a function of applied stress for the two samples with the same packing fraction φ ∼ 2.2 at different concentrations and temperatures. Both samples show similar G′ and G′′ values at low shear stresses (linear regime). For both samples, with increasing stress, G′ drops and becomes comparable to G′′ (∼660 Pa) at a stress of about 220 Pa (with an oscillation frequency of 1 Hz). This point is known as the yield point of the material and the corresponding stress is called yield stress.55 Therefore, the samples with similar packing ratio not only show similar G′ and G′′ in the linear deformation regime but also display the same yield stresses, and equivalent rheology behaviour in the nonlinear regime.
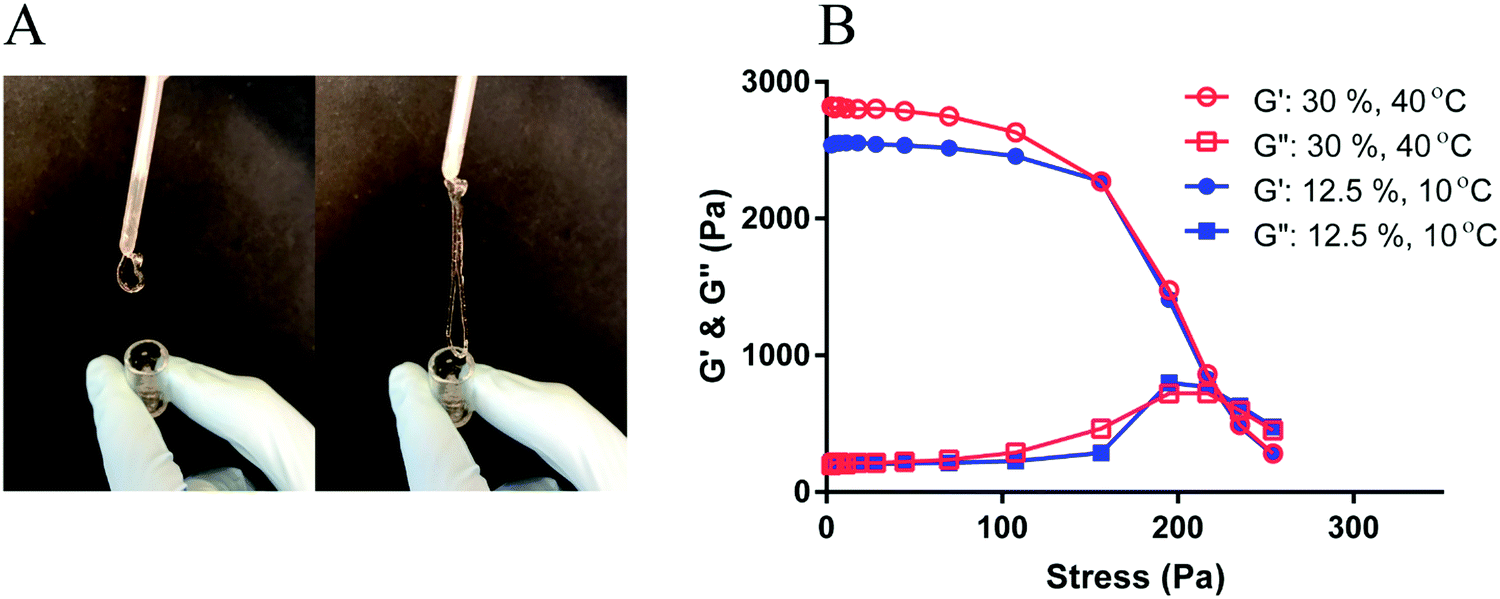 | ||
| Fig. 6 (A) Extrusion of a micellar dispersion at a concentration of 20 wt% at 10 °C through a 100 μL tip of a positive displacement pipet. (B) G′ and G′′ as a function of shear stress for two dispersions with the same packing fraction (φ ∼ 2.2). | ||
The rheology experiments were performed at a frequency of 1 Hz as frequency-independent behavior for G′ was anticipated when φ is above the critical φ. Such behavior has been observed in similar systems composed of soft microparticle suspensions below the LCST.29 However, at high frequencies, deviations from the frequency-independent plateau may occur due to the rearrangement of packed particles.
4. Conclusion
In this study, the rheological properties of dense dispersions of flower-like micelles have been investigated. Temperature dependent change in the size of micelles resulted in formation of a colloidal glass with predictable storage modulus by changing the micelles’ concentration from 7.5 to 30 wt% at temperatures from 10 to 40 °C. When the storage modulus of different micellar dispersions at different concentrations and temperatures is plotted as a function of the effective volume fraction, the data points coincide onto a master curve. This indicates that the effective volume fraction of the micellar dispersions is the sole parameter controlling their rheological properties. Furthermore, the volume fraction induced glass transition in the system is described by a theoretical model indicating a critical volume fraction of 1.31, which is very close to the experimental value (φ = 1.2). The observed transition from glass to liquid-like phase upon increasing temperature resembles upper critical solution temperature (UCST) behavior. Therefore, the developed system may find applications in fields requiring UCST polymers.Conflicts of interest
There are no conflicts of interest to declare.Acknowledgements
The Netherlands Organization for Scientific Research (NWO/VIDI 13457 and NWO/Aspasia 015.009.038) is acknowledged for funding.References
- M. Najafi, E. Hebels, W. E. Hennink and T. Vermonden, Poly(N-isopropylacrylamide): Physicochemical Properties and Biomedical Applications: Chemistry, Properties and Applications, in Temperature-Responsive Polymers: Chemistry, Properties, and Applications, ed. V. V. Khutoryanskiy and K. T. Georgiou, John Wiley & Sons, 2018, pp. 1–34 Search PubMed.
- M. Heskins and J. E. Guillet, Solution Properties of Poly(N-isopropylacrylamide), J. Macromol. Sci., Part A: Pure Appl. Chem., 1968, 2(8), 1441–1455 CrossRef CAS.
- S. Ashraf, H.-K. Park, H. Park and S.-H. Lee, Snapshot of phase transition in thermoresponsive hydrogel PNIPAM: Role in drug delivery and tissue engineering, Macromol. Res., 2016, 24(4), 297–304 CrossRef CAS.
- M. Cao, Y. Wang, X. Hu, H. Gong, R. Li, H. Cox, J. Zhang, T. A. Waigh, H. Xu and J. R. Lu, Reversible Thermoresponsive Peptide–PNIPAM Hydrogels for Controlled Drug Delivery, Biomacromolecules, 2019, 20(9), 3601–3610 CrossRef CAS.
- M. Najafi, N. Kordalivand, M. A. Moradi, J. van den Dikkenberg, R. Fokkink, H. Friedrich, N. Sommerdijk, M. Hembury and T. Vermonden, Native Chemical Ligation for Cross-Linking of Flower-Like Micelles, Biomacromolecules, 2018, 19(9), 3766–3775 CrossRef CAS.
- A. J. de Graaf, E. Mastrobattista, T. Vermonden, C. F. van Nostrum, D. T. S. Rijkers, R. M. J. Liskamp and W. E. Hennink, Thermosensitive Peptide-Hybrid ABC Block Copolymers Obtained by ATRP: Synthesis, Self-Assembly, and Enzymatic Degradation, Macromolecules, 2012, 45(2), 842–851 CrossRef CAS.
- H. Wei, S.-X. Cheng, X.-Z. Zhang and R.-X. Zhuo, Thermo-sensitive polymeric micelles based on poly(N-isopropylacrylamide) as drug carriers, Prog. Polym. Sci., 2009, 34(9), 893–910 CrossRef CAS.
- M. D. C. Topp, P. J. Dijkstra, H. Talsma and J. Feijen, Thermosensitive Micelle-Forming Block Copolymers of Poly(ethylene glycol) and Poly(N-isopropylacrylamide), Macromolecules, 1997, 30(26), 8518–8520 CrossRef CAS.
- M. Le Bohec, M. Banère, S. Piogé, S. Pascual, L. Benyahia and L. Fontaine, Sol–gel reversible metallo-supramolecular hydrogels based on a thermoresponsive double hydrophilic block copolymer, Polym. Chem., 2016, 7(44), 6834–6842 RSC.
- A. J. de Graaf, S. Azevedo Prospero dos II, E. H. Pieters, D. T. Rijkers, C. F. van Nostrum, T. Vermonden, R. J. Kok, W. E. Hennink and E. Mastrobattista, A micelle-shedding thermosensitive hydrogel as sustained release formulation, J. Controlled Release, 2012, 162(3), 582–590 CrossRef CAS.
- C. Wang, G. Zhang, G. Liu, J. Hu and S. Liu, Photo- and thermo-responsive multicompartment hydrogels for synergistic delivery of gemcitabine and doxorubicin, J. Controlled Release, 2017, 259, 149–159 CrossRef CAS.
- A. Basu, Y. Xu, T. Still, P. E. Arratia, Z. Zhang, K. N. Nordstrom, J. M. Rieser, J. P. Gollub, D. J. Durian and A. G. Yodh, Rheology of soft colloids across the onset of rigidity: scaling behavior, thermal, and non-thermal responses, Soft Matter, 2014, 10(17), 3027–3035 RSC.
- S. Minami, D. Suzuki and K. Urayama, Rheological aspects of colloidal gels in thermoresponsive microgel suspensions: formation, structure, and linear and nonlinear viscoelasticity, Curr. Opin. Colloid Interface Sci., 2019, 43, 113–124 CrossRef CAS.
- C. Pellet and M. Cloitre, The glass and jamming transitions of soft polyelectrolyte microgel suspensions, Soft Matter, 2016, 12(16), 3710–3720 RSC.
- A. Ghosh, G. Chaudhary, J. G. Kang, P. V. Braun, R. H. Ewoldt and K. S. Schweizer, Linear and nonlinear rheology and structural relaxation in dense glassy and jammed soft repulsive pNIPAM microgel suspensions, Soft Matter, 2019, 15(5), 1038–1052 RSC.
- M. Karg, A. Pich, T. Hellweg, T. Hoare, L. A. Lyon, J. J. Crassous, D. Suzuki, R. A. Gumerov, S. Schneider, I. I. Potemkin and W. Richtering, Nanogels and Microgels: From Model Colloids to Applications, Recent Developments, and Future Trends, Langmuir, 2019, 35(19), 6231–6255 CrossRef CAS.
- Y. Guan and Y. Zhang, PNIPAM microgels for biomedical applications: from dispersed particles to 3D assemblies, Soft Matter, 2011, 7, 6375–6384 RSC.
- C. Wu, S. Zhou, S. C. F. Au-yeung and S. Jiang, Volume phase transition of spherical microgel particles, Angew. Makromol. Chem., 1996, 240(1), 123–136 CrossRef CAS.
- Y. Hirokawa and T. Tanaka, Volume phase transition in a non-ionic gel, AIP Conf. Proc., 1984, 107(1), 203–208 CrossRef CAS.
- Our Molecular Physics Correspondent, What is Random Packing?, Nature, 1972, 239, 488–489 CrossRef.
- S. Torquato, T. M. Truskett and P. G. Debenedetti, Is Random Close Packing of Spheres Well Defined?, Phys. Rev. Lett., 2000, 84(10), 2064–2067 CrossRef CAS.
- H. Senff and W. Richtering, Temperature sensitive microgel suspensions: Colloidal phase behavior and rheology of soft spheres, J. Chem. Phys., 1999, 111(4), 1705–1711 CrossRef CAS.
- M. Cloitre, R. Borrega, F. Monti and L. Leibler, Glassy Dynamics and Flow Properties of Soft Colloidal Pastes, Phys. Rev. Lett., 2003, 90(6), 68303–68307 CrossRef.
- T. G. Mason and D. A. Weitz, Linear Viscoelasticity of Colloidal Hard Sphere Suspensions near the Glass Transition, Phys. Rev. Lett., 1995, 75(14), 2770–2773 CrossRef CAS.
- T. Wang, L. Jin, Y. Song, J. Li, Y. Gao and S. Shi, Rheological study on the thermoinduced gelation behavior of poly(N-isopropylacrylamide-co-acrylic acid) microgel suspensions, J. Appl. Polym. Sci., 2017, 134(35), 45259 CrossRef.
- S. Minami, T. Watanabe, D. Suzuki and K. Urayama, Viscoelasticity of dense suspensions of thermosensitive microgel mixtures undergoing colloidal gelation, Soft Matter, 2018, 14(9), 1596–1607 RSC.
- S. Minami, T. Watanabe, D. Suzuki and K. Urayama, Rheological properties of suspensions of thermo-responsive poly(N-isopropylacrylamide) microgels undergoing volume phase transition, Polym. J., 2016, 48(11), 1079–1086 CrossRef CAS.
- T. Gan, Y. Zhang and Y. Guan, In Situ Gelation of P(NIPAM-HEMA) Microgel Dispersion and Its Applications as Injectable 3D Cell Scaffold, Biomacromolecules, 2009, 10(6), 1410–1415 CrossRef CAS.
- G. Romeo, A. Fernandez-Nieves, H. M. Wyss, D. Acierno and D. A. Weitz, Temperature-Controlled Transitions Between Glass, Liquid, and Gel States in Dense p-NIPA Suspensions, Adv. Mater., 2010, 22(31), 3441–3445 CrossRef CAS.
- J. Es Sayed, C. Lorthioir, P. Perrin and N. Sanson, PEGylated NiPAM microgels: synthesis, characterization and colloidal stability, Soft Matter, 2019, 15(5), 963–972 RSC.
- A. Zaccone and E. M. Terentjev, Disorder-Assisted Melting and the Glass Transition in Amorphous Solids, Phys. Rev. Lett., 2013, 110(17), 178002 CrossRef.
- A. Lappala, A. Zaccone and E. M. Terentjev, Polymer glass transition occurs at the marginal rigidity point with connectivity z* = 4, Soft Matter, 2016, 12(35), 7330–7337 RSC.
- K. Ulbrich, V. Šubr, J. Strohalm, D. Plocová, M. Jelínková and B. Říhová, Polymeric drugs based on conjugates of synthetic and natural macromolecules: I. Synthesis and physico-chemical characterisation, J. Controlled Release, 2000, 64(1), 63–79 CrossRef CAS.
- K. W. M. Boere, B. G. Soliman, D. T. S. Rijkers, W. E. Hennink and T. Vermonden, Thermoresponsive Injectable Hydrogels Cross-Linked by Native Chemical Ligation, Macromolecules, 2014, 47(7), 2430–2438 CrossRef CAS.
- K. W. M. Boere, J. van den Dikkenberg, Y. Gao, J. Visser, W. E. Hennink and T. Vermonden, Thermogelling and Chemoselectively Cross-Linked Hydrogels with Controlled Mechanical Properties and Degradation Behavior, Biomacromolecules, 2015, 16(9), 2840–2851 CrossRef CAS.
- O. Soga, C. F. van Nostrum, A. Ramzi, T. Visser, F. Soulimani, P. M. Frederik, P. H. H. Bomans and W. E. Hennink, Physicochemical Characterization of Degradable Thermosensitive Polymeric Micelles, Langmuir, 2004, 20(21), 9388–9395 CrossRef CAS.
- BioScienceTM, U. Reactive Tag Viscosity Probes, https://ursabioscience.com/technology/viscosity-probes/conjugatable-viscosity-probes.
- T. Suhina, B. Weber, C. E. Carpentier, K. Lorincz, P. Schall, D. Bonn and A. M. Brouwer, Fluorescence Microscopy Visualization of Contacts Between Objects, Angew. Chem., Int. Ed., 2015, 54(12), 3688–3691 CrossRef CAS.
- K. Matyjaszewski and J. Xia, Atom Transfer Radical Polymerization, Chem. Rev., 2001, 101(9), 2921–2990 CrossRef CAS.
- D. W. Smithenry, M.-S. Kang and V. K. Gupta, Telechelic Poly(N-isopropylacrylamide): Polymerization and Chain Aggregation in Solution, Macromolecules, 2001, 34(24), 8503–8511 CrossRef CAS.
- F. Ganachaud, M. J. Monteiro, R. G. Gilbert, M.-A. Dourges, S. H. Thang and E. Rizzardo, Molecular Weight Characterization of Poly(N-isopropylacrylamide) Prepared by Living Free-Radical Polymerization, Macromolecules, 2000, 33(18), 6738–6745 CrossRef CAS.
- P. E. Dawson, T. W. Muir, I. Clark-Lewis and S. B. Kent, Synthesis of proteins by native chemical ligation, Science, 1994, 266(5186), 776–779 CrossRef CAS.
- A. J. de Graaf, K. W. Boere, J. Kemmink, R. G. Fokkink, C. F. van Nostrum, D. T. Rijkers, J. van der Gucht, H. Wienk, M. Baldus, E. Mastrobattista, T. Vermonden and W. E. Hennink, Looped structure of flowerlike micelles revealed by 1H NMR relaxometry and light scattering, Langmuir, 2011, 27(16), 9843–9848 CrossRef CAS.
- L. Martínez-Jothar, S. Doulkeridou, R. M. Schiffelers, J. Sastre Torano, S. Oliveira, C. F. van Nostrum and W. E. Hennink, Insights into maleimide-thiol conjugation chemistry: Conditions for efficient surface functionalization of nanoparticles for receptor targeting, J. Controlled Release, 2018, 282, 101–109 CrossRef.
- R. O. Loutfy, Fluorescence probes for polymer free-volume. Pure and Applied Chemistry, 1986, vol. 58, p. 1239 Search PubMed.
- H. Jin, M. Liang, S. Arzhantsev, X. Li and M. Maroncelli, Photophysical Characterization of Benzylidene Malononitriles as Probes of Solvent Friction, J. Phys. Chem. B, 2010, 114(22), 7565–7578 CrossRef CAS.
- A. Onuki, Phase Transition Dynamics, Cambridge University Press, Cambridge, 2002 Search PubMed.
- H. E. Stanley, Introduction to phase transitions and critical phenomena, Oxford University Press, New York, 1971 Search PubMed.
- M.-D. Lacasse, G. S. Grest, D. Levine, T. G. Mason and D. A. Weitz, Model for the Elasticity of Compressed Emulsions, Phys. Rev. Lett., 1996, 76(18), 3448–3451 CrossRef CAS.
- L. Mohan and R. T. Bonnecaze, Short-ranged pair distribution function for concentrated suspensions of soft particles, Soft Matter, 2012, 8(15), 4216–4222 RSC.
- F. Scheffold, F. Cardinaux and T. G. Mason, Linear and nonlinear rheology of dense emulsions across the glass and the jamming regimes, J. Phys.: Condens. Matter, 2013, 25(50), 502101 CrossRef CAS.
- G. P. Baeza, C. Dessi, S. Costanzo, D. Zhao, S. Gong, A. Alegria, R. H. Colby, M. Rubinstein, D. Vlassopoulos and S. K. Kumar, Network dynamics in nanofilled polymers, Nat. Commun., 2016, 7(1), 11368 CrossRef.
- A. K. Doolittle, Studies in Newtonian Flow. II. The Dependence of the Viscosity of Liquids on Free-Space, J. Appl. Phys., 1951, 22(12), 1471–1475 CrossRef CAS.
- S. Gkermpoura, M. Obiols-Rabasa, Z. Iatridi and C. Tsitsilianis, Thermo-Resistant Soft Glassy Suspensions of Polymeric Micellar Nanoparticles in Ionic Liquid, ACS Appl. Mater. Interfaces, 2015, 7(23), 12411–12421 CrossRef CAS.
- Y. Rahmani, M. Habibi, A. Javadi and D. Bonn, Coiling of yield stress fluids, Phys. Rev. E: Stat., Nonlinear, Soft Matter Phys., 2011, 83, 56327–56331 CrossRef.
Footnote |
| † Electronic supplementary information (ESI) available: Static and dynamic light scattering (SLS and DLS) (SI-Section 1); calculation of effective volume fraction (φ) (SI-Section 2). See DOI: 10.1039/d0sm01505a |
| This journal is © The Royal Society of Chemistry 2021 |