
 Open Access Article
 This Open Access Article is licensed under a Creative Commons Attribution-Non Commercial 3.0 Unported Licence
Novel single pass biogas-to-diesel process using a Fischer–Tropsch catalyst designed for high conversion†
Chelsea L.
Tucker‡
 *a,
Ankur
Bordoloi
b and
Eric
van Steen
a
*a,
Ankur
Bordoloi
b and
Eric
van Steen
a
aCatalysis Institute, Department of Chemical Engineering, University of Cape Town, Rondebosch, Cape Town, South Africa. E-mail: c.l.tucker@rug.nl
bCSIR Indian Institute of Petroleum, Dehradun, India
First published on 15th October 2021
Abstract
The decentralized production of low carbon fuels using the Fischer–Tropsch synthesis requires a less complex and more cost-effective process design. This can be achieved by operating the Fischer–Tropsch process in single pass mode (i.e., without recycle), which allows for omission of the air separation unit, CO2 removal step and the energy-intensive recompression. However, single pass mode necessitates operating the Fischer–Tropsch synthesis at a higher CO conversion than typically seen in industry (resulting in high H2O and low CO and H2 partial pressures). These harsh conditions cause a significant decrease in the C5+ yield as a consequence of the increase in the selectivity for the formation of CH4 and CO2. Modification of an industrial Pt–Co/Al2O3 catalyst with manganese resulted in increased fuel production of up to 14 C-% under high conversion conditions. Here, we present a technical analysis of a novel single pass biogas-to-diesel process that can operate off-grid in remote regions, focusing on counteracting the loss of yield under single pass operation by adjusting the Fischer–Tropsch conversion (XCO = 60–90%), catalyst characteristics (Pt–Co/Al2O3vs. Mn–Pt–Co/Al2O3) and refining configuration (with and without a hydrocracker). The optimal case, XCO = 80% using a Mn–Co/Al2O3 catalyst results in a production rate of 246 bbl per day of on-spec distillate from 400 kmol h−1 biogas together with the net power generation of 1.8 MW.
Introduction
Sustainable Development Goal 7 (SDG 7) adopted by the United Nations General Assembly aims to give access to affordable, sustainable, and modern energy to all. Hence, there is growing global momentum to substantially increase the share of renewable energy in the energy mix by 2030. A significant part of the energy world-wide is used for transportation, and technologies that can produce transportation fuels from locally available, renewable carbon-based resources are vital for ensuring this goal is met.The Fischer–Tropsch process can produce carbon-neutral fuels from localized carbonaceous material such as organic waste, biomass,1–3 or biogas.4,5 However, the Fischer–Tropsch process is typically implemented on a large industrial scale (using either coal or natural gas as a feedstock) due to process complexity and high capital costs.6 The application of this process on a small, decentralized scale using biogas requires a reduction in both operational complexity and capital costs. The latter may be achieved by omitting the rather costly air separation unit from the design of the process (this unit can contribute up to 23% of the total cost),7,8 and using air rather than oxygen in the reformer. Syngas generation without an air-separation unit produces a nitrogen-rich synthesis gas, thus necessitating the removal of the recycle streams in the process. Hence, the Fischer–Tropsch synthesis is required to operate in single pass mode under high CO conversions to maximize the yield of liquid hydrocarbons.
We previously reported9,10 on the design of a novel single pass biogas-to-diesel process operating at high CO conversions for decentralized fuel production (see Fig. 1), called Decentralized Diesel. The single pass design negates the need for energy-intensive CO2 removal (as dilute synthesis gas can be used), as well as recompression within the recycle streams. Non-recycled gas is used to generate power, enabling off-grid applications.
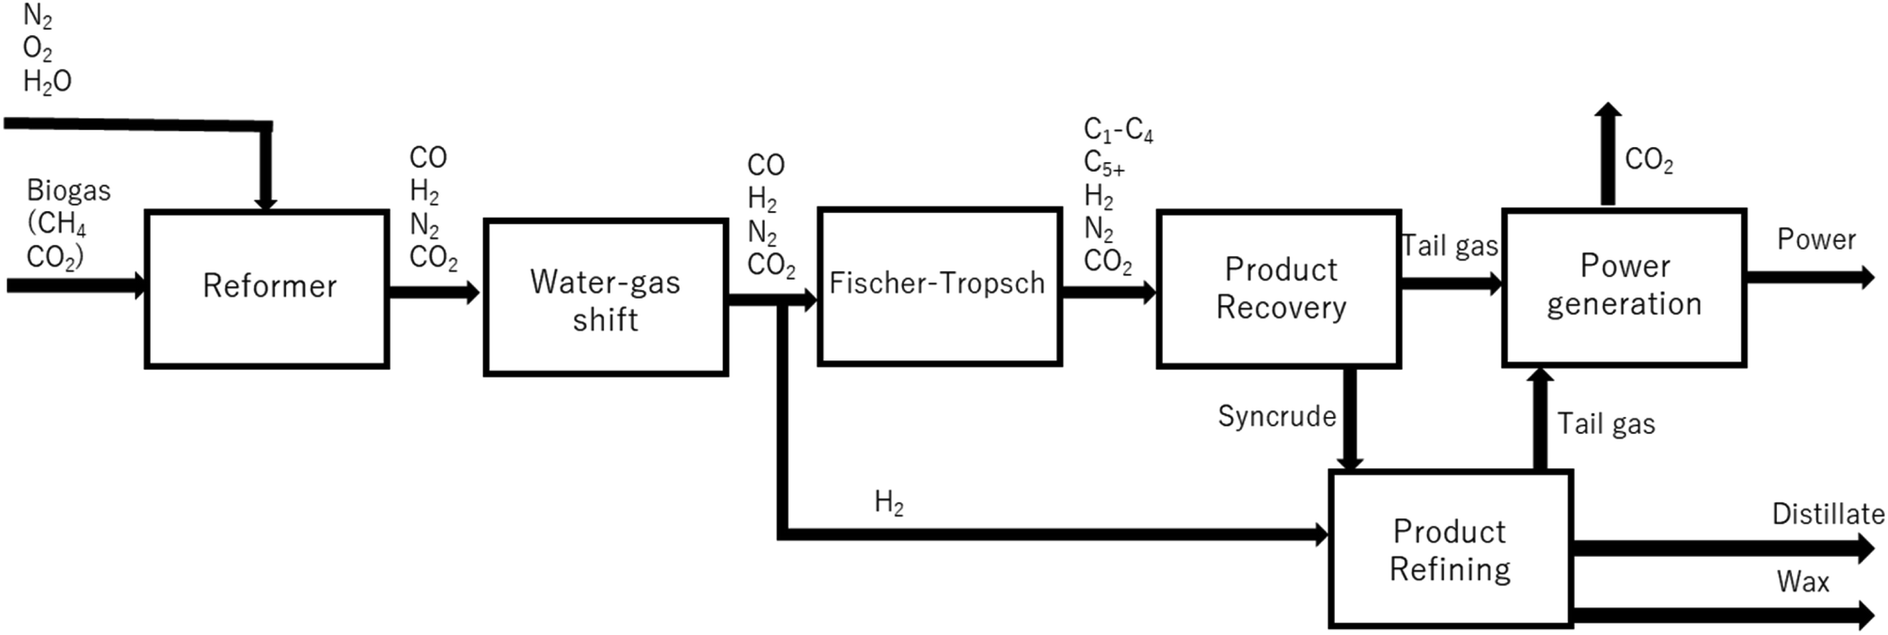 | ||
| Fig. 1 Schematic of the small-scale, single pass biogas-to-distillate process. | ||
Other single pass Fischer–Tropsch systems have been previously investigated11–14 with promising results, albeit without a consideration of using higher CO conversions as a mechanism for enhancing fuel yields. The fundamental problem associated with operating the Fischer–Tropsch synthesis at a high CO conversion is the reduced activity and selectivity15–17 (due to high partial pressures of H2O and low partial pressures of CO and H2 within the reactor). For a slurry bed reactor system, the selectivity for the formation of the undesired products, CH4 and CO2, increases significantly above CO conversion levels of 70% for a standard industrial cobalt-based Fischer–Tropsch catalyst15,17,18 resulting in a strong decrease in the C5+ yield, thus rendering operation at CO conversions above this limit practically unfeasible.
This issue can be negated by a Fischer–Tropsch catalyst specifically designed for high conversions operation. We recently developed a manganese-promoted cobalt catalyst that yields far better productivity at high CO conversions than the standard industrial cobalt catalyst. The manganese-promoted catalyst, Mn–Pt–Co/Al2O3 (ref. 9 and 19) with a Mn![[thin space (1/6-em)]](https://www.rsc.org/images/entities/char_2009.gif) :Co molar ratio of 0.15 decreased the selectivity towards CH4 (by 12 C-%) and CO2 (by 7 C-%) at high CO conversion (XCO = 90%) when compared to standard industrial Pt–Co/Al2O3. This led to a significant enhancement of fuel yield (C5+) up to 14 C-% at XCO = 90% (see Fig. 2).
:Co molar ratio of 0.15 decreased the selectivity towards CH4 (by 12 C-%) and CO2 (by 7 C-%) at high CO conversion (XCO = 90%) when compared to standard industrial Pt–Co/Al2O3. This led to a significant enhancement of fuel yield (C5+) up to 14 C-% at XCO = 90% (see Fig. 2).
 | ||
| Fig. 2 The yield of C5+ as a function of CO conversion for standard industrial Pt–Co/Al2O3 and industrial Mn–Pt–Co/Al2O3 Mn:Co = 0.15 mol/mol.9,19 | ||
The aim of this investigation is to determine the optimal Fischer–Tropsch conversion and refining configuration for a single pass biogas-to-diesel process using (i) a standard industrial catalyst Pt–Co/Al2O3, and (ii) a catalyst designed for high conversion environments Mn–Pt–Co/Al2O3.
The design of a once-through biogas-to-distillate process will be evaluated using an Aspen Plus® model. A total of 16 cases will be tested including: four different levels of conversion in the Fischer–Tropsch synthesis (60%, 70%, 80% and 90%), using two different cobalt-based Fischer–Tropsch catalysts (Pt–Co/Al2O3 and Mn–Pt–Co/Al2O3) and a partial refining plant with and without hydrocracking.
For the purposes of representing the design via carbon and energy balances, a base case will be used: a once-through system operating with a standard industrial Pt–Co/Al2O3 catalyst in the Fischer–Tropsch synthesis (operated at XCO = 60%) and a partial refining section that includes a hydrocracker.
Model development
The following assumptions were made in the development of the once-through biogas-to-distillate Aspen Plus® model.Overall design
The once-through biogas-to-distillate plant, the development of which is described elsewhere,9 is shown in Fig. 1. In this design, (sweet) clean biogas is reformed to synthesis gas and the ratio of H2:CO is adjusted in a water–gas shift unit. Some of the hydrogen is separated from the stream using a hydrogen separation membrane.20 The syngas is subsequently converted in the Fischer–Tropsch reactor; the products of the Fischer–Tropsch synthesis are separated into light gases, hydrocarbons in the diesel range and wax. The light gases (tail gas) are used to co-generate power via a gas fed power plant. Wax is hydrocracked21 to improve diesel yield. The process was modelled using three Aspen Plus® simulations: syngas cleaning and compression, separation and refining and power production. The hydrogen separation membrane,20 Fischer–Tropsch reaction15 and hydrocracker21 were modelled on Excel using empirical data.
The feed to the plant consists of 400 kmol h−1 clean biogas (molar feed rates into the process are given in Table 1). This is equivalent to biogas produced from 400 t per day of organic municipal solid waste which is roughly equal to the amount of organic waste produced in Sub-Saharan cities with populations between 200000 (ref. 22) and 900000 (ref. 23) (region and income level dependent). These populations are equivalent to well-known cities such as Gaborone, Botswana (232000) and Kigali, Rwanda (860000), respectively.
| Component | Molar flow (kmol h−1) |
|---|---|
| Methane (CH4) | 300 |
| Carbon dioxide (CO2) | 100 |
| Oxygen (O2) | 0–250 |
| Water (H2O) | 0–400 |
| Nitrogen (N2) | 0–940 |
The generation of sweet biogas (post-desulphurization), i.e. anerobic digestion and gas cleanup, were not modelled (the output from these processes using various feedstocks are well documented24–26). The biogas composition (75% CH4 and 25% CO2) was based on a methane-rich stream from the anaerobic digestion of organic waste.24
Air and water are being fed to the reformer. The chosen ranges for oxygen and water vapor flow rate were based on similar studies used for autothermal reforming, steam reforming and tri-reforming.27–29 The nitrogen flow rate was calculated according to the oxygen flow rate and the standard composition of air.
Syngas generation and compression
The syngas generation and compression section comprise a tri-reformer, water gas shift reactor, compression system and hydrogen separation (split ratio defined by requirements in the hydrocracker). Fig. 3 shows the Aspen Plus® simulation of the section. The stream table belonging to the base case (i.e., the Fischer–Tropsch section operating at a conversion of 60% with a Pt–Co/Al2O3 catalyst and a partial refining section including a hydrocracker) can be found in ESI.† | ||
| Fig. 3 Aspen model for syngas generation and compression with a clean biogas feed. | ||
Air and biogas are compressed to 2.7 bar (determined as optimal for maximizing CH4 conversion, whilst minimizing compression requirements) and combined with water pumped to the same conditions. The air, water and biogas feed are preheated to 220 °C before being fed into the tri-reformer. The tri-reformer was modelled as an RGIBBS reactor, presuming that the exit composition is mainly controlled by chemical equilibrium at the given outlet temperature.26,30 Whilst in practice equilibrium may not be achieved, modern reforming catalysts31–34 are reported to operate relatively close to equilibrium exit concentrations,26,35,36 especially at high temperatures.35 Thermodynamic models driven by equilibrium have been shown to satisfactorily estimate the O2 consumption31 and H2/CO ratios at temperatures above 750 °C (ref. 37) in reformers. It must be noted that CH4 conversions and CO2 conversions may deviate slightly from equilibrium at temperatures lower than 750 °C due to inaccuracies in the modelling of coke formation.31
The tri-reformer was designed to deliver a H2/CO ratio sufficient for the Fischer–Tropsch reactor, whilst the water–gas shift unit was designed to provide excess hydrogen needed for the hydrocracker (as determined by the H2:HC ratio requirements). The WGS conversion and exit H2/CO ratio were determined by excess steam addition and inlet temperature (determined by the exit temperature of the feed cooler). The water–gas reactor was modelled as an adiabatic plug flow reactor using an empirical power law (eqn (1)) with parameters for the noble metal catalyst, 0.5%Pt/TiO2.38 The catalyst, 0.5%Pt/TiO2, was used due to its relatively high water–gas shift activity at low-to-medium temperatures, which facilitates single stage operation rather than the more classical two-stage water–gas shift process.39
 | (1) |
 , approach of the product composition to equilibrium38
The water–gas shift reactor product stream is cooled to 35 °C and water is knocked out before entering the 2-stage compressor system (compression ratio = 2.7) with inter-stage cooling. Water is knocked out at each stage.
After the final compressor, a stream of hydrogen is separated off from the Fischer–Tropsch feed stream to be used in the hydrocracker. To achieve this, a hydrogen selective polymeric membrane (Polyimide Matrimid®), which has a good trade-off between the permeability and H2/CO2 and H2/N2 selectivity.20 Permeability and selectivity values for the syngas components through Matrimid® have been well established (see Table 2).20,40–42 The flux of various species through the membrane was calculated using:

Both raffinate and permeate concentrations were calculated based on these permeabilities as reported by David et al.20 The flux through the Matrimid® membrane can be controlled by permeate pressure and membrane area.43 In this case, the lower boundary for permeate pressure was set at ca. 8.8 bar, to make sure that the hydrogen can be recompressed for the hydrocracker in 1 stage with a compression ratio less than 4.
Fischer–Tropsch reactor
The Fischer–Tropsch reactor was modelled using empirical selectivity data taken from our previous studies Pt–Co/Al2O3 and Mn–Pt–Co/Al2O3, molar Mn:Co = 0.15 (ref. 15 and 19) and rate data based on.44
Experimental data of selectivity (CH4, CO2, C5+) and chain growth probability as a function of conversion obtained with these two catalysts were used for this purpose (see Fig. 4) and they were fitted to exponential functions of the form (a × eb×XCO + c) for computational simplicity, with constants determined using least squares regression. The chain growth probability decreases significantly with increased CO conversion. This is due to enhanced water–gas shift activity at high H2O partial pressures, which results in an increase in H2/CO ratios, and an inhibition of chain growth.15 For instance, at CO conversions of XCO = 60%, 70%, 80% and 90% the alpha values are 0.91, 0.90, 0.88 and 0.83 respectively for Pt–Co/Al2O3. The fitting of this data can be seen in Fig. 4 and the constants for the various fits are presented in ESI.† The product selectivity for the relative formation of long chain hydrocarbons (in the range C5–C80) was determined using a standard, single alpha ASF distribution, from which the product distribution at selected conversions were obtained.
 | ||
| Fig. 4 Empirical modelling of the Fischer–Tropsch products as a function of conversion based on selectivity data from our previous study19,45 for Pt–Co/Al2O3 (closed symbols) and Mn–Pt–Co/Al2O3 with a molar ratio of Mn:Co = 0.15 mol/mol (open symbols). | ||
The olefin content in the range C2–C11 is not only significant (between 65% and 10%)15,46 but also strongly dependent on conversion. The olefin/paraffin ratio for each catalyst was determined as a function of carbon number experimentally. The olefin content in the fraction of hydrocarbons was fitted using an empirical model as a function of conversion and carbon number. The olefin content in the fraction of hydrocarbons C11–C22 is ca. 5%.46 Thus, this was used as a constant value for the olefin content in this range. The olefin content in the fraction of linear hydrocarbons C22+ over cobalt-based catalysts is negligible,46 and hence the olefin content in this carbon number fraction was set to zero.
Separation and refining
Wax, distillate, water (incl. aqueous products) and tail gas (a mixture of H2, CO, CO2, CH4, N2 and C2–C10), are separated out in the effluent of the Fischer–Tropsch synthesis and the distillate is refined to meet diesel specifications (see Fig. 5). The stream table for the base case separation and refining section can be found in ESI.†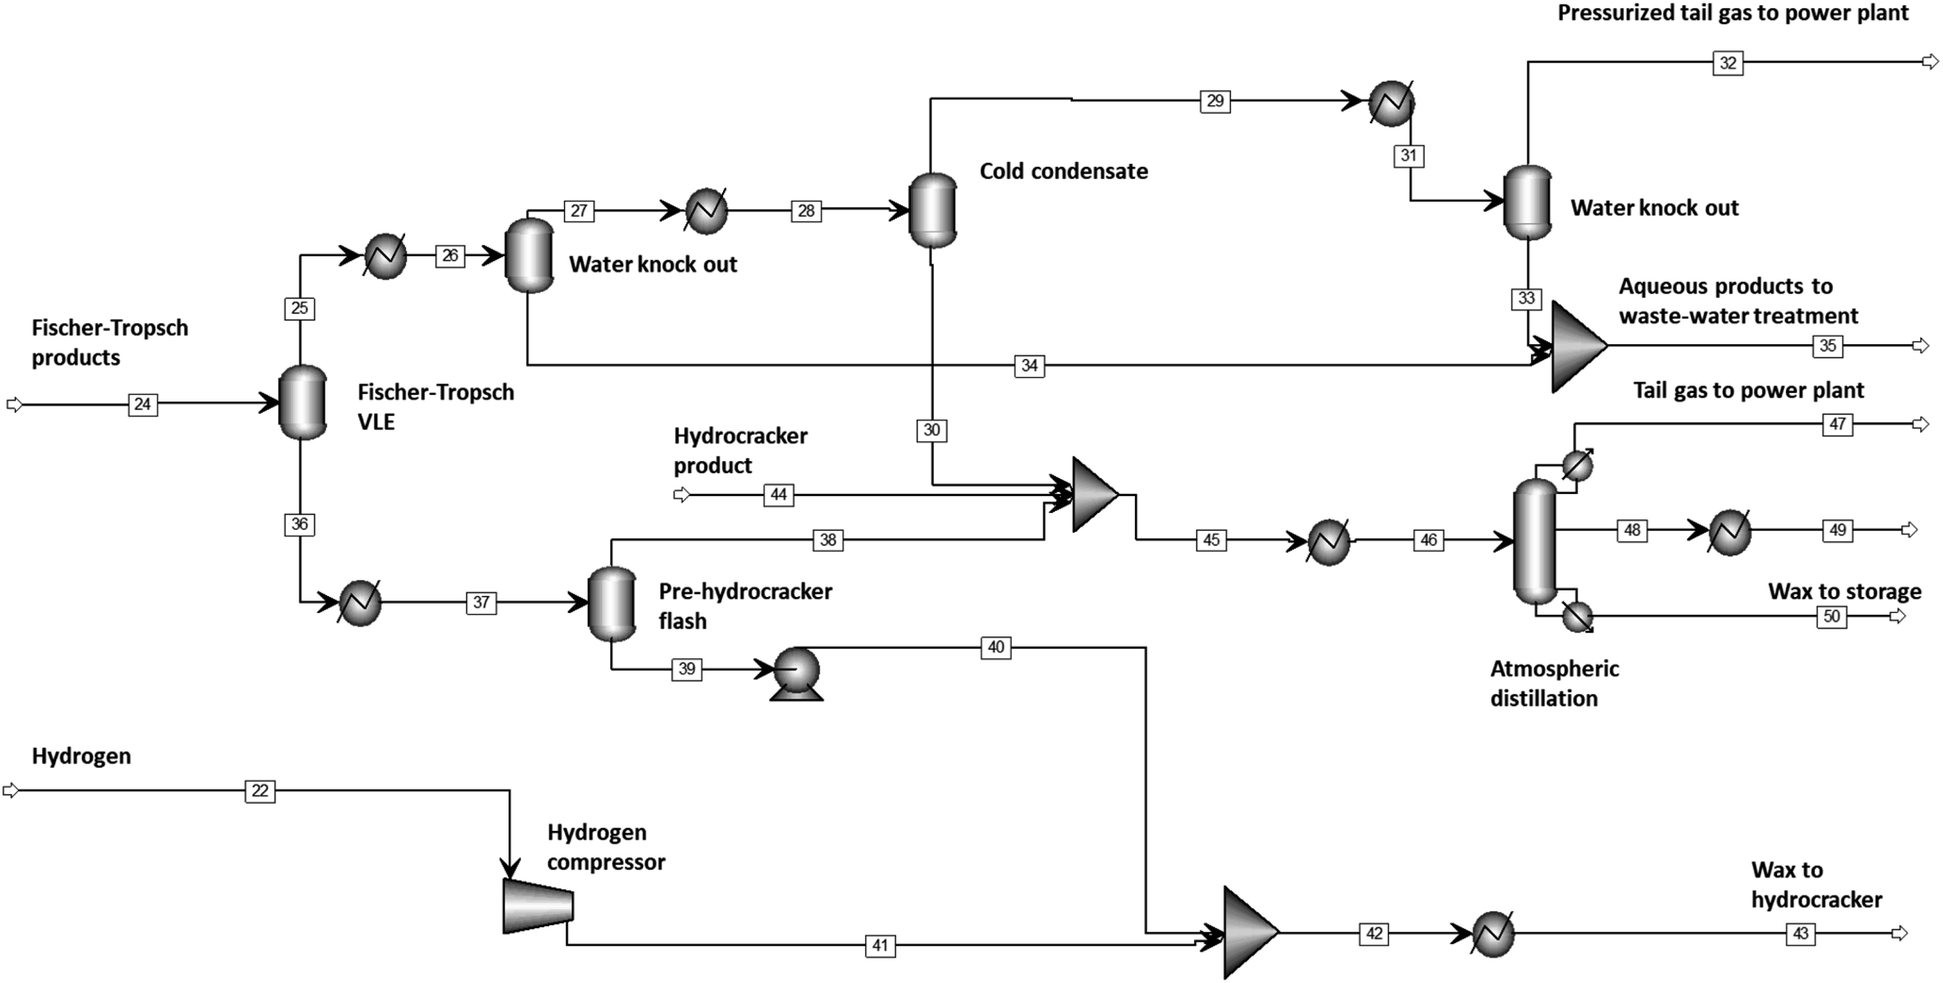 | ||
| Fig. 5 Aspen model for Fischer–Tropsch product separation and distillate refining. | ||
The first separation occurs in the Fischer–Tropsch reactor itself (modelled as a flash tank at the conditions of the Fischer–Tropsch reactor, i.e., 220 °C and 20 bar). The vapor emanating from the Fischer–Tropsch reactor is fed initially into a water-knock out and then into a pressurized cold condensate flash tank where distillate is separated off from the water and tail gas. The subsequent flash tank knocks out Fischer–Tropsch product water. The pressurized tail gas is then fed to the power generation section, which consists of an energy recovery gas turbine for the pressurized stream, and a steam turbine.
Power generation
The tail-gas from the partial refinery is fed to a power generation unit (see Fig. 6). Two tail gas streams exist, a high-pressure stream from cold condensate and water separator and a depressurized stream from the atmospheric distillation column. The pressurized tail gas is fed first through a gas turbine to generate power. The two atmospheric tail gas streams are then combined with air at atmospheric pressure and combusted; the heat is being used to generate steam which is fed to a steam turbine, thereby generating power for the plant and excess power. The combustion was modelled using an RGIBBS model.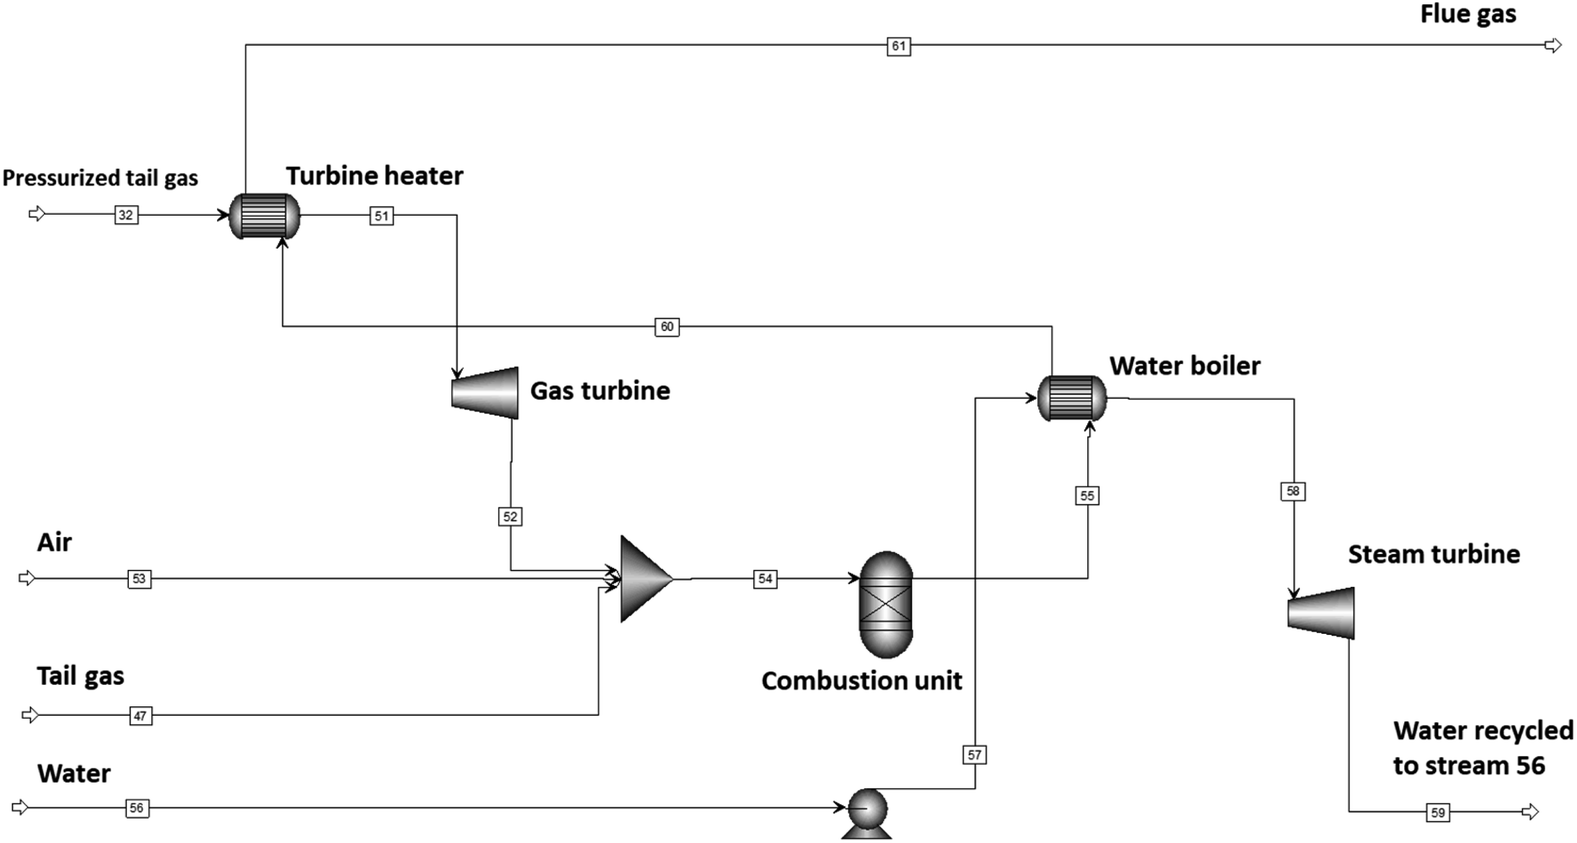 | ||
| Fig. 6 Aspen model for the power plant. | ||
Distillate specifications
The term ‘diesel’ refers to a mixture of roughly C10–C22 straight-chain hydrocarbons that meets region-legislated specifications of cetane number, flash point, distillation profile and cloud point (see ESI† for regional diesel specifications for the US, EU, Africa and South Africa). Although it would be preferable to meet the specifications for diesel, this is not feasible due to the inherent low density of Fischer–Tropsch fuels. Thus, the fuel produced in this process can be more accurately termed on spec distillate (i.e. meeting all specifications of diesel excluding density). To ensure these specifications were met, the following product characteristics were calculated:• Flash point
• Cetane number
• Cloud point
• Distillation curve
Fischer–Tropsch LTFT distillate typically has a very low sulphur and aromatic content,47 neither of which were modelled in this study.
Flash points were calculated using the Pensky–Martens flash point estimation (ASTM D-93)48 as implemented in Aspen Plus®. The cetane number of the diesel from the atmospheric distillation column was calculated using the correlation from Ghosh and Jaffe:49

| CP = −267.5332SG + 0.1315T10% + 0.7837T50% − 0.4301T90% + 89.1003% |
Using the biogas-to-distillate plant model and the results from an in-depth sensitivity analysis (see ESI†), an optimized system was developed using the conditions shown in Table 3.
| Unit operation | Aspen Plus® block or modelling algorithm | Input conditions |
|---|---|---|
| Tri-reformer | RGibbs | T = 750 °C/P = 2.7 bar/selectivities calculated at equilibrium |
| Water–gas shift reactor | RPlug | Adiabatic/T0 = 280 °C/P = 2.7 bar/rate calculated according to ref. 38 |
| Biogas and air compressor | Compr | P = 2.71 bar |
| Feed water pump | Pump | P = 2.71 bar |
| Compressor feed cooler | Compr | P = 2.71/T = 35 °C |
| Fischer–Tropsch feed compressor | Compr/Flash/Heater | P 1 = 7.3 bar/P2 = 20 bar/inter-stage cooling = 35 °C/inter-stage water knockout/isentropic efficiency = 76% |
| Membrane | Modelled using eqn (1) and data from ref. 20 | Selectivity and permeability based on ref. 20 |
| Fischer–Tropsch reactor | Modelled using experimental data from ref. 15 | X CO = 60, 70, 80 and 90% |
| Fischer–Tropsch feed heater | Heater | P = 20 bar/T = 220 °C |
| Hydrogen compressor | Compr | P exit = 35 bar |
| Cold condensate | Flash | P = 19.5 bar/T = 50 °C |
| Pre-hydrocracker flash | Flash | P = 1 bar/T = 370 °C |
| Water flash | Flash | P = 19 bar/T = 35 °C |
| Hydrocracker pump | Pump | P exit = 35 bar |
| Atmospheric distillation | RadFrac | P = 1 bar/T = 150–200 °C/reboiler duty = 90–210 kW/partial condenser/reflux ratio = 0.2/8 stages/feed stage = 2/split stage = 7 |
| Hydrocracker | Modelled using experimental data from ref. 21 | Conversion = 81%, P = 35 bar, T = 370 °C |
| Fischer–Tropsch product cooler | Heater | P = 19.5 bar/T = 50 °C |
| Water knockout cooler | Heater | P = 19 bar/T = 35 °C |
| Hydrocracker heater | Heater | P = 35 bar/T = 370 °C |
| Distillation feed heater | Heater | P = 1 bar/T = 150–200 °C |
| Power generation | ||
| Gas turbine | Compr (turbine) | P exit = 1 bar/isentropic efficiency = 38% |
| Steam turbine | Compr (steam) | P exit= 1 bar/isentropic efficiency = 76% |
| Combustion unit | RGibbs | Adiabatic, P = 1 bar |
| Power plant feed heater | HeatX | Counter-current, Tcold,out = 390 °C, ΔT = 10 °C |
| Steam boiler | HeatX | Counter-current, Tcold,out = 620 °C, ΔT = 10 °C |
| Condenser | HeatX | Counter-current, Tcold,out = 50 °C, ΔT = 10 °C |
| Water pump | Pump | P exit = 100 bar |
Carbon yield definitions
The carbon yield reported in this study are, unless otherwise specified, based on the amount of carbon contained in biogas (incl. carbon dioxide plus methane). Yields based on methane only will be stated as such. Carbon yields for this process are calculated as follows.


with i: carbon number, nCO2,feed: moles of carbon dioxide in feed, nCH4,feed: moles of methane in feed, nCO,WGS: moles of carbon monoxide exiting the water–gas shift reactor, nCi,FT product: moles of hydrocarbon with carbon number i in Fischer–Tropsch product, X: position in process (i.e., after Fischer–Tropsch synthesis, before refining), nCi,X: moles of hydrocarbon with carbon number i at X process position, nCi,distillate: moles of hydrocarbon with carbon number i in distillate stream.

Results and discussion
Carbon balance (base case)
Fig. 7 shows the carbon flow diagram for the optimized base case (Pt–Co/Al2O3, XCO = 60% with hydrocracking), indicating how carbon from biogas is converted into various products across the plant. The overall feed to the plant is 400 kmol h−1 methane-rich biogas, with a composition of 25% CO2 and 75% CH4.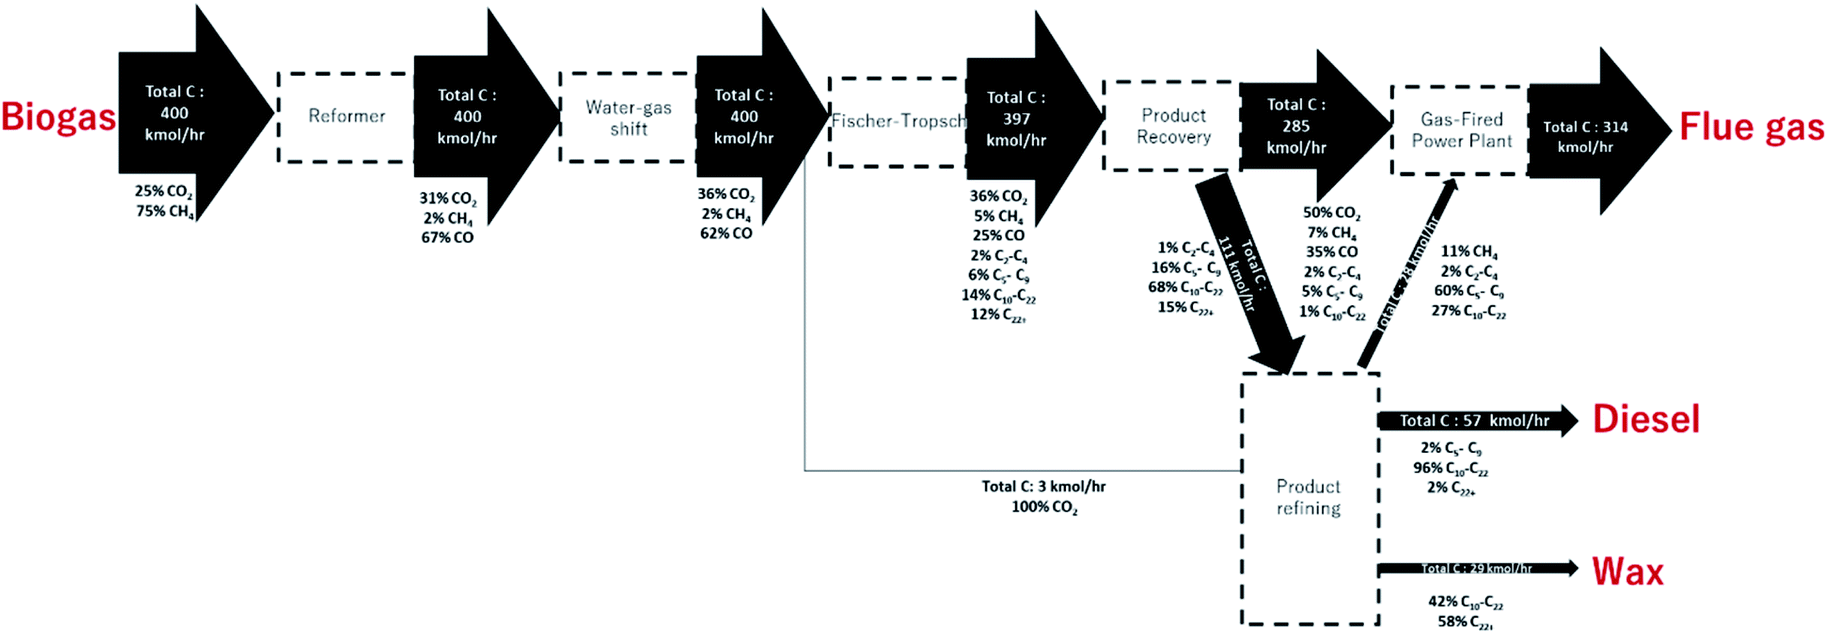 | ||
| Fig. 7 Carbon flow diagram of the Fischer–Tropsch plant operating at XCO = 60% showing the distribution of carbon throughout the plant, including the distribution of carbon in (C-%) of different species in each section. Line thickness proportional to carbon flow. | ||
Biogas is fed into the tri-reformer operated at 750 °C and 2.7 bar (chosen based on analysis shown in ESI†), which achieves a CH4 conversion of 97%. The CO2 conversion is negative due to the prevalence of the water–gas shift reaction at these temperatures. The resulting syngas reacts further in the water–gas shift unit, which converts CO and H2O into CO2 and H2 to adjust the H2:CO ratio. After the water-gas shift reactor, the carbon yield of CO is 62 C-% (the yield of CO from methane of 83 C-%). Just before entering the Fischer–Tropsch reactor, some CO2 is inadvertently removed from the stream through the H2 separation membrane.
The syngas stream enters the Fischer–Tropsch reactor, which converts CO (at a conversion of XCO = 60% for the base case) into longer-chain hydrocarbons. Carbon in the stream exiting the Fischer–Tropsch reactor can be found as CO2 (36 C-%), CO (25 C-%), CH4 (5 C-%), C2–C4 (2 C-%), C5–C9 (6 C-%), C10–C22 (14 C-%) and C22+ (12 C-%). After the Fischer–Tropsch synthesis, the carbon yield to liquid hydrocarbons (C5+) is 34 C-%, with a carbon yield to distillate (C10–C22) of 14 C-%. The reason for the relatively low yield of distillate is the large amount of unconverted CO and the non-selective nature of the Fischer–Tropsch synthesis itself, with a significant portion of carbon contained in wax and lower hydrocarbons. The former can be partially recovered by mild hydrocracking.
The product recovery section splits the Fischer–Tropsch products into tail gas and liquid products with flow rates of 286 kmol carbon per hour and 111 kmol carbon per hour respectively. The tail gas contains 1 C-% in the distillate range (2.8 kmol carbon per hour) whilst the liquid products contain 67 C-% in the distillate range (74.4 kmol carbon per hour). This represents a loss of 3.8% of carbon in the distillate range to the tail gas after product recovery.
The hydrocracker in this section improves the distillate yield (C10–C22) from 14 C-% (after the Fischer–Tropsch synthesis) to 19 C-% (after hydrocracking, before refining). To meet the legal specifications of diesel, excluding density, the distillate is refined in an atmospheric distillation column into tail gas, distillate, and wax. This is where the largest losses of distillate (C10–C22 hydrocarbons) occur. The wax stream has a carbon flow rate of 29 kmol carbon per hour of which 42% is in the distillate (C10–C22) range. The tail gas contains 28 kmol carbon per hour, of which 27% is C10–C22. Entrained distillate in these two streams results in distillate losses of 12 and 8 kmol carbon per hour, respectively.
A total of 57 kmol carbon per hour on-spec distillate is produced via the side stream, of which 96% is C10–C22. The overall carbon yield of C10–C22 in the final on-spec. distillate stream from the atmospheric distillation column is 14 C-%.
The remaining light hydrocarbons are combined with the pressurized tail gas, which contain all the remaining CO2, CH4 and CO. This is combusted in the power plant, resulting in a product stream of 314 kmol h−1 of CO2 and a gross power generation of 8.5 MW.
There is a loss of 5 C-% in the distillate yield over the refining section. These refining losses could be mitigated in a few ways. Higher yields could be obtained if the purity requirements for the distillate stream were reduced. This would result in an increase in C5–C9 and C22 in the distillate stream which would shift the flash point and distillation profiles out of spec. for diesel. This would only be possible if the desired product were distillate for blending, rather than diesel. Alternatively, the wax stream could be recycled back to the hydrocracker to improve distillate yields. Whilst this would not strictly satisfy the single-pass design constraint, the wax stream is liquid and thus could be pumped without significant capital cost or energy requirements. If the entire wax stream were recycled to hydrocracker (via the pre-hydrocracker flash), an additional 10 kmol carbon per hour of distillate could be produced, resulting in an overall distillate yield of 17 C-%.
Energy balance (base case)
The overall energy efficiency of the once-through reactor system and power plant was assessed by analyzing the lower heating values (LHV) of the reactants and products as well as the power production in the power plant (LHV used rather than HHV due to gaseous water product streams). Fig. 8 shows an illustration of the energy flow throughout the system for the base case of XCO = 60% with a hydrocracker. | ||
| Fig. 8 Energy balance for base case design XCO = 60% for Pt–Co/Al2O3 showing the lower heating values of reactants and products as well as the power generated from the plant. | ||
The LHV of biogas (400 kmol h−1) with composition 75% CH4 and 25% CO2 is ca. 67 MW. Throughout the Decentralized Diesel plant (including reformer, water–gas shift unit, Fischer–Tropsch reactor and refining section) 23 MW is lost mainly in the form of emissions and cooling water. At a moderate conversion of XCO = 60%, most of the energy leaves the system as tail gas (37 MW) to the power plant whilst only 5 MW and 2 MW are contained in the distillate and wax respectively. Considering all the product streams, the overall efficiency of the Fischer–Tropsch process (calculated by the LHV products relative to LHV of biogas) is 66%. The distillate energy efficiency is only 8% but can be further improved with appropriate heat integration. For a conversion of XCO = 60%, the gas fired power plant has an efficiency of 23%, producing only 8.5 MW (gross) from 37 MW of tail gas with a loss of 29 MW. This is significantly lower than the expected efficiency of ca. 30–40% for steam turbines. This is due, in part, to the dilution of the feed gas with high concentrations of inert nitrogen and carbon dioxide thus reducing the maximum temperature. In addition, not all the flue gas heat could be effectively utilized in the power plant itself and may be included in plant-wide heat integration.
Plant evaluation
The biogas-to-distillate plant was evaluated based on 16 optimized scenarios including Fischer–Tropsch conversions of XCO = 60%, 70%, 80% and 90%, a choice of catalyst between Pt–Co/Al2O3 and Mn–Pt–Co/Al2O3 and the presence or absence of a hydrocracker. In each case, two main criteria were analyzed: the product distributions, fuel specifications, amount of on-spec. distillate produced, and power production (MW).The fixed variables for all conversions in this evaluation are shown in Table 3. Variables that were altered in each scenario to maintain on-spec. distillate properties include the temperatures of the flash tanks in the product recovery and refining section as well as the reboiler duty, distillation column feed temperature and side stream flowrate. The optimization of each of these units is shown in the ESI.†
Product distributions
At the base case conversion of XCO = 60% with a Pt–Co/Al2O3 catalyst, the chain growth probability for the Fischer–Tropsch synthesis is high, and thus the hydrocarbon product distribution is wide with significant amounts of both naphtha, distillate and waxes. The Fischer–Tropsch product spectrum is, however, significantly affected by CO conversion, catalyst, and reaction conditions. Fig. 9 shows the Fischer–Tropsch carbon number distributions of the product obtained over the two catalysts (Pt–Co/Al2O3 and Mn–Pt–Co/Al2O3) in a slurry bed reactor at 20 bar and 220 °C operating at conversions between XCO = 60 and XCO = 90% based on empirical data.15,19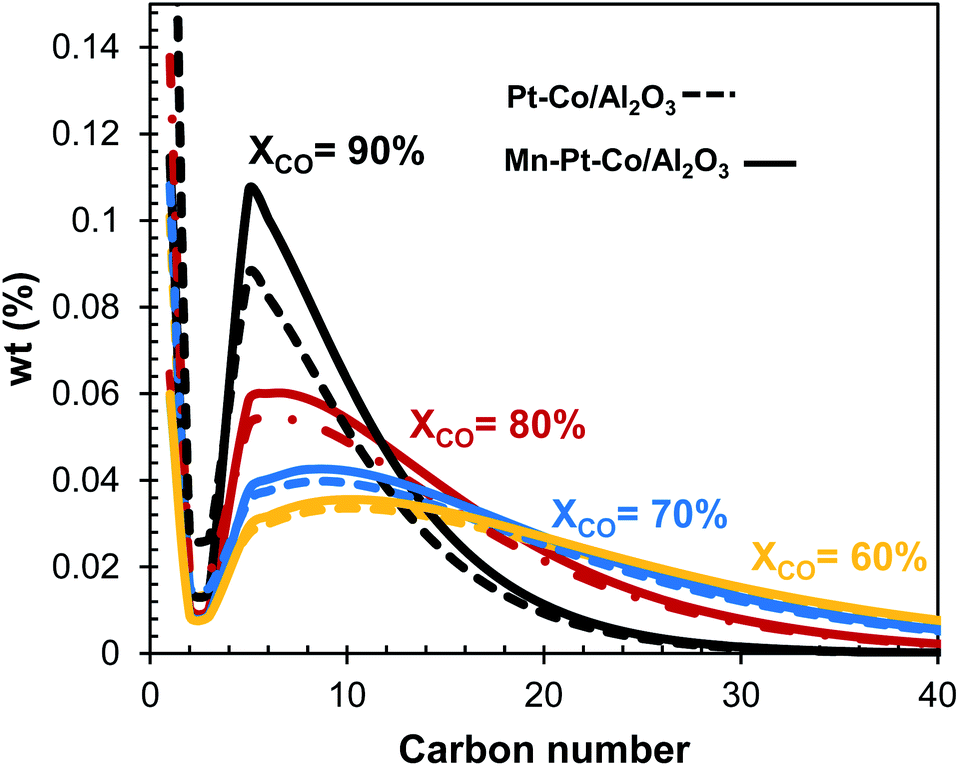 | ||
| Fig. 9 Carbon number distribution for Pt–Co/Al2O3 and Mn–Pt–Co/Al2O3 in a slurry bed reactor at various conversions based on data from ref. 15 and 19. | ||
Promoting cobalt-based catalysts with manganese is one method to enhance selectivity towards C5+ at high conversion.16,19 Using a Mn:Co ratio of 0.15 mol/mol, the selectivity for the formation of CO2 and CH4 have been shown to decrease by up to 6 C-% and 12 C-% respectively at XCO = 90%.9,19 Changing the catalyst from Pt–Co/Al2O3 to Mn–Pt–Co/Al2O3 has little effect on the overall product distribution at lower conversions (see Fig. 9). However, operating the Fischer–Tropsch synthesis at XCO = 80% and XCO = 90% with the manganese promoted catalyst appears to significantly increase the fraction of hydrocarbons within the naphtha and diesel range. Changing the catalyst from Pt–Co/Al2O3 does not significantly affect the mean and the shape of the product distribution (i.e. chain growth probability in the fraction of long-chain hydrocarbons), but rather fraction of hydrocarbons in the C5+-range as manganese as a promoter primarily reduces the selectivity for the formation of methane at a given conversion. Thus, developing a dedicated catalyst for high conversion could enable much higher yields for the overall process.
 | ||
Fig. 10 The hydrocarbon distribution of the products from the Fischer–Tropsch reactor ( ) and the hydrocarbon distribution of the feed to the atmospheric distillation column incl. the hydrocracking product ( ) and the hydrocarbon distribution of the feed to the atmospheric distillation column incl. the hydrocracking product ( ) for a feed generated by operating the Fischer–Tropsch synthesis at a conversion of ) for a feed generated by operating the Fischer–Tropsch synthesis at a conversion of  60%, 60%,  70%, 70%,  80%, 80%,  90%. 90%. | ||
It should be noted, however, that the Decentralized Diesel plant operates with a well-mixed Fischer–Tropsch reactor (slurry-bed reactor) which, at high conversion, contributes to the shift of the product distribution towards lighter products reducing the wax production. A hydrocracker may be needed when using reactors with less back-mixing (packed bed reactor, slurry bubble columns) for the Fischer–Tropsch synthesis as the product is a result of all different conditions in the reactor. Hence, the necessity of a hydrocracker must be considered together with type of Fischer–Tropsch reactor chosen for the specific application.
Fuel specifications
Fig. 11 shows the optimized carbon-number distribution of the distillate (withdrawn from the side stream of the atmospheric distillation column) for a conversion of (a) 60%, (b) 70%, (c) 80% and (d) 90% in the Fischer–Tropsch synthesis obtained over an Pt–Co/Al2O3 catalyst, whilst having a hydrocracking unit in the overall process. Increasing the conversion in the Fischer–Tropsch synthesis from 60% to 90% resulted in a narrower product distribution, with a mean shifted to lower carbon numbers.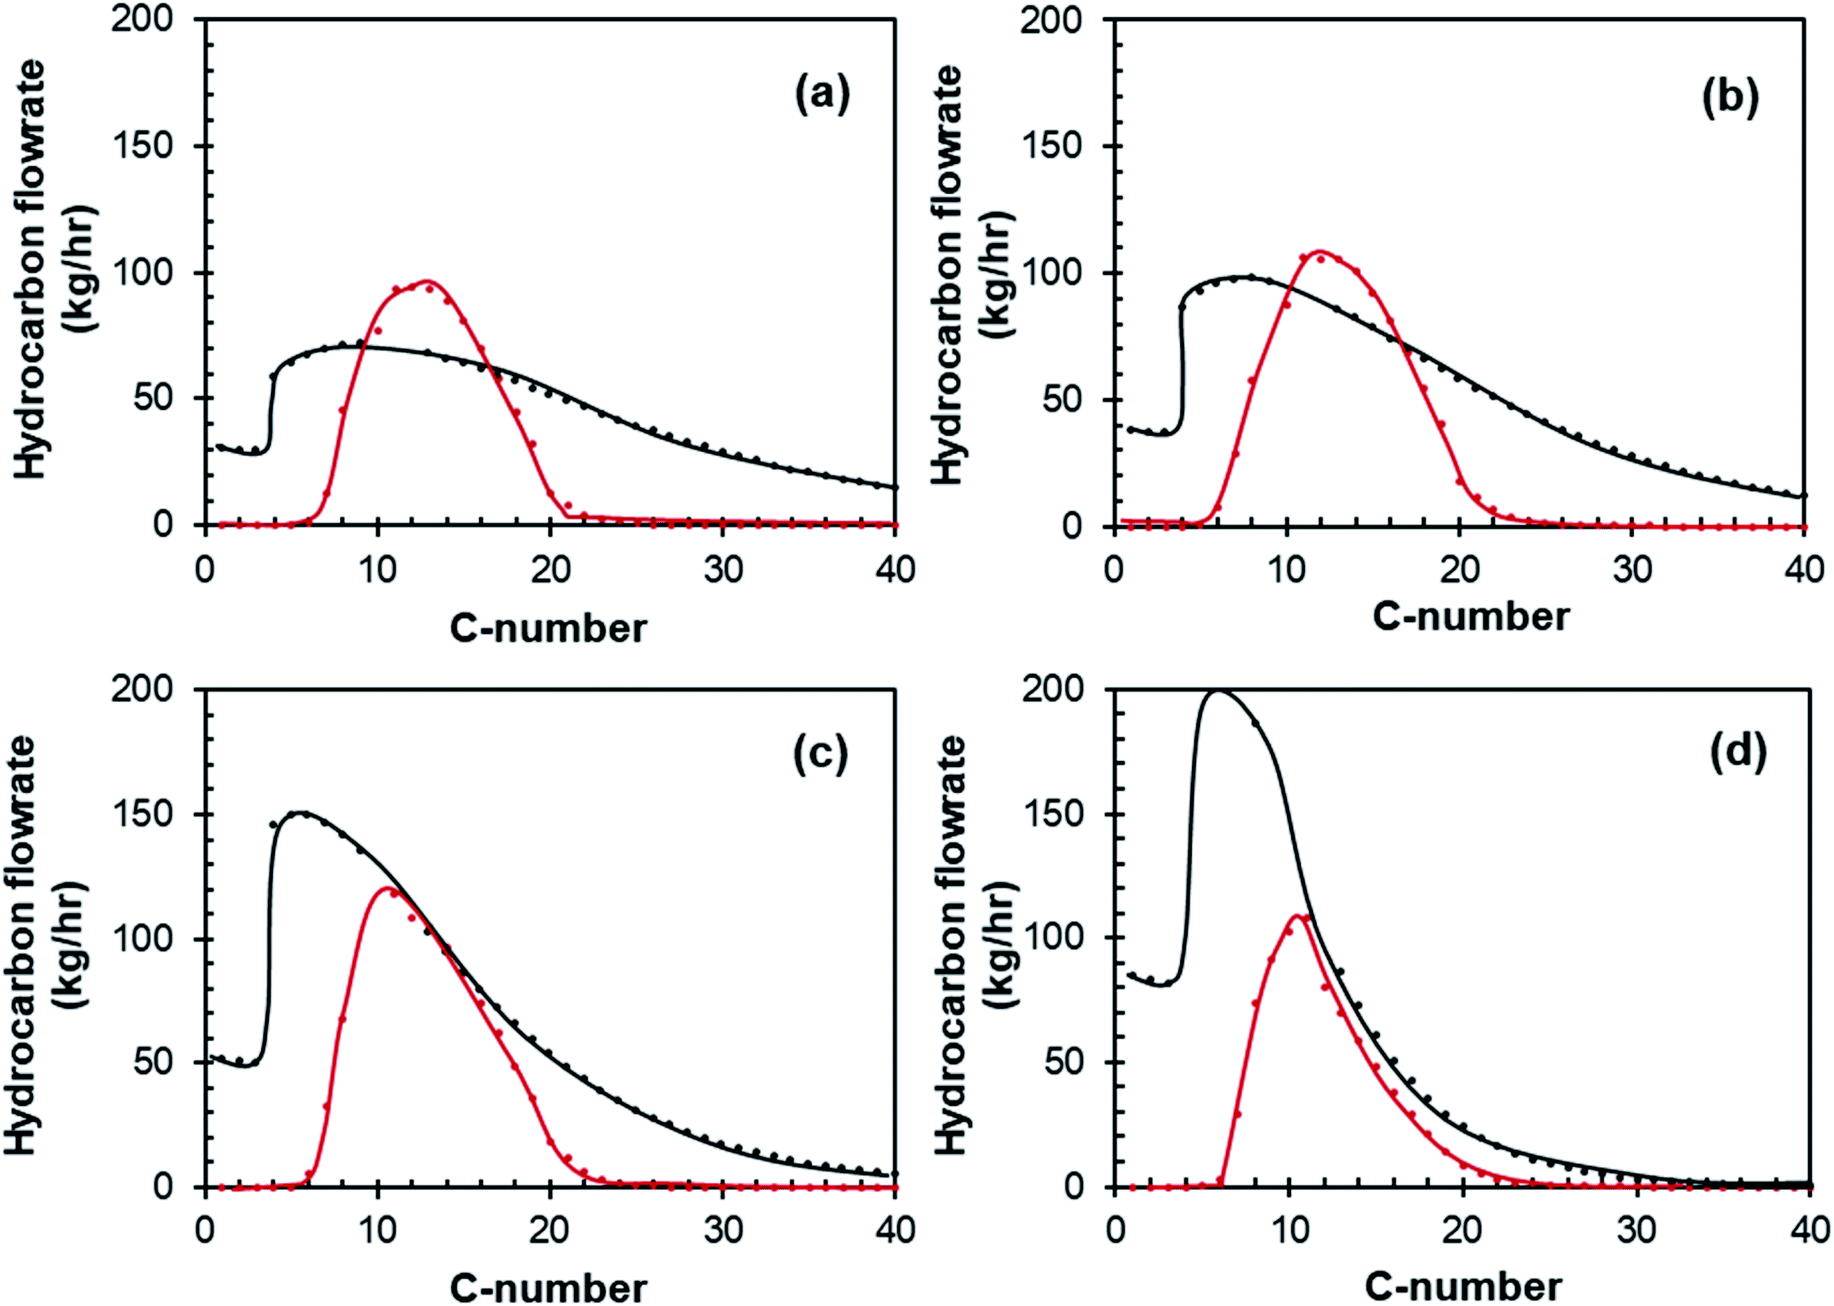 | ||
Fig. 11 Mass hydrocarbon distribution C2 to C40 product compounds for  Fischer–Tropsch products and Fischer–Tropsch products and  distillate product for XCO = (a) 60%, (b) 70%, (c) 80% and (d) 90% for Pt–Co/Al2O3 for the case with a hydrocracker. distillate product for XCO = (a) 60%, (b) 70%, (c) 80% and (d) 90% for Pt–Co/Al2O3 for the case with a hydrocracker. | ||
The specifications of the fuel produced (side stream distillate) in the optimized cases for XCO from 60% to 90% obtained over a Pt–Co/Al2O3 catalyst are shown in Table 4. For each case, the yield was optimized whilst trying to stay within the limits of diesel specifications. The optimized distillate distribution was limited by the flash point on the lighter end and the distillation profile on the heavier end.
| ASTM D975:15b (US) | EN 590:2014 (EU)55 | AFRI-5:2016 (AU)56 | SANS 342:2016 (ZA)57 | CO Conversion | ||||
|---|---|---|---|---|---|---|---|---|
| 60% | 70% | 80% | 90% | |||||
| a No limit specified. b Severe winter and arctic grade. | ||||||||
| Diesel density at 15 °C | —a | 820 | 820–880 | 805–850 | 743 | 741 | 740 | 741 |
| Water, ppm | 500 | 200 | —a | 250 | 3 | 52 | 24 | 9.6 |
| Cetane number min | 49 | 51 | 49 | 51 | 91 | 90 | 90 | 89 |
| Viscosity at 40 °C mm2 s−1 | 1.9–4.1 | 2.0–4.5 | —a | 2.2–5.3 | 2.5 | 2.3 | 2.0 | 1.9 |
| Flash point, °C | 55 | 55 | —a | —a | 67 | 60 | 60 | 67 |
| Cloud point, °C | ≤5, ≤34b | ≤10, ≤34b | —a | +6 | −11 | −17 | −30 | −35 |
| Distillation | ||||||||
| T 95 | 370 | 360 | -a | 362 | 350 | 355 | 360 | 350 |
| T 90 | 338 | 360 | 335 | 337 | 337 | 330 | ||
Fischer–Tropsch LTFT distillate typically has a high cetane number in relation to typical crude-oil derived diesel. This is true for this process, as can be seen by 4, where the cetane number for all cases is ca. 90, as opposed to the specifications which are between 49 and 51.47
The water content in the distillate is between 3 and 52 ppm, far below the specifications between 200 and 500 ppm (see Table 4). The water content of the distillate is determined by the choice of reboiler duties and feed temperatures (see Table 3) which were adjusted slightly in each case to ensure distillation profiles and flash point temperatures were within spec. The effect of these changes on the distribution of carbon in the distillate is shown in ESI Fig. S-9.†
A typical issue for LTFT diesel is the cloud point – which represents the temperature at which diesel forms a cloudy appearance due to the waxy hydrocarbons beginning to solidify. This specification is set to avoid blockages in fuel filters and engine injectors. It is inherently based on the minimum temperatures within a region. This specification can vary significantly between 6 °C (South Africa) and −34 °C (severe weather specification in EU and US). Africa has no cloud point specification. Cloud points for the distillate stream were determined using a correlation50 that takes into account the specific gravity, T10%, T50% and T90%. The cloud point for distillate produced by the case with a Fischer–Tropsch conversion of XCO = 60% and a Pt–Co/Al2O3 catalyst is −11 °C. This only narrowly meets the normal specifications for the EU and US (−10 °C and −5 °C respectively), albeit is firmly within the South African specifications. The cloud point decreases with increasing CO conversion, as the amount of wax produced in the Fischer–Tropsch synthesis decreases. Most of the cases (all except for XCO = 90%) do not meet the requirement for severe or arctic weather. Thus, distillate produced by this process may need to undergo isomerization for extreme cold conditions, however for Sub-Saharan Africa this is not necessary.
The specification that LTFT distillate often cannot meet, and the distillate from this process does not meet, is density. The distillate product from this process has a density of ca. 740 kg m−3, far below the 780 kg m−3 specification for the EU (EN 590), African (AFRI-5) or South African (SANS 342:2016) specifications.54 United States of America (ASTM D975) has no such specification. Thus, depending on the region, the distillate produced from this process may require blending with crude oil derivatives, or higher density blending material, to be legally sold on the diesel market.
The viscosity of the distillate produced falls between 2.5 and 1.9 for CO conversions XCO = 60% to XCO = 90%. This is on the lower end of the viscosity range, with XCO > 80% falling out of spec. for South Africa, and XCO = 90% falling out of spec. for the EU and South Africa. All cases fall within specifications for the US. The viscosity, like density, may be improved by blending.
Fuel yield
From each of the 16 optimized scenarios, the overall fuel production was calculated (see Fig. 12). For a Pt–Co/Al2O3 catalyst with hydrocracking, a conversion of XCO = 60% in the Fischer–Tropsch synthesis resulted in a production rate of distillate of 183 bbl per day. This is equivalent to an overall carbon yield (incl. carbon dioxide) of distillate of 14 C% (Table 5). Increasing the conversion in the Fischer–Tropsch synthesis unit increased the distillate production rate up to a maximum of 232 bbl per day (overall carbon yield of 16 C-%) at ca. XCO = 75%. The distillate production rate then dropped off sharply as the conversion was increased to XCO = 90%, obtaining only 142 bbl per day (overall carbon yield of 11 C-%). The sharp drop-off in the production rate (and overall carbon yield) upon increasing the conversion to 90% is a consequence of the shift in the product selectivity in the Fischer–Tropsch synthesis over Pt–Co/Al2O3 operating at 220 °C and 20 bar; at these conditions, the selectivity for the formation of methane and for the formation of CO2 increases dramatically15 and thus reducing the selectivity for the formation of liquid hydrocarbons. | ||
| Fig. 12 Distillate production as a function of conversion for Pt–Co/Al2O3 and Mn–Pt–Co/Al2O3 with and without hydrocracking. | ||
| Catalyst | Overall carbon yield of distillate from biogas (C-%) | Conversion | |||
|---|---|---|---|---|---|
| 60% | 70% | 80% | 90% | ||
| Pt–Co/Al2O3 | With hydrocracker | 14 | 16 | 16 | 11 |
| Without hydrocracker | 8 | 10 | 14 | 11 | |
| Mn–Pt–Co/Al2O3 | With hydrocracker | 14 | 17 | 18 | 13 |
| Without hydrocracker | 8 | 12 | 16 | 13 | |
Operating the process with a Pt–Co/Al2O3 Fischer–Tropsch catalyst without a hydrocracker resulted in significantly less distillate, especially when operating the Fischer–Tropsch synthesis at lower conversions (whilst at the same time increasing the production of wax). This effect was most significant at XCO = 60% (109 bbl per day, 8 C-% yield). The best conversion for distillate yield in this case was shifted from XCO = 75% to XCO = 80% with a production of only 186 bbl per day (14 C-% yield). Past this maximum there was also a strong decrease in productivity, reducing to 142 bbl per day at XCO = 90%, equal to the case of using a Pt–Co/Al2O3 catalyst in conjunction with a hydrocracker in the design. This confirmed that, for very high conversions, a hydrocracker can be redundant due to the change in product distribution (see Fig. 9 and 10).
The manganese-promoted catalyst Mn–Pt–Co/Al2O3 seemed to produce roughly equal amounts of distillate as its unmodified counterpart for the lower conversion in the Fischer–Tropsch synthesis of XCO = 60% (183 bbl per day and 109 bbl per day for case with and without hydrocracking respectively). On increasing the conversion, however, promotion with manganese seemed to have a progressively more significant effect on distillate production rate. At conversions of 70%, 80% and 90% in the Fischer–Tropsch synthesis, the distillate production was 235, 246 and 179 bbl per day respectively which represented a relative improvement over the unmodified Pt–Co/Al2O3 of 8%, 12% and 25% respectively for the case with a hydrocracker. The productivity over the manganese-promoted catalyst was less influenced by the change in conversion than the unmodified catalyst. As a result, this system would be less sensitive to shifts in conversion due to external disturbances. These results emphasize the need for catalysts that have been specifically designed to work at high conversion in order to further enhance distillate fuel yields.
Operating Mn–Pt–Co/Al2O3 in a system without a hydrocracker, decreased the distillate production significantly at low conversion, with an insignificant effect when moving to XCO = 90%. Nevertheless, it seems advisable to operate the manganese promoted catalyst at a conversion of XCO = 80% in combination with a hydrocracker to maximize the diesel yield (overall carbon yield of 18 C-%) and production rate (246 bbl per day).
The process as it stands has a very low carbon yields, even at optimally high conversions. Overall carbon yields range from 8 C-% to 18 C-%, which is consistent with the carbon flow diagram for the base case shown in Fig. 7. This is equivalent to a carbon yield from methane of 11 C-% to 24 C-%.
There are several explanations for the low carbon yields seen in this study. Firstly, the very low (net negative) conversion of CO2 in the tri-reformer resulted in a loss of yield of approximately 25 C-% at the start of the process. This CO2 acts as an inert throughout the rest of the process, including the power plant where it eventually leaves as stack gas. Secondly, even with an improved catalyst, the Fischer–Tropsch reactor only produced a fraction within the distillate carbon range, with significant amounts of carbon lost into the wax and naphtha fractions. Finally, a portion of the distillate is lost through the bottoms of the atmospheric distillation column.
The low yield of this process is a direct result of the design choices and philosophy for this process and should be contextualized with regards to the purpose of the design. In the classical coal-to-liquid process, the objective is to get as much carbon as possible into desired products, whilst at the same time minimizing energy losses. This means that, for CTL, the product spectrum can be quite diverse with significant recycling and refining requirements. In the case of this design, the primary objective is to convert biogas from organic waste to minimize methane emissions and to enable the creation of energy from localized feedstock in a decentralized, off-grid, manner. The different objectives result in a different design approach and significantly different product spectrum. The Decentralized Diesel design prioritizes simplicity, capital cost efficiency and energy self-sufficiency over carbon efficiency.
There are ways to significantly enhance carbon yields by changing the design, albeit these would naturally require trade-offs.
Dry reforming involves the conversion of CH4 and CO2 to CO and H2. This reaction yields higher conversions of CO2 (ref. 58) and eliminates gas dilution from nitrogen. However, as dry reforming is endothermic, the system would require external heating. Another issue of dry reforming would be the high levels of carbon deposition (coking) on the surface of the catalyst,24 which would need to be regenerated online in order to avoid constant replacement and downtime. Furthermore, dry reforming results in low H2/CO ratios between 0.5–1.5.59 This requires extensive water-gas shift to further correct for the H2/CO ratio (2), if cobalt is to be used as a Fischer–Tropsch catalyst.
To enable conversion of carbon dioxide within the reformer itself, the system requires external heating, catalyst regeneration and a far larger water–gas shift reaction system (or a change from cobalt to iron catalyst). However, if dry reforming was used, and energy could be added to the system, then various factors can be improved:
• Enhanced conversion of CO2 in the reformer by operating the system without a flow of air.
• Less nitrogen in the Fischer–Tropsch reactor which dilutes the system, decreasing rates.
• Increased partial pressures in the Fischer–Tropsch reactor which will improve selectivities.
• Increase pressure to shift the product distribution to higher carbon numbers. This may increase the carbon fraction of distillate substantially, especially at higher conversions. However, this will likely require additional compressors after the reformer as the compression ratio increases. This may also further increase capital cost and energy requirements of the process and may, depending on the pressure, mean the process is no longer energy self-sufficient.
• Decrease dilution factor in the Fischer–Tropsch synthesis by including an air separation unit. If pure oxygen was used in the reformer the partial pressures of syngas in the process would increase, improving the rate as well as the yield of distillate at higher conversions (increased partial pressures of CO and H2 results in increased chain growth probability). The air-separation unit is, however, capital- and compression-intensive and may limit the ability of the plant to operate in a decentralized, off-grid manner.
• Catalyst development that focuses on the in situ hydrocracking of long chain hydrocarbons could enhance the amount of C10–C22 range hydrocarbons produced, whilst a catalyst that can facilitate the hydrogenation of CO2 within the Fischer–Tropsch reactor may enhance carbon utilization.
• A different Fischer–Tropsch reactor (fixed bed or micro) may minimize the effects of high conversion by limiting the high partial pressure of water, and low partial pressure of CO and H2, to a smaller part of the catalyst bed. This comes with a trade-off of more complex heat transfer and less straight-forward catalyst replacement.
Power generation
Fig. 13 shows the effect of conversion on the gross and net power generation for the design with the Fischer–Tropsch synthesis over Pt–Co/Al2O3 or Mn–Pt–Co/Al2O3 -catalyst, and with or without a hydrocracking unit. The net power generation was calculated after accounting for the power required to run the three compressors in the syngas generation section as well as the hydrogen compressor (only for scenarios with hydrocracking) and the water pumps (pressures as per Table 3). | ||
| Fig. 13 Power generated as a function of conversion for Pt–Co/Al2O3 and Mn–Pt–Co/Al2O3 with and without hydrocracking. | ||
The conversion in the Fischer–Tropsch synthesis, rather than the type of catalyst or the presence or absence of a hydrocracker had the most significant effect on the amount of power generated. At a lower conversion of XCO = 60% the gross power generated ranged from 7.9 MW to 8.5 MW, with Pt–Co/Al2O3 producing only slightly more. The net power generation at this conversion was between 2.4 and 3 MW. As the conversion increases, the amount of power generated decreased in all cases, reaching a minimum at XCO = 80%. The gross and net power production increased significantly at XCO = 90% to 8.7–9.6 MW and 3.2–4.2 MW respectively in all cases. The poorer selectivity towards long-chain hydrocarbons in the Fischer–Tropsch synthesis over the Pt–Co/Al2O3 catalyst in comparison to the selectivity obtained over the manganese promoted catalyst results in a larger tail gas stream and hence increased power generation across the conversion range, but especially at high conversion where the performance difference between the catalysts was more substantial.
Energy efficiency
Table 6 shows the LHV for the reactants and products for conversions 60–90% as well as the gross electricity generated. The LHV of the tail gas, distillate, and wax ranges from 33–39 MW, 5.3–9.1 MW and 0.6–2.1 MW. The difference in the LHV of products is a function of the amount of each product formed rather than the energy density, with XCO = 80% having the highest LHV for distillate and XCO = 90% having the highest LHV for tail gas (with thus translates to the highest electricity generated).| CO conversion (%) | Lower heating value reactants (MW) | Lower heating value of products (MW) | Power generated (MW) | ||
|---|---|---|---|---|---|
| Tail gas | Distillate | Wax | |||
| 60 | 67 | 36 | 5.3 | 2.1 | 8.5 |
| 70 | 67 | 34 | 8.4 | 1.5 | 8 |
| 80 | 67 | 33 | 9.1 | 1.5 | 7.9 |
| 90 | 67 | 39 | 6.3 | 0.6 | 9.6 |
Table 7 shows the subsequent energy efficiencies of the Fischer–Tropsch process, power plant and overall, for each conversion. The efficiencies do not change significantly with conversion, ranging from 66–69% (Fischer–Tropsch process), 23–25% for power plant (gross power generated) and 24–28% overall. If net power generated is considered (i.e., after power used for compressors and pumps are accounted for) thus satisfying the off-grid requirement, the net efficiency of the overall process is between 16–19%. These are low energy efficiencies when compared to typical steam turbine systems.
| CO conversion (%) | Energy efficiency (%) | |||
|---|---|---|---|---|
| Fischer–Tropsch processa | Power plant (gross)b | Overall (gross)c | Overall (net)d | |
| a LHV of tail gas, distillate and wax relative to LHV of biogas. b Gross power generated relative to LHV of tail gas. c LHV of distillate and wax as well as power generated (gross) (MW) relative to LHV of biogas. d LHV of distillate and wax as well as power generated (net) (MW) relative to LHV of biogas. | ||||
| 60 | 66 | 23 | 24 | 16 |
| 70 | 66 | 23 | 27 | 18 |
| 80 | 65 | 24 | 28 | 19 |
| 90 | 69 | 25 | 25 | 17 |
This is primarily due to the strong dilution factor (N2 and CO2) in the feed, as well as the fact that not all the heat from the flu gas was able to be recovered (albeit this can be used in plant-wide heat integration which was not implemented at this stage).
The dilution factor may be decreased if an air-separation unit was included in the design. However, this would require extensive compression across the plant (including in the air-separation plant itself), which would require significant energy from the power plant, thus potentially decreasing the energy self-sufficient requirement.
Conclusions
A single pass Fischer–Tropsch biogas-to-diesel plant producing on-spec distillate fuel from methane-rich biogas was evaluated using Aspen® Simulation Workbook. The purpose of the evaluation of was to determine the effect of Fischer–Tropsch conversion, type of catalyst and refining configuration on the yield and efficiency of the process. The evaluation consisted of 16 scenarios, including four Fischer–Tropsch conversions (60%, 70%, 80% and 90%), two Fischer–Tropsch catalysts (Pt–Co/Al2O3 and Mn–Co/Al2O3) and a partial refining plant with and without hydrocracking. Overall carbon yields for the on-spec distillate were found to be low in all cases (between 8 C-% and 18 C-%). This was due to low CO2 conversions in the tri-reformer, low yields to C10–C22 in the Fischer–Tropsch reactor and a loss of distillate into the wax fraction of the distillation column. The latter may be remediated by recycling the liquid back to a hydrocracker. The low carbon yield is a result of the design philosophy which prioritized simplicity and energy self-sufficiency over carbon efficiency. The purpose of the design, as opposed to standard CTL installations, is to reducing methane emissions and generating energy in remote regions. Improvements to the carbon yield can be made, albeit each with a tradeoff. By using non-autothermal dry reforming to enhance CO2 conversion and decrease gas dilution, energy addition is required. To improve C10–C12 yields, the Fischer–Tropsch reaction could be operated at higher pressure, or an air-separation unit (to provide pure oxygen) could be used prior to reforming, albeit both would increase compression requirements, energy intensity and capital costs.The tail gas from the biogas-to-distillate plant was used to generate power with a gross generation of between 7 MW and 9.6 MW and a net generation (after compressors and pumps) of between 1.8 and 4.2 MW. The amount of power generated was strongly affected by conversion, whilst the type of Fischer–Tropsch catalyst and presence or absence of a hydrocracker had only a small effect.
The optimal case was found to be a Mn–Co/Al2O3 operated at XCO = 80% with a hydrocracker. The on-spec overall distillate yield for this case was 18 C-%, at a production rate of 246 bbl per day. The power produced by this case was 7.3 MW gross and 1.8 MW net, with an overall energy efficiency (gross) of 28%. It is thus important to design catalysts specific for operating the Fischer–Tropsch process at high conversions.
This study shows that a single Fischer–Tropsch biogas-to-distillate plant that is self-sustaining is feasible from a process and catalytic perspective, especially when higher conversions and catalyst improvements for high conversion (in this case via manganese promotion) are incorporated.
Conflicts of interest
There are no conflicts to declare.Acknowledgements
The scientific guidance from Prof. Arno de Klerk is gratefully acknowledged. Funding from Sasol Ltd, Queen Elizabeth Diamond Jubilee Scholarship and LÓreal for Women in Science. This research was in part supported by the South African Research Chair Initiative (SARChI), UID 114606, and the BRICS-program, (BRIC160624174073; UID 110487)Notes and references
- M. Marchese, S. Chesta, M. Santarelli and A. Lanzini, Energy, 2021, 228, 120581 CrossRef CAS.
- M. Martinelli, M. K. Gnanamani, S. LeViness, G. Jacobs and W. D. Shafer, Appl. Catal., A, 2020, 608, 117740 CrossRef CAS.
- M. Shahabuddin, M. T. Alam, B. B. Krishna, T. Bhaskar and G. Perkins, Bioresour. Technol., 2020, 312, 123596 CrossRef CAS PubMed.
- V. Arutyunov, A. Nikitin, L. Strekova, V. Savchenko and I. Sedov, Catal. Today, 2020, 379, 23–27 CrossRef.
- X. Zhao, A. Naqi, D. M. Walker, T. Roberge, M. Kastelic, B. Joseph and J. N. Kuhn, Sustainable Energy Fuels, 2019, 3, 539–549 RSC.
- H. Boerrigter, Economy of Biomass-to-Liquids (BTL) plants: An engineering assessment, Energy Research Centre of the Netherlands, Report ECN-C-06-019, 2006 Search PubMed.
- V. Shah, N. J. Kuehn and M. J. Turner, Cost and performance baseline for fossil energy plants, in Coal-to-liquids via Fischer-Tropsch synthesis, United States, 2014, vol. 4, https://www.netl.doe.gov/energy-analysis/details?id=736, accessed June 2017 Search PubMed.
- D. J. Wilhelm, D. R. Simbeck, A. D. Karp and R. L. Dickenson, Fuel Process. Technol., 2001, 71, 139–148 CrossRef CAS.
- C. L. Tucker, PhD thesis, University of Cape, Town, South Africa, 2020.
- C. L. Tucker and E. van Steen, in Chemical approaches for management of solid waste, CRC Press, Taylor and Francis Group, Florida, 2020 (in review) Search PubMed.
- Bechtel, Aspen process flowsheet simulation model of a battelle biomass-based gasification, Fischer-Tropsch liquefaction and combined-cycle power plant, Report for U.S Department of Energy, 1998 Search PubMed.
- G. N. Choi, S. J. Kramer, S. S. Tam and J. M. Fox, Design/economics of a once-through natural gas Fischer-Tropsch plant with power co-production, Bechtel Corporation, 1996 Search PubMed.
- M. Ostadi, K. Dalane, E. Rytter and M. Hillestad, Fuel Process. Technol., 2015, 139, 186–195 CrossRef CAS.
- B. Liu, S. Geng, J. Zheng, X. Jia, F. Jiang and X. Liu, ChemCatChem, 2018, 10, 4718–4732 CrossRef CAS.
- C. L. Tucker and E. van Steen, Catal. Today, 2020, 342, 115–123 CrossRef CAS.
- Y. Jiang, H. Wang, S. Li, C. Yang, L. Zhong, P. Gao and Y. Sun, Ind. Eng. Chem. Res., 2020, 59, 8195–8201 CrossRef CAS.
- W. Ma, G. Jacobs, Y. Ji, T. Bhatelia, D. B. Bukur, S. Khalid and B. H. Davis, Top. Catal., 2011, 54, 757–767 CrossRef CAS.
- D. B. Bukur, Z. Pan, W. Ma, G. Jacobs and B. H. Davis, Catal. Lett., 2012, 142, 1382–1387 CrossRef CAS.
- C. L. Tucker and E. van Steen, Manganese promotion of Pt–Co/Al2O3 catalyst for the single pass Fischer-Tropsch biomass-to-liquid operation, North American Catalysis Society Meeting, 2019 Search PubMed.
- O. C. David, D. Gorri, A. Urtiaga and I. Ortiz, J. Membr. Sci., 2011, 378, 359–368 CrossRef CAS.
- D. Leckel and M. Liwanga-Ehumbu, Energy Fuels, 2006, 20, 2330–2336 CrossRef CAS.
- GreenCape, Waste Economy: Market Intelligence Report 2015, pp. 1–55 Search PubMed.
- D. Hoornweg and B. Perinaz, What a Waste a global review of solid waste management, 2012 Search PubMed.
- S. A. Chattanathan, S. Adhikari, M. McVey and O. Fasina, Int. J. Hydrogen Energy, 2014, 39, 19905–19911 CrossRef CAS.
- A. Hilkiah Igoni, M. J. Ayotamuno, C. L. Eze, S. O. T. Ogaji and S. D. Probert, Appl. Energy, 2008, 85, 430–438 CrossRef.
- A. Naqi, Ms thesis, University of South Florida, USA, 2018.
- K. Aasberg-Petersen, T. S. Christensen, C. Stub Nielsen and I. Dybkjær, Fuel Process. Technol., 2003, 83, 253–261 CrossRef CAS.
- C. Song and W. Pan, Catal. Today, 2004, 98, 463–484 CrossRef CAS.
- N. Kumar, M. Shojaee and J. J. Spivey, Curr. Opin. Chem. Eng., 2015, 9, 8–15 CrossRef.
- S. G. Gopaul and A. Dutta, Int. J. Hydrogen Energy, 2015, 40, 6307–6318 CrossRef CAS.
- X. Zhao, H. T. Ngo, D. M. Walker, D. Weber, D. Maiti, A. D. Petrov, B. Joseph and J. N. Kuhn, Chem. Eng. Commun., 2018, 205, 1–37 CrossRef.
- P. S. Roy, A. S. K. Raju and K. Kim, Fuel, 2015, 139, 314–320 CrossRef CAS.
- A. I. Tsyganok, M. Inaba, T. Tsunoda, K. Suzuki, K. Takehira and T. Hayakawa, Appl. Catal., A, 2004, 275, 149–155 CrossRef CAS.
- H. S. Roh, K. Y. Koo, U. D. Joshi and W. L. Yoon, Catal. Lett., 2008, 125, 283–288 CrossRef CAS.
- M. M. B. Noureldin, N. O. Elbashir and M. M. El-Halwagi, Ind. Eng. Chem. Res., 2014, 53, 1841–1855 CrossRef CAS.
- B. H. Davis and M. L. Occelli, Fischer-Tropsch Synthesis, Catalysts , and Catalysis, CRC Press, Taylor and Francis Group, Florida, 2016 Search PubMed.
- R. Y. Chein and W. H. Hsu, Energies, 2018, 11, 1–18 CrossRef.
- C. M. Kalamaras, P. Panagiotopoulou, D. I. Kondarides and A. M. Efstathiou, J. Catal., 2009, 264, 117–129 CrossRef CAS.
- H. Iida and A. Igarashi, Appl. Catal., A, 2006, 298, 152–160 CrossRef CAS.
- S. S. Hosseini, M. M. Teoh and T. S. Chung, Polymer, 2008, 49, 1594–1603 CrossRef CAS.
- Y. Zhang, I. H. Musselman, J. P. Ferraris and K. J. Balkus, J. Membr. Sci., 2008, 313, 170–181 CrossRef CAS.
- F. Weigelt, P. Georgopanos, S. Shishatskiy, V. Filiz, T. Brinkmann and V. Abetz, Polymers, 2018, 10(1), 51 CrossRef PubMed.
- D. Edlund, in Hydrogen and Syngas Production and Purification Technologies, 2010, pp. 357–384 Search PubMed.
- F. G. Botes, B. van Dyk and C. Mcgregor, Ind. Eng. Chem. Res., 2009, 48, 10439–10447 CrossRef CAS.
- C. L. Tucker, E. van Steen and M. Claeys, Catal. Sci. Technol., 2020, 10(20), 7056–7066 RSC.
- A. De Klerk, Fischer-Tropsch refining, John Wiley & Sons, 2012, pp. 1–601 Search PubMed.
- M. E. Dry, J. Chem. Technol. Biotechnol., 2002, 77, 43–50 CrossRef CAS.
- ASTM International, ASTM D93-20, Standard Test Methods for Flash Point by Pensky-Martens Closed Cup Tester, West Conshohocken, PA, 2020 Search PubMed.
- P. Ghosh and S. B. Jaffe, Ind. Eng. Chem. Res., 2006, 45, 346–351 CrossRef CAS.
- A. S. Maheshwari and J. G. Chellani, Fuel, 2012, 98, 55–60 CrossRef CAS.
- A. Vickers, Higher temperature simulated distillation with DB-HT Sim Dist Columns, Agilent Technologies, 2002 Search PubMed.
- R. M. de Deugd, PhD thesis, Delft University, Netherlands, 2004.
- G. P. van der Laan and A. A. C. M. Beenackers, Catal. Rev., 1999, 41, 255–318 CrossRef CAS.
- A. De Klerk, Energy Fuels, 2009, 23, 4593–4604 CrossRef CAS.
- Neste Corporation, Neste Renewable Diesel Handbook, 2015, pp. 1–33 Search PubMed.
- The African Refiners Association (ARA), ARA policy on African gasoline and diesel specifications, 2017 Search PubMed.
- South African National Standards, SANS 342:2016, 2016, vol. 3.
- J. Requies, J. F. Cambra, M. B. Güemez, U. Izquierdo, P. L. Arias and V. L. Barrio, Int. J. Hydrogen Energy, 2012, 38, 7623–7631 Search PubMed.
- J. M. Saad and P. T. Williams, Fuel Process. Technol., 2017, 156, 331–338 CrossRef CAS.
Footnotes |
| † Electronic supplementary information (ESI) available. See DOI: 10.1039/d1se01299a |
| ‡ Current address: Green Chemical Reaction Engineering, Engineering and Technology Institute Groningen, University of Groningen, Nijenborgh 4, 9747 AG Groningen, The Netherlands. |
| This journal is © The Royal Society of Chemistry 2021 |