 Open Access Article
Creative Commons Attribution 3.0 Unported Licence
Thermogalvanic energy harvesting from forced convection cooling of 100–200 °C surfaces generating high power density†
Yutaka
Ikeda
 a,
Yuki
Cho
a and
Yoichi
Murakami
 *ab
*ab
aSchool of Engineering, Tokyo Institute of Technology, 2-12-1 Ookayama, Meguro, Tokyo 152-8552, Japan. E-mail: murakami.y.af@titech.ac.jp
bPRESTO, JST, 4-1-8 Honcho, Kawaguchi, Saitama 332-0012, Japan
First published on 24th September 2021
Abstract
Electrical power recovery from waste heat released during active cooling of 100–200 °C solids is of great importance because such situations are common in our world. However, the concept of simultaneous liquid cooling and electric power generation has been barely explored, apart from a few preliminary studies that showed power generation densities of only 0.05–0.5 W m−2. Here, we report a realistically useful power generation density of 10 W m−2 during liquid forced convection cooling of a 170 °C surface, thus demonstrating the feasibility of such a concept, based on thermogalvanic conversion with a redox couple. This was achieved by exploiting the fluid dynamics based on a microchannel concept, where a thin thermal boundary layer is formed on the hot surface, enabling both high cooling efficiency and large interelectrode temperature difference (>100 K). A new γ-butyrolactone-based high density electrolyte with sufficient stability against flame contact was used. Our combined cooling and thermogalvanic cell was able to continuously light LEDs and run air fans despite the small electrode area. Large values of heat transfer coefficient, up to 1160 W m−2 K−1, were achieved. At all flow rates tested, the electrical power obtained was 10 to 1000 times larger than the hydrodynamic pumping work required to force the liquid through the cell, that is, gain ≫1. Thus, this technological concept has been shown, for the first time, to be a feasible option to recover electrical power from the waste heat released during cooling of 100–200 °C surfaces, which are widespread in our world.
Introduction
Utilization of waste heat is one of the most important goals to be achieved for reduction of greenhouse gas emissions.1 The amount of waste heat below 200 °C is presently a gigantic 8 PW h per year, which comprises ca. 66% of the total waste heat generated worldwide.2 To use this energy, various heat-recovery technologies2–4 have been investigated, including thermoelectric conversion with solids5–11 and liquids.12–35 Similar to the Seebeck effect used by solid thermoelectric systems, liquid-based technologies use a thermogalvanic Seebeck effect in which the temperature difference between two electrodes and the temperature dependence of the redox potentials at these electrodes generate electric power,15,21 except for some reports that used the liquid pyroelectric effect33 and thermomagnetic effect.34,35Notably, waste heat in the 100–200 °C range often necessitates convection cooling with a flow of coolant liquid.36 For instance, in data centres, which now consume ca. 1% of global electrical production,37 up to 40% of the electricity is used to cool the IT equipment.38,39 This waste heat must be removed in situ to maintain the temperatures of the heat-releasing objects below certain limits. Thus, this situation qualitatively differs from that assumed for conventional thermogalvanic cells, where heat is fed into one end of a closed cell encasing a liquid electrolyte, but active removal of that heat is not required.12–21,24–27,30–32
Despite the potential significance, the technological concept of simultaneous efficient cooling and electric power generation (Fig. 1a) has been unexplored, except for a few previous works that reported limited power densities of only 0.05–0.5 W m−2.22,23,28,29 Such a concept is inherently challenging because of the necessity of simultaneously designing the fluid dynamics, heat transfer, and ion transport in the non-isothermal channel region through which the electrolyte passes, where the latter also acts as a coolant. Therefore, optimal design of the flow in the channel region and choice of the electrolyte liquid, as well as optimal choice of materials to favour green and durable systems, are crucial to render this concept feasible.
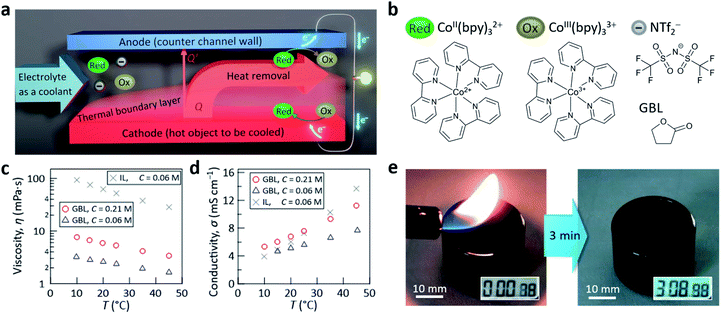 | ||
| Fig. 1 (a) Illustration of the concept for simultaneous liquid cooling of a hot surface and thermogalvanic power generation. Here, a thermal boundary layer developing from the starting edge is depicted, which is a characteristic of forced-convection cooling with laminar flow (see, e.g., ref. 36). (b) Molecular structures of the CoII/III(bpy)3(NTf2)2/3 redox couple and GBL. Temperature dependence of the (c) viscosity and (d) electrical conductivity measured for electrolytes with GBL of C = 0.21 (red circles) and 0.06 M (blue triangles). The reference data for the case of an electrolyte made with an IL ([C2mim][NTf2], gray crosses, from ref. 29) are shown for comparison. (e) Photographs, captured from ESI Movie,† demonstrating the high stability of the developed liquid electrolyte with GBL (C = 0.21 M) held in a glass vessel against continuous contact with a flame for 3 min. | ||
Both the power generation density and cooling efficiency at the heat-releasing surface are important performance measures of such a combined-purpose system. Thus far, previous studies, including ours, reported power densities of 0.25,22 0.05,23 0.36,28 and 0.44 W m−2 (ref. 29) along with heat transfer coefficients, which are a measure of cooling efficiency (given by eqn (2) later), of 450 (ref. 23) and 620 W m−2 K−1 (ref. 29). While the latter values were moderate,36 the power densities were too low for this concept to be considered feasible. The authors of ref. 23 set a target power density of 12 W m−2 to produce a meaningful amount of power that could be utilized in data centres.
Here, we report a drastic leap in the power density generated to a realistically usable 10 W m−2 by employing the benchmark redox couple CoII/III(bpy)3(NTf2)2/3 (bpy = 2,2′-bipyridine, NTf2 = bis(trifluoromethylsulfonyl)amide, Fig. 1b) along with a much improved heat transfer coefficient of 1160 W m−2 K−1. These were achieved by combining a microchannel concept (vide infra) for the flow of the electrolyte and an optimal electrolyte with low viscosity and high concentration of the redox couple. Specifically, we found that γ-butyrolactone (GBL, Fig. 1b) has many advantages as the electrolyte solvent for realizing the concept shown in Fig. 1a. The advantages of GBL40 include a high boiling point (204 °C), low freezing point (−43 °C), low viscosity (1.7 mPa s at 25 °C), and outstandingly wide electrochemical window (8.2 V at 25 °C), in addition to its industrially accessible cost (ca. 2500–4300 USD per ton,41 which is similar to the ca. 3800 USD per ton (ref. 42) for acetonitrile, one of the most common solvents for electrochemical applications43).
One of the reasons we optimized the solvent was because, in our preceding studies22,29 which used 1-ethyl-3-methyl-imidazolium NTf2 ([C2mim][NTf2]) ionic liquid (IL) as the solvent, the power generation performance was primarily limited by the mass-transfer resistance in the electrolyte, despite the ultra-high density of solvent ions that led to low solution resistance; this mass-transfer dominance originated from the high viscosity of [C2mim][NTf2] (ca. 52 mPa s at 25 °C).29 (Note: in contrast to GBL, [C2mim][NTf2] has a decomposition temperature of ca. 455 °C without a boiling point,44 freezing point of ca. −50 °C,44,45 and electrochemical window of ca. 4.7 V.46 The Seebeck coefficient in this IL was 1.49 mV K−1; refer to Fig. S1 and Table S1 in the ESI.†) Thus, a crucial insight obtained from the present work is that the power-generation performance of non-ionic high-boiling-point solvents, containing high concentrations of redox couple species, can surpass that of ILs, as presented below. Because of this context, most of the experimental results below will be compared with those acquired in our previous study29 where the IL was used as the solvent. All experimental details are given in the Experimental section at the end of this article.
Results and discussion
The CoII/III(bpy)3(NTf2)2/3 redox couple (Fig. 1b), widely used in the liquid-based thermogalvanic research,14,17,21,22,26,29 was originally developed to achieve high solubility in ILs;14 the solubility in [C2mim][NTf2] has been reported to be 0.1 M at room temperature14 and we used 0.06 M in a previous study.29 Interestingly, we found that the solubility of CoII/III(bpy)3(NTf2)2/3 in GBL was even higher (ca. 0.47 M at room temperature). This feature is promising because an increase of the redox couple concentration (C) generally increases the electric current. However, as C approached the solubility limit, the viscosity (η) was found to sharply increase (Fig. S2 and Table S2 in the ESI†). From the relationship between the power generated by the test cell (vide infra) and C (Fig. S3 in the ESI†), the optimal C was found to be 0.21 M, which will be used below.Replacement of the IL by GBL drastically decreased η (Fig. 1c), as expected. However, unexpectedly, this replacement did not reduce the conductivity (σ) of the electrolyte (Fig. 1d). This can be explained by both the drastic decrease of η, which enhances the mobility of CoII/III(bpy)3(NTf2)2/3, and the large increase of C, which enhances the charge-carrier density in the electrolyte, cancelling the expected problem that can accompany not using an IL. Owing to the relatively high C of the redox couple salt (0.21 M) and boiling point of neat GBL (204 °C), irradiation of the electrolyte with a flame for 3 min did not cause ignition (Fig. 1e and Movie in the ESI†), demonstrating the very high thermal stability of the developed liquid electrolyte.
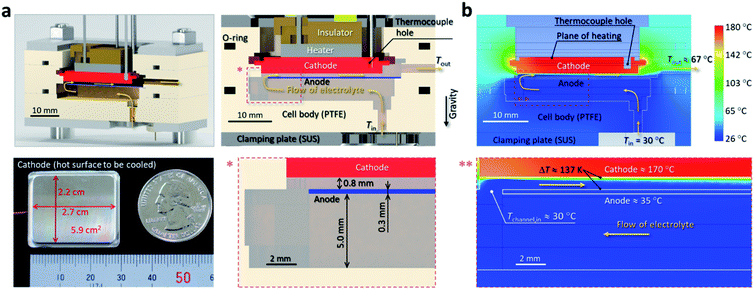
The cross-section of the thermocell is shown in Fig. 2a (see Fig. S4 in the ESI† for the photograph). The electrolyte liquid, also used as a coolant, enters the cell from the bottom at Tin = 26 ± 4 °C (see Experimental section for details). It then moves in the large space beneath the anode (height of the space: 5 mm; anode: platinum (Pt) plate with thickness of 0.3 mm; see also Fig. 2a), during which the temperature rise and pressure drop in the liquid are negligible. Subsequently, the liquid enters the narrow channel with a 0.8 mm gap formed by the two parallel planes of the cathode and anode (Fig. 2a). Here, the cathode (2.2 cm × 2.7 cm = 5.9 cm2) was a machine-processed nickel on which Pt was sputter coated (Pt thickness: ca. 100 nm); this cathode simulates a general hot plane that needs to be actively cooled. The reason for the narrow gap is to enhance the inter-electrode current by reducing the resistance for migration of the solute ions between the electrodes (cf.Fig. 1a) and to achieve a high heat transfer coefficient (eqn (2)) through the microchannel effect. Here, the “microchannel effect” is the classical hydrodynamic effect in which the rate of heat transfer between a solid wall and a fluid flowing over it is approximately inversely proportional to the channel width.47,48 The range of the electrolyte flow rate (G) tested in this study was from 0.1 to 1.13 mL s−1, which corresponded to the Reynolds number ranging from 4.7 to 41 when the cathode temperature (Tcathode) was 170 °C, i.e., laminar flow for all the tested conditions.
The steady-state simulations (Fig. 2b, see Simulation details in the ESI and Fig. S5 and S6 in the ESI† for validation) for Tcathode of 170 °C, Tin of 30 °C, and G of 1.13 mL s−1 show that there is a temperature difference (ΔT) of 137 K (based on the area average) between the electrodes in the steady state. This very large ΔT, which will be experimentally confirmed below, is attributed to the thin thermal boundary layer on the cathode (Fig. 2b). From a different viewpoint, the large ΔT in such a short distance is partly because most of the heat departing from the cathode surface (Q) is promptly removed by the flowing liquid, as intended, and thus only a small fraction of the heat enters the anode (Q′ in Fig. 1a). Thus, the narrow channel in the thermocell has two benefits: (1) it increases the cooling efficiency (microchannel effect) and (2) it increases the cell current by the reduced resistance for interelectrode migration of the redox ions, while establishing a large ΔT value by the thin thermal boundary layer.
It is mentioned that all experimental data shown below were acquired after a steady-state ΔT was established between the electrodes; i.e., under the situation with a stable power output (Fig. S7, ESI†). The current–voltage (I–V) curves at G = 0.5 mL s−1 (Fig. 3a) showed that both the open-circuit voltage (VOC, V at I = 0) and short-circuit current (ISC, I at V = 0) increased with increasing Tcathode. Consequently, the generated power (P) increased as shown by the power–voltage (P–V) curves (Fig. 3b). The increase of the current was caused by the increased temperature that decreased the electrolyte viscosity in the channel and on the electrode surface, which eventually decreased all of the mass-transfer resistance (Rmt), charge transfer resistance (Rct), and solution resistance (Rsol) in the channel region (Fig. 3c). Notably, comparing the results at Tcathode = 170 °C, a drastic increase of P from that of our previous study performed with an IL with C = 0.06 M (ref. 29) (gray crosses, Fig. 3b) was achieved with the present electrolyte with C = 0.21 M; this is attributed to an order of magnitude reduction of Rmt and Rct (Fig. 3c). Hereafter, the maximum value in the P–V curve is denoted Pmax.
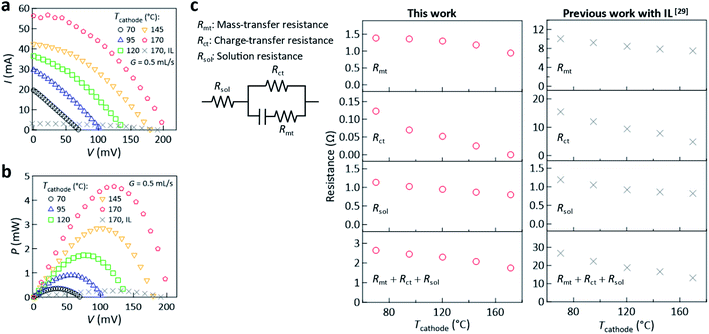 | ||
| Fig. 3 Dependence of the (a) I–V curve and (b) P–V curve on Tcathode at G = 0.5 mL s−1. (c) Dependence of the mass-transfer resistance (Rmt), charge transfer resistance (Rct), solution resistance (Rsol), and their total (Rmt + Rct + Rsol) on Tcathode at G = 0.5 mL s−1, where the resistances were determined based on the Randles equivalent circuit model.53Rmt was determined using the limiting current at −400 mV and theoretical solution of Rmt given in ref. 29. Rct and Rsol were determined from the Nyquist plots generated from AC impedance measurements (Fig. S8, ESI†). In all of the panels, the reference data (gray crosses, ref. 29) acquired in our previous study conducted using the electrolyte with [C2mim][NTf2] IL (C = 0.06 M) are shown, where experiments were performed using the same thermocell with Tin = 23 ± 2 °C. | ||
P max increased with increasing G (Fig. 4a), which is attributed to the increase of the inter-electrode ΔT revealed by the monotonic increase of VOC up to ca. 0.25 V (Fig. 4b). The change of the Nyquist plots generated from AC impedance measurements and electrochemical resistances with G are shown in Fig. S9 and S10 in the ESI,† respectively. VOC at G = 1.13 mL s−1 divided by the Seebeck coefficient (1.69 mV K−1, Fig. S1 in the ESI†) gives ΔT ≅ 143 K, which quantitatively agrees with the above simulation (ΔT ≅ 137 K at G = 1.13 mL s−1, Fig. 2b).
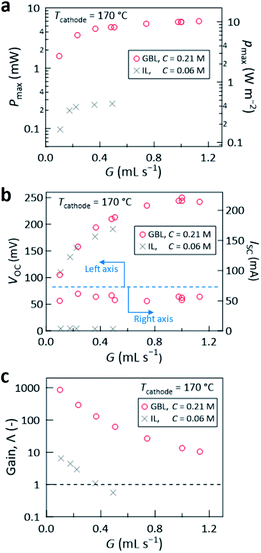 | ||
| Fig. 4 (a) The maximum power (Pmax, left axis) and power density (pmax, right axis), (b) the open-circuit voltage (VOC, left axis) and short-circuit current (ISC, right axis), and (c) the gain Λ, plotted against G at Tcathode = 170 °C. In all panels, the results obtained using the liquid electrolyte with GBL are compared with the reference data previously obtained using the electrolyte with an IL (gray crosses, from ref. 29). For both cases, the experiments were conducted using the same cell and experimental setup under the same environment, except that Tin for the former (GBL) was 26 ± 4 °C and that for the latter (IL) was Tin = 23 ± 2 °C. | ||
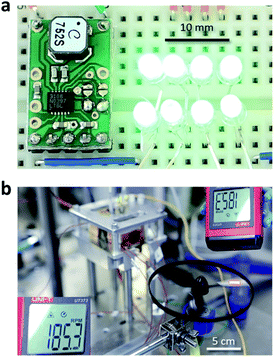
Notably, at G = 1.13 mL s−1, Pmax of 6.0 mW was achieved, corresponding to power density (pmax) of 10.2 W m−2 (Fig. 4a). This is a significant leap from the power densities obtained in our previous report29 (0.44 W m−2 for Tcathode = 170 °C, gray crosses in Fig. 4a) and other group's reports (0.05 (ref. 23) and 0.36 W m−2 (ref. 28)) where an aqueous Fe(CN)63−/4− solution was flowed over a hot wall with temperature of up to 150 °C.23 Despite the small electrode surface area (5.9 cm2, Fig. 2a), the large VOC and ISC (ca. 0.25 V and ca. 60 mA, respectively, Fig. 4b) afforded continuous lighting of eight green light-emitting diodes (LEDs) (Fig. 5a) and rotation of an air fan (Fig. 5b) without series connection of the cell. To the best of our knowledge, such demonstrations were for the first time reported with a cooling-integrated thermocell.
Here, we discuss the conventional efficiency, which is used to assess conventional closed thermocells, where cooling is not intended and thus heat is a pure resource utilizable without a particular duty. In the present flow thermocell, most of the heat (Q) that entered the liquid was promptly removed by the flow of the liquid and only ca. 1% of it reached the counter anode (Q′, Fig. 1a) according to the simulations. If the present cell performance is evaluated using the conventional efficiency, which is the power divided by the heat passing through the thermocell, Pmax/Q and Pmax/Q′ are ca. 0.01% and 1%, respectively. However, as previously discussed,29 such efficiency where Q is used as the denominator cannot properly rank or assess the performance of the present cell. This is because, for the same Pmax obtained, increasing the cooling efficiency in order to enhance Q (e.g., Fig. 6 below) leads to poorer performance, which contradicts the aim of the flow thermocell that has dual purposes.
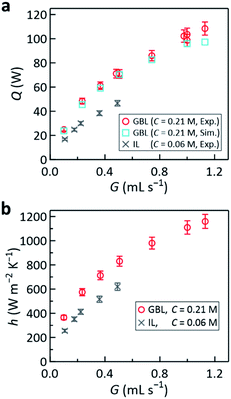 | ||
| Fig. 6 Plots of the (a) amount of heat removal Q and (b) heat transfer coefficient h against G at Tcathode = 170 °C. In (a), the results of the simulation performed for the corresponding conditions are also shown (light blue squares) for comparison. The error bars (±5%) account for the uncertainty arising from estimation of Qescape during the experiments (see Experimental section for details) and the gray crosses are the reference data from ref. 29 obtained with the IL-based electrolyte. | ||
In essence, flow thermocells need hydrodynamic work to force the liquid through the cell. Thus, it would be appropriate to assess the cell performance in terms of the gain29
 | (1) |
Notably, replacing the IL with GBL also enhanced the cooling performance, with a heat-removal rate of above 100 W achieved for the 5.9 cm2 area (Fig. 6a). The cooling efficiency was assessed by the heat-transfer coefficient36
 | (2) |
![[thin space (1/6-em)]](https://www.rsc.org/images/entities/char_2009.gif) 000 W m−2 K−1.36 It is noted that the present choice of Tchannel,in as Tfluid in eqn (2) led to conservative calculation of h. If we choose (Tout + Tin)/2 for Tfluid, which is a more common choice of the mean fluid temperature, h is calculated to be 1320 W m−2 K−1.
000 W m−2 K−1.36 It is noted that the present choice of Tchannel,in as Tfluid in eqn (2) led to conservative calculation of h. If we choose (Tout + Tin)/2 for Tfluid, which is a more common choice of the mean fluid temperature, h is calculated to be 1320 W m−2 K−1.
Finally, we discuss the underlying reason for the heat transfer enhancement. The thermophysical properties of the electrolytes are summarized in Table 1. Notably, both the specific heat (cp) and thermal conductivity (k), which directly affects liquid-cooling performance,36 improved compared with the case of the IL-based electrolyte. In addition, the Prandtl number (Pr), which is the ratio of the kinematic viscosity (=η/ρ) to the thermal diffusivity (=k/(ρcp)) and hence represents “a measure of the suitability as a coolant” (smaller is better),36 drastically improved from 370 to 15–40 by this change. Thus, the choice of GBL as the solvent significantly enhanced both the power generation and cooling performance.
Conclusions
Waste heat at 100–200 °C often necessitates active removal by cooling because broad range of heat sources including microprocessors, devices, engines, and battery cells need to be maintained below a certain temperature during operation. However, recovering electrical power from such widespread situations was almost unexplored previously, apart from a few studies that reported unusably low power densities of 0.05–0.5 W m−2. In this study, by utilizing the microchannel concept and newly developed γ-butyrolactone-based high density electrolyte, a realistically useful power density of 10 W m−2 level was for the first time obtained during forced convection cooling of a heat releasing electrode, which simulates an object to be cooled. The developed electrolyte not only had significantly lower viscosity and electrochemical resistances compared with the previous IL-based electrolyte, but also high thermal stability against continuous contact with a flame. Despite the small electrode surface area of 5.9 cm2, the high-power density was able to continuously light LEDs and run air fans. At all flow rates tested, the gain of 10–1000 was obtained, and this energy benefit demonstrates the validity of the proposed technological concept. In addition, a high cooling coefficient of 1160 W m−2 K−1 was achieved, which showed a promise as a cooling system. Overall, the proof-of-concept shown in the present work can enable power to be harvested from diverse situations of cooling of 100–200 °C solids. This proposed technology also has a potential to be used as distributed electric power sources that are crucial for realizing a future Internet-of-Things (IoT) world.49Experimental
Chemicals
The CoII(bpy)3(NTf2)2 and CoIII(bpy)3(NTf2)3 (purity > 98%) redox couple was supplied by Nippon Kayaku (Japan). GBL (purity > 99.0%) was supplied by TCI (Japan). CoII(bpy)3(NTf2)2 and CoIII(bpy)3(NTf2)3 were used without further purification. The water impurity that might have existed in the supplied GBL was removed prior to use by adding an appropriate amount of a molecular sieve (pore size 4 Å, Nacalai Tesque, Japan; activated under vacuum at 200 °C for several hours before use) to the reserve glass bottle of GBL.Electrolyte preparation
The redox reagent powders were dissolved in GBL by vigorous mixing using a magnetic stirrer at room temperature for more than 30 min to the target concentration. Complete dissolution was visibly checked by the absence of powdery light scattering in the liquid volume upon irradiation of the glass container holding the liquid with a He–Ne laser (wavelength 632.8 nm, power 5–10 mW). The concentration was checked by the optical absorption spectrum obtained with an ultraviolet–visible–near-infrared (UV–vis–NIR) spectrophotometer (UV-3600, Shimadzu, Japan) after appropriate dilution with neat GBL. In the UV–vis–NIR measurements, quartz cuvettes with a 1 mm optical path length were used.Viscosity measurements
The viscosities of the electrolyte liquids (η) were measured with a cone-plate rheometer (DV2T, Brookfield, USA), where the temperature was controlled by circulation of temperature-controlled water in the sample cup. For each sample, η was measured at six temperatures (10, 15, 20, 25, 35, and 45 °C). The temperature-dependent values of η were fitted with the Vogel–Fulcher–Tammann (VFT) equation.50 These VFT parameters were used in the simulation (see also Simulation details in the ESI†) to obtain η at an arbitrary temperature.Electrical conductivity measurements
The electrical conductivity of the electrolyte (σ) was determined by the alternating current (AC) impedance method using a potentiostat–galvanostat (VersaSTAT 4, Princeton Applied Research, USA). The temperature of the sample was controlled by circulating temperature-controlled water through the custom-made electrochemical cell that was hermetically sealed using O-rings. The measurements were performed using a sinusoidal AC input with an amplitude of 5 mV around VOC scanning from 1 MHz to 0.05 Hz. σ was obtained from the crossing point on the real axis of the Nyquist plot.Thermal conductivity measurements
The thermal conductivities of the three electrolytes, two GBL-based electrolytes (C = 0.06 and 0.21 M) and one IL-based electrolyte (C = 0.06 M), were determined by the temperature-wave analysis (TWA) method,51,52 which is the ISO standardized method for thermal conductivity measurement (ISO 22007-6),52 using a thermal conductivity analyser (Mobile M10, ai-Phase, Japan) at 20 °C. For each sample, the average value of 10 measurements was used. These values were used in the simulations assuming that the thermal conductivities did not change with temperature, which is often a good approximation for liquids.36Heat capacity measurements
The specific heat capacities at constant pressure (cp) of the electrolytes were measured by a power-compensation differential scanning calorimeter (DSC8000, PerkinElmer, USA) in the temperature range from 5 to 115 °C. Each sample was sealed in an aluminium cell. Before the measurement, the weights of the samples, reference, and blank aluminium cell were accurately measured with an ultra-micro balance (Cubis MSA2.7S, Sartorius, Germany). The cp value of the sample was determined using a sapphire thin plate supplied by PerkinElmer as a reference with known specific heat capacity.Experimental procedure for flow thermocell
In the test experimental setup, the electrolyte liquid was circulated in a loop consisting of tubes and tubing junctions made of perfluoroalkoxy alkane (PFA) and polytetrafluoroethylene (PTFE), respectively, using a roller tubing pump (Masterflex 07528-20 with a HV-77390-00 pump head, Cole-Parmer, USA). PFA and PTFE were chosen to prevent unnoticed contamination from the experimental setup, which might decrease the reliability of the results. For the same reason, the body of the thermocell was made of PTFE (Fig. 2a and S4 in the ESI†) and the roller tubing pump was chosen to avoid physical contact between the liquid and the mechanical parts of the pump. To retain the steady state during the experiment, the hot liquid coming out of the cell at Tout was cooled by passing it through a section placed in a laboratory water chiller so that the liquid could re-enter the cell at Tin (26 ± 4 °C). The I–V curves were acquired using a source measure unit (Model 2450, Keithley, USA). The cathode temperature Tcathode, which was monitored by a thermocouple embedded in the cathode (cf.Fig. 2a), was controlled by a ceramic heater (BVP-004, Bach Resistor Ceramics GmbH, Germany) with a feed-back power controller (DB630, CHINO, Japan). The electric power consumption or heat generation in the ceramic heater (Qheater) was measured by a power meter (Model 3333, Hioki, Japan). In all of the experiments, the ambient temperature was controlled to 23 ± 2 °C. Further details are given in our previous study29 carried out using the same thermocell.Determination of heat removal amount
The amount of heat removal Q was determined by subtracting the steady-state heat escape from the cell surface Qescape from Qheater. Qescape for each experimental condition was determined using a pre-calibrated relationship between Qheater at G = 0 after the steady state was sufficiently reached, which is equal to Qescape, and the temperature difference between the average temperature of the cell surface (see Fig. S5 in the ESI† for the positions of the thermocouples on the surface) and the ambient temperature (23 ± 2 °C).Author contributions
Y. M. conceived and supervised the project. Y. I. selected GBL and carried out the experiments and simulations. Y. C. performed part of the experiments, especially the conductivity measurements. Y. I. and Y. M. wrote the manuscript. All authors carefully read this manuscript and have agreed with the submission.Conflicts of interest
There are no conflicts to declare.Acknowledgements
This work was financially supported by a TEPCO Memorial Foundation Research Grant (Grant no. H26(26)). We cordially thank Prof. Koichi Hishida (Keio University, currently at Meiji University) for his valuable advice provided through this research project and Mr Kazuki Niimi and Mr Shinya Nagatsuka (Nippon Kayaku Co., Ltd) for supplying the high-purity reagents used in this study. We also thank Dr Toshimasa Hashimoto at ai-Phase Co., Ltd for his valuable consultation and discussion on the thermal conductivity measurements using the TWA method.References
- A. Firth, B. Zhang and A. Yang, Appl. Energy, 2019, 235, 1314–1334 CrossRef.
- E. Garofalo, M. Bevione, L. Cecchini, F. Mattiussi and A. Chiolerio, Energy Technol., 2020, 8, 2000413 CrossRef CAS.
- Z. Y. Xu, R. Z. Wang and C. Yang, Energy, 2019, 176, 1037–1043 CrossRef.
- Z. Su, M. Zhang, P. Xu, Z. Zhao, Z. Wang, H. Huang and T. Ouyang, Energy Convers. Manage., 2021, 229, 113769 CrossRef.
- D. Champier, Energy Convers. Manage., 2017, 140, 167–181 CrossRef.
- J. He and T. M. Tritt, Science, 2017, 357, eaak9997 CrossRef.
- L. Yang, Z.-G. Chen, M. S. Dargusch and J. Zou, Adv. Energy Mater., 2018, 8, 1701797 CrossRef.
- K. Imasato, S. D. Kang and G. J. Snyder, Energy Environ. Sci., 2019, 12, 965–971 RSC.
- Y. Xing, R. Liu, J. Liao, Q. Zhang, X. Xia, C. Wang, H. Huang, J. Chu, M. Gu, T. Zhu, C. Zhu, F. Xu, D. Yao, Y. Zeng, S. Bai, C. Uher and L. Chen, Energy Environ. Sci., 2019, 12, 3390–3399 RSC.
- X.-L. Shi, J. Zou and Z.-G. Chen, Chem. Rev., 2020, 120, 7399–7515 CrossRef CAS PubMed.
- T. Xing, Q. Song, P. Qiu, Q. Zhang, M. Gu, X. Xia, J. Liao, X. Shi and L. Chen, Energy Environ. Sci., 2021, 14, 995–1003 RSC.
- T. Migita, N. Tachikawa, Y. Katayama and T. Miura, Electrochem, 2009, 77, 639–641 CrossRef CAS.
- T. J. Abraham, D. R. MacFarlane and J. M. Pringle, Chem. Commun., 2011, 47, 6260–6262 RSC.
- T. J. Abraham, D. R. MacFarlane and J. M. Pringle, Energy Environ. Sci., 2013, 6, 2639–2645 RSC.
- A. Gunawan, C.-H. Lin, D. A. Buttry, V. Mujica, R. A. Taylor, R. S. Prasher and P. E. Phelan, Nanoscale Microscale Thermophys. Eng., 2013, 17, 304–323 CrossRef CAS.
- A. Gunawan, H. Li, C.-H. Lin, D. A. Buttry, V. Mujica, R. A. Taylor, R. S. Prasher and P. E. Phelan, Int. J. Heat Mass Transfer, 2014, 78, 423–434 CrossRef CAS.
- P. F. Salazar, S. T. Stephens, A. H. Kazim, J. M. Pringle and B. A. Cola, J. Mater. Chem. A, 2014, 2, 20676–20682 RSC.
- E. H. B. Anari, M. Romano, W. X. Teh, J. J. Black, E. Jiang, J. Chen, T. Q. To, J. Panchompooa and L. Aldous, Chem. Commun., 2016, 52, 745–748 RSC.
- H. Zhou, T. Yamada and N. Kimizuka, J. Am. Chem. Soc., 2016, 138, 10502–10507 CrossRef CAS PubMed.
- L. Aldous, J. J. Black, M. C. Elias, B. Gélinas and D. Rochefort, Phys. Chem. Chem. Phys., 2017, 19, 24255–24263 RSC.
- M. F. Dupont, D. R. MacFarlane and J. M. Pringle, Chem. Commun., 2017, 53, 6288–6302 RSC.
- Y. Ikeda, K. Fukui and Y. Murakami, Conference paper (#1971, 6 pages) published in The 54th National Heat Transfer Symposium of Japan, May 24−26, 2017, Omiya, Japan, This conference paper is available online at Tokyo Tech Repository viahttps://t2r2.star.titech.ac.jp/rrws/file/CTT100802630/ATD100000413/ Search PubMed.
- A. H. Kazim, A. S. Booeshaghi, S. T. Stephens and B. A. Cola, Sustainable Energy Fuels, 2017, 1, 1381–1389 RSC.
- J. Duan, G. Feng, B. Yu, J. Li, M. Chen, P. Yang, J. Feng, K. Liu and J. Zhou, Nat. Commun., 2018, 9, 5146 CrossRef.
- H. Zhou, T. Yamada and N. Kimizuka, Sustainable Energy Fuels, 2018, 2, 472–478 RSC.
- D. Al-Masri, M. Dupont, R. Yunis, D. R. MacFarlane and J. M. Pringle, Electrochim. Acta, 2018, 269, 714–723 CrossRef CAS.
- M. A. Buckingham, F. Marken and L. Aldous, Sustainable Energy Fuels, 2018, 2, 2717–2726 RSC.
- A. H. Kazim and B. A. Cola, J. Electrochem. Energy Convers. Storage, 2019, 16, 011007 CrossRef.
- Y. Ikeda, K. Fukui and Y. Murakami, Phys. Chem. Chem. Phys., 2019, 21, 25838–25848 RSC.
- M. A. Buckingham, S. Hammoud, H. Li, C. J. Beale, J. T. Sengel and L. Aldous, Sustainable Energy Fuels, 2020, 4, 3388–3399 RSC.
- B. Guo, Y. Hoshino, F. Gao, K. Hayashi, Y. Miura, N. Kimizuka and T. Yamada, J. Am. Chem. Soc., 2020, 142, 17318–17322 CrossRef CAS PubMed.
- B. Yu, J. Duan, H. Cong, W. Xie, R. Liu, X. Zhuang, H. Wang, B. Qi, M. Xu, Z. L. Wang and J. Zhou, Science, 2020, 370, 342–346 CrossRef CAS PubMed.
- M. Bevione, E. Garofalo, L. Cecchini and A. Chiolerio, MRS Energy Sustain., 2020, 7, 38 CrossRef.
- A. Chiolerio, E. Garofalo, F. Mattiussi, M. Crepaldi, G. Fortunato and M. Iovieno, Appl. Energy, 2020, 277, 115591 CrossRef CAS.
- A. Chiolerio, E. Garofalo, M. Bevione and L. Cecchini, Energy Technol., 2021, 2100544 CrossRef.
- F. P. Incropera and D. P. Dewitt, Fundamentals of Heat and Mass Transfer, John Wiley & Sons, New York, 4th edn, 1996 Search PubMed.
- E. Masanet, A. Shehabi, N. Lei, S. Smith and J. Koomey, Science, 2020, 367, 984–986 CrossRef CAS PubMed.
- Z. Song, X. Zhang and C. Eriksson, Energy Procedia, 2015, 75, 1255–1260 CrossRef.
- C. Nadjahi, H. Louahlia and S. Lemasson, Sustainable Computing: Informatics and Systems, 2018, 19, 14–28 Search PubMed.
- M. Ue, K. Ida and S. Mori, J. Electrochem. Soc., 1994, 141, 2989–2996 CrossRef CAS.
- C. C. Satam and M. J. Realff, J. Adv. Manuf. Process., 2020, 2, e10054 CAS.
- F. Rezaie, V. Pirouzfar and A. Alihosseini, Therm. Sci. Eng. Prog., 2020, 16, 100463 CrossRef.
- C. G. Zoski, Handbook of Electrochemistry, Elsevier, Amsterdam, 1st edn, 2007 Search PubMed.
- H. L. Ngo, K. LeCompte, L. Hargens and A. B. McEwen, Thermochim. Acta, 2000, 357–358, 97–102 CrossRef CAS.
- E. Gómez, N. Calvar, Á. Domínguez and E. A. Macedo, Ind. Eng. Chem. Res., 2013, 52, 2103–2110 CrossRef.
- M. P. S. Mousavi, B. E. Wilson, S. Kashefolgheta, E. L. Anderson, S. He, P. Bühlmann and A. Stein, ACS Appl. Mater. Interfaces, 2016, 8, 3396–3406 CrossRef CAS PubMed.
- D. B. Tuckerman and R. F. W. Pease, IEEE Electron Device Lett., 1981, 2, 126–129 Search PubMed.
- R. W. Knight, D. J. Hall, J. S. Goodling and R. C. Jaeger, IEEE Trans. Compon., Hybrids, Manuf. Technol., 1992, 15, 832–842 CrossRef.
- M. Haras and T. Skotnicki, Nano Energy, 2018, 54, 461–476 CrossRef CAS.
- G. W. Scherer, J. Am. Ceram. Soc., 1992, 75, 1060–1062 CrossRef.
- T. Hashimoto, J. Morikawa, T. Kurihara and T. Tsuji, Thermochim. Acta, 1997, 304, 151–156 CrossRef.
- International Organization for Standardization, ISO 22007-6:2014, https://www.iso.org/standard/59508.html, accessed Aug 1, 2021.
- A. J. Bard and L. R. Faulkner, Electrochemical Methods: Fundamentals and Applications, John Wiley & Sons, Hoboken, NJ, 2nd edn, 2001 Search PubMed.
Footnote |
| † Electronic supplementary information (ESI) available: Simulation details, Seebeck coefficients of the electrolytes, concentration dependence of the electrolyte viscosity, concentration dependence of the generated power, photograph of the thermocell, validation of the simulation, stability of the power generation, Nyquist plots generated from AC impedance measurements, and flow rate dependence of the electrochemical resistances. See DOI: 10.1039/d1se01264a |
| This journal is © The Royal Society of Chemistry 2021 |

