 Open Access Article
Creative Commons Attribution 3.0 Unported Licence
Intermetallic compounds M2Pt (M = Al, Ga, In, Sn) in the oxygen evolution reaction†
Ana María
Barrios Jiménez
,
Alim
Ormeci
 ,
Ulrich
Burkhardt
 ,
Simone G.
Altendorf
 ,
Felix
Kaiser
 ,
Igor
Veremchuk
,
Gudrun
Auffermann
,
Igor
Veremchuk
,
Gudrun
Auffermann
 ,
Yuri
Grin
 and
Iryna
Antonyshyn
 *
*
Max-Planck-Institut für Chemische Physik fester Stoffe, Nöthnitzer Str. 40, 01187 Dresden, Germany. E-mail: Iryna.Antonyshyn@cpfs.mpg.de
First published on 8th October 2021
Abstract
Pt-based intermetallic compounds M2Pt with anti-CaF2 type of crystal structure and counterpart elements (M) from groups 13 (Al, Ga, In) and 14 (Sn) were studied as electrocatalysts for the oxygen evolution reaction (OER) in acidic media. Polar covalent bonding M–Pt with substantial charge transfer makes the difference between M2Pt and elemental platinum. The compounds M2Pt (M = Al, Ga, In) possess enhanced OER activity compared to elemental Pt and it improves during the partial on-going leaching of the M component. Therefore, the M2Pt compounds act as precursors for formation of OER-active MxPt1−x layers.
Introduction
Electrocatalysts support the sufficient kinetics of the electrochemical processes for the production of energy-carrier substances in a sustainable way.1–5 Among them, hydrogen is the most promising clean fuel, since its conversion brings the largest amount of energy per weight unit.6,7 Therefore, development of the suitable catalysts for water splitting process, focusing on the anodic oxygen evolution reaction (OER) as rate-limiting one,8–11 is the main target for many studies nowadays.Considering the extremely oxidative conditions of OER, not only the activity, but also the stability of the catalysts under working conditions is a crucial factor for their use. Both properties largely depend on the electronic and structural features of the electrode materials.12–16 Those properties are determined by both, the catalytically active transition metal and the counterpart elements,2,17 and, therefore, can be modified by changing the components, which yields different catalytic performance of the resultant compounds.
Currently, Ir- and Ru- based materials, e.g. IrOx/SrIrO3 or Cr0.6Ru0.4O2,18,19 are considered as the outstanding electrocatalysts for the OER.20–22 The high OER activity of Ir- and Ru-based electrocatalysts is attributed to their near optimal binding energy of the OER-intermediates Oad and OOHad.2,23,24
However, looking at catalyst stability under OER conditions, platinum is the most stable one against dissolution.25,26 Furthermore, it is known that introducing Pt atoms into the structure of other active materials leads to the improved stability limits of such electrocatalysts.27–29 The OER activity can be improved through increase of the electrochemically active surface area via shaping, using various supports30 and/or synthesis of nanoparticles20 or porous Pt.31,32 However, the use of intermetallic compounds, combining Pt with other metals, to increase its inherent OER activity is represented scarcely in the literature.33 The intermetallic compound with the modified electronic structure13,14,34 reveals different electrocatalytic activity. Combining platinum, as a catalytic center stable against the dissolution, with Al as the main group element was recognized as a good strategy to improve the OER activity of such electrode materials. The intermetallic compound Al2Pt (anti-CaF2 type of crystal structure) shows a promising OER performance, proving that the strategy to enhance OER activity by modifying the Pt electronic state lowers significantly the OER overpotential compared to elemental Pt.35
Following these thoughts, the influence of the electronic factor on the chemical behaviour of Pt-based materials and their OER performance has been studied. To avoid the influence of the geometrical factor and address mainly the effect of the chemical nature of the counterpart element on the reaction rates, this study was performed on the isostructural compounds M2Pt (M = Al, Ga, In, Sn) with anti-CaF2 type of crystal structure.
Experimental
Preparation
For the synthesis of M2Pt (M = Al, Ga, In, Sn), platinum slugs (Alfa Aesar, 99.99%) were mixed with aluminum shots (Chempur, 99.9999%), gallium pieces (Chempur, 99.999%), indium granules (Roth, >99.97%) or tin shots (Alfa Aesar, 99.999%), respectively. The atomic ratio between the components was equal to 2![[thin space (1/6-em)]](https://www.rsc.org/images/entities/char_2009.gif) :
:![[thin space (1/6-em)]](https://www.rsc.org/images/entities/char_2009.gif) 1 only in case of Sn2Pt, in the synthesis of other compounds compositions were slightly different (i.e., 68.2
1 only in case of Sn2Pt, in the synthesis of other compounds compositions were slightly different (i.e., 68.2![[thin space (1/6-em)]](https://www.rsc.org/images/entities/char_2009.gif) :
:![[thin space (1/6-em)]](https://www.rsc.org/images/entities/char_2009.gif) 31.8 for Al2Pt; 66.17
31.8 for Al2Pt; 66.17![[thin space (1/6-em)]](https://www.rsc.org/images/entities/char_2009.gif) :
:![[thin space (1/6-em)]](https://www.rsc.org/images/entities/char_2009.gif) 33.83 for Ga2Pt and 65.67
33.83 for Ga2Pt and 65.67![[thin space (1/6-em)]](https://www.rsc.org/images/entities/char_2009.gif) :
:![[thin space (1/6-em)]](https://www.rsc.org/images/entities/char_2009.gif) 34.33 for In2Pt) to ensure the single-phase character of the products. The Al2Pt sample was prepared by arc melting of initial components on a water-cooled copper mold under argon atmosphere. To achieve homogeneity, the sample was re-melted three times. Compounds M2Pt (M = Ga, In, Sn) were synthesized via reacting elements in the high frequency furnace in glassy carbon crucibles under argon atmosphere. The mass losses were 0.15, 0.01, 0.03 and 0.01% for Al2Pt, Ga2Pt, In2Pt and Sn2Pt, respectively. The ingots after melting were placed in alumina crucibles and sealed into Ta containers, which were enclosed into quartz ampoules under vacuum. The homogenization annealing of M2Pt (M = Al, Ga, In, Sn) was carried out for seven days in resistance furnaces at 1000 °C, 870 °C, 950 °C and 710 °C, respectively. The annealing temperatures for M2Pt compounds were chosen based on the formation reactions and corresponding temperatures, taken from the phase diagrams of the respective binary M–Pt systems.36–39 Afterwards, samples were quenched in the iced water with breaking of quartz ampoules.
34.33 for In2Pt) to ensure the single-phase character of the products. The Al2Pt sample was prepared by arc melting of initial components on a water-cooled copper mold under argon atmosphere. To achieve homogeneity, the sample was re-melted three times. Compounds M2Pt (M = Ga, In, Sn) were synthesized via reacting elements in the high frequency furnace in glassy carbon crucibles under argon atmosphere. The mass losses were 0.15, 0.01, 0.03 and 0.01% for Al2Pt, Ga2Pt, In2Pt and Sn2Pt, respectively. The ingots after melting were placed in alumina crucibles and sealed into Ta containers, which were enclosed into quartz ampoules under vacuum. The homogenization annealing of M2Pt (M = Al, Ga, In, Sn) was carried out for seven days in resistance furnaces at 1000 °C, 870 °C, 950 °C and 710 °C, respectively. The annealing temperatures for M2Pt compounds were chosen based on the formation reactions and corresponding temperatures, taken from the phase diagrams of the respective binary M–Pt systems.36–39 Afterwards, samples were quenched in the iced water with breaking of quartz ampoules.
To manufacture the specimens for the electrochemical measurements (cylinders 8 mm in diameter and 3–4 mm high), spark plasma sintering (SPS, 515 ET Sinter Lab, Fuji Electronic Industrial Co. Ltd.) was used. The ingots were crushed, grinded and filled into a graphite die, the graphite foil was used to avoid a direct contact between sample and die's walls. The heating by pulsed direct electrical current with low voltages was carried out with a rate of 100 °C min−1 up to maximum temperature (Tmax) of 1000, 800, 900 and 600 °C in case of Al2Pt, Ga2Pt, In2Pt and Sn2Pt, respectively, followed by dwelling at Tmax and uniaxial pressure of 80 MPa for 10 min. After SPS, pellets were polished using different SiC grinding papers and, finally, diamond solutions (diamond particle size 3, 1, ¼ μm).
Characterization
Powder X-ray diffraction (PXRD) patterns of as-synthesized samples were collected in transmission mode on a Huber Imaging Plate Guinier Camera G670 (CuKα1 radiation, λ = 1.540562 Å). The phase analysis was performed via comparison of experimental PXRD patterns with theoretically calculated ones using program WinXPOW.40 For lattice parameter determination, LaB6 (a = 4.1569 Å) was used as internal standard for PXRD data collection and software package WinCSD41 was employed for data evaluation.Scanning electron microscopy SEM (JEOL JSM-7800F) with energy-dispersive X-ray spectroscopy (EDXS) system (Quantax 400, Bruker, Silicon-Drift-Detector (SDD)) was performed to control the quality and homogeneity of the prepared samples as well as to inspect the changes of the material after electrochemical treatments. Platinum concentration mapping of the surfaces was obtained using the intensities of the Pt Mα lines with the acceleration voltage of 27 kV. To obtain the semi-quantitative M![[thin space (1/6-em)]](https://www.rsc.org/images/entities/char_2009.gif) :
:![[thin space (1/6-em)]](https://www.rsc.org/images/entities/char_2009.gif) Pt ratios at different depths of the material, EDXS data were collected with acceleration voltages of 5, 10 and 27 kV. Depth-dependent changes in composition were evaluated via comparison of the detected X-ray intensities of the Al Kα, Ga Lα, In Lα and Sn Lα lines with the calculated ones for homogeneous samples, normalizing all intensities to a Pt Mα line intensity equal to 1. Optical micrographs were taken under a light microscope (Axioplan 2, Zeiss) in bright-field, polarised light and with differential interferential contrast at various magnifications.
Pt ratios at different depths of the material, EDXS data were collected with acceleration voltages of 5, 10 and 27 kV. Depth-dependent changes in composition were evaluated via comparison of the detected X-ray intensities of the Al Kα, Ga Lα, In Lα and Sn Lα lines with the calculated ones for homogeneous samples, normalizing all intensities to a Pt Mα line intensity equal to 1. Optical micrographs were taken under a light microscope (Axioplan 2, Zeiss) in bright-field, polarised light and with differential interferential contrast at various magnifications.
To characterize the electronic state of the elements, the samples were analyzed by X-ray photoelectron spectroscopy (XPS) using a spectrometer equipped with an electron energy analyzer (Scienta R3000) and a twin crystal monochromatized Al Kα (hν = 1486.6 eV) source (Vacuum Generators). All spectra were collected at room temperature and in normal emission geometry. The overall energy resolution was ∼0.4 eV, and the Fermi level was calibrated using a polycrystalline Ag reference. The pressure in the spectrometer chamber was in the low 10−10 mbar range.
Electrochemical experiments
All electrochemical (EC) experiments were performed in a 3-compartment electrochemical cell using a BioLogic SP-300 potentiostat. Pt wire (PINE, 99.99%, 0.5 mm in diameter) and saturated calomel electrode (PINE, Hg/Hg2Cl2, 4 M KCl) were used as the counter and reference electrodes, respectively. The densified specimens (cylindric pellets of 8 mm in diameter) were used as working electrodes. Measurements were performed in Ar-saturated 0.1 M HClO4 solution, prepared by dilution of 70% (by mass) HClO4 (Sigma Aldrich, 99.999% metal basis) in ultrapure water (Milli-Q® Synthesis A10, Millipore; resistivity of 18.2 MΩ cm). Purging with argon (purity grade 5.0) for 30 min prior to each experiment was carried out in order to de-aerate the electrolyte.To estimate the initial OER activity of the synthesized materials, linear sweep voltammetry (LSV) was done (Emax = 2.1 VRHE; sweep rate of 5 mV s−1), followed by cyclic voltammetry (CV, Emax = 1.0 VRHE; sweep rate of 50 mV s−1; 50 cycles) to monitor oxidation/reduction processes and remove possible contaminants from the surface. The measurement parameters were chosen in order to avoid the dissolution of Pt, which occurs at potentials higher than 1.1 VRHE.25,42,43 The current densities were normalized to the geometrical surface area of the used specimens (0.204 cm2). The potential values were expressed versus reference hydrogen electrode (RHE). To avoid the incorrect voltammetry response due to the ohmic drop between working and reference electrodes as a result of solution resistance (Ru), the iR-correction was carried out. The Ru values were obtained from Electrochemical Impedance Spectroscopy (EIS) measurements. In order to control OER-activity changes during prolonged OER, chronopotentiometry (CP) was carried out at the benchmarking current density of 10 mA cm−2 for 2 h.44–47 Additionally, LSVs were measured after the CV pre-treatment and after one and two hours of CP experiment. The complete sequence of CV pre-treatment and the following CP will be referred in the text as “standard OER experiment”. The concentrations of the dissolved elements were determined by taking electrolyte aliquots at the end of the EC experiment. Elemental analysis was made via inductively coupled plasma-optical emission spectrometry (ICP-OES 5100 SVDV, Agilent).
Computational part
Electronic structure calculations were performed by using two first-principles all-electron full-potential methods. Both full-potential local orbital (FPLO)48 and Fritz-Haber-Institute ab initio molecular simulations (FHI-aims)49 methods employ atom-centered numerical orbitals. The local density approximation (LDA) as parameterized by Perdew and Wang50 and generalized gradient approximation (GGA) in the formulation of Perdew–Burke–Ernzerhof51 were used to include exchange–correlation effects. Convergence with respect to Brillouin zone sampling was checked carefully.The Pt 4f shifts in M2Pt compounds with respect to elemental Pt were calculated using the so-called delta self-consistent-field (delta SCF) approach.52 The 4f electron binding energy for a Pt atom in a compound is approximated as:
| BE4f = Etot(4f13) − Etot(4f14), |
| δ(BE4f) = BE4f (M2Pt) − BE4f (Pt). |
This so-called final-state theory is more accurate than just looking at the difference between the energy levels of the Pt 4f in M2Pt and Pt (usually referred to as initial-state theory), because the effects of the core hole (final-state effects) are considered.55
The combined topological analysis of the electron density (ED) and electron localizability indicator (ELI) was applied to investigate the chemical bonding features of the title compounds in position space. The topological analysis of ED forms the basis of the quantum theory of atoms in molecules (QTAIM).56 ELI was calculated in the ELI-D representation57–59 using an interface to the FHI-aims method.60 The basin intersection technique was used to determine which atoms participate in a bond by contributing how many electrons.61 The topological analysis was carried out by employing the program DGrid.62 In a binary compound XpYq the bond fractions with respect to elements can be defined as:
| p(X) = nbX/nb, p(Y) = nbY/nb, |
Results and discussion
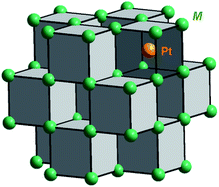
The binary compounds M2Pt (M = Al, Ga, In, Sn) crystallize with anti-CaF2 type of structure.63,64 The Pt atom is surrounded by eight M atoms, forming a cube. Filled and empty cubes are altered in a column, sharing the common faces, and such columns fill the unit cell (Fig. 1). Each M atom has four Pt nearest neighbours, forming a tetrahedron.The X-ray powder diffraction patterns confirmed the single-phase character of the prepared materials (Fig. 2), and were indexed using unit cells with lattice parameters: a (Al2Pt) = 5.9270(1) Å < a (Ga2Pt) = 5.9309(1) Å < a (In2Pt) = 6.3705(3) Å < a (Sn2Pt) = 6.4322(3) Å, following the expected trend according to the increasing atomic size of the main-group elements M (Al < Ga < In < Sn).
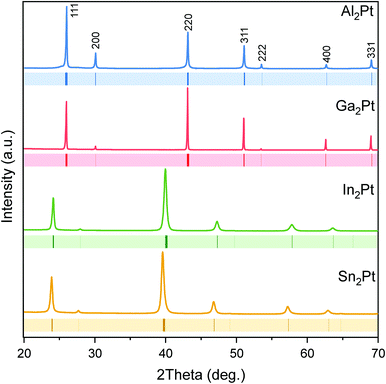 | ||
| Fig. 2 Powder X-ray diffraction patterns of the single-phase M2Pt samples. Peak positions of the isostructural M2Pt compounds65 are shown with coloured ticks below the experimental PXRD patterns. | ||
The metallographic studies confirmed the homogeneity of the samples (Fig. S1 and S2†). Interestingly, although Pt and the counterpart elements M look metallic silvery,66 the intermetallic compounds Al2Pt, Ga2Pt and In2Pt have a goldish luster,67 whereas Sn2Pt remains metallic grey. The energy dispersive X-ray spectroscopy analysis of the densified materials reveals the molar ratios of Al![[thin space (1/6-em)]](https://www.rsc.org/images/entities/char_2009.gif) :
:![[thin space (1/6-em)]](https://www.rsc.org/images/entities/char_2009.gif) Pt = 67.0(5) : 33.0, Ga
Pt = 67.0(5) : 33.0, Ga![[thin space (1/6-em)]](https://www.rsc.org/images/entities/char_2009.gif) :
:![[thin space (1/6-em)]](https://www.rsc.org/images/entities/char_2009.gif) Pt = 63.8(9) : 36.2, In
Pt = 63.8(9) : 36.2, In![[thin space (1/6-em)]](https://www.rsc.org/images/entities/char_2009.gif) :
:![[thin space (1/6-em)]](https://www.rsc.org/images/entities/char_2009.gif) Pt = 65.0(3) : 35.0 and Sn
Pt = 65.0(3) : 35.0 and Sn![[thin space (1/6-em)]](https://www.rsc.org/images/entities/char_2009.gif) :
:![[thin space (1/6-em)]](https://www.rsc.org/images/entities/char_2009.gif) Pt = 66.3(2) : 33.7 (at%), close to the intended composition M2Pt.
Pt = 66.3(2) : 33.7 (at%), close to the intended composition M2Pt.
Chemical bonding in M2Pt compounds was investigated by employing the method of position-space analysis of the electron density (ED) and the electron localizability indicator (ELI-D). The topological analysis of the electron density revealed charge transfer from M to Pt atoms for all M2Pt compounds (Table 1). In Ga2Pt, In2Pt and Sn2Pt the amount of charge transfer is practically the same and significantly smaller than that in Al2Pt. This finding agrees with the electronegativity values of the M atoms: 1.714, 2.419, 2.138 and 2.298 for M = Al, Ga, In and Sn, respectively.68 The relatively large effective charges indicate that contributions of the ionic interactions are important for the cohesiveness of the M2Pt compounds.
The topological analysis of the ELI-D fields yielded only one type of two-atom M–Pt bonds in Al2Pt, Ga2Pt and Sn2Pt. However, in In2Pt one type of three-atom In–Pt–In bonds was found (Fig. S3†). To obtain individual atom contributions to the bond electrons of a bond basin, the basin intersection technique was applied and the bond fractions for M and Pt (revealing bond polarities) were evaluated. The results show that the Pt contribution is three times that of Al in Al2Pt, but in the other M2Pt compounds the bond polarity is reversed: M atom contributions are 1.5 (Ga, In) and 2.0 (Sn) times that of Pt (Table 1). This bond polarity reversal reflects the difference between Al2Pt and the other M2Pt compounds regarding the amount of charge transfer.
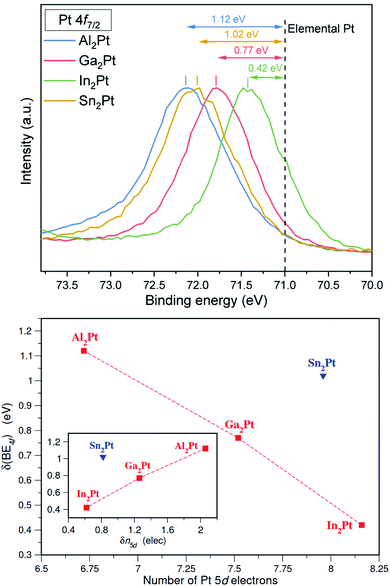
X-ray photoelectron spectroscopy (XPS) affirms the shifts of the Pt 4f core levels towards higher binding energies, i.e. by 1.12, 0.77, 0.42 and 1.02 eV for Al2Pt, Ga2Pt, In2Pt and Sn2Pt, respectively (Fig. 3). Noteworthily, for M2Pt with M from the group 13, the shift of binding energies for Pt 4f core levels increases with decreasing the atomic radii of M. The Pt 4f core level shifts of M2Pt with respect to elemental Pt were also computed by first-principles total energy calculations using the conventional cubic cell as the supercell. The experimentally observed trend for M = Al, Ga and In is well reproduced with calculated values being 1.18, 0.96 and 0.66 eV, respectively. The shift for Sn2Pt was found to be 1.25 eV, larger than that for Al2Pt. The shift to higher binding energies in M2Pt occurs together with a charge transfer from the M atoms to Pt (i.e., negatively charged Pt), a result previously observed in Be5Pt69 and Ga–Pd intermetallic compounds.70 Although the core level shifts to higher binding energies are usually associated with a positive valence state of the atom, the situation is in general more complicated.71 In addition to the charge transfer effects, the final-state screening due to conduction electrons also play an important role. However, the ELI-D analysis provides an alternative explanation for the case of M2Pt compounds based on the number of electrons in the 5d subshell. ELI-D is capable of resolving the shell structure in free atoms, meaning the ELI-D basins are organized according to the principal quantum number. This property groups the 5d electrons of Pt together with the 5s and 5p electrons. In the case of a molecule or solid, the atomic shell structure is still maintained for the core electrons, and the valence electrons form the chemical bonds as a result of atomic interactions. Consequently, Pt 5d electrons show up in the core region when the ELI-D is computed for a Pt-containing compound. Since the basins accommodating the core electrons can be obtained for each atom, the total number of core electrons for each Pt atom in a compound is available from the topological analysis of the ELI-D. A total of 68 electrons (54 up to Xe configuration plus 14 for the 4f) always belong to the core, therefore, the difference between the total number of core electrons and 68 gives the number of 5d electrons, n5d, for that Pt atom. Fig. 3 (bottom) plots the XPS Pt 4f core level shifts against n5d computed for the title compounds. A linear trend is clearly observed for M2Pt when M is a group 13 element, Al, Ga, In. Sn belonging to group 14 with a formal valence of 4+ causes Sn2Pt to be an outlier. The more electrons in the 5d subshell, the smaller the 4f core level shift is. This implies that 5d electrons play a crucial role in screening the core hole and providing the relaxation of the electronic structure after the 4f electron is ejected out of the 4f subshell. A better representation of these results can be achieved by taking the n5d obtained for elemental Pt as reference and defining
| δn5d(M2Pt) = n5d(Pt) − n5d(M2Pt), |
so that only shifts obtained with respect to the according quantity of the elemental Pt can be compared with each other. The resulting plot is presented in the inset of Fig. 3 (bottom) with the reference value n5d(Pt) being 8.78. This figure suggests that for M = Al, Ga and In, we can write δ(BE4f) ∼ δn5d, so that the shift in 5d occupancy, δn5d, may be used as a predictor of Pt 4f core level shifts.
The electronic state of Pt in the isostructural M2Pt (M = Al, Ga, In) compounds differs slightly. To clarify if this influences their electrocatalytic activity for OER, the following EC experiments were carried out: (i) cyclic voltammetry (CV) in order to monitor the possible oxidation/reduction processes and accessibility of Pt active sites on the surface, and (ii) chronopotentiometry (CP) at current density of 10 mA cm−2 for 2 h, following the conventional benchmarking protocol.44–47
The recorded cyclic voltammograms for M2Pt (M = Al, Ga, In) exhibit both oxidation and reduction features in the so-called hydrogen underpotential deposition (HUPD) region (0.05–0.4 VRHE for elemental Pt72–74), showing the reversibility of the proton adsorption process (Fig. 4). Furthermore, the areas, corresponding to the adsorption/desorption of hydrogen on Al2Pt, Ga2Pt and In2Pt electrode surfaces, increase with increasing the number of cycles (Fig. S4†). This increase is related to surface cleaning and reconstruction, leading to enhanced accessibility of Pt sites for catalysis. After fifty cycles, these areas become practically unchanged: the increase between the two last cycles is only 0.5%, 0.8% and 0.09% compared to the maximum areas for Ga2Pt, In2Pt and Sn2Pt, respectively.
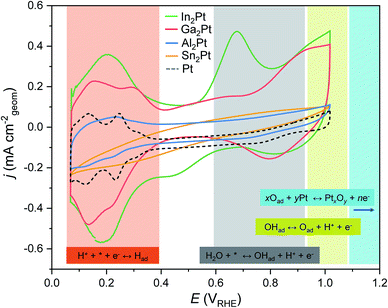 | ||
| Fig. 4 The 50th CV cycles (0.05–1.0 VRHE; 50 mV s−1) for M2Pt (M = Al, Ga, In, Sn) compounds. Shaded areas correspond to the characteristic CV regions, known for fcc Pt.74 The corresponding equations are highlighted with the same colours (* denotes the active site). | ||
Further oxidation features of M2Pt with M from the group 13 were found on the anodic scans after the HUPD region (potentials above 0.4 VRHE, Fig. 4). Contrary to the Al2Pt compound with almost unrecognizable surface oxidation, CV of In2Pt is characterized by two oxidation peaks with potential onsets at 0.55 and ca. 0.9 VRHE. They correspond to the electron transfer during the OH adsorption and its further oxidation to atomic oxygen, respectively, and resemble the behaviour of elemental Pt.74,75 For Ga2Pt only an oxidation peak around 0.9 VRHE was detected, which, most probably, coincides with OHad oxidation, whereas adsorption of OH cannot be clearly differentiated from relatively large capacitance current. Analysis of the areas below the oxidation peaks, resembling OH adsorption, shows that the surface of In2Pt is the most favourable for OH adsorption.
On the cathodic scans, the reduction peaks occur at ca. 0.8 and 0.85 VRHE for Ga2Pt and In2Pt, respectively, that are higher potentials than for metallic Pt, for which the reduction peak occurs at ca. 0.75 VRHE.20,74 The similar areas below those peaks for Ga2Pt and In2Pt (0.216 mA cm−2 V−1 and 0.218 mA cm−2 V−1, respectively), indicate that a comparable amount of species is reduced at both surfaces.
For Sn2Pt, neither hydrogen adsorption, nor surface oxidation features were observed (Fig. 4). This reveals an absence of electron transfer on the surface or that the number of electrons being transferred is not enough to differentiate these features.
It is known that transient operation is very harmful to electrode stability and leads to the dissolution even of noble metals.25,76 To monitor the possible dissolution, the ex situ elemental analysis of the HClO4 solution after the electrochemical experiments was carried out. No dissolved Pt was identified (detection limit 0.05 mg L−1) in any of the analyzed electrolyte probes. However, after CV experiment with In2Pt some amount of In (0.14 mg L−1) was detected, whereas for other M2Pt anode materials the quantities of the M component did not exceed the detection limit (0.05 mg L−1).
The detected amount of In in the electrolyte together with the OH adsorption features on the CV of In2Pt give a hint on the on-going surface processes. Upon the applied potential, the water molecules cover the surface of the anode (while protons move to the cathode) and approach both type of atoms: (i) the positively charged M form the corresponding hydroxide species, which may dissolve (this explains the pronounced peak of OH adsorption, whereas the OH reduction peak was not clearly distinguished), and (ii) the negatively charged Pt atoms, where their adsorption gives rise to the first step of the OER.8–10
Summarizing, the cyclic voltammetry in the potential range 0.05–1.0 VRHE does not cause noticeable Pt dissolution from M2Pt, however, it leads to the surface changes of the electrode materials.
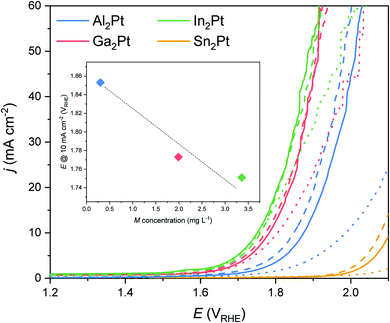
In order to estimate the OER activity, linear sweep voltammetry (LSV) was performed and the overpotential, necessary to reach the current density of 10 mA cm−2 was used as a benchmark activity marker for fundamental studies. The OER activity follows a trend In2Pt > Ga2Pt > Al2Pt, reaching 10 mA cm−2 at the overpotentials (η10) of 520, 570, 730 mV, respectively. In the case of Sn2Pt anode, current density of 10 mA cm−2 was not reached even at the maximum applied potential (Emax = 2.1 VRHE, Fig. 5). Therefore, only M2Pt compounds of Al, Ga and In can be considered as OER-active materials. It is not out of notice that the obtained η10 values are higher than those of the best Ir- and Ru-based oxide electrocatalysts (Table S1,†e.g. IrOx/SrIrO3, 270 mV;18 nanoparticulated Cr0.6Ru0.4O2, 178 mV![[thin space (1/6-em)]](https://www.rsc.org/images/entities/char_2009.gif) 19). However, η10 of elemental Pt is 745 mV,20,25,35 and the reduced overpotentials of the M2Pt (M = Al, Ga, In) compounds agree with the idea that modifying the electronic structure of Pt can improve its inherent activity. Furthermore, the OER overpotential values depend strongly on the parameters of CV pre-treatment, cf. η10 is equal to 580 mV for Al2Pt after a different pre-treatment.35
19). However, η10 of elemental Pt is 745 mV,20,25,35 and the reduced overpotentials of the M2Pt (M = Al, Ga, In) compounds agree with the idea that modifying the electronic structure of Pt can improve its inherent activity. Furthermore, the OER overpotential values depend strongly on the parameters of CV pre-treatment, cf. η10 is equal to 580 mV for Al2Pt after a different pre-treatment.35
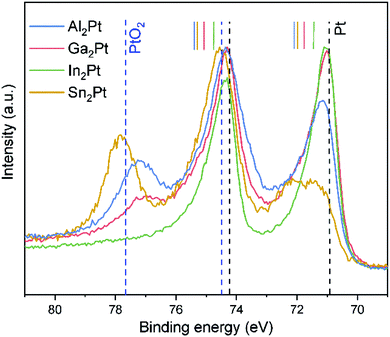
The surface changes after the CV pre-treatment were monitored by XPS. The Pt 4f core levels shift towards lower binding energies by 0.72, 0.55, 0.42 and 0.38 eV (compared to pristine M2Pt), for Al2Pt, Ga2Pt, In2Pt and Sn2Pt, respectively (Table S2 and Fig. S5†). The Pt 4f core levels become closer to that of elemental Pt, visualizing the change of Pt electronic state at the surface. The width of the XPS peaks clearly reveals a mixture, consisting of intermetallic M2Pt and freshly formed solid solution MxPt1−x with a Pt state closer to the elemental one.
To check the preservation of the OER activity over time, the chronopotentiometry (CP) study at 10 mA cm−2 was performed (Fig. S6†). The compounds Ga2Pt and In2Pt almost reach the steady-state after the first hour of CP: similar LSVs were observed after first and second hours of CP (Fig. 5). Contrary to them, Al2Pt and Sn2Pt are still activating after the second hour of the anodic treatment, meaning re-arrangements are still ongoing on their surfaces. The OER activity improves after the CP treatment for all M2Pt compounds. The following η10 values were obtained after 2 h of CP: 510 mV (In2Pt), 540 mV (Ga2Pt), 610 mV (Al2Pt) and 840 mV (Sn2Pt). No Pt was detected in the electrolytes after the complete standard OER experiments. However, measurable concentrations of Al (0.30 mg L−1), Ga (1.99 mg L−1), In (3.36 mg L−1) clearly reveal the leaching of the main-group element from the material upon anodic treatment. Noteworthy, Sn was not dissolved under such conditions. The observed trend of the dissolution rates for M2Pt (M = Al, Ga, In) correlates inversely with the computed formation energies: 0.895, 0.577, 0.448 eV per atom for Al2Pt, Ga2Pt and In2Pt, respectively (GGA calculations). Higher formation energy implies higher stability and thus lower dissolution rate. The formation energy of Sn2Pt is actually the lowest, 0.414 eV per atom, however most probably the formation of a passivating SnO2 layer on the surface prevents the leaching of Sn. Based on these results, the M2Pt (M = Al, Ga, In) compounds should be considered as precursors for formation of OER-active materials. Therefore, an understanding of their chemical behaviour under OER conditions and, as a result, the state of the freshly generated surface is of extreme importance.
One of the contributions to the improved OER activity of the M2Pt (M = Al, Ga, In) materials may be the higher dissolution rate of the main group element (In > Ga > Al > Sn), yielding more Pt on the surface accessible for adsorbents and, correspondingly, higher surface area and higher current densities can be reached at the same potential values (inset on Fig. 5). But at the same time the dissolution of the counterpart element and the restructuring of the surface give rise to a more active surface, due to the formation of the mixed spatial arrangement of the intermetallic compound and the in situ-formed active MxPt1−x phase. This agrees with additional shifts of the Pt 4f core levels on the XPS spectra for all specimens after the standard OER experiment (Fig. 6 and Table S2†). The Pt 4f core level shifts for Al2Pt and Sn2Pt with respect to elemental Pt are 0.14 and 0.36 eV, respectively. The Pf 4f core levels for Ga2Pt and In2Pt coincide with that for elemental platinum. However, these materials are more active than elemental Pt!
The (partial) dissolution of the constituent components from the anode surface is known as one of the strategies to improve the electrocatalyst performance. For example, the superior activity of IrOx/SrIrO3 originates from Sr leaching and forming of adsorption sites similar to those in IrO3 or IrO2.18 Also, the intermetallic compound Hf2B2Ir5 with a cage-like type of structure self-improves its OER activity through near-surface oxidation, including Hf leaching and the controlled dynamic in situ formation of IrOx(OH)y(SO4)z particles.77 These thoughts agree with the electrochemical results and the elemental analysis of the electrolyte (Fig. 5): higher dissolution of M (M = Al, Ga, In) seems to lead to an increased amount of in situ-formed highly active Pt on the surface and improved OER performance.
Pt oxides are present on the surfaces of Al2Pt, Ga2Pt and Sn2Pt after the standard OER experiment. The intensities of the Pt 4f core levels characteristic for PtOx, compared with the peak intensities of the intermetallic/metallic ones, follow a reversed trend with respect to the OER-activity: Sn2Pt > Al2Pt > Ga2Pt. Pt oxides are not formed on the surface of In2Pt.
The in situ-formed more active Pt species participate in two concurrent processes: (i) as active sites for OER, revealed by the activation of the material with electrochemical treatment and increasing surface area of the active sites, and (ii) in oxidation at high anodic potentials yielding the Pt oxides. This gives rise to a dynamic state of the surface, composed of the intermetallic M2Pt, freshly formed OER-active solid solution MxPt1−x and platinum oxides.
The details about the electronic and chemical states of M were obtained from XPS spectra of the corresponding core levels (Al 2s, Ga 2p, In 3d and Sn 3d, Fig. S7†). Initially, the surface of all specimens is covered by their oxides and in the cases of Ga2Pt and In2Pt also by their hydroxides Ga(OH)3 and In(OH)3, respectively. After the EC experiments, the detection of the Al 2s core level is hampered by its significantly reduced amount due to the pronounced dissolution and the small cross section of this orbital.78,79 On the other hand, the XPS spectra of Ga 2p3/2, In 3d5/2 and Sn 3d5/2 core levels clearly reveal the presence of Ga2O3, traces of Ga(OH)3, In(OH)3 and SnO2 on the M2Pt (M = Ga, In, Sn) surfaces, respectively. It is important to mention that SnO2 is well known to be electrochemically inert,80–82 and the coverage of the Sn2Pt sample by the poorly conductive SnO2 hinders the electron transfer and leads to OER inactivity of Sn2Pt.
The experimentally obtained valence bands (VB) of the initial M2Pt compounds possess similar features (Fig. 7). Their comparison with the calculated density of states (DOS) reveals the dominant contribution of the Pt 5d states (Fig. S8†). The 5d partial DOS (pDOS) curves consist of distinct peaks with relatively narrow widths emphasizing their localized or atomic-like nature. The narrow widths imply weak hybridization with the M atom p states. This feature is in line with the suggestion that the 5d electrons play a significant role in screening the core-hole effects in the Pt 4f XPS experiments. The widths of the VB (as deduced from Fig. 7) are approximately 4.0, 4.5 and 5.0 eV for In2Pt, Ga2Pt and Al2Pt, respectively. This ordering of the compounds agrees with that based on the spread of the 5d pDOS peaks. The VB width of Sn2Pt is comparable to that of In2Pt in both experiment and calculation. The catalytic activity of transition metal containing compounds is usually understood within the d-band model.83 According to this model, the closer the center of the d-band to the Fermi level, the better the activity of the compound is. The valence electrons are mainly used for forming chemical bonds in the compound, leaving the d electrons as the best means to hybridize with the electrons of the molecules to be adsorbed. Hence the features of the d-band are crucial in determining the nature of the transition metal – adsorbate interaction.84–86 The computed 5d-band centers referred to the Fermi level (set to 0 eV) are −3.39, −3.87 and −4.12 eV for In2Pt, Ga2Pt and Al2Pt, respectively, in full agreement with the observed OER activity order. The value for Sn2Pt is −4.04 eV, however its OER inactivity is largely due to the formation of a SnO2 passivation layer. This highlights the shortcomings of the d-band model which considers only the initial characteristics of the valence band; a more realistic approach should take into account the chemical state of the surface under reaction (OER, here) conditions.87,88
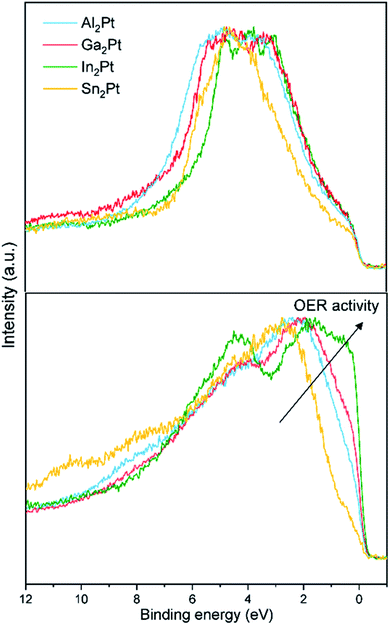 | ||
| Fig. 7 Normalized experimental XPS VBs of M2Pt (M = Al, Ga, In, Sn): as-synthesized state (top) and after the standard OER experiment (bottom). | ||
The activity is certainly influenced by the leaching of the counterpart element and formation of the Pt-rich active near-surface layer upon OER conditions. This leads to the drastic changes of the valence bands after the standard OER experiment, which resembles the density of states (DOS) of elemental Pt (Fig. 7 and S8†). The Fermi cut for In2Pt is the most pronounced, followed by Ga2Pt, Al2Pt and Sn2Pt, indicating that the conductivity of the samples also follows the mentioned order, due to the decreasing number of states at the Fermi level. This reveals the increasing amount of in situ-formed MxPt1−x (electronically close to the elemental Pt), in good agreement with the stronger leaching of the M (In > Ga > Al). The Fermi cut is another feature, which correlates well with the activity of the samples after the standard OER experiment, and follows the same trend: In2Pt > Ga2Pt > Al2Pt > Sn2Pt.
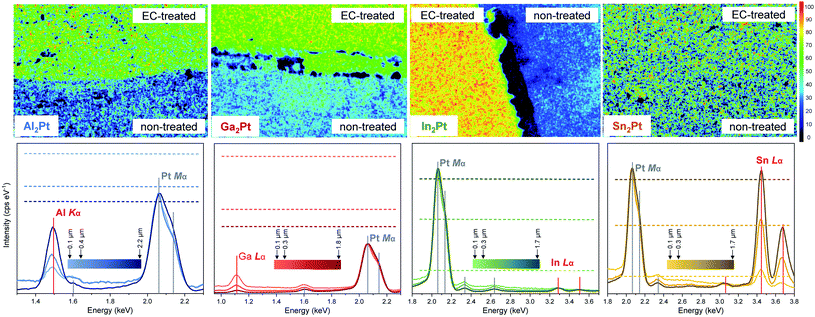
Metallographic studies reveal that the surfaces of M2Pt are still compact, meaning that the leaching takes place only in the near-surface region. The leaching is also evidenced by the mapping of the elements, showing a pronounced depletion of the EC-treated area in M (enrichment in Pt) for M2Pt (M = Al, Ga, In) compounds (Fig. 8), in agreement with ICP-OES data (see above). Quantitatively, the In2Pt material shows the most pronounced Pt enrichment of the treated area, while for Sn2Pt there is no difference in Pt content from exposed and non-exposed to electrolyte areas, which is also consistent with the fact that Sn was not found in the electrolyte after electrochemical experiments, and was present on the surface in form of SnO2.
The experimentally obtained, normalized X-ray intensities of the M2Pt samples at the acceleration voltages of 5, 10 and 27 kV after the standard OER experiment were compared with the calculated, normalized X-ray intensities of the hypothetically homogeneous M2Pt materials (Fig. 8 and Table S3†). The experimental intensities of Al Kα, Ga Lα and In Lα lines are lower than the theoretical values, proving again the reduced amount of these elements on the surfaces.
From the quantitative EDXS analysis, the measured intensity of the Al Kα line in Al2Pt reveal a gradual depletion of Al content from bulk to the near-surface regions. However, the simulated pattern shows an opposite tendency of the Al Kα line. This means that the Al dissolution overcompensates the composition-independent effect and confirms the gradual changes in concentration from the surface in contact with electrolyte towards the bulk of the material, being, however, no longer so pronounced at a depth of 2.2 μm (obtained with acceleration voltage of 27 kV). The difference between the calculated intensities and the measured ones for Ga2Pt indicates a significant dissolution of Ga into the electrolyte, which happens even at a depth of 1.8 μm (probed with acceleration voltage of 27 kV, Table S3†). Similarly, the small intensities of In Lα lines for all acceleration voltages show a pronounced depletion in In for In2Pt. The measured intensities for the Sn Lα lines are comparable with the calculated ones for all acceleration voltages, which means that the composition does not change for Sn2Pt. This agrees with the fact that no Sn or Pt was found in the electrolyte after the EC experiments with Sn2Pt.
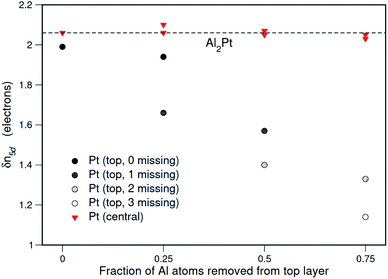
In order to have a quantum chemical insight into the possible effects of the changes in Pt environment on the Pt electronic state, the Al2Pt surfaces were investigated in detail by first-principles calculations. The surface energy calculations reveal that Al2Pt (111) surface terminated by an Al–Pt–Al composite layer is energetically the most favorable one (Fig. S9†). Hence, this surface was chosen to investigate the shift of the Pt 4f core level as Al atoms were gradually removed from the top layer to mimic the leaching process. Since the deviation of the Pt 5d occupancy in M2Pt from that in elemental Pt, δn5d(M2Pt), was found to act as a predictor of Pt 4f core level shifts, the ELI-D was calculated and analyzed to obtain the numbers of Pt 5d electrons for the Al2Pt (2 × 2) (111) surfaces with surface unit cells containing 4, 3, 2 and 1 Al atoms on the top layer. This gradual removal of the top-layer Al atoms will decrease the number of the nearest Al neighbors of the subsurface-layer Pt atoms. The variation of the calculated 5d occupancy shifts, δn5d, for the Pt atoms in the subsurface and central layers with the fraction of Al atoms removed from the top layer is shown in Fig. 9.
The Pt atoms at the center of the slab are found to behave as they do in the bulk, however the δn5d values for the subsurface Pt atoms decrease as the nearest Al neighbors are removed. Note that δn5d decreasing towards zero implies behavior becoming similar to that in elemental Pt. Also, from the inset of Fig. 3, δ(BE4f) ∼ δn5d, so it is reasonable to expect that with more Al atoms leaching the 4f core level binding energies of the Pt atoms near the surface regions will get closer to the value in elemental Pt, as was observed in the measured XPS spectra after the EC experiment.
The leaching of the main group element M, observed from ICP-OES and SEM results, leads to the change of the electronic state and coordination environment of Pt compared to that in pristine M2Pt (XPS spectra and DFT calculations). These modifications, giving rise to a mixture of Pt species at the surface, occurring during the surface restructuring upon oxidation/reduction treatment (CV) as well as within CP experiment. The compounds M2Pt (M = Al, Ga, In) play a dual role: (i) as current collectors due to their good electrical conductivity, accompanied with the bulk stability of the electrode material, and (ii) as material precursors for the formation of an MxPt1−x phase at the surface and near-surface regions, which is catalytically more active than elemental Pt.
Conclusions
Isostructural compounds M2Pt (M = Al, Ga, In, Sn) with anti-CaF2 type of crystal structure were studied as electrocatalysts for the OER. The activity follows the trend In2Pt > Ga2Pt > Al2Pt > Sn2Pt, governed by the chemical nature of the counterpart elements M (M = Al, Ga, In) and their leaching rates under OER conditions. The leaching of M into the electrolyte creates a catalytically more active surface, composed of the remaining intermetallic M2Pt and a MxPt1−x phase in the near-surface region (inferred from Pt concentration mappings and EDXS analysis as well as the shift of the Pt 4f core levels towards lower binding energies).Therefore, the improved OER activity of these materials can be assigned to the larger number of Pt atoms on the surface (acting as active sites), and the enhanced reactivity of these sites, due to the modified electronic state of Pt compared with the pristine material. In the case of Sn2Pt, the formation of SnO2 as a passivation layer hinders electron transfer and leads to the poor OER performance.
Based on the presented results, the strategy of reducing the noble metal loading via use of intermetallic compounds and combining the stability of Pt with the ability of M to leach, can be considered as a promising one for the development of new water oxidation catalysts for proton exchange membrane (PEM) electrolysis. The M2Pt compounds (M = Al, Ga, In) act as precursors for in situ formation of a dynamic surface with an electrochemically active MxPt1−x phase, while the bulk material acts as a current collector.
Conflicts of interest
There are no conflicts to declare.Acknowledgements
The authors thank Sylvia Kostmann (metallographic preparation and light microscopy), Petra Scheppan (SEM analysis), Steffen Hückmann (Guinier powder X-ray diffraction), Anja Völzke (elemental analysis via ICP-OES), Geralf Timm and Jörg Faltin (manufacturing of electrochemical equipment).Notes and references
- R. Schlögl, ChemSusChem, 2010, 3, 209–222 CrossRef PubMed.
- Z. S. Seh, J. Kibsgaard, C. F. Dickens, I. Chorkendorff, J. K. Nørskov and T. F. Jaramillo, Science, 2017, 355, eaad4998 CrossRef PubMed.
- W. Leitner, E. A. Quadrelli and R. Schlögl, Green Chem., 2017, 19, 2307–2308 RSC.
- Z. J. Schiffer and K. Manthiram, Joule, 2017, 1, 10–14 CrossRef.
- J. Masa, C. Andronescu and W. Schuhmann, Angew. Chem., Int. Ed., 2020, 59, 15298–15312 CrossRef CAS PubMed.
- K. T. Møller, T. R. Jensen, E. Akiba and H. Li, Prog. Nat. Sci., 2017, 27, 34–40 CrossRef.
- A. G. Stern, Int. J. Hydrogen Energy, 2018, 43, 4244–4255 CrossRef CAS.
- E. Guerrini and S. Trasatti, in Catalysis for Sustainable Energy Production, ed. P. Barbaro and C. Bianchini, WILEY-VCH, Weinheim, 2009, vol. 7, pp. 235–270 Search PubMed.
- T. Reier, H. N. Nong, D. Teschner, R. Schlögl and P. Strassner, Adv. Energy Mater., 2017, 7, 1601275 CrossRef.
- Electrochemical Water Splitting: Materials and Applications, ed. Inamuddin, R. Boddula, R. Mobin and A. M. Asiri, Materials Research Forum LLC, Millersville, USA, 2019 Search PubMed.
- C. Maike, M. Suermann, B. Bensmann and R. Hanke-Rauschenbach, Int. J. Hydrogen Energy, 2021, 46, 23581–23590 CrossRef.
- Y. Matsumoto and E. Sato, Mater. Chem. Phys., 1986, 14, 397–426 CrossRef CAS.
- S. Furukawa and T. Komatsu, ACS Catal., 2017, 7, 735–765 CrossRef CAS.
- M. Armbrüster, Sci. Technol. Adv. Mater., 2020, 21, 303–322 CrossRef PubMed.
- F.-Y. Chen, Z. Y. Wu, Z. Adler and H. Wang, Joule, 2021, 5, 1–28 CrossRef.
- P. J. Rheinländer and J. Durst, J. Electrochem. Soc., 2021, 168, 024511–1-15 CrossRef.
- H. Xin, A. Vojvodic, J. Voss, J. K. Nørskov and F. Abild-Pedersen, Phys. Rev. B: Condens. Matter Mater. Phys., 2014, 89, 115114 CrossRef.
- L. C. Seitz, C. F. Dickens, K. Nishio, Y. Hikita, J. Montoya, A. Doyle, C. Kirk, A. Vojvodic, H. Y. Hwang, J. K. Nørskov and T. F. Jaramillo, Science, 2016, 353, 1011–1013 CrossRef CAS PubMed.
- Y. Lin, Z. Tian, L. Zhang, J. Ma, Z. Jiang, B. J. Deibert, R. Ge and L. Chen, Nat. Commun., 2019, 10, 162 CrossRef PubMed.
- T. Reier, M. Oezaslan and P. Strasser, ACS Catal., 2012, 2, 1765–1772 CrossRef CAS.
- J. Yu, G. Yang, W. Zhou, Z. Shao and M. Ni, ACS Catal., 2019, 9, 9973–10011 CrossRef CAS.
- Z. Shi, X. Wang, J. Ge, C. Liu and W. Xing, Nanoscale, 2020, 12, 13249–13275 RSC.
- J. Rossmeisl, Z. W. Qu, H. Zhu, G. J. Kroes and J. K. Nørskov, J. Electroanal. Chem., 2007, 607, 83–89 CrossRef CAS.
- I. C. Man, H. Y. Su, F. Calle-Vallejo, H. A. Hansen, J. I. Martínez, N. G. Inoglu, J. Kitchin, T. F. Jaramillo, J. K. Nørskov and J. Rossmeisl, ChemCatChem, 2011, 3, 1159–1165 CrossRef CAS.
- S. Cherevko, A. R. Zeradjanin, A. A. Topalov, N. Kulyk, I. Katsounaros and K. J. J. Mayrhofer, ChemCatChem, 2014, 6, 2219–2223 CrossRef CAS.
- S. Cherevko, J. Electroanal. Chem., 2017, 787, 11–13 CrossRef CAS.
- J. Yi, W. H. Lee, C. H. Choi, Y. Lee, K. S. Park, B. K. Min, Y. J. Hwang and H. S. Oh, Electrochem. Commun., 2019, 104, 106469 CrossRef CAS.
- S. Choi, J. Park, M. K. Kabiraz, Y. Hong, T. Kwon, T. Kim, A. Oh, H. Baik, M. Lee, S. M. Paek, S. I. Choi and K. Lee, Adv. Funct. Mater., 2020, 30, 2003935 CrossRef CAS.
- S. Hao, Y. Wang, G. Zheng, L. Qiu, N. Xu, Y. He, L. Lei and X. Zhang, Appl. Catal., B, 2020, 226, 118643 CrossRef.
- I. M. Al-Akraa, T. Ohsaka and A. M. Mohammad, Arabian J. Chem., 2019, 12, 897–907 CrossRef CAS.
- T. Lim, M. Sung and J. Kim, Sci. Rep., 2017, 7, 15382 CrossRef PubMed.
- M. Muto, M. Nagayama, K. Sasaki and A. Hayashi, Molecules, 2020, 25, 2398 CrossRef CAS PubMed.
- J. Zhu, M. Xie, Z. Chen, Z. Lyu, M. Chi, W. Jin and Y. Xia, Adv. Energy Mater., 2020, 10, 1904114 CrossRef CAS.
- L. Röβner and M. Armbrüster, ACS Catal., 2019, 9, 2018–2062 CrossRef.
- I. Antonyshyn, A. M. Barrios Jiménez, O. Sichevych, U. Burkhardt, I. Veremchuk, M. Schmidt, A. Ormeci, I. Spanos, A. Tarasov, D. Teschner, G. Algara-Siller, R. Schlögl and Y. Grin, Angew. Chem., Int. Ed., 2020, 59, 16770–16776 CrossRef CAS PubMed.
- A. J. McAlister and D. J. Kahan, in Binary Alloy Phase Diagrams, ed. T. B. Massalski, ASM International, Materials Park, Ohio 2, 1990, vol. 1, pp. 195–197 Search PubMed.
- H. Okamoto, in Binary Alloy Phase Diagrams, ed. T. B. Massalski, ASM International, Materials Park, Ohio 2, 1990, vol. 2, pp. 1840–1842 Search PubMed.
- H. Okamoto, in Binary Alloy Phase Diagrams, ed. T. B. Massalski, ASM International, Materials Park, Ohio 2, 1990, vol. 3, pp. 2276–2278 Search PubMed.
- H. Okamoto, J. Phase Equilib. Diffus., 2003, 24, 198 CrossRef CAS.
- WinXPOW (Version 2.25), STOE and Cie GmbH, Darmstadt, Germany, 2009 Search PubMed.
- L. Akselrud and Y. Grin, J. Appl. Crystallogr., 2014, 47, 803–805 CrossRef CAS.
- A. A. Topalov, I. Katsounaros, M. Auinger, S. Cherevko, J. C. Meier, S. O. Klemm and K. J. J. Mayrhofer, Angew. Chem., Int. Ed., 2012, 51, 12613–12615 CrossRef CAS PubMed.
- A. A. Topalov, S. Cherevko, A. R. Zeradjanin, J. C. Meier, I. Katsounaros and K. J. J. Mayrhofer, Chem. Sci., 2014, 5, 631–638 RSC.
- G. Li, L. Anderson, Y. Chen, M. Pan and P. A. Chuang, Sustainable Energy Fuels, 2018, 2, 237–251 RSC.
- I. Spanos, A. A. Auer, S. Neugebauer, X. Deng, H. Tüysüz and R. Schlögl, ACS Catal., 2017, 7, 3768–3778 CrossRef CAS.
- C. C. L. McCrory, S. Jung, I. M. Ferrer, S. M. Chatman, J. C. Peters and T. F. Jaramillo, J. Am. Chem. Soc., 2015, 137, 4347–4357 CrossRef CAS PubMed.
- C. C. L. McCrory, S. Jung, J. C. Peters and T. F. Jaramillo, J. Am. Chem. Soc., 2013, 135, 16977–16987 CrossRef CAS PubMed.
- K. Koepernik and H. Eschrig, Phys. Rev. B: Condens. Matter Mater. Phys., 1999, 59, 1743–1757 CrossRef CAS.
- V. Blum, R. Gehrke, F. Hanke, P. Havu, X. Ren, K. Reuter and M. Scheffler, Comput. Phys. Commun., 2009, 180, 2175–2196 CrossRef CAS.
- J. P. Perdew and J. Wang, Phys. Rev. B: Condens. Matter Mater. Phys., 1992, 45, 13244–13249 CrossRef PubMed.
- J. P. Perdew, K. Burke and M. Ernzerhof, Phys. Rev. Lett., 1996, 77, 3865–3868 CrossRef CAS PubMed.
- F. Vines, C. Sousa and F. Illas, Phys. Chem. Chem. Phys., 2018, 20, 8403–8410 RSC.
- I. Opahle, K. Koepernik and H. Eschrig, Phys. Rev. B: Condens. Matter Mater. Phys., 1999, 60, 14035–14041 CrossRef CAS.
- H. Eschrig, M. Richter and I. Opahle, in Theoretical and Computational Chemistry, ed. P. Schwerdtfeger, Elsevier, 2004, 12, pp. 723–776 Search PubMed.
- E. Pehlke and M. Scheffler, Phys. Rev. Lett., 1993, 71, 2338–2341 CrossRef CAS PubMed.
- R. F. W. Bader, Atoms in Molecules: A Quantum Theory, Clarendon Press, Oxford, UK, 1994 Search PubMed.
- M. Kohout, Int. J. Quantum Chem., 2004, 97, 651–658 CrossRef CAS.
- M. Kohout, Faraday Discuss., 2007, 135, 43–54 RSC.
- F. R. Wagner, V. Bezugly, M. Kohout and Yu. Grin, Chem.–Eur. J., 2007, 13, 5724–5741 CrossRef CAS PubMed.
- S. A. Villaseca, A. Ormeci, S. V. Levchenko, R. Schlögl, Yu. Grin and M. Armbrüster, ChemPhysChem, 2017, 18, 334–337 CrossRef CAS PubMed.
- S. Raub and G. Jansen, Theor. Chem. Acc., 2001, 106, 223–232 Search PubMed.
- M. Kohout, Program DGrid (Version 4.6), Radebeul, Germany, 2011 Search PubMed.
- E. Zintl, A. Harder and W. Haucke, Z. Phys. Chem., Abt. B, 1937, 35, 354–362 Search PubMed.
- I. R. Harris, M. Norman and A. W. Bryant, J. Less-Common Met., 1968, 16, 427–440 CrossRef CAS.
- G. Bergerhoff and I. D. Brown, in Crystallographic Databases, ed. F. H. Allen, et al., International Union of Crystallography, Chester, 1987 Search PubMed.
- A. J. Downs, Chemistry of Aluminium, Gallium, Indium and Thallium, Blackie academic and professional, UK, 1993 Search PubMed.
- D. Swenson and B. Morosin, J. Alloys Compd., 1996, 243, 173–181 CrossRef CAS.
- R. T. Sanderson, J. Am. Chem. Soc., 1983, 105, 2259–2261 CrossRef CAS.
- A. Amon, E. Svanidze, A. Ormeci, M. König, D. Kasinathan, D. Takegami, Y. Prots, Y. F. Liao, K. D. Tsuei, L. H. Tjeng, A. Leithe-Jasper and Y. Grin, Angew. Chem., Int. Ed., 2019, 58, 15928–15933 CrossRef CAS PubMed.
- K. Kovnir, D. Teschner, M. Armbrüster, P. Schnörch, M. Hävecker, A. Knop-Gericke, Y. Grin and R. Schlögl, in BESSY Highlights 2007, ed. K. Godehusen, Berliner Elektronenspeicherring-Gesellschaft für Synchrotronstrahlung m.b.H. (BESSY), Berlin, 2008, pp. 22–23 Search PubMed.
- G. K. Wertheim, D. N. E. Buchanan and J. H. Wernick, Phys. Rev. B: Condens. Matter Mater. Phys., 1989, 40, 5319–5324 CrossRef CAS PubMed.
- A. Zolfaghari, M. Chayer and G. Jerkiewicz, J. Electrochem. Soc., 1997, 144, 3034–3041 CrossRef CAS.
- P. Daubinger, J. Kieninger, T. Unmüssig and G. A. Urban, Phys. Chem. Chem. Phys., 2014, 16, 8392–8399 RSC.
- Y. J. Deng, M. Arenz and G. K. H. Wiberg, Electrochem. Commun., 2015, 53, 41–44 CrossRef CAS.
- B. B. Berkes, G. Inzelt, W. Schuhmann and A. S. Bondarenko, J. Phys. Chem. C, 2012, 116, 10995–11003 CrossRef CAS.
- M. Łukaszewski and A. Czerwiński, J. Electroanal. Chem., 2006, 589, 38–45 CrossRef.
- A. M. Barrios Jiménez, U. Burkhardt, R. Cardoso-Gil, K. Höfer, S. G. Altendorf, R. Schlögl, Y. Grin and I. Antonyshyn, ACS Appl. Energy Mater., 2020, 3, 11042–11052 CrossRef.
- M. B. Trzhaskovskaya, V. I. Nefedov and V. G. Yarzhemsky, At. Data Nucl. Data Tables, 2001, 77, 97–159 CrossRef CAS.
- M. B. Trzhaskovskaya, V. K. Nikulin, V. I. Nefedov and V. G. Yarzhemsky, At. Data Nucl. Data Tables, 2006, 92, 245–304 CrossRef CAS.
- G. Liu, J. Xu, Y. Wang and X. Wang, J. Mater. Chem. A, 2015, 3, 20791–20800 RSC.
- H. Ohno, S. Nohara, K. Kakinuma, M. Uchida and H. Uchida, Catalysts, 2019, 9, 74 CrossRef.
- S. Abbou, R. Chattot, V. Martin, F. Claudel, L. Sola-Hernandez, C. Beauger, L. Dubau and F. Maillard, ACS Catal., 2020, 10, 7283–7294 CrossRef CAS.
- B. Hammer and J. K. Nørskov, Appl. Surf. Sci., 1995, 343, 211–220 CrossRef CAS.
- J. K. Nørskov, F. Abild-Pedersen, F. Stud and T. Bligaard, Proc. Natl. Acad. Sci. U. S. A., 2011, 108, 937–943 CrossRef PubMed.
- L. G. M. Peterson and A. Nilsson, Top. Catal., 2014, 57, 2–13 CrossRef.
- S. Bhattacharjee, U. V. Waghmare and S. C. Lee, Sci. Rep., 2016, 6, 35916 CrossRef CAS PubMed.
- X. Li, J. Zhao and D. Su, Small Struct., 2021, 2, 2100011 CrossRef.
- K. F. Kalz, R. Kraehnert, M. Dvoyashkin, R. Dittmeyer, R. Gläser, U. Krewer, K. Reuter and J.-D. Grunwaldt, ChemCatChem, 2017, 9, 17–29 CrossRef CAS PubMed.
Footnote |
| † Electronic supplementary information (ESI) available. See DOI: 10.1039/d1se01190a |
| This journal is © The Royal Society of Chemistry 2021 |

