 Open Access Article
Isomerization of glucose to fructose catalyzed by metal–organic frameworks
Marta
Lara-Serrano
 a,
Silvia
Morales-delaRosa
 *a,
Jose M.
Campos-Martin
 *a,
Víctor K.
Abdelkader-Fernández
 b,
Luís
Cunha-Silva
 b and
Salete S.
Balula
 b
b
aGrupo de Energía y Química Sostenible (EQS), Instituto de Catálisis y Petroleoquímica, CSIC, c/Marie Curie, 2 Cantoblanco, 28049 Madrid, Spain. E-mail: jm.campos@csic.es; smorales@icp.csic.es
bREQUIMTE/LAQV, Departamento de Química e Bioquímica, Faculdade de Ciências da Universidade do Porto, Rua do Campo Alegre, 4169-007 Porto, Portugal
First published on 11th June 2021
Abstract
The isomerization reaction of glucose to fructose was studied using five selected metal–organic frameworks (MOFs) as catalysts and a mixture of γ-valerolactone and 10% H2O as solvent. MOFs with different metal cations (Cr3+, Al3+, Cu2+, and Fe3+) were tested between 100 and 140 °C. The activity tests show that the MOF with chromium yields a higher amount of fructose. A comparison between MIL-101(Cr) and MIL-53(Cr) shows a higher yield of fructose with MIL-101(Cr) (23% at 140 °C) in a short reaction time, due to the higher pore size of the MOF structure. The stability of this catalyst was confirmed, and it could be recycled 5 times without a significant loss of activity and exhibited an excellent fructose yield of 23–35% after 1 h of the reaction. In this work, the superior results found are due to the large porous MIL-101(Cr) catalyst combined with aprotic solvents (γ-valerolactone−10% H2O).
Introduction
Fructose is a key intermediate derived from biomass to produce fuel and high value added chemical products. Numerous studies have revealed that it is easier to obtain 5-hydroxymethylfurfural (5-HMF) (Fig. 1), levulinic acid, lactic acid, etc. from fructose than from glucose.1–3 Nevertheless, fructose is not abundant in nature; in contrast, glucose is quite abundant. In this context, the isomerization reaction of glucose to fructose appears to be the most suitable procedure to obtain fructose. The maximum glucose-to-fructose conversion in this process is limited by the thermodynamic equilibrium between these two isomeric compounds and will strongly depend on the specific reaction temperature.2,3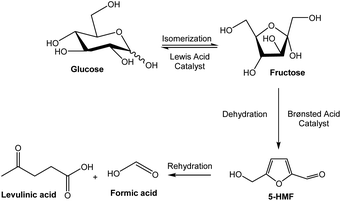 | ||
| Fig. 1 Scheme of the catalyzed isomerization and dehydration of fructose from glucose and some of the compounds obtained from fructose by acid catalysis. | ||
At present, fructose can be generated at a large scale in the production of corn syrup (HFCS), a high fructose sweetener. In this process, the reaction is catalyzed enzymatically,1,2,4 and despite the high selectivity of this reaction, several drawbacks increase processing costs, including the slow kinetics of enzymatic reactions, the use of buffering solutions to maintain pH, narrow operating temperatures, and strict feed purification requirements. For this reason, interest in the use of chemical catalysis, which can avoid these drawbacks, has grown during the last several years.
Glucose isomerization to fructose can be catalyzed by basic catalysts according to the Lobry de Bruyn–Alberda van Ekenstein reaction2,3,5–8 or by acid catalysts.1,9–12 Among the latter, special attention has been paid to the use of Lewis acid catalysts,1,9–12 such as metal chloride salts13–16 and heterogeneous zeolite-based systems modified with Sn, Ti, or Zr.9,17,18
Metal–organic frameworks (MOFs), which act as Lewis acid catalysts, are very interesting candidates. MOFs are crystalline nanostructured materials composed of metal nodes and organic linkers that present high surface areas and well-defined pore systems. Furthermore, they have numerous modifiable compositions and can be easily functionalized, making them excellent and promising materials in heterogeneous catalysis applications, such as the oxidative desulfurization of fuels,19,20 electrocatalysis,21–24 gas adsorption and separation, hydrogen storage, drug delivery25,26 and, in particular, catalytic and biomass valorization.10,27–32 A few studies have evaluated the catalytic activity of MOFs in glucose isomerization.10,33–35 But, the main effort has been devoted to modifying MOFs (via metal clusters or organic ligands) to be applied for the one-pot synthesis of 5-HMF from glucose.36–39
Apart from catalyst selection, another decisive factor in glucose-to-fructose isomerization is the employed solvent. Here, the first option is water2,7–9,18,40 due to the good solubility of sugars in it, although various other solvents have been tested to improve the reaction rate and minimize the production of secondary products, such as alcohols,5,11,41 ionic liquids,42 and polar aprotic organic solvents including N,N-dimethylformamide (DMF), dimethyl sulfoxide (DMSO), dimethylacetamide (DMA), sulfolane, γ-valerolactone, acetone, and 1,4-dioxane.4,43
This work presents a novel study on the isomerization of glucose to fructose by using five selected MOF catalysts (three MOFs synthesized, MIL-53(Cr), CuBTC, and MIL-101(Cr), and two other commercial catalysts, FeBTC, and MIL-53(Al)). The utilization of different MOF-based catalysts with diverse porosities and Lewis acid sites in the form of metal cations (Cr3+, Al3+, Cu2+, and Fe3+) has allowed us to evaluate the influence of these parameters on their catalytic activity.
Experimental
Materials: reagents and solvents
All chemicals used in MOF preparation were used as received without further purification: chromium(III) nitrate nonahydrate (Panreac, 99%), benzene-1,4-dicarboxylic acid (Aldrich, 98%), hydrofluoric acid (Aldrich 40–45%), copper nitrate (Cu(NO3)2·3H2O, AR, Damao), 1,3,5-benzenetricarboxylic acid (H3BTC, 99%, J&K), N,N-dimethylformamide (DMF, AR, Fuyu) and ethanol (EtOH, AR, Damao). Glucose, Basolite® F300 (FeBTC), Basolite® A100 (MIL-53(Al)), and γ-valerolactone (GVL, ≥99%) were acquired from Aldrich.Catalyst preparation
Physicochemical characterization
Catalysis studies
Results and discussion
This work presents a study on the isomerization of glucose to fructose by using five selected MOF catalysts (three MOFs synthesized, MIL-53(Cr), CuBTC, and MIL-101(Cr), and two other commercial catalysts, FeBTC and MIL-53(Al)). The utilization of different MOF-based catalysts with diverse porosities and Lewis acid sites in the form of metal cations (Cr3+, Al3+, Cu2+, and Fe3+) has allowed us to evaluate the influence of these parameters on their catalytic activity. These reactions will take place in a mixture of 10% H2O and γ-valerolactone (GVL).In this study, two of these MOF catalysts (MIL-53(Cr) and MIL-53(Al)) have the same structure which consists of inorganic [metal–OH] chains formed by terephthalate-based linker molecules with a similar pore size structure. The metal center (Cr or Al) is octahedrally coordinated by six oxygen atoms. Four oxygen atoms come from different carboxylate groups and the remaining two atoms belong to two different μ-OH moieties, which bridge neighboring metal center.47 The resulting structure contains one-dimensional-shaped pores. The CuBTC corresponds to the empirical formula [Cu3(BTC)2(H2O)3]n with interconnected [Cu2(O2CR)4] units (R = aromatic ring). The structure contains dimeric cupric tetracarboxylic secondary building units respectively with Cu–Cu separation. In the neutral network, twelve carboxylic oxygen atoms from the two BTC ligands are coordinated to four sites of each of the three Cu2+ ions.48 Its iron counterpart, FeBTC, is constituted by iron building units where the iron in oxidation state Fe3+ is connected with BTC linkers,49 however, the local environment around iron is still unknown. Finally, we compared the results with another MOF with a different structure and porous size, MIL-101(Cr), which is comprised of trimeric chromium(III) octahedral clusters interconnected by 1,4-benzenedicarboxylates.50 MIL-101(Cr) has a larger pore size than the other MOFs studied.
Structural characterization
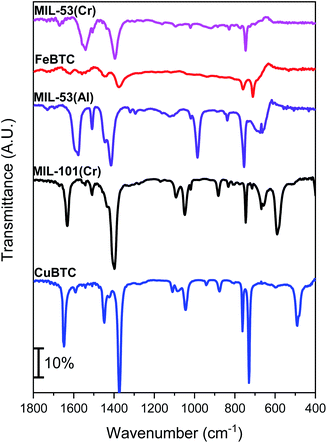
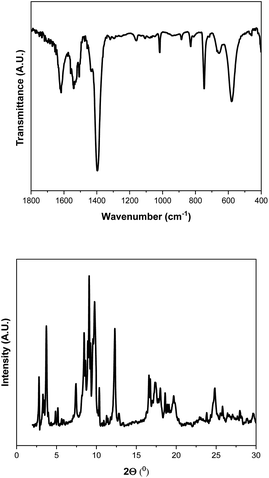
The region from 1400 to 1600 cm−1 in the ATR-FTIR spectra (Fig. 2) shows peaks attributed to the asymmetric and symmetric stretching vibration modes of the O–C–O framework. These peaks are present in all samples due to the presence of carboxylic groups in the framework links.51 The other bands between 600 and 1600 cm−1 are attributed to benzene, including the stretching vibration (C![[double bond, length as m-dash]](https://www.rsc.org/images/entities/char_e001.gif) C) at 1508 cm−1 and deformation vibrations (C–H) at 1160, 1017, 884, and 750 cm−1.52 The MOF IR spectra exhibit some peaks attributed to the presence of the different metals: the CuBTC spectrum shows a vibration peak at 730 cm−1, which might be attributed to the Cu–O stretching vibration, in which the oxygen atom is coordinated with Cu.53 The FeBTC spectrum includes a characteristic band at 1109 cm−1 related to the metalorganic group C–O–Fe.54 Regarding MIL-101(Cr), the moderate-intensity peak at 583 cm−1 can be ascribed to Cr–O stretching vibrations,55 however, it is difficult to observe in the case of MIL-53(Cr) which has a spectrum similar to its aluminum counterpart. Finally, the spectrum of MIL-53(Al) shows a broad peak between 600 and 700 cm−1 assigned to asymmetric and symmetric O–Al–O stretching vibrations.56 Thus, all characterization results indicate that the five MOF samples—prepared and commercial materials—present canonical structural arrangements corresponding to those referenced in the literature.
C) at 1508 cm−1 and deformation vibrations (C–H) at 1160, 1017, 884, and 750 cm−1.52 The MOF IR spectra exhibit some peaks attributed to the presence of the different metals: the CuBTC spectrum shows a vibration peak at 730 cm−1, which might be attributed to the Cu–O stretching vibration, in which the oxygen atom is coordinated with Cu.53 The FeBTC spectrum includes a characteristic band at 1109 cm−1 related to the metalorganic group C–O–Fe.54 Regarding MIL-101(Cr), the moderate-intensity peak at 583 cm−1 can be ascribed to Cr–O stretching vibrations,55 however, it is difficult to observe in the case of MIL-53(Cr) which has a spectrum similar to its aluminum counterpart. Finally, the spectrum of MIL-53(Al) shows a broad peak between 600 and 700 cm−1 assigned to asymmetric and symmetric O–Al–O stretching vibrations.56 Thus, all characterization results indicate that the five MOF samples—prepared and commercial materials—present canonical structural arrangements corresponding to those referenced in the literature.
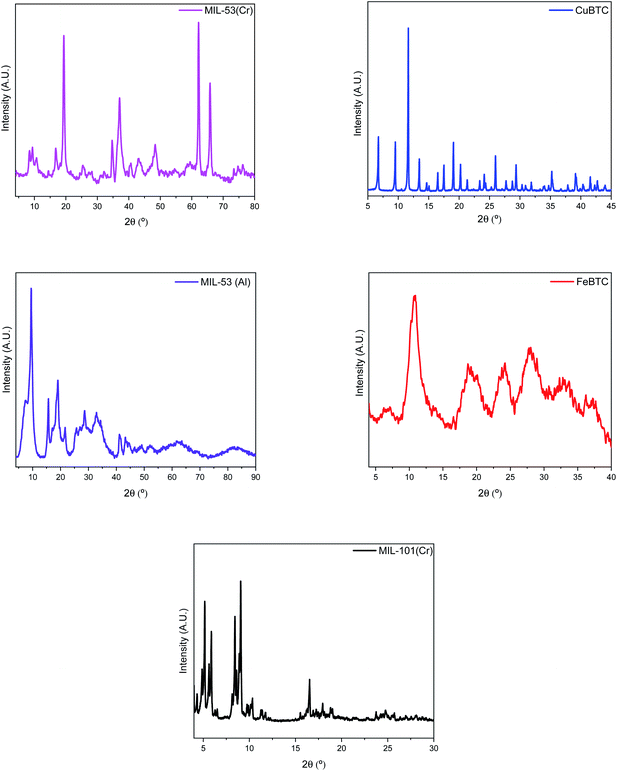
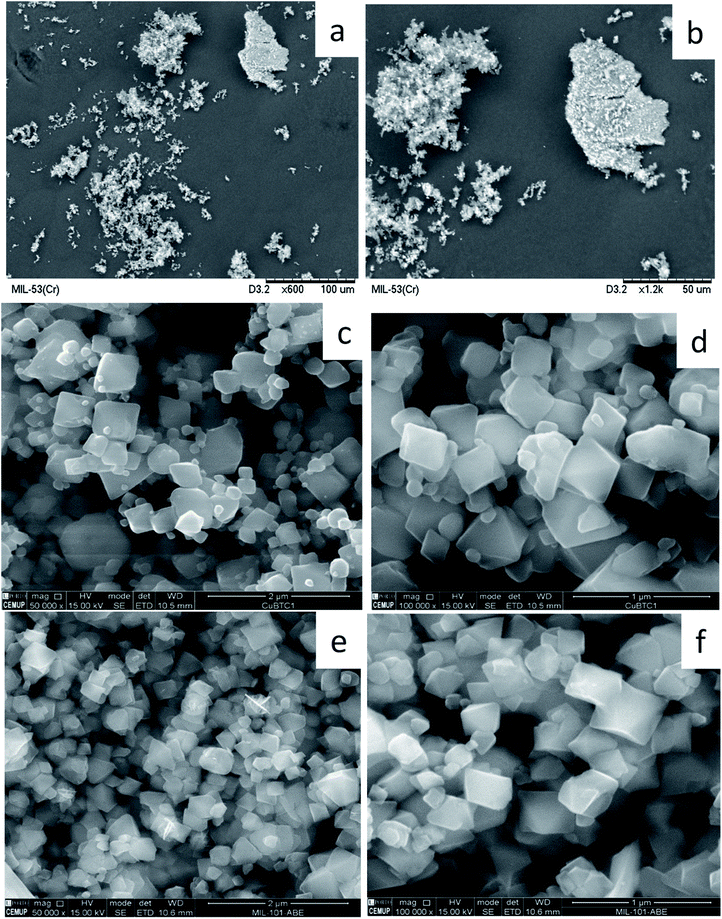
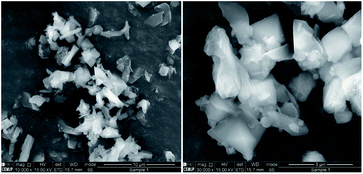
The PXRD patterns of all the MOFs studied match with those described in the literature (Fig. 3). The PXRD pattern of MIL-53(Cr) does not indicate complete crystallinity. Common peaks can be found with its chromium counterpart, MIL-101(Cr), but of low intensity. This may be due to obtaining a mixed solid between MIL-101(Cr) and MIL-53(Cr), because the synthesis method is similar except for the number of hours (24 h versus 72 h respectively) that makes the crystal change, generating MIL-53(Cr). The PXRD pattern of CuBTC uniquely exhibits the presence of the CuBTC phase, with diffraction peaks identical to those described in previous studies.57,58 Additionally, no impurities of Cu2O are detected due to the absence of its characteristic diffraction peak at 36.4°.45 The PXRD pattern of FeBTC shows peaks at Bragg angles of 10.9°, 18.8°, 24.2°, and 28.1°, which are typical of this structure.59 The low-resolution diffraction pattern of FeBTC is a consequence of the semi-amorphous nature of this material. The X-ray diffraction pattern of reference sample MIL-53(Al) is consistent with previously published powder XRD data.60 Finally, the PXRD patterns of synthesized MIL-101(Cr) presents a set of diffraction peaks at Bragg angles of 2.82°, 3.3°, 3.35°, 3.98°, 4.34°, 4.88°, 5.17°, 5.63°, 5.88°, 8.44°, and 9.62°, which corresponds to the MIL-101(Cr) framework.61 SEM analysis was performed to check the correct synthesis of prepared MOFs (Fig. 4). On the one hand, the SEM micrographs of MIL-53(Cr) (Fig. 4a and b) show crystals of different sizes and shapes that present aggregates in their structure. The SEM images of CuBTC (Fig. 4c and d) show octahedral particles with sizes in the range of 200–500 nm and some aggregates. These results show the morphology in the published SEM images.62 The SEM micrographs of the MIL-101(Cr) crystals (Fig. 4e and f) also show the presence of octahedral particles with smooth surfaces and sharp edges. However, these particles are not uniform in size, existing as diverse aggregates with sizes of approximately 120–250 nm.63
The textural parameters of the studied MOFs (Table 1) reveal large surface areas in all five cases, presenting similar values to those described in the literature. MIL-53(Cr), CuBTC, FeBTC, and MIL-53(Al) have increased and similar specific surface areas of ∼1200 m2 g−1, while the surface area of MIL-101(Cr) is the highest: 2187 m2 g−1. A similar trend is followed for the MOF pore volumes (Table 1).
| MOF | BET surface area (m2 g−1) | Pore volume (cm3 g−1) |
|---|---|---|
| MIL-53(Cr) | 1192 | 0.64 |
| CuBTC | 1277 | 0.61 |
| MIL-53(Al) | 1173 | 0.55 |
| FeBTC | 1254 | 0.55 |
| MIL-101(Cr) | 2187 | 1.15 |
These differences can be attributed to the differences in the MOF structures and channel sizes. The largest channel size is 1.2 nm for MIL-101(Cr),33 which corresponds to the largest surface area, while the channels of ∼0.9 nm for MIL-53(Cr), CuBTC, FeBTC, and MIL-53(Al)64–66 result in lower surface areas.
Catalytic activity for glucose-to-fructose isomerization
The structures described with different metal centers were tested as catalysts for the glucose isomerization to fructose process. This reaction was studied at different temperatures between 100 and 140 °C. As expected, increasing the reaction temperature clearly increases the conversion of glucose and fructose yields (Fig. 5 and 6, respectively) for all the catalysts. However, the magnitudes of the catalytic activity improvement are different for each case: MIL-53(Cr) and FeBTC being the most active catalysts while MIL-53(Al) being the least active. The glucose conversion is always lower than 40% at 100 °C for all catalysts, reaching very similar final conversion percentages in the cases of CuBTC, MIL-53(Al), and FeBTC. The increases in reaction temperature enlarged the differences between the MOF catalytic activity levels, exhibiting significant differences at 140 °C. In addition, the shapes of the conversion profiles are quite different among the catalysts employed at 140 °C.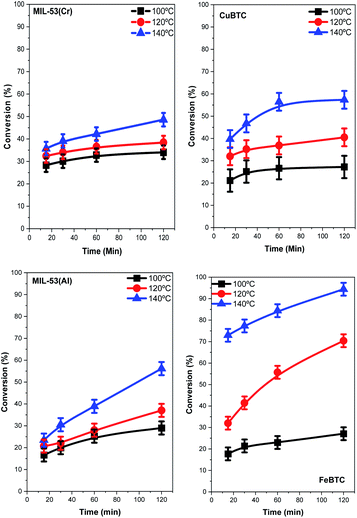 | ||
| Fig. 5 Glucose conversion versus the reaction time for the isomerization of glucose to fructose catalysed by the four MOF samples. | ||
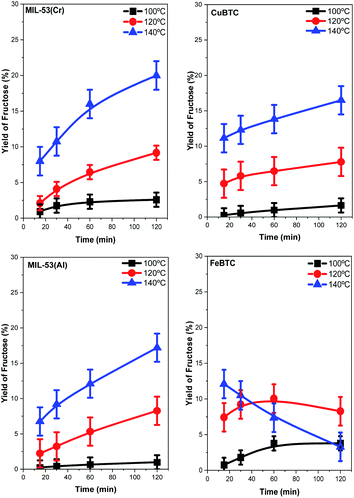 | ||
| Fig. 6 Yield of fructose obtained in the isomerization of glucose to fructose by using each MOF catalyst versus time. | ||
The conversion of glucose increases continuously with time during the whole experiment with MIL-53(Cr), MIL-53(Al), and FeBTC catalysts. Using the latter catalyst, the conversion value after the first 15 min of the reaction is already approximately 75%. In fact, the highest conversion of 93% was obtained using the FeBTC catalyst after 2 h of the reaction. The formation of fructose was investigated with a blank experiment, i.e., without the presence of a catalyst, and in this case, no fructose formed (result not shown). In the presence of MOF catalysts, fructose yields increase with increasing reaction temperature, except when using the FeBTC catalyst. Using FeBTC, a low yield of fructose is detected, especially at 140 °C (increasing from 12.5% at 15 min to 3% after 2 h), despite the high conversion obtained. FeBTC exhibits a different behavior from the other MOFs studied since its fructose yield profiles show a maximum value after the first hour of the reaction which diminished monotonically from the first to the second hour of the process. This result is in contrast with the high conversion of glucose observed.
The high conversion and low fructose yield can be related to the redox properties of Fe3+, because as has already been reported, starch, cellulose, and glucose could be oxidized to CO2 by a Fe3+ catalyst,67 and this effect is more evident at higher temperatures (140 °C). Regarding the other MOFs, the fructose yield can be related to the Lewis acid properties of the metal present in the MOF structure and their interaction with glucose; several studies have shown that chromium and aluminum salts are active in glucose isomerization, but the most active catalysts are based on chromium.13,68,69 The yield of fructose follows a trend similar to that previously observed with homogenous chloride salts in solution.14,40 The best results are shown with the MIL-53(Cr) catalysts; a 20% of fructose yield is obtained after two hours of reaction at 140 °C.
Due to the interesting activity results obtained with the MIL-53(Cr) catalyst for the isomerization of glucose to fructose, we chose to use MIL-101(Cr) in this reaction because this MOF has a larger pore size owing to its different structure. The comparison of the fructose conversion and yield is shown in Fig. 7. Both MOFs are active in the reaction. MIL-53(Cr) shows an increase of conversion with the reaction time; however, MIL-101(Cr) shows a small increase in conversion up to 30 minutes, remaining constant for long reaction times. The conversion level of MIL-101(Cr) is clearly higher than that of MIL-53(Cr). The fructose yield profiles showed a different profile between catalysts. At short reaction times, the MIL-101(Cr) catalyst shows a maximum yield of around 23% decreasing slightly at longer reaction times. However, the MIL-53(Cr) catalyst showed an increase in fructose yield with the reaction time. The formation of small amounts of anhydrofructose and anhydroglucose is detected and also the amount of 5-HMF and furfural in all cases was pretty small; then the main by-products formed in the reaction are humins.
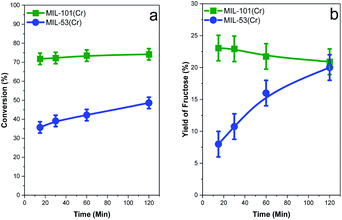 | ||
| Fig. 7 Comparison of conversion (a) and the fructose yield (b) obtained for the MIL-53(Cr) and MIL-101(Cr) catalysts at 140 °C for different reaction times. | ||
The catalytic system (catalyst and solvent) reaches high glucose conversion and fructose yield in comparison with similar catalysts, reaching similar performance to optimized Sn-containing Lewis acidic zeolites. A comparison of our results with others systems used in the bibliography is compiled in Table 2. The catalytic activity and the fructose yield obtained in this work are notably higher than the values previously reported for the same catalysts (see entries 4–7 of Table 2); in this work, very fast conversion is reached in only 15–30 min instead of the much longer 8–24 h period described in previous studies.33 These improvements must be related to the catalysts used and the selected solvents.
| Catalyst and solvent | T (°C) | Time | Glucose conv. (%) | Fructose yield (%) | Ref. |
|---|---|---|---|---|---|
| Sn-β/water | 140 | 12 h | 46 | 30 | 1 |
| Zr-MOF-808/water | 140 | 30 min | 35 | 5.4 | 35 |
| UiO-66(Zr)/water | 140 | 30 min | 20 | 7.2 | 35 |
| MIL-101(Cr) nano/water | 100 | 24 h | 46 | 25 | 10 |
| MIL-101(Cr)/water | 100 | 24 h | 22 | 12.6 | 33 |
| MIL-101(Cr)/water | 130 | 8 h | 28 | 20 | 34 |
| MIL-101(Cr)/GVL-water | 140 | 30 min | 70 | 23 | This work |
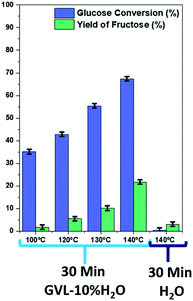
Given the results and the difficulty to compare our results with those previously published, we tested MIL-101(Cr) at different temperatures (100, 120, 130, and 140 °C) during 30 minutes of reaction using GVL-10% H2O as solvent (Fig. 8). In addition, for comparative purposes, MIL-101(Cr) was tested at 130 °C for 30 minutes but using water as a solvent. The results show that for the same reaction time, using GVL-10% H2O as solvent, glucose conversion and fructose yield increase with increasing temperature. At 130 °C, the fructose yield is about 10% in 30 minutes, indicating a higher activity than previous reports.34 The use of GVL-10% H2O as solvent enhances the catalytic activity compared to the use of only water (Fig. 8). These results show that not only the catalyst is important but also the choice of solvent is. Numerous studies have focused on glucose isomerization employing protic solvents; however, in this work, we utilized a nonprotic solvent (γ-valerolactone).
The reaction mechanism of glucose isomerization on Lewis acid sites has been studied by several authors, showing that intra-hydride transfer (C2 to C1) was the dominant reaction pathway in heterogeneous and homogenous systems.4,9,35,40 The use of protic or nonprotic solvents has a strong effect on the balance of Lewis and Brønsted acid sites in the catalyst;27 thus, protic solvents generate Brønsted acid sites due to solvent molecules being ligated to metal atoms.27 As a consequence, the use of a nonprotic solvent in this study favors the proliferation of Lewis acid sites, which are very active for the glucose isomerization reaction.
Catalyst recycling capacity
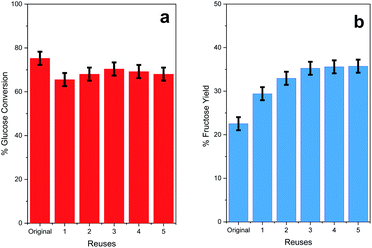
The activity results have shown that MIL-101(Cr) is the most efficient catalyst for the glucose-to-fructose isomerization reaction, with glucose conversion and fructose yield values always above 70% and 23%, respectively, at 140 °C. For this reason, the stability and the recycling capacity of MIL-101(Cr) were investigated. The catalyst was reused for five consecutive reaction cycles lasting 1 h at 140 °C (the reaction time needed to reach the maximum conversion of glucose Fig. 9a).After each cycle, the catalyst was recovered by centrifugation, and the solid obtained after the reaction was collected and washed three times in GVL-10% H2O, three times with water and once with acetone to facilitate drying. Then, it was dried at 50 °C overnight in an oven.
Although the conversion level decreases slightly from the original reaction to the first reuse cycle (Fig. 8a), this value is maintained for 5 reuse cycles. The fructose yield increases from 23 to 28% after the first reuse cycle and then becomes close to 35% in the subsequent reuses. These data indicate that MIL-101(Cr) is an effective catalyst for glucose-to-fructose isomerization and can be reused in various consecutive reactions. The catalyst MIL-101(Cr) after being reused for five catalytic cycles was characterized by PXRD, IR, and SEM, demonstrating its robustness and stability (Fig. 9 and 10). In fact, the characteristic features of the diffraction patterns and the vibrational bands of MIL-101(Cr) are present in the sample after catalytic reuse, suggesting that the global crystalline structure of the MOF material was maintained. However, some small modifications can be found in the diffraction pattern and IR spectrum (Fig. 10), and the morphology of the particles after catalytic tests (SEM images, Fig. 11) differed from the initial MOF structure (Fig. 2–4). This must be related to internal rearrangements that can occur in the MIL-101(Cr) framework after several consecutive catalytic processes and are promoted by the interactions of substrates and products with the MOF structure. The remarkable increase in the fructose yield can be related to the presence of adsorbed water in the fresh catalyst pore structure due to its substantial hygroscopic characteristic. The presence of water in the fresh catalyst was proven based on the presence of the intense band at 1610 cm−1, which is attributed to adsorbed molecular water bending (Fig. 2), and the intensity of this band is clearly reduced in the reused sample (Fig. 9). During the reaction, the catalyst undergoes a drying process due to the use of the GVL solvent; then, the water absorbed inside the catalyst is gradually removed during the reaction, and the amount of water adsorbed decreases after each reuse.
Conclusions
The catalysis of the isomerization reaction of glucose to fructose has been tested with five different MOF catalysts. We have demonstrated that these MOFs can catalyze this process in a GVL-10% H2O medium. The results found in this work indicate that MOF catalysts combined with aprotic solvents produce a high conversion of glucose and a fructose formation rate in comparison with other studies that employ water or alcohols as solvent.The activity results show that glucose conversion increases with increasing temperature for all the catalysts. In catalysts with the same structure, it is observed that FeBTC has the highest conversion (above 70%) while MIL-53(Cr) has the best fructose yield. When MIL-53(Cr) is compared to its chromium counterpart (MIL-101(Cr)) with a higher pore size, the profile shows an increase in fructose yield at early reaction times. Thus, MIL-101(Cr) is the catalyst that showed the highest fructose yield at 140 °C (∼23%) in GVL-10% H2O among the MOFs studied. The recycling capacity of MIL-101(Cr) was confirmed by performing 5 reuse reaction cycles; no significant loss in activity was observed, and the reaction with MIL-101(Cr) exhibited an increase in the fructose yield from 23 to 35% after 1 h of the reaction. The catalytic activity and yield of fructose achieved in this work are notably higher than those previously reported since we reached very high conversion and fructose yield values after 1 h of the reaction instead of the 8–24 h reaction reported in previous studies (Table 2), reaching similar performance to optimized Sn-containing Lewis acidic zeolites. The superior results found in this work are due to the large porous MIL-101(Cr) catalyst combined with aprotic solvents.
Author contributions
M. Lara-Serrano: investigation, formal analysis, and writing-original draft preparation. S. Morales-delaRosa: formal analysis, supervision, writing-reviewing, and editing. J. M. Campos-Martin: conceptualization, supervision, writing-reviewing and editing, project administration, funding acquisition. Víctor K. Abdelkader-Fernández: investigation, formal analysis. Luís Cunha-Silva: writing-reviewing and editing. Salete S. Balula: supervision, writing-reviewing, and editing, project administration, funding acquisition.Conflicts of interest
There are no conflicts to declare.Acknowledgements
This work was supported by the Comunidad de Madrid (Spain) and ERDF (European Regional Development Fund), grant number S2018/EMT-4344 (BIOTRES-CM). In addition, this work was supported by the projects REQUIMTE-LAQV (UIDB/50006/2020) and GlyGold PTDC/CTM-CTM/31983/2017 and the R&D project POCI-01-0145-FEDER-016422 – UniRCell, which was financed by national funds through the FCT/MCTES (Fundação para a Ciência e a Tecnologia/Ministerio de Ciências, Tecnologia e Ensino Superior). We acknowledge the support for the publication fee by the CSIC Open Access Publication Support Initiative through its Unit of Information Resources for Research (URICI).Notes and references
- M. Moliner, Y. Román-Leshkov and M. E. Davis, Proc. Natl. Acad. Sci. U. S. A., 2010, 107, 6164–6168 CrossRef CAS PubMed.
- A. A. Marianou, C. M. Michailof, A. Pineda, E. F. Iliopoulou, K. S. Triantafyllidis and A. A. Lappas, ChemCatChem, 2016, 8, 1100–1110 CrossRef CAS.
- A. A. Marianou, C. M. Michailof, D. K. Ipsakis, S. A. Karakoulia, K. G. Kalogiannis, H. Yiannoulakis, K. S. Triantafyllidis and A. A. Lappas, ACS Sustainable Chem. Eng., 2018, 6, 16459–16470 CrossRef CAS.
- I. Delidovich and R. Palkovits, ChemSusChem, 2016, 9, 547–561 CrossRef CAS PubMed.
- M. Yabushita, N. Shibayama, K. Nakajima and A. Fukuoka, ACS Catal., 2019, 9, 2101–2109 CrossRef CAS.
- C. Moreau, R. Durand, A. Roux and D. Tichit, Appl. Catal., A, 2000, 193, 257–264 CrossRef CAS.
- M. Ventura, J. A. Cecilia, E. Rodríguez-Castellón and M. E. Domine, Green Chem., 2020, 22, 1393–1405 RSC.
- S. S. Chen, D. C. W. Tsang and J. P. Tessonnier, Appl. Catal., B, 2020, 261, 118126 CrossRef.
- Y. Román-Leshkov, M. Moliner, J. A. Labinger and M. E. Davis, Angew. Chem., Int. Ed., 2010, 49, 8954–8957 CrossRef PubMed.
- Q. Guo, L. Ren, P. Kumar, V. J. Cybulskis, K. A. Mkhoyan, M. E. Davis and M. Tsapatsis, Angew. Chem., Int. Ed., 2018, 57, 4926–4930 CrossRef CAS PubMed.
- Y. N. Palai, A. Shrotri, M. Asakawa and A. Fukuoka, Catal. Today, 2021, 365, 241–248 CrossRef CAS.
- J. W. Harris, M. J. Cordon, J. R. Di Iorio, J. C. Vega-Vila, F. H. Ribeiro and R. Gounder, J. Catal., 2016, 335, 141–154 CrossRef CAS.
- H. Nguyen, V. Nikolakis and D. G. Vlachos, ACS Catal., 2016, 6, 1497–1504 CrossRef CAS.
- H. Zhao, J. E. Holladay, H. Brown and Z. C. Zhang, Science, 2007, 316, 1597–1600 CrossRef CAS PubMed.
- S. Hu, Z. Zhang, J. Song, Y. Zhou and B. Han, Green Chem., 2009, 11, 1746–1749 RSC.
- V. Choudhary, S. H. Mushrif, C. Ho, A. Anderko, V. Nikolakis, N. S. Marinkovic, A. I. Frenkel, S. I. Sandler and D. G. Vlachos, J. Am. Chem. Soc., 2013, 135, 3997–4006 CrossRef CAS PubMed.
- R. Gounder and M. E. Davis, J. Catal., 2013, 308, 176–188 CrossRef CAS.
- Y. P. Li, M. Head-Gordon and A. T. Bell, ACS Catal., 2014, 4, 1537–1545 CrossRef CAS.
- S. Ribeiro, A. D. S. S. Barbosa, A. C. Gomes, M. Pillinger, I. S. Gonçalves, L. Cunha-Silva and S. S. Balula, Fuel Process. Technol., 2013, 116, 350–357 CrossRef CAS.
- D. Julião, A. C. Gomes, M. Pillinger, L. Cunha-Silva, B. De Castro, I. S. Gonçalves and S. S. Balula, Fuel Process. Technol., 2015, 131, 78–86 CrossRef.
- V. K. Abdelkader-Fernández, D. M. Fernandes, S. S. Balula, L. Cunha-Silva, M. J. Pérez-Mendoza, F. J. López-Garzón, M. F. Pereira and C. Freire, ACS Appl. Energy Mater., 2019, 2, 1854–1867 CrossRef.
- C. Freire, D. M. Fernandes, M. Nunes and V. K. Abdelkader, ChemCatChem, 2018, 10, 1703–1730 CrossRef CAS.
- V. K. Abdelkader-Fernández, D. M. Fernandes, S. S. Balula, L. Cunha-Silva and C. Freire, J. Mater. Chem. A, 2020, 8, 13509–13521 RSC.
- V. K. Abdelkader-Fernández, D. M. Fernandes, S. S. Balula, L. Cunha-Silva and C. Freire, ACS Appl. Energy Mater., 2020, 3, 2925–2934 CrossRef.
- A. Kirchon, L. Feng, H. F. Drake, E. A. Joseph and H. C. Zhou, Chem. Soc. Rev., 2018, 47, 8611–8638 RSC.
- S. Yuan, L. Feng, K. Wang, J. Pang, M. Bosch, C. Lollar, Y. Sun, J. Qin, X. Yang, P. Zhang, Q. Wang, L. Zou, Y. Zhang, L. Zhang, Y. Fang, J. Li and H. C. Zhou, Adv. Mater., 2018, 30, 1704303 CrossRef PubMed.
- J. N. Hall and P. Bollini, ACS Catal., 2020, 10, 3750–3763 CrossRef CAS.
- R. Fang, A. Dhakshinamoorthy, Y. Li and H. Garcia, Chem. Soc. Rev., 2020, 49, 3638–3687 RSC.
- A. E. R. S. Khder, H. M. A. Hassan and M. S. El-Shall, Appl. Catal., A, 2014, 487, 110–118 CrossRef CAS.
- H. M. A. Hassan, M. A. Betiha, S. K. Mohamed, E. A. El-Sharkawy and E. A. Ahmed, J. Mol. Liq., 2017, 236, 385–394 CrossRef CAS.
- H. M. A. Hassan, M. A. Betiha, S. K. Mohamed, E. A. El-Sharkawy and E. A. Ahmed, Appl. Surf. Sci., 2017, 412, 394–404 CrossRef CAS.
- M. S. El-Shall, V. Abdelsayed, A. E. R. S. Khder, H. M. A. Hassan, H. M. El-Kaderi and T. E. Reich, J. Mater. Chem., 2009, 19, 7625–7631 RSC.
- G. Akiyama, R. Matsuda, H. Sato and S. Kitagawa, Chem.–Asian J., 2014, 9, 2772–2777 CrossRef CAS PubMed.
- Q. X. Luo, Y. B. Zhang, L. Qi and S. L. Scott, ChemCatChem, 2019, 11, 1903–1909 CrossRef CAS.
- S. Rojas-Buzo, A. Corma, M. Boronat and M. Moliner, ACS Sustainable Chem. Eng., 2020, 8, 16143–16155 CrossRef CAS.
- Y. Su, G. Chang, Z. Zhang, H. Xing, B. Su, Q. Yang, Q. Ren, Y. Yang and Z. Bao, AIChE J., 2016, 62, 4403–4417 CrossRef CAS.
- M. Yabushita, P. Li, T. Islamoglu, H. Kobayashi, A. Fukuoka, O. K. Farha and A. Katz, Ind. Eng. Chem. Res., 2017, 56, 7141–7148 CrossRef CAS.
- R. Oozeerally, D. L. Burnett, T. W. Chamberlain, R. I. Walton and V. Degirmenci, ChemCatChem, 2018, 10, 706–709 CrossRef CAS PubMed.
- R. Oozeerally, S. D. K. Ramkhelawan, D. L. Burnett, C. H. L. Tempelman and V. Degirmenci, Catalysts, 2019, 9, 812 CrossRef CAS.
- V. Choudhary, A. B. Pinar, R. F. Lobo, D. G. Vlachos and S. I. Sandler, ChemSusChem, 2013, 6, 2369–2376 CrossRef CAS PubMed.
- W. Deng, Q. Zhang and Y. Wang, Catal. Today, 2014, 234, 31–41 CrossRef CAS.
- E. A. Pidko, V. Degirmenci, R. A. Van Santen and E. J. M. Hensen, Angew. Chem., Int. Ed., 2010, 49, 2530–2534 CrossRef CAS PubMed.
- B. Song, Z. Wu, Y. Yu and H. Wu, Ind. Eng. Chem. Res., 2020, 59, 7336–7345 CrossRef CAS.
- L. Han, J. Zhang, Y. Mao, W. Zhou, W. Xu and Y. Sun, Ind. Eng. Chem. Res., 2019, 58, 15489–15496 CrossRef CAS.
- W. Xu, G. Li, W. Li and H. Zhang, RSC Adv., 2016, 6, 37530–37534 RSC.
- C. Férey, C. Mellot-Draznieks, C. Serre, F. Millange, J. Dutour, S. Surblé and I. Margiolaki, Science, 2005, 309, 2040–2042 CrossRef PubMed.
- F. Millange, C. Serre and G. Férey, Chem. Commun., 2002, 2, 822–823 RSC.
- A. M. P. Peedikakkal and I. H. Aljundi, ACS Omega, 2020, 5, 28493–28499 CrossRef CAS PubMed.
- L. Sciortino, A. Alessi, F. Messina, G. Buscarino and F. M. Gelardi, J. Phys. Chem. C, 2015, 119, 7826–7830 CrossRef CAS.
- S. Bhattacharjee, C. Chen and W. S. Ahn, RSC Adv., 2014, 4, 52500–52525 RSC.
- M. Meilikhov, K. Yusenko and R. Fischer, Dalton Trans., 2009, 600–602 RSC.
- Q. Liu, L. Ning, S. Zheng, M. Tao, Y. Shi and Y. He, Sci. Rep., 2013, 3, 1–6 CAS.
- N. R. Dhumal, M. P. Singh, J. A. Anderson, J. Kiefer and H. J. Kim, J. Phys. Chem. C, 2016, 120, 3295–3304 CrossRef CAS.
- F. Dorosti and A. Alizadehdakhel, Chem. Eng. Res. Des., 2018, 136, 119–128 CrossRef CAS.
- X. Huang, Q. Hu, L. Gao, Q. Hao, P. Wang and D. Qin, RSC Adv., 2018, 8, 27623–27630 RSC.
- A. E. J. Hoffman, L. Vanduyfhuys, I. Nevjestić, J. Wieme, S. M. J. Rogge, H. Depauw, P. Van Der Voort, H. Vrielinck and V. Van Speybroeck, J. Phys. Chem. C, 2018, 122, 2734–2746 CrossRef CAS PubMed.
- H. Li, M. Eddaoudi, M. O'Keeffe and O. M. Yaghi, Nature, 1999, 402, 276–279 CrossRef CAS.
- J. I. Feldblyum, M. Liu, D. W. Gidley and A. J. Matzger, J. Am. Chem. Soc., 2011, 133, 18257–18263 CrossRef CAS PubMed.
- A. Dhakshinamoorthy, M. Alvaro, P. Horcajada, E. Gibson, M. Vishnuvarthan, A. Vimont, J.-M. Grenèche, C. Serre, M. Daturi and H. Garcia, ACS Catal., 2012, 2, 2060–2065 CrossRef CAS.
- Z.-D. Tan, H.-Y. Tan, X.-Y. Shi, Z. Ji, Y.-F. Yan and Y. Zhou, Inorg. Chem. Commun., 2015, 61, 128–131 CrossRef CAS.
- A. Henschel, K. Gedrich, R. Kraehnert and S. Kaskel, Chem. Commun., 2008, 4192–4194 RSC.
- A. Maleki, B. Hayati, M. Naghizadeh and S. Joo, J. Ind. Eng. Chem., 2015, 28, 211–216 CrossRef CAS.
- X.-X. Huang, L.-G. Qiu, W. Zhang, Y.-P. Yuan, X. Jiang, A.-J. Xie, Y.-H. Shen and J.-F. Zhu, CrystEngComm, 2012, 14, 1613–1617 RSC.
- A. Vishnyakov, P. I. Ravikovitch, A. V. Neimark, M. Bülow and Q. M. Wang, Nano Lett., 2003, 3, 713–718 CrossRef CAS.
- D. T. Sun, L. Peng, W. S. Reeder, S. M. Moosavi, D. Tiana, D. K. Britt, E. Oveisi and W. L. Queen, ACS Cent. Sci., 2018, 4, 349–356 CrossRef CAS PubMed.
- S. Nießing and C. Janiak, Mol. Catal., 2019, 467, 70–77 CrossRef.
- L. Yang, W. Liu, Z. Zhang, X. Du, J. Gong, L. Dong and Y. Deng, Electrochim. Acta, 2017, 246, 1163–1173 CrossRef CAS.
- Y. Zhang, E. A. Pidko and E. J. M. Hensen, Chem.–Eur. J., 2011, 17, 5281–5288 CrossRef CAS PubMed.
- P. Wrigstedt, J. Keskiväli, M. Leskelä and T. Repo, ChemCatChem, 2015, 7, 501–507 CrossRef CAS.
| This journal is © The Royal Society of Chemistry 2021 |

