 Open Access Article
Thermal annealing effects on hydrothermally synthesized unsupported MoS2 for enhanced deoxygenation of propylguaiacol and kraft lignin†
You Wayne
Cheah
a,
Muhammad Abdus
Salam
a,
Joby
Sebastian
a,
Sreetama
Ghosh
a,
Olov
Öhrman
b,
Derek
Creaser
 a and
Louise
Olsson
 *a
*a
aCompetence Centre for Catalysis, Department of Chemical Engineering, Chalmers University of Technology, Gothenburg, 41296, Sweden. E-mail: louise.olsson@chalmers.se
bPreem AB, Sweden
First published on 14th September 2021
Abstract
Catalytic hydrodeoxygenation (HDO) is an important hydrotreating process that is used to improve the quality of bio-oils to produce biomass-derived fuel components and chemicals. Molybdenum disulfide (MoS2) has been widely used as a catalyst in hydrodesulfurization (HDS) applications for several decades, which can be further improved for effective unsupported catalyst synthesis. Herein, we studied a universally applicable post-annealing treatment to a hydrothermally synthesized MoS2 catalyst towards developing efficient unsupported catalysts for deoxygenation. The effect of the annealing treatment on the catalyst was studied and evaluated for HDO of 4-propylguaiacol (PG) at 300 °C with 50 bar H2 pressure. The annealing of the as-synthesized catalyst under nitrogen flow at 400 °C for 2 h was found to enhance the HDO activity. This enhancement is largely induced by the changes in the microstructure of MoS2 after the annealing in terms of slab length, stacking degree, defect-rich sites and the MoS2 edge-to-corner site ratio. Besides, the effect of hydrothermal synthesis time and acid addition combined with the annealing treatment on the MoS2 catalytic activity was also studied for the same model reaction. The annealed MoS2 with a synthesis time of 12 h under an acidic environment was found to have improved crystallinity and exhibit the highest deoxygenation degree among all the studied catalysts. An acidic environment during the synthesis was found to be crucial in facilitating the growth of MoS2 micelles, resulting in smaller particles that affected the HDO activity. The annealed unsupported MoS2 with the best performance for PG hydrodeoxygenation was further evaluated for the hydrotreatment of kraft lignin and demonstrated a high deoxygenation ability. The results also indicate a catalyst with high activity for deoxygenation and hydrogenation reactions can suppress char formation and favor a high lignin bio-oil yield. This research uncovers the importance of a facile pretreatment on unsupported MoS2 for achieving highly active HDO catalysts.
1. Introduction
The continuous increase in global emissions of greenhouse gases (GHG) from the burning of fossil fuels and the depleting fossil fuel reserves have prompted the search for alternative renewable fuels.1 Lignin, a complex three-dimensional biopolymer that accounts for 15–30% of the dry weight of lignocellulosic biomass is often underutilized and burnt to produce excess utility heat for the paper processing industry.2 It consists of methoxylated monolignol monomers (e.g. coniferyl, sinapyl, and p-coumaryl alcohol) that are largely linked together by different C–C and C–O bonds.3 The breakdown of these linkages is required to obtain low molecular weight compounds for further upgrading. Lignin-derived bio-oil, a potential advanced biofuel obtained from the fast pyrolysis or thermal liquefaction of lignin, can be seen as an attractive option for alternative fuels.4–6 However, the bio-oil produced using these depolymerization techniques contains a large amount of oxygenates like phenolics, alcohol, and ketone compounds that require an upgrading process for further use. The high oxygen content leads to several undesirable characteristics like low pH value, high viscosity, and low heating value as a transportation fuel.7 Hence, catalytic hydrodeoxygenation (HDO), a hydrotreating process can be adopted to remove excess oxygen in the form of water using hydrogen as a co-reactant and facilitated by the use of selective hydrotreating catalysts.8The selection of an active and selective HDO catalyst is crucial in accelerating HDO reactions. The widely used sulfided transition metal catalysts (TMS) in the hydroprocessing unit for hydrodesulfurization (HDS) and hydrodenitrogenation (HDN) appear to be transferable and applicable to the HDO technology. The sulfur content (1–2 wt%) in kraft lignin due to the pulping process can act as a poison to some catalyst systems like noble metal catalysts.9 Hence, the use of sulfur tolerant catalysts like TMS can be beneficial and relevant when applied to the hydrotreatment of kraft lignin.
The traditional TMS catalysts are the typical molybdenum sulfide catalyst supported on γ-alumina promoted by nickel (Ni) or cobalt (Co).10 Over the past few decades, the development of these supported Ni(Co)MoS hydrotreating catalysts has reached a mature stage with the possibility to enhance its performance by either replacing the alumina carrier with others such as carbon11–15 or omitting the use of a support.16 A good example of an unsupported catalyst system is the NEBULA technology that has been jointly established by ExxonMobil and Albemarle Catalysts.16,17 This commercialized and patented technology has been able to show the superior activity of the unsupported catalysts as compared to the conventional hydroprocessing catalysts.17 Another application of the unsupported hydroprocessing catalysts was the Eni Slurry Technology (EST) process.18 The EST process uses highly dispersed MoS2 nanoparticles formed by the oleo-soluble molybdenum precursor co-feeded with heavy oil feedstocks under reaction conditions of 400–450 °C and 150 bar with a continuous hydrogen flow resulting in high hydrogenation activity.18 Furthermore, the promising results were demonstrated in a recent study using unsupported Mo precursors for the co-processing of fast pyrolysis bio-oil (FPBO) with heavy fossil feedstocks in a slurry hydrocracking unit.19 Besides, it is worth mentioning that kraft lignin has a high molecular weight of typically around 16.7 kDa.20 The diffusion of huge lignin polymeric molecules through porous support materials to access the active sites of a supported catalyst poses a significant obstacle to the process. Besides, lignin reactive fragments formed by noncatalytic thermal reactions are thought to repolymerize and form char.21,22 The transport limitations caused by supported catalysts can hinder the stabilization of these intermediates by hydrogenation reactions and result in greater char formation. Therefore, the use of an unsupported catalyst with high activity seems promising for kraft lignin hydrotreatment.
There are several ways to synthesize molybdenum-based sulfide unsupported catalysts that can be employed in HDO and hydrotreatment processes. For example, Varakin et al. prepared unsupported MoS2 by the support leaching of MoS2 supported on alumina or carbon-coated alumina which gave a high yield of C18 hydrocarbon in oleic acid HDO.23 Yoosuk et al. synthesized amorphous unsupported MoS2 and CoMoS catalysts hydrothermally using ammonium tetrathiomolybdate (ATTM) as the catalyst precursor under high hydrogen pressure (28 bar) and high reaction temperature (350 °C).24 They concluded that the amorphous MoS2 was selective in cleaving the hydroxyl group in phenol via a direct-deoxygenation (DDO) route.24 Besides, Grilc et al. reported the preparation of urchin-like MoS2 and inorganic-fullerene MoS2 interconnected by carbon materials via the sulphidisation of precursors like MoI3 and cyclopentadiene–MoCl4, respectively.25 The results from their work demonstrated that both of these unsupported catalysts gave a high selectivity towards deoxygenation, and possessed a three times higher rate in dehydroxylation as compare to bulk MoS2.25 Recently, Zhang et al. reported the preparation of few-layer and defect rich MoS2 and also Co-promoted MoS2 nanosheets by a one-pot hydrothermal method.26 These reduced stacking layers and defect-rich MoS2 could accommodate Co atoms as a promoter and resulted in an active Co–Mo–S phase for p-cresol HDO under a low operation reaction temperature of 230 °C.26
Among all preparation methods, hydrothermal synthesis seems to be attractive from an industrial point of view for the preparation of unsupported MoS2, owing to the use of moderate temperature (150–250 °C) and the absence of hydrogen pressure while using ammonium molybdate as the Mo precursor.27–32 A summary of the deoxygenation application of hydrothermally synthesized unsupported metal sulfides and the main highlight of these studies is provided in Table 1. In all of these studies, the synthesized catalysts were used in the HDO reaction without any pretreatment that can enhance the HDO activity. Herein, we have explored a hydrothermal synthesis method for unsupported MoS2 catalysts inspired by several preparation methods reported elsewhere.27–29 We then also further propose an additional annealing process to be applied to the as-synthesized unsupported MoS2 that changes its structure and morphology that influences its HDO activity. To the best of our knowledge, this is the first work where the main effort has been emphasized on the pretreatment of a hydrothermally synthesized unsupported MoS2 for deoxygenation enhancement. Synthesis parameters such as the effect of synthesis time and pH adjustment during the synthesis on the morphology of MoS2 and relative HDO activity were also studied. The activity, selectivity, and effectiveness of the catalysts were first evaluated using an oxygenate model compound, 4-propylguaiacol (PG) that can be obtained from depolymerized lignin fragments. The use of PG in the model reaction has also been shown in our previous work that it is useful to demonstrate the effectiveness of the catalysts for complex lignin hydrotreatment.33 Hence the catalytic hydrotreatment of kraft lignin was studied using the unsupported MoS2 showing the best performance for HDO of PG. The comparison between the commercially available bulk MoS2 and MoS2 synthesized in this work was made for the HDO of PG and kraft lignin. Besides, the synthesized and annealed unsupported MoS2 catalysts were characterized in detail by N2 physisorption, X-ray diffraction (XRD), X-ray photoelectron spectroscopy (XPS), Raman spectroscopy, high-resolution transmission electron microscope (HRTEM), and scanning electron microscopy (SEM) to discover relations between resulting properties of the materials and their catalytic performance. Our research is foreseen to contribute towards a better understanding of the role of a post-thermal annealing treatment on the unsupported MoS2 for developing highly robust HDO catalysts.
| Unsupported catalysts | Application | Highlights | Ref. |
|---|---|---|---|
| CoMo sulfide and MoS2 | p-Cresol hydrodeoxygenation | -Reduced stacking of MoS2 layers and increased defect sites on basal planes formed more coordinatively unsaturated sites (CUS) to accommodate promoter atoms | 26 |
| Co-doped nano sized MoS2 | p-Cresol hydrodeoxygenation | -Highly dispersed MoS2 with abundance of defects and curvy slabs are important features to produce high density of CUS sites and for anchoring Co atoms | 30 |
| -Molar ratio of 0.3 for Co/(Co + Mo) gives almost complete p-cresol conversion and 98.9% toluene selectivity | |||
| Ni–Mo sulfides | Palm oil hydrotreating | -Molar ratio of 0.2 for Ni/(Ni + Mo) shows good HDO performance and good recyclability | 48 |
| -The incorporation of Ni promoter increased the stacking and layers numbers which also contributed to the increase in the rim and edge sites that is the active site for the hydrogenation reaction | |||
| Unsupported and supported CoMoS | Waste cooking oil (WCO) hydrotreating | -Unsupported metal sulfides give a higher degree of polymerization due to the lack of acidic sites (absence of catalyst support) | 31 |
| -Increased reaction temperature improved deoxygenation, and enhanced the cracking and polymerization degree for unsupported catalyst | |||
| NiMo and CoMo sulfides | Oleic acid and palmitic hydrodeoxygenation | -Ni promoter decreased the Ni–Mo–S bond strength leading to the formation of CUS on the edges of the MoS2 slabs | 49 |
| -Hydrothermal synthesis of MoS2 resulted in the bent and folded multi-layered structure of the catalyst | |||
| CoMoS | p-Cresol hydrodeoxygenation | -Optimal hydrothermal temperature is 200 °C | 27 |
| -The concentration of Co promoters affects the catalysts surface area, stacking numbers, and also MoS2 slab length | |||
| -Increased Co amount hindered and inhibited the MoS2 growth and caused aggregation of CoS2 which reduced MoS2 dispersion yielding longer slabs | |||
| Ni–Mo–W sulfides | p-Cresol hydrodeoxygenation | -Molar ratio of 0.5 for W/Mo gives the highest HDO performance | 32 |
| -Optimum molar ratio for W/Mo resulted in the shortest average MoS2 slab length and improved dispersion | |||
| MoS2 and CoMoS2 | Phenol hydrodeoxygenation | -Amorphous and highly bent MoS2 with multi-layered structure was more active than the crystalline sample | 24 |
| -Addition of Co changes the textural properties of the catalysts giving reduced specific surface area and shifted the pore-size distribution to smaller pore sizes | |||
| NiMo sulfides | Phenol hydrodeoxygenation | -HDO activity depends largely on the sulfide's morphology but not the catalysts surface area | 50 |
| -Low layer number in the MoS2 stack and/or shorter slabs could give higher hydrogenation-dehydration (HYD) activity |
2. Experimental
2.1 Catalyst synthesis
The unsupported MoS2 catalysts were prepared starting from a simple hydrothermal method following various works from Wang et al.27,29 incorporating certain modifications in the synthesis steps. 0.35 g of ammonium heptamolybdate tetrahydrate (>99%) and 1.3 g of thiourea (>99%) were both dissolved in 55 ml of distilled water with gentle stirring. The pH of the solution was adjusted to 0.8 using hydrochloric acid (35 wt%). For one catalyst sample, this pH adjustment step was omitted to evaluate its effect on the catalyst properties. The mixed solution was divided equally and transferred to a 70 ml Teflon liner. The filled Teflon liner was placed and sealed in a stainless-steel autoclave. The mixed solution was heated at 200 °C for either 12 h or 24 h. The synthesized catalyst was then filtered and washed with absolute ethanol several times. The filtered and washed catalyst was dried under vacuum at 50 °C overnight. These as-synthesized catalysts were tested without any pretreatment in the model reaction. The as-synthesized catalysts with synthesis times of 12 h and 24 h will be referred to as MoS2-12 and MoS2-24, respectively. The dried as-synthesized catalysts were further annealed at 400 °C for 2 h under nitrogen flow before their evaluation in the model reaction. These annealed catalysts with 12 h and 24 h synthesis time will be denoted as MoS2-12a and MoS2-24a. Bulk MoS2 (Sigma-Aldrich) in powdered form with a particle size of ∼6 μm (max. 40 μm) was used in the current work for comparison with our in-house synthesized MoS2. Alumina-supported MoS2 (13.2 wt% Mo loading) catalyst was also prepared according to the procedure reported by our group earlier34 for comparison in this work.2.2 Characterization of unsupported MoS2
The specific surface area of the catalyst was measured by N2 physisorption at −196 °C using a TriStar 3000 gas adsorption–desorption analyzer. The catalysts were degassed at 300 °C under nitrogen flow overnight before every measurement for drying purposes. The Brunauer–Emmett–Teller (BET) method was used to calculate the surface areas and the pore sizes were estimated by the Barrett–Joyner–Halenda (BJH) method. XRD measurement was performed using an X-ray powder diffractometer operated at 40 kV and 40 mA (Bruker AXSD8 Advance) with a CuKα monochromatic radiation (λ = 1.542 Å) source in the 2θ range of 10–80°. XPS measurements were carried out using a PerkinElmer PHI 5000 VersaProbe III Scanning XPS Microprobe. The monochromatic Al-Kα X-ray source with a binding energy of 1486.6 eV was operated in the analysis chamber. The core-level spectra of Mo 3d, O 1s, S 2p, and C 1s were recorded with a step size of 0.1 eV. The raw data was then analyzed using a Shirley background using the software Casa XPS with the C 1s binding energy at 284.8 eV as a reference. The Raman spectra were recorded using a WITec alpha300 R confocal Raman microscope equipped with a thermoelectrically cooled (−60 °C) EMCCD detector. A 532 nm CW diod laser at 0.3 mW was used for excitation and the light was focused on the sample using a 100X/NA0.9 objective. The Raman scattering was collected using the same objective and was spectrally resolved using an 1800 groves per nm grating. Calibration was performed on the position of the Raman spectra bands using the silicon peak at 519.3 nm. The morphologies and structure of the catalysts were obtained by HRTEM on an FEI Titan 80-300 TEM operated at 300 kV equipped with a high angle annular dark-field (HAADF) detector. SEM was performed on a JEOL 7800F Prime to acquire the morphology of the catalysts. The particle diameter of over two hundred MoS2 particles from the SEM images was measured by ImageJ software and used to obtain average particle sizes.Quantitative and statistical analyses were performed based on 15–20 representative TEM images taken from different regions of each catalyst. Approximately 500–550 MoS2 slabs were measured and processed by ImageJ software to calculate the average MoS2 slab length (ΔL) and stacking number (Δn) using the following equations:33
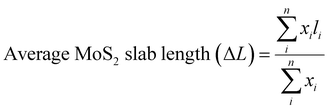 | (1) |
 | (2) |
Moreover, the MoS2 dispersion (fmo) was calculated with the following equation reported in the literature:35
 | (3) |
The edge-to-corner ratio of MoS2 slabs was calculated based on the following equation:36
 | (4) |
2.3 Catalytic test for HDO of 4-propylguaiacol (PG)
The catalytic activity was measured using a 300 ml Parr batch reactor. In a typical catalytic test, 66 mg of as-synthesized or annealed unsupported catalyst, 1 g of 4-propylguaiacol, 100 ml of dodecane as the solvent, and 0.5 ml of dimethyl disulfide (DMDS) were loaded into the reactor. The reactor was sealed and first purged three times with N2 and then followed by H2. The reactor system was then pressurized to 20 bar of H2 at room temperature and checked for any leaks. After the leak check, the system was depressurized to 0.1 bar gauge and further heated to a final temperature of 300 °C. It took 25 minutes to reach desired temperature. When the reaction temperature has reached, additional hydrogen was introduced and this point was regarded as the start of the reaction. Reaction conditions for all PG HDO experiments were kept constant at 50 bar H2, 300 °C, and 1000 rpm for 5 h. All reaction conditions were strictly kept constant during the evaluation of catalytic activities to ensure comparable kinetic results. Reaction liquid product samples were collected every hour during 5 h for further analysis. The withdrawal of the reaction sample caused a drop of ca. 1 bar in the reactor which was compensated by repressurizing to 50 bar with hydrogen. The reaction was stopped after 5 h by cooling the reactor with water cooling, followed by releasing the reactor pressure. After pressure release, the reactor was purged with N2 before opening. The remaining reaction medium was centrifuged to collect all used catalysts. The used catalyst was washed with absolute ethanol several times and dried in an oven at 80 °C overnight.The PG conversion (CPG), product yield (Yproduct), and selectivity (Sproduct) at varying times were calculated based on the following expressions:
 | (5) |
 | (6) |
 | (7) |
The units for the yields of reactants and products are expressed as molar percent (mol %). The molar balance for the reaction was assessed by calculating the material balance in the liquid phase. The molar balance was calculated by dividing the summation of the concentration of all identified products by the concentration of the initial PG concentration loaded in the reactor. The calculation is based on the observation that all products detected in the reaction samples retained the six-carbon ring structure of PG. The carbon balance for the liquid phase analysis was found to be ranged over 95–99% for all experiments.
2.4 Hydrotreatment of kraft lignin
The hydrotreatment reaction was carried out in the 300 ml Parr reactor system, the same as that used for the model reaction. Before starting the reaction, the reaction vessel was loaded with 0.75 g of catalysts, 2.25 g of kraft lignin (Sigma Aldrich), and 75 ml of hexadecane as a solvent. The composition of kraft lignin was analyzed by ICP and elemental analysis results are presented in Fig. S1 and Table S1.† The reactor was then sealed and purged with nitrogen three times to remove oxygen traces. The reactor was then pressurized to 40 bar H2 at room temperature and monitored for leaks during 20 minutes. After a passed leak test, the reaction temperature was set to 340 °C and it took 40 minutes to reach the desired temperature. The stirring rate was set at 1000 rpm when the heating was started. Reaction time zero was recorded once the reaction temperature reached the desired temperature and the reaction was monitored for 5 h with continuous stirring of 1000 rpm. The reactor pressure immediately after reaching 340 °C was 73–76 bar depending on the type of catalyst used in the experiment. The pressure decreased by 1–3 bar to 70–73 bar during the course of the reaction (5 h). After the reaction was completed, all reaction products in liquid form and solid residues in the reaction vessel were collected in a glass bottle for product analysis. The solid residues retained in the reaction medium after the hydrotreatment were obtained by filtering the bio-liquid. The solid residues were washed first with acetone and then dried in an oven at 80 °C overnight. The unconverted lignin retained in the dried solid was dissolved by dimethyl sulfoxide (DMSO) washing. After dissolving the unconverted lignin with DMSO, the solid product was dried again in an oven at 80 °C overnight.The initial solid residues obtained after filtration should contain spent catalyst, solid char, and unconverted lignin. The weight of the solid was recorded after each drying.
Kraft lignin conversion (Ckraft lignin) was calculated based on the following equation:
The amount and yield of solid char were calculated by the following equations:
| Char amount (g) = total solid residues (g) − 0.75 g of catalyst − unconverted lignin (g) |
| Char yield (%) = char amount (g)/2.25 g of initial kraft lignin feed × 100% |
Individual product selectivity in the bio-liquid were calculated by dividing the corresponding FID peak area of the product by the total FID peak area for all identifiable products in the bio-liquids.
2.5 Product analysis for model compound and kraft lignin hydrotreatment
The reaction products collected during the catalytic reaction for HDO of PG were analyzed by GC-MS (Agilent 7890-5977A, Agilent). The GC was equipped with an HP-5 column (30 m × 250 μm × 0.25 μm), and the injector temperature was kept at 325 °C. The initial oven temperature was 100 °C for 1 minute and then heated to 190 °C at a rate of 10 °C min−1. The heating continued to 300 °C with a ramp of 30 °C min−1 and the final temperature was maintained for 80 s.The bio-liquid products collected after the catalytic hydrotreatment of kraft lignin were analyzed by GC-MS (Agilent 7890-5977A, Agilent). The GC was equipped with an HP-5 column (30 m × 250 μm × 0.25 μm), and the injector temperature was kept at 325 °C. The initial oven temperature was 50 °C for 5 minutes and then heated to 300 °C at a rate of 10 °C min−1. After which the final temperature was maintained constant for 5 minutes.
The bio-liquid products were also analyzed by two-dimensional GC × GC-MS-FID on an Agilent 7890B gas chromatograph equipped with an oven, a flow splitter, a modulator, and a flame ionization detector. The injector temperature was 280 °C and the sample injection volume was 1 μL. Helium gas was used as a carrier gas with a flow rate of 1 ml min−1 with a split ratio of 30. The chromatographic separation involves two columns: a mid-polar phase column VF-1701 MS (30 m × 250 μm × 0.25 μm) and a non-polar phase column DB-5MS UI (1.2 m × 150 μm × 0.15 μm). Modulation time on the modulator is 8 s. The oven temperature was initially set at 40 °C for 1 min and then heated up to 280 °C at a rate of 2 °C min−1. The flame ionization detector temperature was set at 250 °C. The analysis was performed using the GCImage software for multidimensional chromatography.
3. Results and discussion
3.1 Catalyst characterization
Table 2 lists the specific surface area, pore-volume, and pore size of the unsupported MoS2 catalysts in this study, and a bulk MoS2 sample. The specific surface area decreased in the order: MoS2-24a > MoS2-12a > MoS2-24 > MoS2-12 > bulk MoS2. The results suggested that prolonging the synthesis time has a negligible effect on the specific surface area of the synthesized catalyst with MoS2-24 being 16.2 m2 g−1 while MoS2-12 was 15.4 m2 g−1. However, the specific surface area of the annealed samples of MoS2-12a and MoS2-24a were 27.8 m2 g−1 and 37.1 m2 g−1, respectively. The N2 adsorption–desorption isotherms for all studied catalysts are shown in Fig. S2.† The isotherms for the annealed MoS2 catalysts can be characterized as type IV isotherms following the IUPAC classification.37 A prominent H3 type hysteresis loop can also be observed for both annealed MoS2 samples, featuring slit-shaped pores created by the build-up of MoS2 layers. While for the as-synthesized and bulk MoS2, type II isotherms can be identified that are distinctive of material with a non-porous character. The observation can be explained by the agglomeration of particles forming larger lumped particles with reduced porosity as will be evident from the SEM images (discussed later in this section). The larger pore size exhibited by the MoS2-24 also indicates that prolonging the synthesis time resulted in a mixture of large and small particles forming larger cavities. While the results also showed that the annealing process significantly increased the specific surface area and porosity of the unsupported catalysts. It is important to highlight that this porosity was created by the shrinkage of particles during annealing and during the formation of MoS2 crystals (evident from XRD analysis, discussed later in this section), they were re-coordinated and agglomerated to generate cavities. It is also worth noting that MoS2-12a has the highest pore volume and the smallest pore size among all unsupported catalysts.| Catalysts | Surface area (m2 g−1) | Pore volume (cm3 g−1) | Pore size (Å) | Average MoS2 slab length (ΔL) | Average stacking number (Δn) | MoS2 dispersion (fmo) | Edge-to-corner ratio of MoS2 slabs |
|---|---|---|---|---|---|---|---|
| MoS2-12 | 15.4 | 0.34 | 108 | 5.07 | 4.01 | 0.150 | 6.42 |
| MoS2-12a | 27.8 | 0.60 | 83.8 | 8.41 | 2.72 | 0.103 | 11.6 |
| MoS2-24 | 16.2 | 0.13 | 317 | 6.58 | 3.26 | 0.130 | 8.78 |
| MoS2-24a | 37.1 | 0.11 | 105 | 8.71 | 3.85 | 0.105 | 12.1 |
| Bulk MoS2 | 4.70 | 0.03 | 177 | — | — | — | — |
The X-ray diffraction (XRD) patterns for all MoS2 unsupported catalysts are shown in (Fig. 1a) indicating the crystallinity and phase purity of the MoS2 catalysts. As can be observed from the XRD patterns, the as-synthesized samples showed a very low crystallinity with a small peak at 2θ = 14° indicating the typical (0 0 2) plane of hexagonal MoS2. The results confirmed that doubling the synthesis time from 12 h to 24 h did not improve the crystallinity of the samples. On the other hand, for both the annealed MoS2 samples, prominent peaks can be observed at 2θ = 14°, 33°, 39°, and 59° attributed to the (002), (100), (103) and (110) planes of MoS2.38 The increase in the crystallinity of the as-synthesized MoS2 after a simple annealing treatment suggests that the annealing process at 400 °C for 2 h can promote the growth of MoS2 crystals. In comparison, the bulk MoS2 is highly crystalline as can be observed from the XRD pattern.
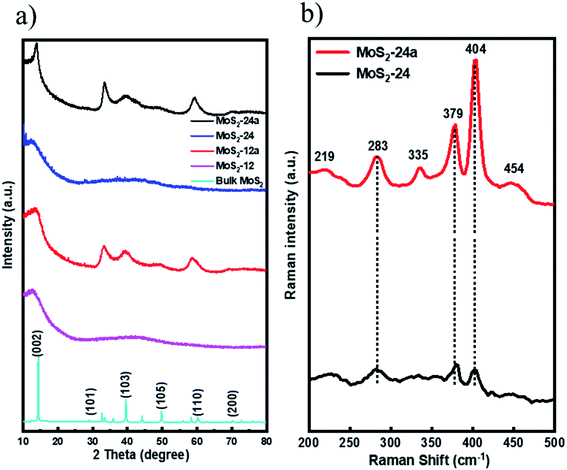 | ||
| Fig. 1 (a) XRD patterns for MoS2-12, MoS2-12a, MoS2-24, MoS2-24a and bulk MoS2 and (b) Raman spectra for MoS2-24 and MoS2-24a catalysts. | ||
Additionally, Raman spectroscopy was performed to corroborate with XRD patterns and at the same time, to study the chemical state of the as-synthesized and annealed catalysts. The Raman spectrum of MoS2-24 and MoS2-24a were obtained and the results are presented in (Fig. 1b). For MoS2-24a catalysts, four main Raman peaks located at 379 cm−1 (E12g), 404 cm−1 (A1g), 283 cm−1 (E1g), and 454 cm−1 (E1g) indicate that the usual 2H–MoS2 phase can be observed.39 Moreover, two low-intensity Raman peaks at 219 cm−1 and 335 cm−1 can be identified in the spectra for MoS2-24a proving the existence of the 1T phase of MoS2.39 The results indicate that the annealing pre-treatment changes the structure of the as-synthesized catalysts and resulted in mixed 1T and 2H phases of MoS2. In contrast, for MoS2-24 catalysts, three peaks can be identified as shown in (Fig. 1b) with a relatively lower intensity showing the lower crystallinity of the as-synthesized catalyst.
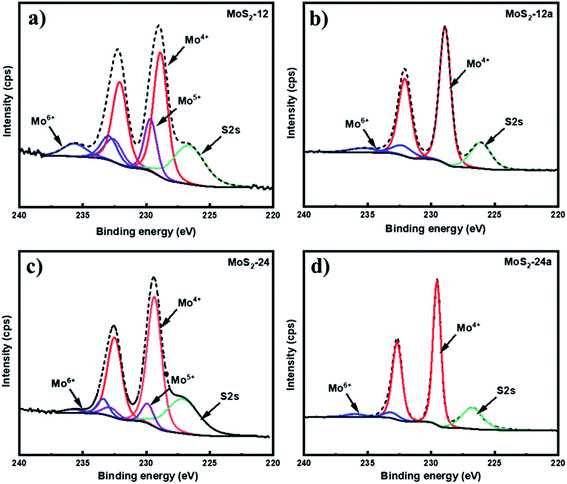
X-ray photoelectron spectroscopy (XPS) was carried out to determine the chemical state and composition of the unsupported MoS2 catalysts before and after the annealing treatment (Fig. 2). The Mo 3d spectrum in (Fig. 2a and c) were deconvoluted into three Mo 3d5/2–Mo 3d3/2 doublets for the as-synthesized samples. Two characteristic peaks at 229.3 eV and 232.5 eV binding energies correspond to the presence of the Mo4+ oxidation state, indicating the MoS2 species.40 For the Mo5+ oxidation state, characteristic peaks at binding energies 230.0 eV and 233.0 eV can be identified, which demonstrate the presence of intermediate oxysulfide species (MoOxSy) in the as-synthesized catalysts.41 An additional doublet at 233.4 eV and 235.8 eV associated with the Mo6+ oxidation state which is associated with the MoO3 species can be found.42Table 3 reports the Mo 3d composition of the Mo states obtained from the XPS data. It can be noticed that the sulfidation degree based on the Mo4+ content increased for both annealed MoS2 as compared to the as-synthesized unsupported catalysts with MoS2-24a having the highest degree and corresponding lowest degree of oxidation of Mo. The presence of oxysulfide species in the as-synthesized catalysts can be explained by one of the reactions that are expected to occur during the synthesis of MoS2, where the (NH4)6Mo7O24 reacts with H2S forming MoOxSy, ammonia, and water. However, the oxysulfide species were not observed for both annealed catalysts. This result suggests that the MoOxSy phase may have been completely converted into MoS3 and the annealing pretreatment can further facilitate the thermal decomposition of MoS3 to MoS2.
| Catalyst | Mo 3d composition (area %) | ||
|---|---|---|---|
| Mo4+ | Mo5+ | Mo6+ | |
| MoS2-12 | 62.9 | 22.2 | 14.9 |
| MoS2-12a | 88.6 | — | 11.4 |
| MoS2-24 | 82.9 | 11.3 | 5.8 |
| MoS2-24a | 93.1 | — | 6.9 |
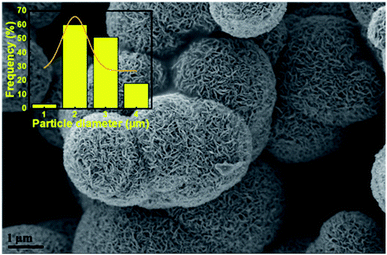
The morphologies of the unsupported catalysts in this study (Fig. 3) were examined by scanning electron microscopy (SEM). Spherical particle agglomerates can be observed in the SEM images which are due to the laminar growth of the MoS2 during hydrothermal synthesis. The average particle diameter was measured based on the SEM images using ImageJ software and the distribution of the particle size is shown in the insets of Fig. 3. As can be seen in Fig. 3e and f, the MoS2-24 catalyst, consists of a mixture of larger and smaller particles with an average particle diameter of 305 nm. A similar morphology can also be observed for MoS2-12 (Fig. 3a and b). While for the MoS2-24a catalyst, the SEM images revealed that the MoS2 particles dispersed and distributed more uniformly with a smaller average particle diameter of 190 nm. A more defined morphology can also be observed in the annealed catalysts. The result suggested that the annealing treatment resulted in a reduction of particle diameter and a narrower size distribution of particles. To evaluate the influence of the pH adjustment on the morphology of MoS2, a batch of unsupported MoS2 was prepared following the same procedure, excluding the pH adjustment as described in the experimental section. The following batch was then examined by SEM and resulted in Fig. 4. A sharper and apparent flower-like morphology can be observed in the SEM image with a larger average particle diameter of 2 μm. Interestingly, this is almost the average particle size for the bulk MoS2 sample (6 μm, max 40 μm). The results presented here are in line with the findings from Zhang et al.43 The pH adjustment step in the catalyst synthesis was crucial to enhance the growth of MoS2 micelles that eventually formed smaller crystallites in the MoS2 catalysts. While the MoS2 prepared without acid addition resulted in a larger particle size.
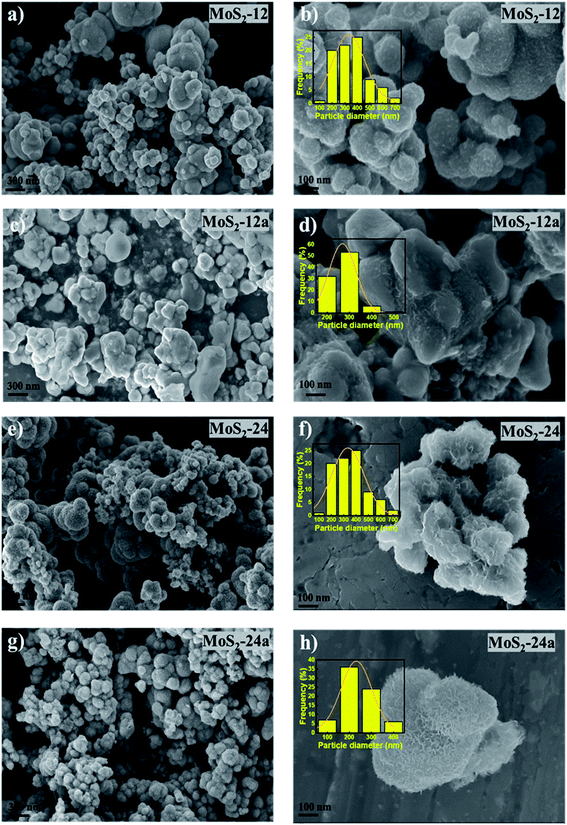 | ||
| Fig. 3 SEM images of (a and b) MoS2-12, (c and d) MoS2-12a, (e and f) MoS2-24, and (g and h) MoS2-24a. | ||
High-resolution transmission electron microscopy (HRTEM) was also performed to understand the effect of annealing on the structure of the unsupported catalyst, and the images are presented in Fig. 5. The usual thread-like fringes with an interplanar distance of 0.64 nm corresponding to the (0 0 2) basal planes of MoS2 can be identified in all of the HRTEM images. One apparent difference that can be observed from the HRTEM images for the annealed catalysts was that the edges show a spiky feature that was not observed in the as-synthesized catalysts. This difference in the character of the edges of the as-synthesized and annealed catalysts is indicated by the arrows in Fig. 5. The red arrows indicated more rounded edges as can be observed for the as-synthesized catalysts. The yellow arrows indicated the sharp edges for the annealed catalysts. The changes in the structure near the edges of the catalyst after the annealing process could be due to the further enhancement in the growth of the smaller MoS2 crystallites from the as-synthesized catalysts. This further demonstrates the importance of the annealing treatment that changes the structure of the catalysts. Consequently, the spiky edges of the annealed unsupported catalysts contribute to their higher specific surface area and exposure of more active sites for the HDO reaction. Owing to the interesting features of the as-synthesized and annealed catalysts, additional representative HRTEM micrographs (Fig. S3†) including 500–550 MoS2 slabs were analyzed to study changes in the microstructure of the unsupported catalysts. The quantitative comparison of the average slab lengths, stacking layer number, MoS2 dispersion, and the edge-to-corner of MoS2 slabs are presented in Table 2. The distributions for the MoS2 stacking numbers and slab length are shown in Fig. S4.† The average slab length for MoS2 increases after the annealing treatment and the same trend was observed for both the 12 hours and 24 hours samples. The increase in average slab length also leads to a higher edge-to-corner ratio of MoS2 slabs for both annealed samples. Both as-synthesized catalysts (MoS2-12 and MoS2-24) shown a ‘defect-less’ feature and a more curved multi-layered structure as indicated by the red arrows in the HRTEM images (Fig. S3†). On the other hand, the MoS2 fringes in the annealed catalysts (MoS2-12a and MoS2-24a) are more randomly stacked and the sharp edges can be observed. These special features that can only be observed in the annealed catalysts confirm the greater presence of defect sites. The schematic illustration of the formation of unsupported MoS2 and changes in properties due to the annealing treatment is shown in Scheme 1.
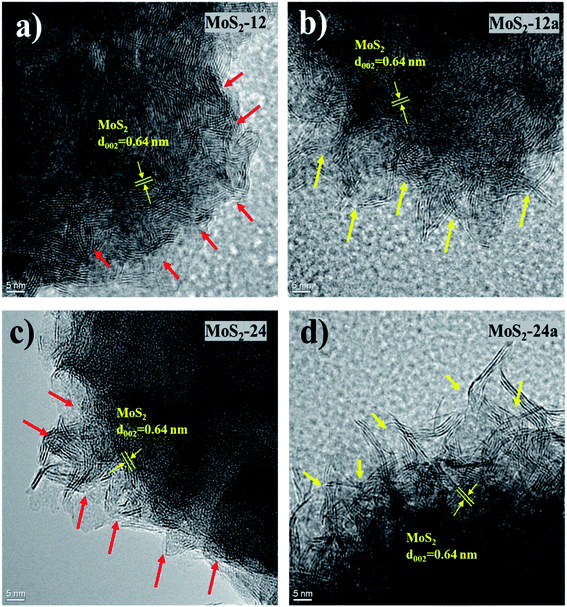 | ||
| Fig. 5 HRTEM images of (a) MoS2-12, (b) MoS2-12a, (c) MoS2-24, and (d) MoS2-24a, with arrows indicating differences in characteristics of particle edges. | ||
3.2 Catalytic performance test using 4-propylguaiacol and kraft lignin
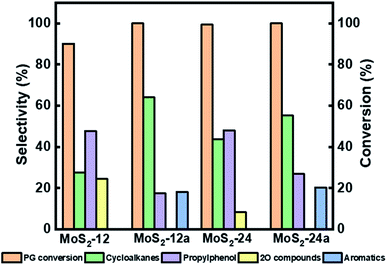 | ||
| Fig. 6 Reaction product selectivity and conversion at 4 h for HDO of PG over MoS2-12, MoS2-12a, MoS2-24, and MoS2-24a at 50 bar total H2 pressure, 300 °C, and 1000 rpm. | ||
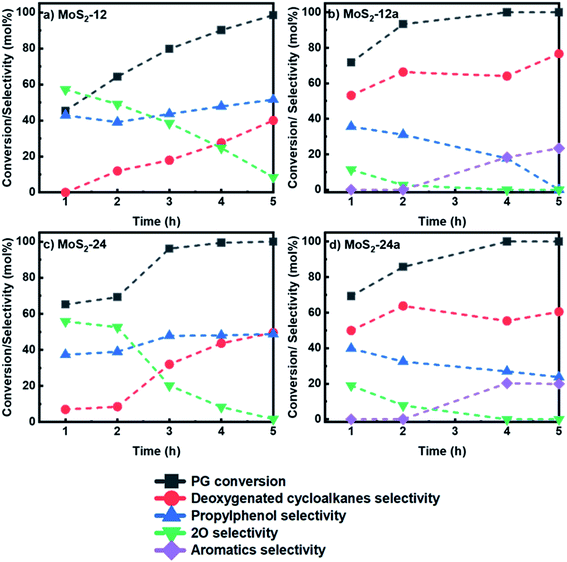 | ||
| Fig. 7 Reaction product distribution for HDO of PG over (a) MoS2-12 (b) MoS2-12a (c) MoS2-24 and (d) MoS2-24a at 50 bar total H2 pressure, 300 °C and 1000 rpm. | ||
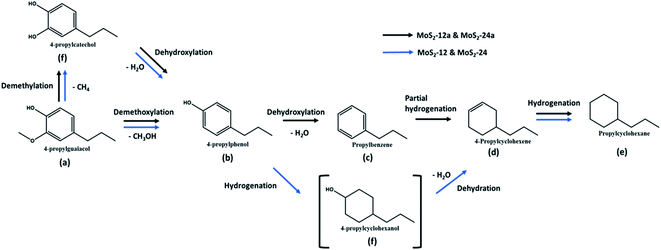 | ||
| Scheme 2 Reaction scheme for HDO of PG over unsupported MoS2 at 50 bar total H2 pressure, 300 °C, and 1000 rpm. | ||
In Fig. 6, it can be seen that there was an improvement in the conversion of PG when the as-synthesized catalysts' synthesis time was increased from 12 h to 24 h. The PG conversion reached 90.1% using MoS2-12, while almost complete conversion was achieved for MoS2-24 after 4 h of reaction. There was also a difference in the selectivity for deoxygenated cycloalkanes like 4-propylcyclohexane and 4-propylcyclohexene where they were 27.5% and 43.4% for MoS2-12 and MoS2-24, respectively. On the other hand, the intermediate 4-propylphenol stayed in the range of between 47% and 48% selectivity after 4 h for both as-synthesized catalysts. In a previous study conducted by Wu et al.,45 34.7% selectivity for 4-propylphenol and 99.2% PG conversion were reported after 6 h of reaction at 300 °C showing a comparable result obtained with the as-synthesized catalyst in this study. The difference in results is likely due to the differences in the preparation methods, where they introduced silicomolybdic acid during the synthesis of their hydrophobic unsupported MoS2 catalyst.45 There was also a three times difference in the selectivity for 4-propylcatechol (2O-compound) with 24.7% for MoS2-12 and decreasing to 8.3% for MoS2-24, taking 4 h as a reference reaction time.
Both as-synthesized catalysts further underwent an annealing treatment at 400 °C for 2 h under nitrogen flow and were tested for HDO of PG. It can be noted from Fig. 7b and d that there was a change in product selectivity with a clear increase in cycloalkanes selectivity to 76.6% and 60.5% after 5 h for MoS2-12a and MoS2-24a, respectively as compared to the catalysts without the annealing treatment (40% and 49.6% for MoS2-12 and MoS2-24, respectively). The selectivity for 4-propylphenol also showed a downward trend for both the annealed catalysts. For the MoS2-12a catalyst, 4-propylphenol, the major intermediate, was fully deoxygenated after 5 h while the selectivity of 4-propylcatechol gradually decreased and disappeared after 3 h. Whereas, for the HDO of PG over MoS2-24a, the same downward trend for 4-propylphenol selectivity was observed with a final 23.8% remaining at the end of the reaction. Moreover, the selectivity for 4-propylcatechol (2O-compound) was low at the beginning of the reaction already at 1 h for both annealed catalysts (11.3% and 19.0% for MoS2-12a and MoS2-24a, respectively) as compared to the as-synthesized catalysts (57.2% and 55.8% for MoS2-12 and MoS2-24, respectively).
Interestingly, for both annealed catalysts, an aromatic compound (4-propylbenzene) could be identified after 2 h of reaction and its selectivity gradually increased reaching 23.4% and 19.8% for MoS2-12a and MoS2-24a, respectively after 5 h. The observed results showed that a 2 h annealing step improved the PG conversion and gave 19–24% selectivity for aromatic compounds with the same reaction parameters. The yield of fully deoxygenated products observed after 5 h decreased in the order of: MoS2-12a (100%) > MoS2-24a (80.4%) > MoS2-24 (49.6%) > MoS2-12 (40.0%). The absence of propylbenzene in the case of as-synthesized catalysts (MoS2-12 and MoS2-24) is mainly attributed to the higher amount of corner sites as indicated by the edge-to-corner sites ratio (Table 2) which is beneficial for hydrogenation reaction.46 It was noteworthy that, one of the intermediates, 4-propylcyclohexanol was not detected in the reaction product. This suggests that 4-propylphenol was rapidly hydrogenated and deoxygenated to 4-propylcyclohexene and propylcyclohexane. The present data shows that the HDO activity and reaction routes are dependent largely on the MoS2 morphology and a more favourable morphology is induced by a post thermal treatment of the as-synthesized catalysts as proposed in this work.
Additionally, for the as-synthesized catalysts, a longer synthesis time was preferred to achieve a better PG deoxygenation. While for the annealed catalysts, a shorter synthesis time was advantageous for PG deoxygenation. This could be reasoned by that the 12 h synthesis time is adequate to nucleate enough MoS2 crystallites and the annealing treatment can facilitate the MoS2 crystal growth with further rearrangement. Also, it is worth pointing out that MoS2-12a achieved a full PG deoxygenation after 5 h even though the MoS2-24a had a higher surface area while MoS2-12a possessed the highest pore volume and the smallest pore size.
The difference in the catalytic performance of the annealed and as-synthesized unsupported MoS2 catalysts depends largely on the MoS2 morphology. For instance, the greater presence of defect sites as can be seen in the annealed catalysts in all the HRTEM images. These defect sites have been found to be important for creating more active sites, and further improving the HDO selectivity.26 It should also be noted that these defect sites contributed to the formation of additional edge active sites. It is noteworthy from the statistical analysis of the MoS2 slabs (Table 2) for all catalysts that the annealing treatment increased the slab length of both MoS2-12 and MoS2-24. The longer MoS2 slab length exhibited by the annealed catalysts correlates to the higher edge-to-corner ratio of the MoS2 slabs. This also explained the higher HDO selectivity for both annealed catalysts which was attributed to the higher ratio of edge-to-corner of MoS2 slabs. Thus, the annealing treatment proposed in this study was found to be able to create defect sites and further exposed MoS2 edge sulfur vacancies for HDO activity enhancement.
To evaluate the performance of the unsupported MoS2 prepared without the pH adjustment, both as-synthesized and annealed unsupported MoS2 catalysts were employed for HDO of PG. The reaction product time evolution for both catalysts was measured, as shown in Fig. 8. A steady increase in PG conversion can be observed and a final PG conversion of 86.6% was obtained after 5 h for the as-synthesized MoS2 prepared without acid addition. The selectivity for 4-propylphenol increased to 42.5% after 2 h and stabilized, reaching 40.8% at 5 h. A downward trend was observed for the selectivity for oxygenated intermediates (2O-compounds) giving a final selectivity of 19.5% (Fig. 8a). While for deoxygenated cycloalkanes product selectivity, a gradual increase in selectivity was observed achieving a final selectivity of 40%. The fresh as-synthesized MoS2 (without acid) then underwent a similar annealing treatment as described previously and was applied for HDO of PG. Surprisingly, the annealing treatment, in this case, had a negative effect on the PG conversion, showing a final PG conversion of 74.2% after 5 h (Fig. 8b). Comparatively, there was a slight increase in the cycloalkanes selectivity, affording a final selectivity of 46.6% (Fig. 8b). While the selectivity for intermediate oxygenated compounds shows a decreasing trend with reaction time giving 36.6% selectivity for 4-propylphenol and 15.8% selectivity for 4-propylcatechol (2O-compounds) at the end of the reaction. From the clear difference in the product distribution for HDO of PG between the unsupported MoS2 prepared in the presence and absence of acid addition, it can be concluded that creating an acidic environment while synthesizing unsupported MoS2 is crucial to produce MoS2 with smaller particle size. As for the MoS2 particle size, the resulting surface has a direct effect on the HDO selectivity. This result is in line with the conclusion outlined by Zhang et al.,43 which shows that higher HDS and hydrogenation activities can be achieved using MoS2 prepared in low pH values. The smaller MoS2 particles synthesized under an acidic environment possessed more active sites, leading to a higher HDO selectivity. It was also worth mentioning that the annealing treatment proposed in this study has a positive enhancement on the HDO activity while using MoS2 prepared with pH adjustment. While for MoS2 prepared without pH adjustment, it has an opposite effect, especially on the PG conversion and apparently in this case does not facilitate the growth of MoS2 crystals.
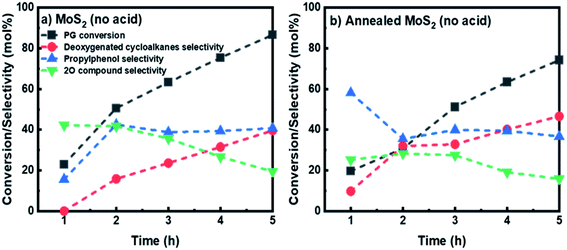 | ||
| Fig. 8 Reaction product distribution for HDO of PG over (a) MoS2 prepared without acid adjustment and (b) annealed MoS2 without acid adjustment at 50 bar total H2 pressure, 300 °C and 1000 rpm. | ||
Moreover, the effect of different pretreatment atmospheres on the PG product evolution and catalytic activity was investigated. The usual annealed MoS2 catalysts in this study were all pretreated under continuous nitrogen flow. We performed an additional experiment where MoS2-24 was annealed under air at 400 °C for 2 h and the PG conversion and products selectivity at 5 h are presented in Fig. S5.† PG was completely transformed after 5 h. Interestingly, a steady increase in the selectivity for 4-propylphenol can be observed, giving a final selectivity of 66.2%. High selectivity of 50% towards 4-propylcatechol (2O-compound) can be seen after 2 h which decreased abruptly to a final selectivity of 7%. The changes in the activity of the catalyst towards HDO could mainly be caused by changes in the nature and number of HDO active sites. These results also demonstrate the detrimental effect of an oxidative environment on the catalyst properties during annealing, which should result in producing more molybdenum oxysulfide species that are less favourable for HDO activity.47
To obtain a comparison in the HDO activity between the unsupported MoS2 prepared in this work and commercially available bulk MoS2, we performed the HDO of PG under the same reaction conditions over the bulk MoS2, as shown in Fig. S6a.† Comparing the bulk MoS2 and MoS2-12a, the conversion of PG on bulk MoS2 reached only 81.3% after 5 h, whereas for MoS2-12a, PG was fully converted after 4 h. Selectivity for 4-propylphenol increased after 2 h and reached 44.8% after 5 h for bulk MoS2. Selectivity for oxygenates like 4-propylcatechol (2O compound) was decreasing after 2 h and 26.9% remained at the end of the reaction. The poorer performance of the bulk MoS2 could be reasoned by its 6 times lower specific surface area as compared to MoS2-12a and its average particle size of 6 μm, which results in very limited active site accessibility. The current results show that the unsupported MoS2 prepared in this work gives a superior PG conversion and higher deoxygenation activity as compared to the commercial bulk MoS2.
The product distribution of unsupported MoS2-12a and MoS2 supported on Al2O3 (13.2 wt% Mo loading) catalyst was also compared. The experiments were performed with 500 mg and 66 mg of supported and unsupported catalysts, respectively. These different total masses of catalysts enabled a comparison of the catalysts based on an equal mass of the active component of Mo. The product evolution for the supported catalyst is shown in Fig. S6b.† The supported MoS2/Al2O3 was prepared using a wetness impregnation method as described previously.33 The use of a high surface area support during the synthesis of hydrotreatment catalysts ensures a high dispersion of the active phase that could provide more active sites for the HDO reaction to occur. A complete PG conversion was achieved after 2 h for the supported MoS2/Al2O3 catalyst as compared to the 4 h needed for the unsupported MoS2-12a. The selectivity for deoxygenated cycloalkanes also increased steadily from 38.8% to 70.2% during 5 h of reaction for the supported MoS2. However, a two-fold higher aromatic selectivity (23.3%) could be obtained for MoS2-12a at the end of the reaction. It was worth highlighting that the use of a high surface area alumina for supporting MoS2 resulted in a faster PG conversion achieving full conversion in just 2 h. However, it should be noticed that PG was fully deoxygenated after 5 h in the case of the MoS2-12a catalyst while 17.5% of 4-propylphenol selectivity can still be observed for the supported MoS2 catalyst. These results show that a higher surface area is beneficial in improving the transformation of PG to various compounds but not the HDO activity. This is consistent with the conclusion made by Wang et al.,27 stating that a higher specific surface area may not be the major factor in giving high HDO activity. Also, the active site density per mass active phase (MoS2) with the supported catalyst may be higher since it gives a higher PG conversion, however, the nature of these sites is undoubtedly different since the unsupported catalyst gave a higher degree of deoxygenation.
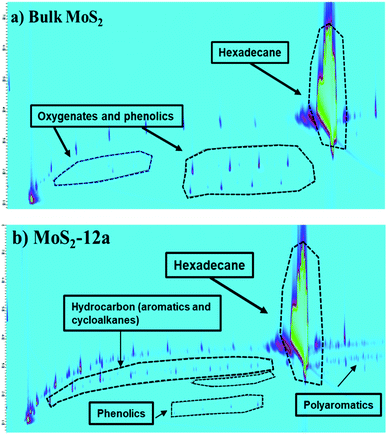 | ||
| Fig. 10 Chromatograms (2D GC × GC-MS-FID) of the reaction liquid products obtained in the hydrotreatment of kraft lignin over (a) Bulk MoS2 and (b) MoS2-12a. | ||
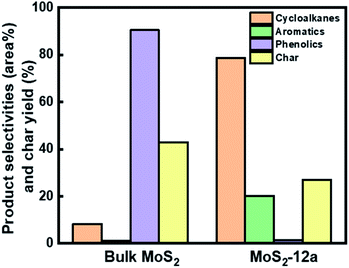
The higher deoxygenation achieved in kraft lignin hydrotreatment for the annealed unsupported MoS2-12a as compared to the bulk MoS2 is consistent with the results for the model reaction, HDO of PG. Also, the formation of carbonaceous solid products (char) from the re-polymerization or condensation of lignin fragments is less in the case of the synthesized unsupported MoS2. This indicates that a catalyst with high activity and accessibility of sites for deoxygenation and hydrogenation reactions is important to prevent these char formation reactions.
4. Conclusions
In summary, a facile hydrothermal synthesis method has been successfully employed to prepare unsupported MoS2 catalysts and the work also revealed the significance of a post-thermal annealing treatment to the as-synthesized catalysts for enhancing HDO performance. Increasing the synthesis time from 12 h to 24 h has an overall positive effect on the PG conversion and deoxygenated cycloalkanes selectivity. For instance, a complete PG conversion was achieved using MoS2-24, while 90.1% PG conversion was obtained for MoS2-12 after 4 h. There was also a 1.6-fold higher deoxygenated cycloalkanes selectivity for MoS2-24 as compared to MoS2-12 after 4 h of reaction. An annealing treatment of the as-synthesized catalysts performed at 400 °C for 2 h under nitrogen atmosphere was found to have a remarkable effect on the HDO activity. The present results in this work indicated that the annealing treatment was found to be effective in the creation of a greater abundance of defect sites that further enhance HDO activity. An increase in deoxygenated cycloalkane selectivity was observed for both annealed samples, with 76.6% for MoS2-12a and 60.5% for MoS2-24a after 5 h. Moreover, an aromatic compound like 4-propylbenzene could be detected for both annealed samples after 2 h which was not the case for the as-synthesized catalysts. The MoS2 morphology change caused by the annealing for both as synthesized catalysts also contributed to differences in HDO activity and reaction routes. The fully deoxygenated product yields after 5 h was ranked in the following order: MoS2-12a (100%) > MoS2-24a (80.4%) > MoS2-24 (49.6%) > MoS2-12 (40.0%). It was found that the longer synthesis time was advantageous to achieve a higher PG deoxygenation for as-synthesized catalysts, however for the annealed samples, a shorter synthesis time was better. It can be hypothesized that 12 h synthesis time is sufficient to nucleate enough MoS2 crystals that undergo crystallite growth and rearrangement during the annealing treatment for a high yield of optimal crystal size and morphology for HDO activity. Also, the acidic environment during the synthesis was important to promote the growth of MoS2 crystals which has a direct effect on the HDO activity. The effect of annealing on the samples prepared without pH adjustment was studied and it was shown to have an adverse effect on the PG conversion and therefore did not facilitate the further growth of the MoS2 crystallites.There was an increase in crystallinity of MoS2 after the annealing treatment based on XRD analysis. These changes were consistent with observations of particle size and MoS2 structure according to SEM and TEM analysis. The MoS2 particles had a more uniform and reduced average particle size after the annealing treatment. The absence of the molybdenum oxysulfide species in the annealed catalysts was consistent with higher MoS2 yield and improved activity for HDO of PG. The clear difference in product distribution and selectivity for MoS2 annealed under nitrogen and air atmosphere suggested that an inert environment during annealing was vital to avoid oxidation during the annealing process. We further compared the HDO activity between the unsupported MoS2 with alumina-supported MoS2, using the same Mo content in both experiments, and concluded the differences in the nature of the active sites of the catalysts may explain their different final degrees of deoxygenation.
Additionally, the application of the annealed MoS2 was further demonstrated in the hydrotreatment of kraft lignin. The higher deoxygenation activity of the annealed unsupported MoS2 was found to be vital for achieving a lower char yield from the lignin. The high selectivity for deoxygenated products in the liquid products revealed the feasibility of utilizing unsupported catalytic materials for the upgrading of renewable bio-feedstocks.
Conflicts of interest
There are no conflicts to declare.Acknowledgements
This research is a collaboration work between Competence Centre for Catalysis (KCK) at Chalmers, Preem AB, and RISE Energy Technology Center (ETC). The authors would like to acknowledge the Swedish Energy Agency (2017-010890) and Preem AB for financial support. This work was also performed in part at the Chalmers Material Analysis Laboratory, CMAL for SEM, TEM, XPS, Raman, and XRD analysis.References
- IEA, World Energy Outlook 2019, 2019, IEA, Paris, https://www.iea.org/reports/world-energy-outlook-2019 Search PubMed.
- L. Fan, Y. Zhang, S. Liu, N. Zhou, P. Chen, Y. Cheng, M. Addy, Q. Lu, M. M. Omar, Y. Liu, Y. Wang, L. Dai, E. Anderson, P. Peng, H. Lei and R. Ruan, Bioresour. Technol., 2017, 241, 1118–1126 CrossRef CAS PubMed.
- F. S. Chakar and A. J. Ragauskas, Ind. Crops Prod., 2004, 20, 131–141 CrossRef CAS.
- G. W. Huber, S. Iborra and A. Corma, Chem. Rev., 2006, 106, 4044–4098 CrossRef CAS PubMed.
- P. Sudarsanam, R. Zhong, S. Van Den Bosch, S. M. Coman, V. I. Parvulescu and B. F. Sels, Chem. Soc. Rev., 2018, 47, 8349–8402 RSC.
- M. Saidi, F. Samimi, D. Karimipourfard, T. Nimmanwudipong, B. C. Gates and M. R. Rahimpour, Energy Environ. Sci., 2014, 7, 103–129 RSC.
- P. Mäki-Arvela and D. Murzin, Catalysts, 2017, 7(9), 265 CrossRef.
- E. Furimsky, Appl. Catal., A, 2000, 199, 147–190 CrossRef CAS.
- W. O. S. Doherty, P. Mousavioun and C. M. Fellows, Ind. Crops Prod., 2011, 33, 259–276 CrossRef CAS.
- D. Laurenti, B. Phung-Ngoc, C. Roukoss, E. Devers, K. Marchand, L. Massin, L. Lemaitre, C. Legens, A. A. Quoineaud and M. Vrinat, J. Catal., 2013, 297, 165–175 CrossRef CAS.
- P. E. Ruiz, B. G. Frederick, W. J. De Sisto, R. N. Austin, L. R. Radovic, K. Leiva, R. García, N. Escalona and M. C. Wheeler, Catal. Commun., 2012, 27, 44–48 CrossRef CAS.
- S. Mukundan, M. Konarova, L. Atanda, Q. Ma and J. Beltramini, Catal. Sci. Technol., 2015, 4422–4432 RSC.
- G. M. K. Abotsi and A. W. Scaroni, Fuel Process. Technol., 1989, 22, 107–133 CrossRef CAS.
- S. Mukundan, L. Atanda and J. Beltramini, Sustainable Energy Fuels, 2019, 3, 1317–1328 RSC.
- G. Zhu, W. Wang, K. Wu, S. Tan, L. Tan and Y. Yang, Ind. Eng. Chem. Res., 2016, 55, 12173–12182 CrossRef CAS.
- S. Eijsbouts, S. W. Mayo and K. Fujita, Appl. Catal., A, 2007, 322, 58–66 CrossRef CAS.
- F. L. Plantenga, R. Cerfontain, S. Eijsbouts, F. Van Houtert, G. H. Anderson, S. Miseo, S. Soled, K. Riley, K. Fujita and Y. Inoue, Stud. Surf. Sci. Catal., 2003, 145, 846–849 CrossRef.
- G. Bellussi, G. Rispoli, A. Landoni, R. Millini, D. Molinari, E. Montanari, D. Moscotti and P. Pollesel, J. Catal., 2013, 308, 189–200 CrossRef CAS.
- N. Bergvall, L. Sandström, F. Weiland and O. Öhrman, Energy Fuels, 2020, 34, 8452–8465 CrossRef CAS.
- C. Mattsson, S. I. Andersson, T. Belkheiri, L. E. Åmand, L. Olausson, L. Vamling and H. Theliander, Biomass Bioenergy, 2016, 95, 364–377 CrossRef CAS.
- F. L. P. Resende, S. A. Fraley, M. J. Berger and P. E. Savage, Energy Fuels, 2008, 22, 1328–1334 CrossRef CAS.
- A. Demirbaş, Energy Convers. Manage., 2000, 41, 1601–1607 CrossRef.
- A. N. Varakin, A. V. Mozhaev, A. A. Pimerzin and P. A. Nikulshin, Catal. Today, 2019, 1 Search PubMed.
- B. Yoosuk, D. Tumnantong and P. Prasassarakich, Chem. Eng. Sci., 2012, 79, 1–7 CrossRef CAS.
- M. Grilc, G. Veryasov, B. Likozar, A. Jesih and J. Levec, Appl. Catal., B, 2015, 163, 467–477 CrossRef CAS.
- C. Zhang, K. Liu, Y. Zhang, L. Mu, Z. Zhang and J. Huang, Appl. Catal., A, 2021, 621, 118175 CrossRef CAS.
- W. Wang, K. Zhang, L. Li, K. Wu, P. Liu and Y. Yang, Ind. Eng. Chem. Res., 2014, 53, 19001–19009 CrossRef CAS.
- K. Wu, W. Wang, H. Guo, Y. Yang, Y. Huang, W. Li and C. Li, ACS Energy Lett., 2020, 5, 1330–1336 CrossRef CAS.
- W. Wang, L. Li, K. Wu, G. Zhu, S. Tan, W. Li and Y. Yang, RSC Adv., 2015, 5, 61799–61807 RSC.
- J. Cao, A. Li, Y. Zhang, L. Mu, X. Huang, Y. Li, T. Yang, C. Zhang and C. Zhou, Mol. Catal., 2021, 505, 1–9 Search PubMed.
- H. Wang, K. Rogers, H. Zhang, G. Li, J. Pu, H. Zheng, H. Lin, Y. Zheng and S. Ng, Mol. Catal., 2017, 443, 228–240 CrossRef CAS.
- W. Wang, K. Zhang, Z. Qiao, L. Li, P. Liu and Y. Yang, Catal. Commun., 2014, 56, 17–22 CrossRef CAS.
- Y. W. Cheah, M. A. Salam, P. Arora, O. Öhrman, D. Creaser and L. Olsson, Sustainable Energy Fuels, 2021, 5, 2097–2113 RSC.
- P. Arora, H. Ojagh, J. Woo, E. Lind Grennfelt, L. Olsson and D. Creaser, Appl. Catal., B, 2018, 227, 240–251 CrossRef CAS.
- M. A. Salam, P. Arora, H. Ojagh, Y. W. Cheah, L. Olsson and D. Creaser, Sustainable Energy Fuels, 2020, 4, 149–163 RSC.
- D. Ferdous, A. K. Dalai, J. Adjaye and L. Kotlyar, Appl. Catal., A, 2005, 294, 80–91 CrossRef CAS.
- M. Kruk and M. Jaroniec, Chem. Mater., 2001, 31(10), 3169–3183 CrossRef.
- H. Lin, X. Chen, H. Li, M. Yang and Y. Qi, Mater. Lett., 2010, 64, 1748–1750 CrossRef CAS.
- A. Jagminas, G. Niaura, R. Žalneravičius, R. Trusovas, G. Račiukaitis and V. Jasulaitiene, Sci. Rep., 2016, 6, 2–10 CrossRef PubMed.
- G. M. Bremmer, L. van Haandel, E. J. M. Hensen, J. W. M. Frenken and P. J. Kooyman, Appl. Catal., B, 2019, 243, 145–150 CrossRef CAS.
- L. Benoist, D. Gonbeau, G. Pfister-Guillouzo, E. Schmidt, G. Meunier and A. Levasseur, Solid State Ionics, 1995, 76, 81–89 CrossRef CAS.
- F. Solymosi, J. Cserényi, A. Szöke, T. Bánsági and A. Oszkó, J. Catal., 1997, 165, 150–161 CrossRef CAS.
- C. Zhang, P. Li, X. Liu, T. Liu, Z. Jiang and C. Li, Appl. Catal., A, 2018, 556, 20–28 CrossRef CAS.
- L. Bomont, M. Alda-Onggar, V. Fedorov, A. Aho, J. Peltonen, K. Eränen, M. Peurla, N. Kumar, J. Wärnå, V. Russo, P. Mäki-Arvela, H. Grénman, M. Lindblad and D. Y. Murzin, Eur. J. Inorg. Chem., 2018,(24), 2841–2854 CrossRef CAS.
- K. Wu, Y. Liu, W. Wang, Y. Huang, W. Li, Q. Shi and Y. Yang, Mol. Catal., 2019, 477, 110537 CrossRef CAS.
- E. J. M. Hensen, P. J. Kooyman, Y. Van der Meer, A. M. Van der Kraan, V. H. J. De Beer, J. A. R. Van Veen, R. A. Van Santen, P. J. Kooyman, Y. Van der Meer and A. M. Van der Kraan, J. Catal., 2001, 199, 224–235 CrossRef CAS.
- M. Sugioka and F. Kimura, J. Jpn. Pet. Inst., 1985, 28, 306–311 CrossRef CAS.
- T. Burimsitthigul, B. Yoosuk, C. Ngamcharussrivichai and P. Prasassarakich, Renewable Energy, 2021, 163, 1648–1659 CrossRef CAS.
- B. Yoosuk, P. Sanggam, S. Wiengket and P. Prasassarakich, Renewable Energy, 2019, 139, 1391–1399 CrossRef CAS.
- B. Yoosuk, D. Tumnantong and P. Prasassarakich, Chem. Eng. Sci., 2012, 79, 1–7 CrossRef CAS.
Footnote |
| † Electronic supplementary information (ESI) available. See DOI: 10.1039/d1se00686j |
| This journal is © The Royal Society of Chemistry 2021 |



![[thin space (1/6-em)]](https://www.rsc.org/images/entities/char_2009.gif) :
: