 Open Access Article
Hydrotreatment of lignin dimers over NiMoS-USY: effect of silica/alumina ratio†
Muhammad Abdus
Salam
,
You Wayne
Cheah
,
Phuoc Hoang
Ho
,
Louise
Olsson
 and
Derek
Creaser
 *
*
Competence Centre for Catalysis, Chemical Engineering, Chalmers University of Technology, Gothenburg, SE-41296, Sweden. E-mail: derek.creaser@chalmers.se
First published on 8th June 2021
Abstract
Sulfides of NiMo over a series of commercial ultra-stable Y zeolites were studied in an autoclave reactor to elucidate the effect of silica/alumina ratio (SAR = 12, 30, and 80) on the cleavage of etheric C–O (β-O-4) and C–C (both sp3–sp2 and sp2–sp2) linkages present in native/technical lignin and lignin derived bio-oils. 2-Phenethyl phenyl ether (PPE), 4,4-dihydroxydiphenylmethane (DHDPM), and 2-phenylphenol, (2PP) were examined as model dimers at 345 °C and 50 bar of total pressure using dodecane as the solvent. The etheric C–O hydrogenolysis activity was found to be in the order NiMoY30 > NiMoY12 > NiMoY80, despite a high initial rate of C–O cleavage over NiMoY12 owing to its high acid density. A high degree of hydrodeoxygenation (HDO) and hydrocracking reactions were observed with NiMoY30 yielding >80% of deoxygenated products of which ∼58% are benzene, toluene, and ethylbenzenes. A similar experiment with DHDPM showed the rapid cleavage of the methylene-linked C–C dimer (sp3–sp2) to phenols and cresols even with the low acid density (high SAR) catalyst, NiMoY80. Direct hydrocracking of the recalcitrant 5-5′ linkage in 2PP is very slow, however, it cleaved via a cascade of HDO, ring-hydrogenation, and hydrocracking reactions. A high degree of hydrogenolysis and hydrocracking occurs over NiMoY30 due to suitable balance between acidity and pore accessibility, enhanced proximity between acidic and deoxygenation sites leading to a slightly higher dispersion of Ni promoted MoS2 crystallites. Overall, the product spectrum consisted of a high yield of deoxygenated products. The carbon content on the recovered catalyst was in the range of 3–7 wt%. These results pave the way for effective catalysts to break recalcitrant linkages present in lignin to obtain a hydrocarbon-rich liquid transportation fuel. An experiment with Kraft lignin over NiMoY30 shows good selectivity for deoxygenated aromatics and cycloalkanes in the liquid phase.
Introduction
Valorization of lignin, a naturally abundant 3D biopolymer strongly relies on the efficient breakdown/depolymerization via cleavage of interunit etheric C–O and C–C linkages present in its heterogenous skeleton.1,2 Various oxidative, reductive, alkaline/acidic processes depolymerize the lignin to a variable degree and yield bio-oil containing alkyl or methoxy substituted phenols, phenolic dimers, trimers, and oligomers having residual C–C and C–O linkages.1,3 Ideally, all these dimers and oligomers need to be eventually cleaved to yield a product with only aromatic monolignols. Also, the stabilization of these oxygenated fragments and their ease of use in further upgrading processes is vital to derive bulk/fine chemicals and fuels. Hydrodeoxygenation (HDO) is a unique upgrading process in this respect and has been studied extensively using phenolic monomers, dimers and lignin's having etheric and C–C linkages. Key elements in such an HDO process include a catalyst with metallic sites (redox sites), acid sites, and H2 as a reactant to remove oxygen.4–6 Typical HDO products are bioarenes and cycloalkanes in the gasoline range, that are suitable for fuel applications.2,7–11 Nevertheless, the gamut of products and selectivity for certain product groups highly depends upon the engineering of the catalyst-support formulation i.e. physiochemical properties at the optimal reaction conditions. Besides, support acidity, pore accessibility, and stability of the catalysts are challenging aspects that define the catalytic activity for supported catalysts.12–14There are excellent reviews regarding lignin valorization to specialty chemicals and fuels.1–3,15,16 A substantial number of studies show that heterogeneous catalysts including noble, transition metals, and metal sulfides over various supports are very active in cleaving Caryl–O ether linkages, as they require relatively low bond dissociation energies.15,17–20 Zeolites have been used as effective support materials in such applications due to their porous nature, tunable acidity, and hydrothermal stability. HZSM-5 in conjunction with Pd/C, Ni, and Ru were shown to be effective to upgrade phenolic monomers and dimers to cycloalkanes.17,21,22 Besides, H-Beta and HY zeolites were also reported in combination with Pt, Pd, Ru, and Ni to be beneficial in HDO, coupling, isomerization and transalkylation reactions.13,23–27
However, by nature, most organic C–C bonds are very stable and inert to activation by cracking reactions. Such bonds are prevalent in technical lignin's and bio-oils derived from such lignin.15,28 This limits the number of robust catalysts that are applicable for technical lignin valorization. Various oxidative/redox-neutral/microwave-assisted/bio and photocatalytic techniques for cleavage of such linkages in lignin have been communicated.28,29 There are few reports on reductive C–C cleavage.30 Shuai et al.31 showed the cleavage of a methylene linked C–C phenolic dimer to phenolic monomers. NiMoS2/C has been reported to cleave both C–O and C–C linkages in Kraft lignin to yield both monomeric and dimeric phenols.32 Pd/C and Rh/C have been demonstrated to cleave etheric C–O and C–C bonds in model dimers under supercritical water with only in situ hydrogen (i.e. no additional hydrogen was added).33 Henceforth, a stable catalyst cleaving both etheric C–O and C–C linkages is necessary to valorize lignin/lignin derived bio-oil.
In this context, we have reported earlier on the effectiveness of NiMoS over alumina and ultra-stable Y zeolite for some common lignin dimers.34 We observed a very high yield of mono-aromatics including deoxygenated aromatics, mono/alkyl phenols, and cycloalkanes via hydrogenolysis of etheric C–O bonds and C–C cleavage of the intermediates over the NiMoS-USY combination.34 There are several studies concerning NiMoS-USY or modified USY reported for heavy vacuum gas/light cycle oil, hydrodesulfurization, and other fundamental studies.35–39 However, to the best of our knowledge, there is no studies investigating NiMoS over USY with various SAR for lignin/lignin dimer hydrotreatment. Herein, we report the catalytic activity of NiMoS over a series of ultra-stable Y zeolites with varying silica/alumina ratio (SAR) using dimer model compounds mimicking lignin linkages (C–O and C–C) shown in Fig. 1, to gain further insight into the cleavage of lignin dimers, the subsequent deoxygenation process, and coke formation. Besides, we have performed a detailed characterization of the catalysts using XPS, TEM, TPD of NH3 and C2H5NH2, N2 physisorption, and elemental analysis to correlate the results with the catalyst compositions.
Experimental
Catalyst synthesis
Ni and Mo-containing catalysts were prepared by a wet impregnation process40–42 using a series of ultra-stable Y zeolites (silica/alumina, SAR ratio of 12, 30, and 80, Zeolyst International). Before the impregnation, the zeolite with SAR of 12 was calcined at 550 °C for 6 h to transform it to H-form, since it was delivered in its ammonium form. Other zeolites were originally in their hydrogen form and used after drying in air at 250 °C for 3 h. Ammonium molybdate tetrahydrate (81–83% MoO3 basis, Sigma-Aldrich) and nickel(II) nitrate hexahydrate (99%, Sigma-Aldrich) were used as the metal precursors. The three different catalysts obtained after sulfidation (described below) will from here on be identified as NiMoY12, NiMoY30, and NiMoY80 for simplicity, where 12, 30, or 80 indicates the SAR of the ultra-stable Y zeolite support in each sample.Catalytic activity measurements
![[thin space (1/6-em)]](https://www.rsc.org/images/entities/char_2009.gif) :
:![[thin space (1/6-em)]](https://www.rsc.org/images/entities/char_2009.gif) 1 lignin to sulfide catalyst mass ratio in hexadecane for 5 h. The reactor was then cooled to room temperature and solids (lignin residue and catalyst) were recovered from the reaction mixture via filtration.
1 lignin to sulfide catalyst mass ratio in hexadecane for 5 h. The reactor was then cooled to room temperature and solids (lignin residue and catalyst) were recovered from the reaction mixture via filtration.
Product analysis for the liquid phase obtained from Kraft lignin hydrotreatment is described in the ESI.†
Catalyst characterization
Nitrogen physisorption properties were measured at −196 °C using a TriStar 3000 gas adsorption–desorption analyzer. Before the measurement, the catalysts were dried under an N2 atmosphere at 250 °C for 6 h. The Brunauer–Emmett–Teller (BET) method was employed to determine the specific surface areas, while the t-plot and the Barrett–Joyner–Halenda (BJH) methods were used to calculate the micropore volume and the average diameter of the mesopores, respectively. The total pore volume was calculated at P/P0 = 0.975. The C, H, and S contents on the sulfided and recovered catalysts were measured by elemental analysis (Elemental Microanalysis Ltd, UK). Impregnated metal contents (Ni, Mo) were verified by Inductively Coupled Plasma-Sector Field Mass Spectroscopy (ICP-SFMS, ALS Scandinavia AB, Luleå, Sweden).NH3-Temperature-programmed desorption (TPD) was used to measure the total acidity of the catalyst and the ethylamine (C2H5NH2)-TPD was used to measure the Brønsted acid site density of the synthesized catalysts, as described in our previous work.34 X-ray diffraction (XRD) patterns of the USY and synthesized catalysts were recorded using an X-ray powder diffractometer operating at 40 kV and 40 mA (Siemens, D5000) with a CuKα monochromatic radiation (λ = 1.542A°) source in the 2-theta range of 5–80° with a step size of 0.03°. X-ray diffraction (XRD) patterns of the recovered catalysts and USY were recorded using a different X-ray powder diffractometer (Bruker AXSD8 advance) with similar settings.
The sulfided catalysts were characterized by X-ray Photoelectron Spectroscopy (XPS) using a Perkin Elmer PHI 5000 VersaProbe III Scanning XPS Microprobe. In an ultra-high vacuum chamber, the sample was exposed to a monochromatic Al-Kα source of high binding energy (1486.6 eV) and the photoelectrons thus emitted were detected by the energy analyzer. High resolution core level spectra for Ni2p, Mo3d, O1s, S2p, and C1s were recorded with steps of 0.10 eV. Casa XPS was used to analyze the data with C1s binding energy of 284.6 eV as the reference. The deconvolution of the spectra was performed using a Shirley background.
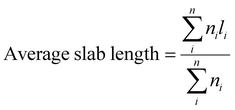
The scanning transmission electron microscopy (STEM) images were obtained with an FEI Titan 80-300 TEM operated at 300 kV using a high angle annular dark field (HAADF) detector. The acquisition of the spectrum and the data analysis were done by TEM imaging and analysis (TIA) software. ImageJ software was used to measure the morphology of the Ni-promoted MoS2 crystallites. At least 500 slabs were considered to calculate the average slab length and stacking degree using the following expressions:43
where ni is the number of slabs with the length li and Ni is the number of layers in slab i. Additionally, the MoS2 dispersion (fMo) was estimated using the following expression where the MoS2 slabs are considered to have an ideal hexagon shape.34
where, Moedge denotes the edge Mo atoms in MoS2 slabs, Mototal is the total Mo atoms, ni the edge Mo atoms in one MoS2 slab determined from its length, L = 3.2(2ni − 1) Å, and m denotes the total slabs considered.
Results and discussion
Catalyst characterization
The textural properties of the synthesized and sulfided catalysts are listed in Table 1. The total and external specific surface areas and mesopore volume increase with the increasing Si/Al ratio of the catalyst supports. A decrease in the total pore volume (Vp) in the NiMo sample compared to that of the parent zeolites indicates a partial pore blockage. This occupation of the pores of the zeolite supports subsequently results in a substantial decrease in the specific surface areas and the pore diameter (dp) of the NiMo-loaded materials in comparison with their respective zeolite supports (Table 1). N2 adsorption isotherms and BJH pore size distribution data for each support and impregnated catalyst are given in the ESI (Fig. S1†) sulfur contents for the sulfided catalysts are above the theoretical amount (7.7 wt%) needed for the catalyst to be in the fully sulfided form. However, excess elemental sulfur can further impede the pores and can be removed easily by sulfided NiMo catalyst during hydrotreatment.44| Catalyst | Elemental composition, wt% | N2 physisorption | ||||||
|---|---|---|---|---|---|---|---|---|
| SiO2/Al2O3b | Mo | Ni | S | S a,total, (m2 g−1) | S a,external, (m2 g−1) | V p,total (Vp,meso), (cm3 g−1) | d p, (Å) | |
| a S a = BET surface area, Vp = pore volume, dp = average pore sizes for mesopores, b = given by Zeolyst international. | ||||||||
| Y12 | 12 | — | — | — | 670 | 136 | 0.46 (0.20) | 47.7 |
| NiMoY12 | — | 12.8 | 4.9 | 8.6 | 291 | 87 | 0.26 (0.16) | 37.3 |
| Y30 | 30 | — | — | — | 808 | 244 | 0.53 (0.27) | 46.9 |
| NiMoY30 | — | 12.4 | 4.6 | 9.8 | 435 | 96 | 0.33 (0.18) | 44.3 |
| Y80 | 80 | — | — | — | 815 | 298 | 0.54 (0.30) | 41.0 |
| NiMoY80 | — | 13.4 | 4.5 | 9.8 | 462 | 164 | 0.33 (0.20) | 38.6 |
NH3-TPD profiles of both zeolite supports and NiMo-USY materials are shown in Fig. 2 and the quantities of NH3 desorbed are summarized in Table 2. It is evident from Table 2 that the total acidity of the supports and impregnated catalysts decrease proportionally with increasing the SAR ratio due to dealumination. The evolution of NH3 desorption peaks at different temperatures (see Fig. 2 and S2†) reveals the presence of different acidic sites.43,45 As shown in Fig. 2, the NH3-TPD profiles of all the supports/resulting catalysts exhibit three distinct temperature zones for ammonia desorption, namely at low temperature (<250 °C), medium temperature (250–400 °C), and high temperature (>400 °C). The low-temperature peaks (Fig. 2) can be ascribed to weakly bound physisorbed ammonia which can greatly be influenced by the flow conditions.46,47 It is worth mentioning that the NH3-TPD profile is also influenced by particle sizes, diffusion, and re-adsorption effects.48 However, the support Y30 clearly shows a fraction of stronger acid sites (>400 °C) of 55% which is greater than those for Y12 (40%) and Y80 (37%) samples (Table 2). Also, for all catalysts, the introduction of Mo and Ni to the USY structures leads to a substantial reduction in the strong acidic sites to moderate strength sites. This could be due to the possible exchange of Ni/Mo species with acidic protons or hindering of the micropore structure via impregnation. The resultant NiMoY12/NiMoY30/NiMoY80 possess a dominant fraction (54–61%) of the moderate strength acid sites in the range of 250–400 °C. The number of total acidic sites was found to be in the decreasing order of NiMoY12 > NiMoY30 > NiMoY80, which corresponds to the ranking for the parent zeolites. Besides, the Brønsted acid site density was measured using (C2H5NH2)-TPD (Fig. S3†), and the results are shown in Table 2. The Brønsted acid site densities are 368, 324, and 202 μmol g−1 for NiMoY12, NiMoY30, and NiMoY80, respectively. This indicates that the Brønsted acid site density decreases with an increase in SAR, as expected. Note that the relationship between the Brønsted acid site density and SAR is linear as shown in Fig. S3.† Furthermore, the Brønsted acid site density of the support materials follows a similar trend. However, higher reduction in Brønsted acid site density is seen for NiMoY12 compared to NiMoY30 and NiMoY80 resulting from the metal impregnation indicating plausible metal–acid exchange during the impregnation. Also, the differences in the desorption patterns during (C2H5NH2)-TPD can be attributed to diffusion differences in the parent and metal impregnated zeolites.
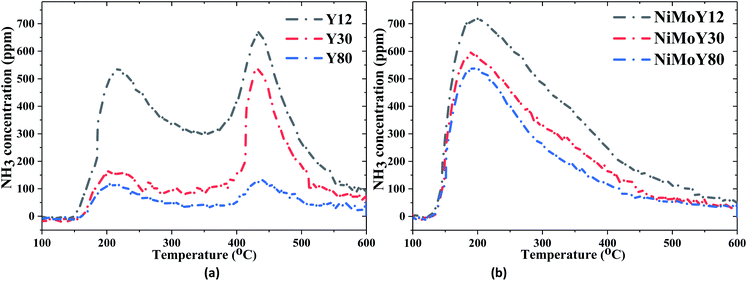 | ||
| Fig. 2 NH3 intensity during the desorption of NH3-TPD for (a) USY zeolites, (b) NiMo impregnated USY zeolites. | ||
| Catalyst | Total acidity (NH3-TPD), (μmol g−1) | Relative aciditya (%) | Brønsted acidity (C2H5NH2-TPD), (μmol g−1) | ||
|---|---|---|---|---|---|
| ≤250 °C | 250–400 °C | >400 °C | |||
| a Relative acidities are based on the total acidity of each catalyst. | |||||
| Y12 | 684 | 23 | 37 | 40 | 549 |
| NiMoY12 | 686 | 38 | 54 | 8 | 368 |
| Y30 | 415 | 18 | 27 | 55 | 386 |
| NiMoY30 | 571 | 34 | 61 | 5 | 324 |
| Y80 | 242 | 27 | 36 | 37 | 221 |
| NiMoY80 | 477 | 38 | 59 | 3 | 202 |
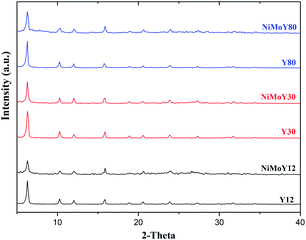
The XRD patterns for the parent zeolites and the resulting catalysts after calcination are shown in Fig. 3. Only the reflections of the parent zeolite are observed over each NiMo-USY sample. The 2θ values of 6.3°, 10.3°, 12.1°, 15.9°, 18.9°,20.7°, 23.2°, 24.1°, 27.4°, and 31.7° correspond to the characteristic diffraction peaks of the (111), (220), (311), (331), (333), (440), (620), (533), (642) and (555) planes respectively of the parent USY zeolites.49,50 The absence of a distinct diffraction peak for the oxide crystallites of Ni and Mo indicates that both are well dispersed in all the samples. In our previous work, we have observed a partial loss in the crystallinity due to metal impregnation.34 However, as is the case here, the Y-zeolite structure was preserved after being loaded with Ni and Mo oxides. It is noticed that diffraction signal with a 2θ value of 6.3°, reduces for all of the impregnated catalysts (NiMoY12/NiMoY30/NiMoY80). Indeed, this reduction is higher for NiMoY12. This is due mainly to metal impregnation causing some amorphization of the metal-loaded Y-zeolite framework and thus lower crystallinity.
XPS analysis confirms that Mo was mostly in the Mo4+ state and Ni was in the Ni2+ state (Fig. 4a and S4a†) in their sulfided forms. The deconvolution of the Mo3d spectra (Fig. 4a) revealed the presence of Mo4+ (228.6 ± 0.1 eV, MoS2), Mo5+ (229.7 ± 0.1 eV, Mo-oxysulfides), and Mo6+ (232.2 ± 0.1 eV) species.34 Similarly, the deconvolution of Ni 2p spectra (Fig. S4a†) indicated the presence of NiSx, NiMoS, and Ni2+ species at 852.8 ± 0.1, 854.3 ± 0.1, and 856 ± 0.2 eV binding energies respectively.34 Overall, over 85% of Mo was present as sulfided species (Mo4+ and Mo5+) with some small variation in the Mo4+ contribution as shown in Table 3. However, some superfluous oxidation may occur while transferring the sample to the XPS chamber, which could cause some underestimation of the sulfidation degree. Deconvolution of S2p (Fig. S4b†) reveals the presence of metal sulfides with a characteristic doublet at 161.5 ± 0.2 and 162.7 ± 0.2 eV. Furthermore, deconvolution of Ni2p (Fig. S4a†) shows a higher fraction of NiSx and Ni2+ over NiMoY12 than NiMoS compared to NiMoY30 and NiMoY80. More Ni2+ could be due to the exchange of Brønsted site with Ni for the low SAR catalyst while it is less for the others. This is consistent with the Bronsted acidity measurements for the parent and impregnated catalysts (Table 2).
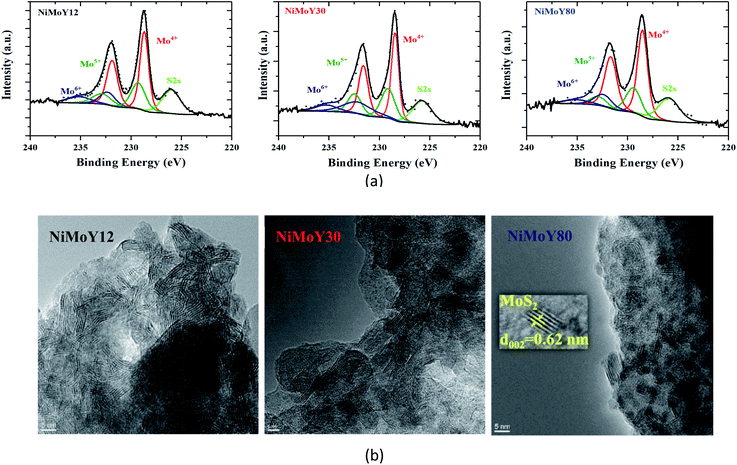 | ||
| Fig. 4 (a) Deconvolution of core level Mo3d spectra for NiMoY12, NiMoY30, and NiMoY80, (b) HR-TEM images of Ni promoted MoS2 over ultra-stable Y zeolites. | ||
| Catalyst | Mo sulfidation (%) | Average slab length (nm) | Average stack number | MoS2 dispersion (fMo) | ||
|---|---|---|---|---|---|---|
| Mo4+ | Mo5+ | Mo6+ | ||||
| NiMoY12 | 82 | 11 | 7 | 4.8 | 4.0 | 0.23 |
| NiMoY30 | 75 | 14 | 11 | 4.2 | 4.0 | 0.26 |
| NiMoY80 | 77 | 11 | 12 | 4.6 | 3.8 | 0.24 |
TEM micrographs (Fig. 4b) show the typical layered structure of Ni promoted MoS2 crystallites with a characteristic interlayer distance of 0.62 nm.44 The presence of Ni has been confirmed via bright field TEM micrograph and Energy dispersive X-ray analysis (Fig. S5b†) The decoration of slab distribution and stacking degree varies (Fig. S5a†) among the catalysts while there is only a small variation in the average values of slab length, stacking, and dispersion (fMo) as shown in Table 3. This infers that MoS2 dispersion over the various acidic supports varies only to a small extent perhaps due to the variation in the textural properties/acidities of the catalyst. However, the results indicate that the NiMoY30 sample may have a slightly higher dispersion with shorter slab lengths and analogous stacking. It is important to note that higher values of fMo imply more available edge and corner active sites in the ideal hexagonal shape of the MoS2 slabs. Increasing SAR to 80 seems to have little influence on the dispersion value.
HDO of 2-phenylethyl phenyl ether (PPE)
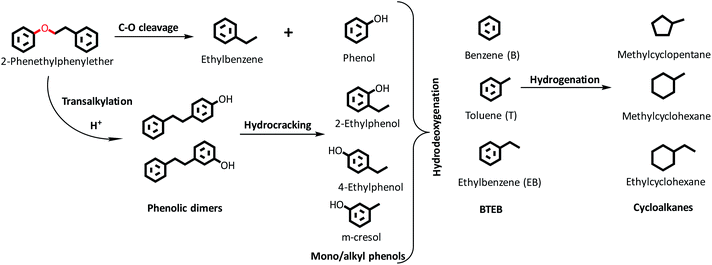
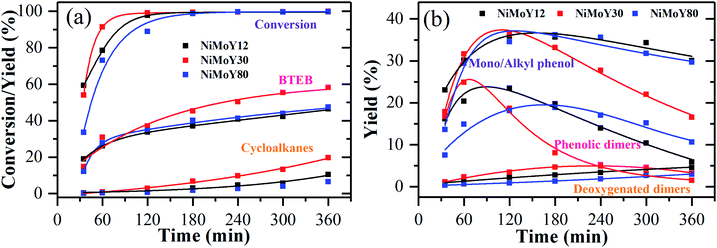
HDO of PPE and aryl ethers51 has been studied earlier to illustrate the cleavage of the dominant β-O-4/ether linkage in native lignin over noble (e.g. Ru/sulfate zirconia) and transition metal-based (e.g. FeMoP) catalysts.20,52,53 In the present work, we focus on the effect of varying SAR for NiMoS-USY zeolites. Scheme 1 presents a simplified reaction pathway and Fig. 5 shows the time profile of the reactions during the HDO of PPE. At the reaction conditions, catalytic hydrogenolysis of the Cβ–O-4 bond in PPE first yields ethylbenzene, phenol, and phenolic dimers simultaneously in two pathways as shown in Scheme 1. Such a dimer formation is due to transalkylation reactions in the presence of acidic catalysts.26,54 The yields of these primary products/intermediates increase as PPE becomes fully converted. There were variations in the rate of increase of PPE conversion, where NiMoY30 had already reached nearly 100% conversion at 120 min and the other two after 180 min. Similar experiments with Y30 give only 85% conversion of PPE after 360 min of reaction and yield 51% phenolic dimers (Fig. S6†). The rate of initial C–O hydrogenolysis over Y30 was found to be half the rate of initial transalkylation (Table S1†). NiMo impregnation on Y30 augments the direct C–O cleavage to ethylbenzene and phenol (Table S1†). Also, the turnover frequency (TOF) based on the total acidity at 35 minutes for NiMoY30 is almost five times higher than that for Y30 due to the low rate of hydrogenolysis on the latter. The initial rate of direct C–O cleavage is higher for NiMoY12 than the other catalysts. The initial transalkylation rate (phenolic dimer formation) measured at 35 minutes follows the trend NiMoY12 ≈ NiMoY30 > NiMoY80 (Table S1†). This ethylene-linked (β-1, C–C bond) phenolic dimer undergoes an acid-induced hydrocracking reaction (C–C cleavage) to yield alkyl (methyl/ethyl) phenols, benzene, and toluene. This is an interesting observation as reported earlier by our group at lower temperatures.34 It is worth mentioning that ethylphenols/benzene and phenolic dimers can also be formed via a transalkylation/recombination reaction between phenol and ethylbenzene to some extent. Phenolic dimers are also converted to a lesser degree to bibenzyl (<5%, not shown in Scheme 1), deoxygenated dimers via HDO. For comparison, mono/alkyl phenols, phenolic dimers, and deoxygenated dimers are plotted in Fig. 5b to illustrate the progress of their evolution.The mono/alkyl (methyl/ethyl) phenols thus formed undergo simultaneous HDO and hydrogenation reactions to give a mixture rich in benzene, ethylbenzene, and methylcyclopentane. A small amount of toluene, methyl-cyclohexane, and ethyl cyclohexane also appear.
It is evident from Fig. 5b that the degree of phenolic dimer hydrocracking and the HDO of phenolics proceeds at a faster rate over NiMoY30, leading to the formation of less residual dimers, mono/alkyl phenol intermediates, and higher yields of deoxygenated monoaromatics-benzene (B), toluene (T), and ethylbenzenes (EB) and cycloalkanes. A similar NiMoS supported over C yielded 44% benzene and ethylbenzene after 2 h of reaction using 2-phenoxy 1-phenyl ethanol at 300 °C and 50 bar of initial H2 pressure.32 Improved formation of BTEB during the reaction is due to the high amount of benzene formation from the hydrocracking/transalkylation reactions. A minor degree of disproportionation of ethylbenzene yielded a small amount of diethylbenzene (∼2%) in the final product spectrum (not shown in Scheme 1). Also, traces of coking precursors e.g. phenanthrene/anthracene were also detected for all the catalysts. Previous studies based on such β-O-4 model compounds showed a variation in the product distribution from phenolic monomers to bio-arenes and cycloalkanes depending on the chosen catalytic system.16,55,56 Rensel et al.53 showed FeMoP catalyst selectively yields of 82% benzene/ethylbenzene using PPE at 400 °C, 42 bar of H2. Song et al.56 reported ∼90% yields (at ∼100% PPE conversion in 5 h) of such arenes over a sulfided CoMo supported on sulfated ZrO2. In contrast, a combination of Ru/H-Beta, Pd/C, and HZSM in the aqueous phase produces predominantly cycloalkanes.21,27 Jongerius et al.57 identified 33% of phenolics from a synthesized β-O-4 model dimer after HDO at 300 °C for 4 h over sulfided CoMo/Al2O3. In this study, for PPE we obtained ∼60% bio-arenes and ∼20% cycloalkanes over NiMoY30 with substantial hydrocracking reactions of β-1 linked phenolic dimers.
The underlying reason for higher C–O hydrogenolysis, C–C hydrocracking of phenolic dimers, and HDO activity over NiMoY30 can be possibly attributed to its moderate acidity (see Table 2), better pore accessibility of the reactants/intermediates compared to NiMoY12 (see dp in Table 1), and the slightly higher dispersion of Ni-promoted MoS2 over NiMoY30 (see Table 3). The high amount of Brønsted acidic sites (BAS) in NiMoY12 promotes C–O hydrogenolysis and transalkylation over the HDO leading to faster initial PPE conversion (see Fig. 5). On the other hand, overall lower BAS of NiMoY80 resulted in the least transalkylation, slower conversion of PPE, and PPE-derived phenolic dimers. Nevertheless, the extent of HDO reactions was similar to NiMoY12, yielding an analogous amount of deoxygenated products. This signifies that the number and pore accessibility to the acid sites are important parameters that can be tuned to improve the upgrading processes. Also, a suitable balance between acid sites and deoxygenation sites or so-called coordinately unsaturated sites (CUS) in supported transition metal sulfides is crucial. The textural properties listed in Table 1 show the differences in pore sizes of especially the mesopores. The higher mesopore volume in NiMoY30/NiMoY80 enhanced the pore accessibility of intermediates to deoxygenation sites, while reduced pore accessibility in NiMoY12 resulted in slower evolution of HDO products.
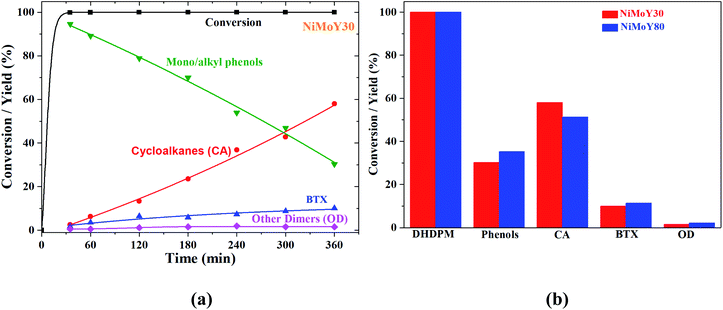
HDO of 4,4-dihydroxydiphenylmethane (DHDPM)
4,4-Dihydroxydiphenylmethane (DHDPM) is a methylene-linked C–C phenolic dimer that is reported to be present in lignin-derived bio-oil.58Fig. 6a shows the progress of the evolution of the products and intermediates during the conversion of 4,4-dihydroxydiphenylmethane (DHDPM) over NiMoY30. Based on their evolution, a reaction scheme has been proposed in Scheme 2. Interestingly, fast acid-induced cleavage of Csp3–Csp2 bonds in DHDPM yielded ∼99% conversion of the feed in the first 35 minutes of reaction (GC-MS spectra in Fig. S7 of the ESI†). This primarily yields aromatic monomers consisting of phenols and cresols with a very high yield (>90%) in about 30 min. Similar cleavage product yields have been reported earlier by Shuai et al.31 using methylene-linked C–C model dimers with commercial CoS2 catalysts. To the best of our knowledge, this is the first reported cleavage of DHDPM over NiMoY at the chosen condition. The resultant phenols and cresols undergo isomerization and transalkylation reactions inside the zeolite pores and yield other alkylphenols, e.g. 2,4-dimethylphenol (Scheme 2). During the reaction, these intermediates (termed as mono/alkylphenol) undergo hydrodeoxygenation and hydrogenation reactions over the promoted sulfided catalysts to yield a mixture of hydrocarbons with residual phenolics after 360 min of reaction. The apparent rate of C–C cleavage seems independent of the investigated SAR (NiMoY30 and NiMoY80), acidic sites, and their strength since there is little variation in the conversion of DHDPM for NiMoY30 and NiMoY80. However, differences in their acidity result in small differences in the subsequent processes to yield differences in product distributions shown in Fig. 6b.The hydrocarbon fraction obtained after 360 min is composed mainly of cycloalkanes (CA) and BTX. Methylcyclopentane (MCP), methylcyclohexane (MCH), dimethylcyclopentane are the dominant products in CA (Fig. 6b). CA and BTX products gradually increase with the conversion of phenolics. A small number of other dimers (∼2%) mainly xanthene and its derivatives, 2,2′-methylene diphenyl, diphenyl ether, etc., have also been detected during the reaction.
HDO of 2-phenylphenol (2PP)
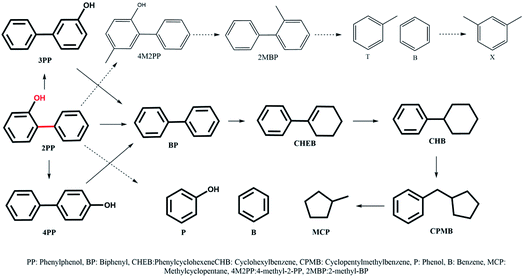
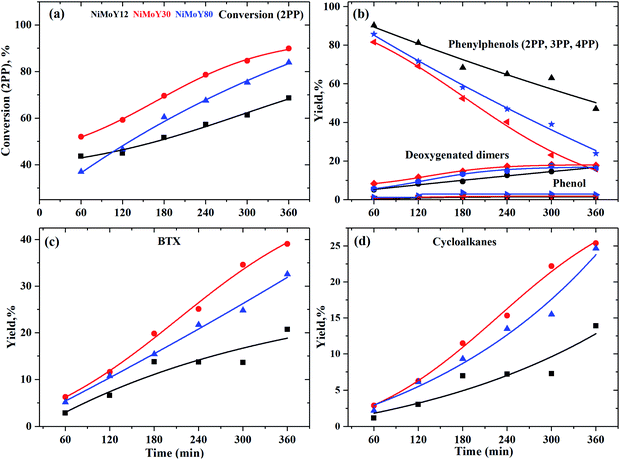
The most inert linkage in lignin is the typical interunit, 5-5′, C–C linkage. We have discussed above how the β-1 and methylene linked C–C bond in model dimers can be effectively cleaved with the NiMo-USY combination. Thus, the catalysts have further been tested with the recalcitrant 5–5' linkages mimicked with 2PP. The results are shown in Scheme 3 and Fig. 7. Direct cleavage of the sp2 C–C in 2PP to phenol and benzene occurs to a very small extent. Rather 2PP isomerizes hastily to form predominantly 3-phenylphenol (3PP) and 4-phenylphenol (4PP) yielding largely phenylphenols (including 2PP in Fig. 7a) at the beginning. These phenylphenols undergo a cascade of HDO, hydrogenation, and hydrocracking reactions to yield primarily biphenyl (BP), phenylcyclohexene (CHEB), cyclohexylbenzene (CHB), cyclopentylmethylbenzene (CPMB), benzene (B), and methylcyclopentane (MCP). A similar product spectrum has been reported for dibenzofuran HDO over a Pt and NiMo based catalyst.59–62 However, the interesting phenomenon is the formation of a higher amount of benzene and methylcyclopentane as the cracking products for this feed. Based on their evolution a reaction scheme is proposed in Scheme 3. To a lesser degree alkylation of 2PP to 4-methyl 2PP (4M2PP, ∼1.5%) and successive deoxygenation giving 2-methylbiphenyl (2MBP, ∼1%) also occurred. All the deoxygenated dimeric products are plotted together in Fig. 7b. Hydrocracking of 2MBP yielded a small amount of benzene (B), toluene (T), and xylenes (X). The initiation of such an alkylation reaction is not fully understood. However, it could be due to the formation of carbenium ions from the hydrocracking reaction of the solvent dodecane.63 Unlike the other reactants, 2PP conversion is rather slow. Around 90% conversion of 2PP and the lowest remaining yield of phenylphenols (2-, 3- and 4PP) was observed with NiMoY30 after 360 min of reaction (Scheme 3). Least conversion but high isomerization of 2PP to 3PP was observed with NiMoY12 owing to its high acid site density. The degree of conversion and deoxygenation/hydrogenation/hydrocracking reactions increases with the extended reaction time. Intermediate dimers, CHEB, and CHB were present in low quantities as they converted to CPMB which cracks rapidly to yield a high amount of benzene and MCP. Overall, a higher yield of BTX and cycloalkanes were observed with NiMoY30 (Fig. 7c and d). NiMoY80 with a SAR of 80 displayed a higher degree of HDO and hydrocracking reactions than NiMoY12. These results further imply that the density, accessibility to acidic/deoxygenation site, pore geometry, and steric hindrance of the incoming molecules to the nanosized zeolite pore play crucial roles during the upgrading process. With this C–C bond model compound compared to 2PPE, it seemed that the higher mesopore volume offered by NiMoY80 (see Table 1) was more important than the higher acid site density of NiMoY12 for promoting higher yields of monoaromatics and cycloalkanes.Characterization of the recovered catalysts
Pristine Y-zeolites and ultra-stable Y zeolites have been demonstrated to be sensitive to thermal, acid, and alkaline treatment to varying degrees.64 A regular Y zeolite with SAR of 5.1 shows structure deterioration even after calcination in air at 550 °C for 6 h (Fig. S8†). The X-ray diffractions of the catalysts recovered after the sulfidation (340 °C, 25 bar) and reaction with PPE (345 °C, 50 bar) are compared with their parent Y zeolites (Fig. S9†). The crystalline structure of USY is mostly preserved, however with a slight loss in intensity of the diffraction peak. This could be due to the surface deposition of amorphous carbon and elemental sulfur (S2s in Fig. 4a) from the sulfidation.It is also worth mentioning that carbon deposition on the catalyst can affect the catalytic activity with longer times on stream. Indeed, coking is one of the major deactivation routes of heterogeneous catalysts during hydrotreatment reactions.65,66 Hence, after each of the activity experiments, the carbon content on the recovered catalyst was measured and listed in Table 4. No direct correlation can be made for the carbon content obtained after 360 min of the hydrotreating reactions. However, for DHDPM the carbon content was higher over NiMoY30, possibly due to side reactions involving the reaction intermediates. For PPE and 2PP, the small variations in the carbon content cannot be correlated to the differences in the acidity or the yields of the products/intermediates formed. The hydrogen and S content on the recovered catalysts have only minor variations. Additionally, the C to H mass ratio can be correlated to carbonaceous deposits present over the catalytic surface.67 Based on Table 4, the C to H mass ratios were found to be in the range of 4–8. This suggests that it is the presence of strongly adsorbed products and intermediates that largely make up the carbonaceous deposits. In addition, anthracenes/phenanthrenes can be present to a minor degree which have been observed in the liquid phase to a very small extent. Additional carbon can however affect the porous structure and hinder access to the active sites for the desire reactions to occur.
| Catalyst | Freshly sulfided | After DHDPM test | After PPE test | After 2PP test | ||||||||
|---|---|---|---|---|---|---|---|---|---|---|---|---|
| C | H | S | C | H | S | C | H | S | C | H | S | |
| NiMoY12 | 0.4 | 0.6 | 8.6 | — | — | — | 5.5 | 0.9 | 8.3 | — | — | — |
| NiMoY30 | 1.0 | 0.9 | 9.8 | 7.3 | 0.9 | 8.2 | 4.9 | 0.6 | 9.6 | 4.6 | 0.7 | 8.9 |
| NiMoY80 | 1.5 | 0.9 | 9.8 | 3.8 | 0.8 | 9.1 | 6.3 | 0.7 | 8.9 | 4.4 | 0.8 | 9.3 |
Overall, based on the catalyst characterization and model compound reactivity data it is observed that NiMoY30 outperforms NiMoY12 and NiMoY80. From the textural properties (Table 1), it is clear that the total pore volume and mesopore volume increase with increasing the silica/alumina ratio of the parent zeolites. After the impregnation with NiMo, the pore volume decreases by the same extent for all samples, while the highest surface area reduction is observed for NiMoY12. This likely imposes higher mass transfer limitations for the reactants and intermediates to reach the active sites compared to NiMoY30 and NiMoY80 that have higher BET surface areas and better pore accessibility (Fig. S1†). On the other hand, the acidity of the catalysts also plays a distinct role. It has been observed that the resulting catalysts have total and Brønsted acid densities in the order of NiMoY12 > NiMoY30 > NiMoY80, corresponding to an increasing SAR ratio. We have demonstrated via reactivity of the model compound that the high surface acidity catalyst (NiMoY12) influences the initial rate of reaction for PPE (2-phenylethyl phenyl ether), isomerization reaction of 2PP (2-phenylphenol) while NiMo30 displays better reactivity. We correlate this result to the premise that the NiMoY30 offers the best trade-off between the benefits of acidity but also with good pore accessibility.
In addition, according to high resolution-TEM images (Fig. 4b, Table 3, and Fig. S5a†), it is evident that the sulfided NiMoY30 shows slightly better dispersion of Ni promoted MoS2 slabs and their stacking. This gives more accessible corner and edge sites of the Ni promoted MoS2 slabs towards the reactants. Hence the proximity of acidic site and Ni promoted MoS2 is expected to be better for NiMoY30.
Catalytic activity with Kraft lignin
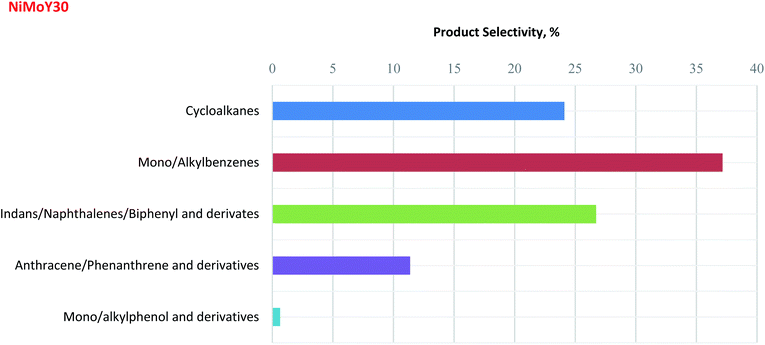
Inspired by the enhanced catalytic activity of NiMoY30, an experiment with Kraft lignin (KL) was performed as described in Section 2.2.2. The focus was placed on a detailed analysis of the upgraded lignin oil liquid fraction using 2D GCxGC-MS/FID analysis (see details in the ESI†) to correlate the results obtained from the model reaction. It should be noted that char formation was also observed. The 2D GCxGC chromatogram for this KL hydrotreatment experiment is presented in Fig. S10.†The liquid phase detectable product selectivities for NiMoY30 are shown in Fig. 8. This one-pot process involving simultaneous reductive depolymerization and hydrodeoxygenation was able to selectively produce cycloalkanes (∼24%) and aromatics (∼76%) in the liquid phase. The selectivity for deoxygenated mono/alkylbenzene products (∼37%) is three times higher than the trimer products (e.g. anthracenes/phenanthrenes, ∼11%), indicating considerable cleavage of both C–O and C–C bonds present in the lignin. A substantial amount of indans, naphthalenes, and biphenyls and their derivatives (∼26%) was also identified. The low selectivity for monomeric alkylphenol and its derivatives (<1%) after 5 h of hydrotreatment indicates the high HDO activity of NiMoY30 which is analogous to the results obtained from the model reactions as discussed above. The current results demonstrate that NiMoY30 can effectively cleave the interunit C–O and C–C bonds present in KL producing an upgraded lignin liquid product that is rich in deoxygenated aromatics and cycloalkanes.
Conclusions
In this study, it is demonstrated that lignin dimers having β-O-4 and C–C linkages can be upgraded to deoxygenated monoaromatics and monocyclic compounds via effective cleavage of etheric C–O and C–C linkages over a series of NiMoS-USY zeolites. NiMoY30 (SAR = 30) seems to be the most effective catalyst for cleaving both linkages which can be attributed to the proximity between acidic and deoxygenation sites (Ni-promoted MoS2 slabs) being suitably balanced. In addition, a trade-off between the benefits of acidity and pore accessibility plays a significant role. It was also found that high surface acidity influences the initial conversion of PPE and 2PP via transalkylation and isomerization reactions. A high rate of transalkylation was observed for the β-O-4 model dimer with low SAR catalysts (NiMoY30/NiMoY12) while it was least for the higher SAR catalyst (NiMoY80). A high degree of hydrogenolysis, hydrocracking, and hydrodeoxygenation reactions were observed with NiMoY30 for all model dimers. Interestingly, hydrocracking of methylene-linked dimers occurs very fast. For both β-1 and methylene-linked dimers, C–C cleavage occurs directly via hydrogenolysis while for the 5–5′ linkage (2PP), C–C cleavage was followed by isomerization, deoxygenation, and ring-hydrogenation. The product spectrum was largely composed of deoxygenated aromatics and cycloalkanes with residual mono/alkyl phenolics. The carbon content on the recovered catalyst was in the range of 3–7 wt%. Overall, the results demonstrate the possibility to tune ultra-stable Y-zeolite acidity and pore sizes when impregnated with NiMoS to enhance the hydrodeoxygenation activity for upgrading lignin-based feedstocks. A one-pot experiment with Kraft lignin hydrotreatment over NiMoY30 shows good depolymerization and efficient deoxygenation toward the formation of deoxygenated aromatics and cycloalkanes in the liquid phase.Conflicts of interest
There are no conflicts of interest to declare.Acknowledgements
This work is performed at the Competence Centre for Catalysis (KCK) and the division of Chemical Engineering at Chalmers University of Technology. We would like to acknowledge the Swedish Energy Agency (Contract: 2016-08330) and Formas (2017-01392) for financial support. We would also like to acknowledge Stefan Gustafsson for his help with TEM analysis.References
- W. Schutyser, T. Renders, S. Van den Bosch, S. F. Koelewijn, G. T. Beckham and B. F. Sels, Chem. Soc. Rev., 2018, 47, 852–908 RSC
.
- F. Cheng and C. E. Brewer, Renewable Sustainable Energy Rev., 2017, 72, 673–722 CrossRef CAS
.
- J. Zakzeski, P. C. A. Bruijnincx, A. L. Jongerius and B. M. Weckhuysen, Chem. Rev., 2010, 110, 3552–3599 CrossRef CAS PubMed
.
- P. Yan, M. M.-J. Li, E. Kennedy, A. Adesina, G. Zhao, A. Setiawan and M. Stockenhuber, Catal. Sci. Technol., 2020, 10, 810–825 RSC
.
- X. Zhang, W. Tang, Q. Zhang, T. Wang and L. Ma, Appl. Energy, 2018, 227, 73–79 CrossRef CAS
.
- Y. W. Cheah, M. A. Salam, P. Arora, O. Öhrman, D. Creaser and L. Olsson, Sustainable Energy Fuels, 2021, 5, 2097–2113 RSC
.
- Z. Luo, Z. Zheng, Y. Wang, G. Sun, H. Jiang and C. Zhao, Green Chem., 2016, 18, 5845–5858 RSC
.
- Q. Tan, G. Wang, A. Long, A. Dinse, C. Buda, J. Shabaker and D. E. Resasco, J. Catal., 2017, 347, 102–115 CrossRef CAS
.
- C. Zhao, J. He, A. A. Lemonidou, X. Li and J. A. Lercher, J. Catal., 2011, 280, 8–16 CrossRef CAS
.
- Y.-K. Hong, D.-W. Lee, H.-J. Eom and K.-Y. Lee, Appl. Catal., B, 2014, 150–151, 438–445 CrossRef CAS
.
- M. Talibi, P. Hellier and N. Ladommatos, Fuel, 2018, 216, 579–588 CrossRef CAS
.
- J. García-Martínez, M. Johnson, J. Valla, K. Li and J. Y. Ying, Catal. Sci. Technol., 2012, 2, 987–994 RSC
.
- S. Echeandia, B. Pawelec, V. L. Barrio, P. L. Arias, J. F. Cambra, C. V. Loricera and J. L. G. Fierro, Fuel, 2014, 117, 1061–1073 CrossRef CAS
.
- M. Williams, B. Fonfe, C. Sievers, A. Abraham, J. Vanbokhoven, A. Jentys, J. Vanveen and J. Lercher, J. Catal., 2007, 251, 485–496 CrossRef CAS
.
- S. Gillet, M. Aguedo, L. Petitjean, A. R. C. Morais, A. M. da Costa Lopes, R. M. Łukasik and P. T. Anastas, Green Chem., 2017, 19, 4200–4233 RSC
.
- J. Zhang, J. Sun and Y. Wang, Green Chem., 2020, 22, 1072–1098 RSC
.
- J. He, L. Lu, C. Zhao, D. Mei and J. A. Lercher, J. Catal., 2014, 311, 41–51 CrossRef CAS
.
- Z. Luo and C. Zhao, Catal. Sci. Technol., 2016, 6, 3476–3484 RSC
.
- J. He, C. Zhao and J. A. Lercher, J. Am. Chem. Soc., 2012, 134, 20768–20775 CrossRef CAS PubMed
.
- C. Zhu, J.-P. Cao, X.-B. Feng, X.-Y. Zhao, Z. Yang, J. Li, M. Zhao, Y.-P. Zhao and H.-C. Bai, Renewable Energy, 2021, 163, 1831–1837 CrossRef CAS
.
- C. Zhao and J. A. Lercher, ChemCatChem, 2012, 4, 64–68 CrossRef CAS
.
- W. Zhang, J. Chen, R. Liu, S. Wang, L. Chen and K. Li, ACS Sustainable Chem. Eng., 2014, 2, 683–691 CrossRef CAS
.
- H. Lee, H. Kim, M. J. Yu, C. H. Ko, J. K. Jeon, J. Jae, S. H. Park, S. C. Jung and Y. K. Park, Sci. Rep., 2016, 6, 28765 CrossRef CAS PubMed
.
- D. Y. Hong, S. J. Miller, P. K. Agrawal and C. W. Jones, Chem. Commun., 2010, 46, 1038–1040 RSC
.
- S. Kim, E. E. Kwon, Y. T. Kim, S. Jung, H. J. Kim, G. W. Huber and J. Lee, Green Chem., 2019, 21, 3715–3743 RSC
.
- X. Zhu, L. L. Lobban, R. G. Mallinson and D. E. Resasco, J. Catal., 2011, 281, 21–29 CrossRef CAS
.
- G. Yao, G. Wu, W. Dai, N. Guan and L. Li, Fuel, 2015, 150, 175–183 CrossRef CAS
.
- S. Guadix-Montero and M. Sankar, Top. Catal., 2018, 61, 183–198 CrossRef CAS
.
- M. Murakami and T. Matsuda, Chem. Commun., 2011, 47, 1100–1105 RSC
.
- J. Zakzeski and B. M. Weckhuysen, ChemSusChem, 2011, 4, 369–378 CrossRef CAS PubMed
.
- L. Shuai, J. Sitison, S. Sadula, J. Ding, M. C. Thies and B. Saha, ACS Catal., 2018, 8, 6507–6512 CrossRef CAS
.
- S. Mukundan, L. Atanda and J. Beltramini, Sustainable Energy Fuels, 2019, 3, 1317–1328 RSC
.
- A. Yamaguchi, N. Mimura, M. Shirai and O. Sato, Sci. Rep., 2017, 7, 46172 CrossRef CAS PubMed
.
- M. A. Salam, P. Arora, H. Ojagh, Y. W. Cheah, L. Olsson and D. Creaser, Sustainable Energy Fuels, 2020, 4, 149–163 RSC
.
- K. Sato, Y. Nishimura, K. Honna, N. Matsubayashi and H. Shimada, J. Catal., 2001, 200, 288–297 CrossRef CAS
.
- M. O. Kazakov, K. A. Nadeina, I. G. Danilova, P. P. Dik, O. V. Klimov, V. Y. Pereyma, E. Y. Gerasimov, I. V. Dobryakova, E. E. Knyazeva, I. I. Ivanova and A. S. Noskov, Catal. Today, 2018, 305, 117–125 CrossRef CAS
.
- B. M. Santos, W. Zhao, J. L. Zotin, M. A. P. d. Silva, L. Oliviero and F. Maugé, J. Catal., 2021, 396, 92–103 CrossRef CAS
.
- Z. Cao, X. Zhang, C. Xu, X. Huang, Z. Wu, C. Peng and A. Duan, J. Energy Chem., 2021, 52, 41–50 CrossRef
.
- D. Kubička, N. Kumar, P. Mäki-Arvela, M. Tiitta, V. Niemi, T. Salmi and D. Y. Murzin, J. Catal., 2004, 222, 65–79 CrossRef
.
- M. Abdus Salam, D. Creaser, P. Arora, S. Tamm, E. Lind Grennfelt and L. Olsson, Catalysts, 2018, 8, 418 CrossRef
.
- P. Arora, H. Ojagh, J. Woo, E. Lind Grennfelt, L. Olsson and D. Creaser, Appl. Catal., B, 2018, 227, 240–251 CrossRef CAS
.
- H. Ojagh, D. Creaser, M. A. Salam, E. L. Grennfelt and L. Olsson, Fuel Process. Technol., 2019, 190, 55–66 CrossRef CAS
.
- W. Zhou, Y. Zhou, Q. Wei, L. Du, S. Ding, S. Jiang, Y. Zhang and Q. Zhang, Chemistry, 2017, 23, 9369–9382 CrossRef CAS PubMed
.
- P. M. Mortensen, D. Gardini, C. D. Damsgaard, J.-D. Grunwaldt, P. A. Jensen, J. B. Wagner and A. D. Jensen, Appl. Catal., A, 2016, 523, 159–170 CrossRef CAS
.
- W. Zhou, Q. Zhang, Y. Zhou, Q. Wei, L. Du, S. Ding, S. Jiang and Y. Zhang, Catal. Today, 2018, 305, 171–181 CrossRef CAS
.
- M. Niwa and N. Katada, Catal. Surv. Asia, 1997, 1, 215–226 CrossRef CAS
.
- M. Niwa and N. Katada, Chem. Rec., 2013, 13, 432–455 CrossRef CAS PubMed
.
- R. Demmin and R. Gorte, J. Catal., 1984, 90, 32–39 CrossRef CAS
.
- D. Verboekend, T. C. Keller, S. Mitchell and J. Pérez-Ramírez, Adv. Funct. Mater., 2013, 23, 1923–1934 CrossRef CAS
.
- M. M. E. J. A. Hriljac, A. K. Cheetham, J. A. Donohue and G. J. Ray, J. Solid State Chem., 1993, 106, 66–72 CrossRef
.
- M. Wang, Y. Zhao, D. Mei, R. M. Bullock, O. Y. Gutierrez, D. M. Camaioni and J. A. Lercher, Angew. Chem., Int. Ed. Engl., 2020, 59, 1445–1449 CrossRef CAS PubMed
.
- Z. Luo, Y. Wang, M. He and C. Zhao, Green Chem., 2016, 18, 433–441 RSC
.
- D. J. Rensel, S. Rouvimov, M. E. Gin and J. C. Hicks, J. Catal., 2013, 305, 256–263 CrossRef CAS
.
- H. Wang, M. Feng and B. Yang, Green Chem., 2017, 19, 1668–1673 RSC
.
- W. Guan, X. Chen, H. Hu, C.-W. Tsang, J. Zhang, C. S. K. Lin and C. Liang, Fuel Process. Technol., 2020, 203 Search PubMed
.
- W. Song, W. Lai, Y. Lian, X. Jiang and W. Yang, Fuel, 2020, 263 Search PubMed
.
- A. L. Jongerius, R. Jastrzebski, P. C. A. Bruijnincx and B. M. Weckhuysen, J. Catal., 2012, 285, 315–323 CrossRef CAS
.
- T. Belkheiri, C. Mattsson, S.-I. Andersson, L. Olausson, L.-E. Åmand, H. Theliander and L. Vamling, Energy Fuels, 2016, 30, 4916–4924 CrossRef CAS
.
- J. Zhang, C. Li, X. Chen, W. Guan and C. Liang, Catal. Today, 2019, 319, 155–163 CrossRef CAS
.
- J. Zhang, C. Li, X. Chen, Y. Chen, L. Zhang, B. Zhang and C. Liang, J. Catal., 2019, 371, 346–356 CrossRef CAS
.
- J. Zhang, L. Wang, C. Li, S. Jin and C. Liang, Org. Process Res. Dev., 2018, 22, 67–76 CrossRef CAS
.
- M. Koyama, Bioresour. Technol., 1993, 44, 209–215 CrossRef CAS
.
- J. Weitkamp, ChemCatChem, 2012, 4, 292–306 CrossRef CAS
.
- D. Verboekend, N. Nuttens, R. Locus, J. Van Aelst, P. Verolme, J. C. Groen, J. Perez-Ramirez and B. F. Sels, Chem. Soc. Rev., 2016, 45, 3331–3352 RSC
.
- C. H. Bartholomew, Appl. Catal., A, 2001, 212, 17–60 CrossRef CAS
.
- M. G. P. Magnoux, Appl. Catal., A, 2001, 212, 83–96 CrossRef
.
-
C. S. Hsu and P. R. Robinson, Practical advances in petroleum processing, Springer Science & Business Media, 2007 Search PubMed
.
Footnote |
| † Electronic supplementary information (ESI) available. See DOI: 10.1039/d1se00412c |
| This journal is © The Royal Society of Chemistry 2021 |


