 Open Access Article
Energy production by salinity exchange in polyelectrolyte-coated electrodes. Temperature effects
S.
Ahualli
 *a,
M. L.
Jiménez
 a,
Z.
Amador
a,
M. M.
Fernández
b,
G. R.
Iglesias
a,
Z.
Amador
a,
M. M.
Fernández
b,
G. R.
Iglesias
 a and
A. V.
Delgado
 a
a
aDepartment of Applied Physics, School of Sciences, MNat Unit of Excellence, University of Granada, 18071 Granada, Spain. E-mail: sahualli@ugr.es
bDepartment of Fluidic and Energy Science Central America University José Simeón Cañas, San Salvador, El Salvador
First published on 17th May 2021
Abstract
It is now indisputable that clean energy sources must fulfill the increase in the energy demand of all societies. For such a challenge, every small step towards utilizing any renewable source counts. One prominent example is that of blue energy or energy production based on salinity gradients, existing in all kinds of environments, both natural and industrial. Specifically, the present work is based on electric energy that can be extracted when salty and fresh solutions are exchanged in the presence of a pair of electrodes. It has been previously reported that the use of interfaces coated with charged polymers (yielding a deformable or soft interface) offers considerable advantage over bare electrodes, and the combination of Donnan and double layer potentials can play in favour of larger energy and power generation. In this work we show that the temperature dependence of both contributions can produce an even higher performance, and the consideration of this feature is the key point of this work. If the low ionic concentration solution (fresh water) is at higher temperature than that of the high concentration one (salty water), both energy and power increase as compared to those attained at equal temperatures. This behaviour is investigated with activated carbon electrodes coated with cationic and anionic polyelectrolytes to form an electrochemical cell in contact successively with room temperature salt water and warm fresh water. When the difference between the two amounts to about 40 °C, the energy and power can increase by almost 80%, a very significant improvement that paves the way to further progress in salinity gradient power production.
1. Introduction
Access to energy is essential for promoting economic growth and improvements in living conditions. According to recent data, the different societies of our planet require approximately 400–500 GJ per year per capita,1 or 15 million ktoe global energy demands. This enormous amount of energy is mainly based on fuel and carbon technologies, and only 26% of it is presently obtained from renewable sources (solar, wind, biofuel, hydropower, etc.).2 Specifically, EU countries have agreed on a new framework for the 2020–2030 decade, including a 40% reduction of greenhouse gas emissions and a 27% share of renewable energy sources, jumping to 55–75% by 2050.3This means that there is a long road ahead regarding extensive use of clean, renewable energies. Hydraulic energy, that is, energy obtained using water in one way or another, is in the route. This includes mainly hydroelectric power, but also tidal or wave energy, and particularly, salinity gradient energy, our focus in this contribution.4 Also known as Blue Energy, it includes all methods in which a net energy can be obtained exchanging aqueous solutions of different salinity, as the primary resource. The main techniques include Pressure Retarded Osmosis (PRO) and Reverse Electro-Dialysis (RED); in the former a chamber is divided in two compartments by a semi-permeable membrane. In one of these compartments fresh water is stored, and the other contains salty (sea) water; the membrane allows the passage of fresh water into the sea water container, increasing the pressure in it. Such an overpressure is eventually released moving a hydroturbine.5–7 In RED, a series of chambers are separated by cation- and anion-exchange membranes; fresh and salty solutions flow in alternate chambers simultaneously, and ions of different species are separated according to their charge, so that a potential difference is established between the first and last chambers.7–13 In this work, the technique investigated belongs to the group of Capacitive Mixing or Capmix methods:6,14–17 they are based on charging a pair of electrodes in contact with a salty solution and discharging them in fresh water. When the charging is accomplished by connection to an external power source, the method has been called Capacitive Energy Extraction based on Double Layer Expansion (CDLE). If, instead, ion exchange membranes are used for establishing an electric potential difference between a pair of electrodes, without the need for an external source, we speak of CDP (or Capacitive Energy Extraction based on Donnan Potential). An interesting alternative, in which membranes are not required, can be denominated Capacitive Mixing on Soft Electrodes (SE): here, polyelectrolyte layers directly deposited on top of the active material are used for establishing the potential difference between the two electrodes.4,15,18
Temperature effects on CDLE and CDP have already been investigated, both experimentally19,20 and theoretically.21 In summary, it is convenient to carry out these processes by exchanging cold (or ambient temperature) salty water with hot fresh water. We note that this is rather feasible: the cooling water of thermal power sources is warmer than room temperature in all practical cases. The aim of the present paper is the evaluation of such temperature effects when the electrodes are coated with polyelectrolytes (SE method). We will determine experimentally the energy and power extracted for different temperatures of the fresh water solution and elaborate a model for justifying the observed differences.
2. Model and predictions
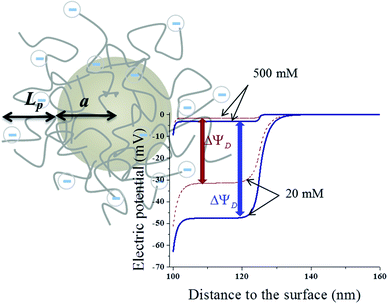
In order to increase the surface area in contact with the solution, and hence, the stored charge, the electrodes are made of activated carbon microparticles. Therefore, we can study the potential at the electrode surface by analyzing a representative particle. Let us assume, as depicted in Fig. 1, that a spherical particle of radius a is coated with a layer of polyelectrolyte with volume charge density ρpol and thickness Lp. Considering that polyelectrolytes are highly charged, it can be expected that their chains will be highly extended because of electrostatic repulsions between charged groups along their chains. Little effect of temperature (in the moderate interval investigated) on the layer thickness Lp can be expected, and so this parameter is considered constant throughout the calculations. In addition, it is not a critical one for our study, as long as it allows the Donnan potential to be established. In fact, viscosity data on PDADMAC (poly(diallyldimethyl ammonium chloride)) solutions obtained by Trzcinski et al.22 allow estimating (assuming a negligible effect of temperature on the excluded volume) that the average end-to-end dimension of the chain changes by just 4% when the temperature is increased from 25 °C to 65 °C. In the case of PSS (poly(sodium 4-styrenesulfonate)), the other polyelectrolyte investigated in this paper, viscosity determinations by Cohen and Priel23 are consistent with a decrease of the effective charge of the polyelectrolyte with the increase in temperature, although no model appears to exist on the relationship between such a decrease and the chain length.The electric potential profile Ψ(r) around the particle (spherical symmetry is assumed, r being the radial spherical coordinate) can be found by solving Poisson's equation in two regions (inside and outside the layer):
 | (1) |
 | (2) |
(i) Surface charge density of the particle:
 | (3) |
(ii) Continuity of the potential and of the field at the polyelectrolyte layer limit:
 | (4) |
(iii) Electroneutrality of the system: the field must be zero at a large distance from the surface:
 | (5) |
Upon numerical integration using a Matlab® routine, the potential profile can be obtained as illustrated in Fig. 1, for −1 μC cm−2 surface charge density, and −6 × 10⁶ C m−3 and −12 × 106 C m−3 volume charge density of the polymer layer. Two NaCl concentrations were used, namely 20 mM and 500 mM, roughly river and sea water, respectively. As observed, the potential is rather uniform inside the layer (the Donnan potential ΔΨD), provided that this is thick enough in comparison with the electrical double layer (EDL) thickness. The developed potential also depends on the ionic concentration, raising when the 500 mM solution is substituted by the 20 mM one.
Even in the absence of the polymer layer, the EDL of the particle, generated by its surface charge density, produces a potential profile in its vicinity, which is well known.25,27,28 If, for instance, the surface charge is low, the potential difference between the particle surface and a point at a large distance from the center is:
 | (6) |
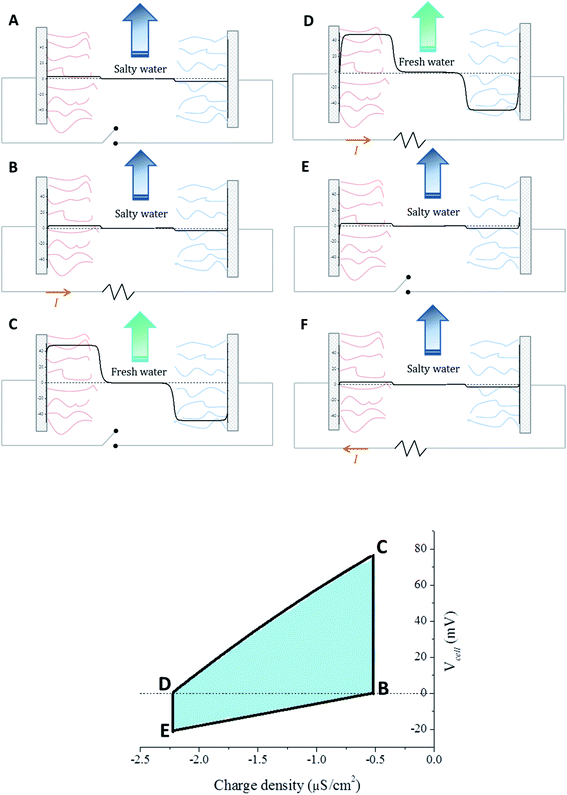
The cycle combining the EDL and polyelectrolyte layer processes is depicted in Fig. 2a, and it includes the following steps:
A. Uncharged coated cores are immersed in salty water. Donnan potentials are established. There is no EDL potential, since the particles are not charged, and thus the surface potential of each electrode will match the Donnan potential. For symmetrical electrodes, the potential difference between them will then be twice the Donnan potential.
B. Both electrodes are externally connected, transferring charge from one to another (in this case, from left to right) and thus forming EDLs close to the surfaces. The EDL potential counterbalances the Donnan potential and, eventually, both electrodes will become equipotential and charge transfer will stop.
C. Fresh water is allowed in, and the external circuit is disconnected, thus creating a rise in the absolute value of both Donnan potentials (because of the lower concentration) and of both EDL potentials (because of the double layer expansion at fixed charge on the surface). Since the weight of the Donnan potential increase is bigger, this results in a net increase of both surface potentials.
D. Both electrodes are again reconnected, leading to a charge flow towards the right electrode until equipotentiality is restored. The potential at the surface will be zero once again because of the symmetry of the system.
E. Finally, the circuit is re-opened and fresh water is replaced by salty water. Closing the circuit again (step F) will redistribute the charge towards the left, bringing us back to step B.
This process, although similar to CDP, differs in the origin of the potential difference. In CDP, a surface potential appears as a consequence of the membrane potential, which is generated because of the salinity difference between two sides of a membrane. However, in the SE case the surface potential is directly the Donnan potential, since the polyelectrolyte layer is directly adjacent to the surface of the electrode. It is interesting to note that also in SE there will always be a net energy gain, since there is no external voltage applied.
As an example, Fig. 2 (bottom) shows the typical dependence between the charge transferred between the electrodes and the potential difference between them. By externally connecting our coated electrodes and changing the water they are immersed into, it is possible to obtain the cycle in the potential vs. charge diagram. A theoretical solution can be obtained by changing the electrode charge and calculating the cell potential Vcell for each charge step. The calculation is continued until Vcell = 0 is reached, marking the end of the spontaneous process. There will be two surface charge densities that yield this solution, depending on whether we are working with salty water (step B) or fresh water (step D). Steps C and E are obtained by changing the water but not the surface charge density.
Note that the fact that in fresh water
| Vcell = [ΔΨ+D (fresh) + ΔΨ+EDL (fresh)] − [ΔΨ−EDL (fresh) + ΔΨ−EDL (fresh)] |
The results are illustrated in Fig. 3: note that the voltage rise when the solutions are exchanged is larger at higher temperature of the fresh water solution (the salty water is always at 25 °C in these simulations), whatever the density of the polyelectrolyte coating. This suggests that the use of temperature variations can be of great help in improving the amount of energy produced by SE/CAPMIX cycles.
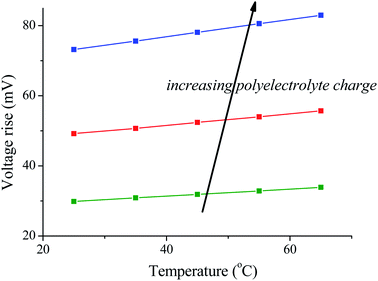 | ||
| Fig. 3 Voltage rise for different polyelectrolyte charge densities as a function of the temperature of the bathing solutions (the salty one is always at 25 °C). | ||
3. Experimental
3.1. Materials
Activated carbon is very suited for blue energy experiments because it is relatively, though not entirely, unreactive. Moreover, it is chosen in order to maximize charge exchange and the huge interfacial area of nanoporous carbon particles fulfills this condition. Carbon films were prepared as described in ref. 32. The process was performed by mixing activated carbon powder with a binder solution. First of all, the carbon powder was dried in an oven at 105 °C for 24 h. Afterwards, this powder was mixed with a solution of polyvinylidene fluoride (PVDF) binder from Arkema (USA), under the tradename Kynar HSV 900, in the solvent 1-methyl 2-pyrrolidone (NMP, Merck, Germany) at a concentration of 3% by weight. The dissolution was performed at 75 °C in a heated magnetic stirring plate. For the preparation of the carbon-binder slurry, 90 g PVDF solution was mixed with 26.93 g carbon and mixed in a ball mill grinder, for 30 min at 450 rpm. Afterwards, the mixture was kept under moderate vacuum and finally painted on a graphite current collector ensuring uniformity on the film.The activated carbon used for his work is SR23, supplied by Mast Carbon, Ltd (UK). It was chosen because this carbon sample has a significant fraction of both micro- and meso-pore populations and it has been proved that optimum results will be obtained with this pore structure.33 The number of pores in the 1 nm range produces an increase of the extracted charge and on the other side, mesopores behave as a sort of solution reservoir allowing easy water exchange. Specifically, SR23 has a 959 m2 g−1 specific surface area, and a high proportion of pores with a diameter below 10 nm.
For the SE technique, the activated carbon films need to be coated with anionic and cationic polyelectrolytes. It has been previously demonstrated that the coating can be simply performed by keeping carbon-coated graphite collectors in contact with 50 mL solutions of the respective anionic and cationic polymer under magnetic stirring for 24 h.34 Afterwards, the electrodes are ready to be placed on the cell after being thoroughly rinsed with deionized water. As mentioned, the polymers used were cationic PDAMAC and anionic PSS, with molecular weights 100![[thin space (1/6-em)]](https://www.rsc.org/images/entities/char_2009.gif) 000 g mol−1 and 200
000 g mol−1 and 200![[thin space (1/6-em)]](https://www.rsc.org/images/entities/char_2009.gif) 000 g mol−1 respectively. The concentrations of the polyelectrolyte solutions were always 0.1 mol L−1 (calculated on a monomer basis).
000 g mol−1 respectively. The concentrations of the polyelectrolyte solutions were always 0.1 mol L−1 (calculated on a monomer basis).
Synthetic solutions of seawater (salty water) and river water (fresh water) were made in the laboratory with respective concentrations 500 mM and 20 mM of sodium chloride (Sigma Aldrich, USA). The water used in the preparation of the solutions was deionized and filtered using a Milli-Q Academic system from Millipore (Spain).
3.2. Methods
The capmix cell used in this work has been thoroughly described in ref. 33. It is of the flow-by type: the solutions flow in the region between the two parallel electrodes, consisting of graphite collectors supporting the carbon-graphite disks (2 cm diameter). The electrodes are separated by a 600 μm thick nylon spacer allowing water to flow through. Two peristaltic pumps are used to carry water from salty and fresh water reservoirs.Two kinds of different capmix experiments can be carried out in order to perform energy extraction cycles, depending on which remains constant during the charging and the discharging process, either the voltage or the current. In constant current mode, a current source guarantees that the closed circuit processes are performed with an externally fixed current. At any time, the charge can be calculated by the integration of the current vs. time measurements. In addition, the energy as a function of time can be calculated as:
 | (7) |
 | (8) |
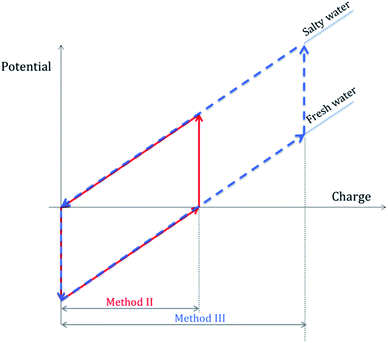
The energy extraction cycles can be performed by following three different experimental methodologies. Method I corresponds to a constant voltage mode, where the cell is simply charged and discharged through an external resistor, and no external power source is connected. In method II, a constant current source is used, allowing the current to flow until a given amount of charge (typically 10 mC in our experiments) is transferred to and from the cell; in method III, the charge transported is 20 mC, quite larger than the natural charge, hence constituting a forced cycle, so to say, since we are exchanging not only the self-generated charge but we are also overcharging the cell up to a certain value.32Fig. 4 shows a schematic representation of the latter two methodologies.
4. Results and discussion
4.1. Open circuit voltage with soft electrodes
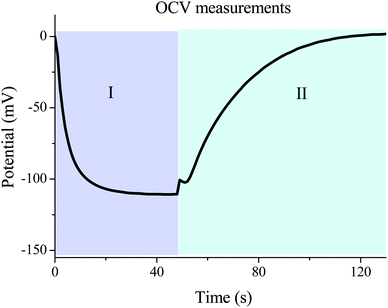
The most important parameter that determines the energy extracted in every cycle is the potential rise upon salinity exchange. This quantity can be obtained by performing successive cycles of salty-fresh solution exchange in contact with the electrodes while they are in an open circuit, and measuring the voltage between them. One open circuit cycle is represented in Fig. 5. The performed experiment measures the potential evolution between both electrodes of the capmix cell as a function of time in the open circuit, that is, fresh water and salt water are passed alternately while the potential is recorded. It should be recalled that these open circuit measurements reveal the possibility of application of this technique in different real situations. The so-called voltage rise (that is, the voltage change, in an absolute value, when solutions are exchanged) determines the energy and power per cycle (note that the power is roughly proportional to the square of the voltage rise), which ultimately defines the feasibility of the method. Ideally, this quantity would be a measure of the Donnan potential variations on both electrodes when the solutions are exchanged. Note that the voltage changes by up to ∼110 mV, not so far from the ideal voltage difference of 160 mV (Fig. 1).4.2. Temperature effects in OCV cycles
Fig. 6 represents the open circuit voltage data obtained for increasing temperatures of the fresh water solutions, as indicated, and constant temperature of the salty water (25 °C). As observed, the potential rise increases to about 140 mV when the temperature of the fresh water going into the cell channel is 65 °C. Interestingly, heating up the incoming fresh solution favors the increase in voltage variations of the OCV cycles (energy harvesting), and leads to faster kinetics of the voltage changes (that is, larger power production).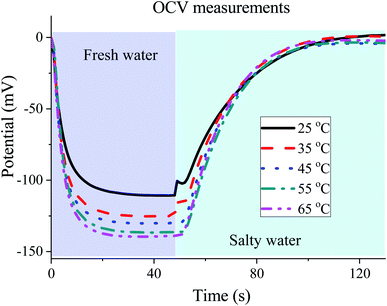 | ||
| Fig. 6 Cell potential as a function of time for different temperatures of the fresh water solution (20 mM NaCl). The concentrated solution (500 mM) temperature was always 25 °C. | ||
4.3. Constant-voltage method (method I) and temperature variations
The SE method working under constant voltage conditions is able to spontaneously transfer charge, similar to CDLE. However, an external voltage source is used in CDLE, and hence, leakage must be minimized in order to get a net positive energy profit. In contrast, the leakage problem is not an issue in SE, because an external voltage source is not necessary. Even more, the increase of the voltage rise due to the exchange of fresh water at higher temperature will work in our favour by exchanging charge at higher potential. This can be seen in Fig. 7. The slight decrease in the internal resistance when the temperature increases is another parameter that enhances the enclosed area of the cycles. This can be observed analyzing the voltage drop prior to the beginning of the discharging step (rightmost peak of the cycles in Fig. 7 bottom). Finally, in Fig. 7 (top) we can observe that the faster diffusion response at higher temperature speeds up the voltage rise in the fresh water step. Hence, even larger extracted power could be obtained if the duration of the open circuit step in fresh water is reduced. Concluding, the key parameters that control the extracted power of blue energy cycles are benefited by using hot fresh water.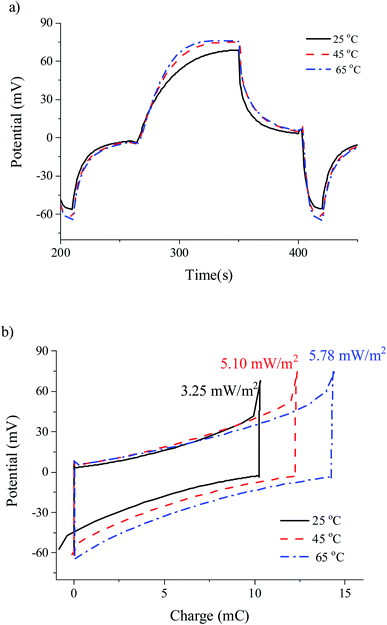 | ||
| Fig. 7 Cell potential as a function of time (a) and potential vs. charge (b) for different temperatures operating by method I. | ||
4.4. Constant current cycles (methods II and III)
Similarly to method I (Fig. 7), the transfer of charge in method II is autogenerated but, in this case, we fix the current of the cycle by using a current power source (0.25 mA). Again, as shown in Fig. 8, the increase in temperature brings about larger voltage jumps and larger areas of the potential–charge cycles (i.e., energy per cycle). It appears that the linear relationship between potential and time when the current is fixed is favourable to the increase of the energy of the cycles when the fresh-water temperature is raised above that of the salty water.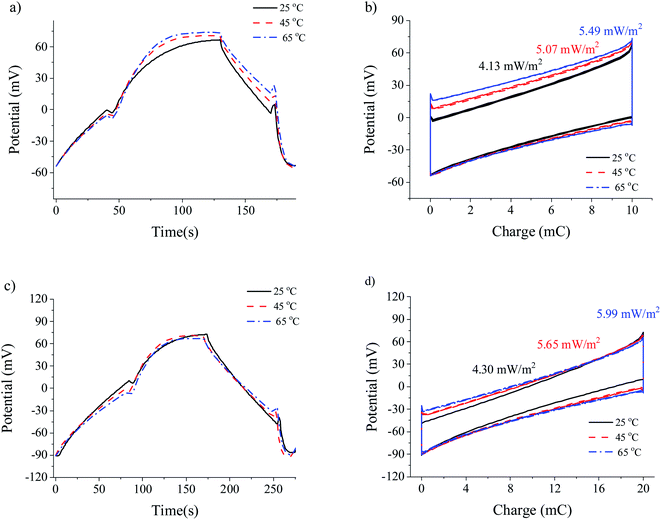 | ||
| Fig. 8 Cell potential as a function of time (a and c), and potential vs. charge (b and d) representations for different temperatures operating according to methods II (a and b) and III (c and d). | ||
Finally, method III yields the highest extracted power under all conditions explored in this work. Similar to what occurs in CDP,32 forced cycles in the SE method combine the effect of the electrical double layer capacitance with that of the Donnan potential. For low exchanged charge, the latter will be dominant. If the overcharging is large, the resulting cycles would be essentially of the CDLE type. This would result in a more significant leakage, reducing the obtained power below the theoretical maximum.33 In fact, the highest extracted power obtained was 6 mW m−2.
4.5. Discussion: which method is best?
Fig. 9 aims at summarizing the results concerning the values of energy and power obtained by the SE methods presented in this work. Firstly, it is clear that both energy and power mainly depend on the temperature effect whatever the method used. Interestingly, a protocol for optimizing the extracted power by specifying the best conditions for each method can be implemented. For instance, the charge and discharge times must be properly chosen in order to allow full discharge, while the exchange time of the solutions has to be appropriately fixed in order to enhance the extracted power. A proof of that is that in SE method I, cycles are naturally optimized by achieving zero potential. In this case, the cycle can be faster for higher temperatures, this increasing the extracted power. A faster cycle can also be more effective in order to prevent the possible biofouling under real working conditions. Here we find the highest increase (about 80%) of the extracted energy, to be compared to the 33% and 40% increases in the case of SE methods II and III, respectively. Moreover, another advantage of method I should be mentioned: there is no need for a current source and the whole energy balance will be beneficial, while in the other cases, leakage must be properly accounted for. Additionally, it is evident that forced cycles in the SE method provide the maximum energy per cycle of all of them. These results open new paths in exploring blue energy production by capmix methods.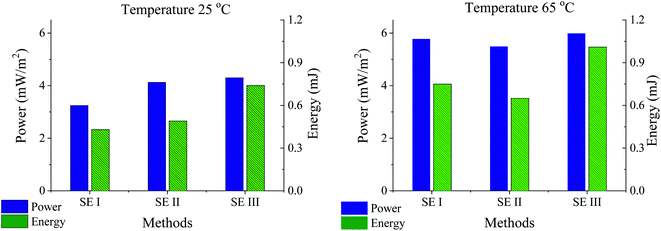 | ||
| Fig. 9 Energy and power extracted using the SE methods for the highest and lowest temperatures of the fresh water solution (salty water at 25 °C in all cases). | ||
5. Conclusions
In this work, we have generalized previous investigations on methods based on double layer expansion and Donnan potential variations with salt concentration in solution, by including temperature effects. We have found that it is advantageous to exchange salty water at room temperature with fresh water at higher temperature, as a new approach to the extraction of electrical energy from thermal and salinity gradients without the need for electromechanical converters. The methods proposed are based on the use of polyelectrolyte-coated electrodes, and they are very versatile, starting from the simplest one (constant potential) where no electrical power source is used for aiding in the process of energy harvesting. It is in this method that the largest relative increase in power is achieved when the temperature of the fresh water is raised above that of the salty one. Such a temperature rise also leads to increases in energy and power production when the voltage jumps are produced by forced changes associated with the use of a constant-current source both for charging and discharging, yielding a maximum power achievable of around 6 mW m−2.Conflicts of interest
There are no conflicts of interest to declare.Acknowledgements
This study has been partially financed by the Consejería de Conocimiento, Investigación y Universidad, Junta de Andalucía and European Regional Development Fund (ERDF), ref. UGR-B-FQM-141-UGR18, and Ministerio de Ciencia, Innovación y Universidades, Spain (PGC2018-098770-B-I00).References
- I. Arto, I. Capellan-Perez, R. Lago, G. Bueno and R. Bermejo, Energy Sustainable Dev., 2016, 33, 1–13 CrossRef.
- IEA, Renewables 2019, IEA, Paris, 2019, https://www.iea.org/reports/renewables-2019 Search PubMed.
- N. Scarlat, J.-F. Dallemand, F. Monforti-Ferrario, M. Banja and V. Motola, Renewable Sustainable Energy Rev., 2015, 51, 969–985 CrossRef.
- S. Ahualli and A. V. Delgado, Charge and Energy Storage in Electrical Double Layers, Academic Press-Elsevier, London, 2018 Search PubMed.
- A. P. Straub, A. Deshmukh and M. Elimelech, Energy Environ. Sci., 2016, 9, 31–48 RSC.
- N. Y. Yip, D. Brogioli, H. V. M. Hamelers and K. Nijmeijer, Environ. Sci. Technol., 2016, 50, 12072–12094 CrossRef CAS PubMed.
- K. Touati and M. S. Rahaman, Renewable Sustainable Energy Rev., 2020, 131 Search PubMed.
- P. Dlugolecki, A. Gambier, K. Nijmeijer and M. Wessling, Environ. Sci. Technol., 2009, 43, 6888–6894 CrossRef CAS PubMed.
- J. Veerman, M. Saakes, S. J. Metz and G. J. Harmsen, J. Membr. Sci., 2009, 327, 136–144 CrossRef CAS.
- J. Veerman, M. Saakes, S. J. Metz and G. J. Harmsen, Chem. Eng. J., 2011, 166, 256–268 CrossRef CAS.
- D. A. Vermaas, J. Veerman, N. Y. Yip, M. Elimelech, M. Saakes and K. Nijmeijer, ACS Sustainable Chem. Eng., 2013, 1, 1295–1302 CrossRef CAS.
- V. M. Ortiz-Martinez, L. Gomez-Coma, C. Tristan, G. Perez, M. Fallanza, A. Ortiz, R. Ibanez and I. Ortiz, Desalination, 2020, 482 Search PubMed.
- J. Veerman, Membranes, 2020, 10 Search PubMed.
- M. F. M. Bijmans, O. S. Burheim, M. Bryjak, A. Delgado, P. Hack, F. Mantegazza, S. Tenisson and H. V. M. Hamelers, Technoport 2012 – Sharing Possibilities and 2nd Renewable Energy Research Conference (Rerc2012), 2012, vol. 20, pp. 108–115 Search PubMed.
- M. M. Fernandez, R. M. Wagterveld, S. Ahualli, F. Liu, A. V. Delgado and H. V. M. Hamelers, J. Power Sources, 2016, 302, 387–393 CrossRef CAS.
- D. Brogioli, Phys. Rev. Lett., 2009, 103 Search PubMed.
- D. Brogioli, R. Zhao and P. M. Biesheuvel, Energy Environ. Sci., 2011, 4, 772–777 RSC.
- S. Ahualli, S. Orozco-Barrera, M. D. Fernandez, A. V. Delgado and G. R. Iglesias, Polymers, 2019, 11 Search PubMed.
- S. Ahualli, M. M. Fernandez, G. Iglesias, A. V. Delgado and M. L. Jimenez, Environ. Sci. Technol., 2014, 48, 12378–12385 CrossRef CAS PubMed.
- B. B. Sales, O. S. Burheim, S. Porada, V. Presser, C. J. N. Buisman and H. V. M. Hamelers, Environ. Sci. Technol. Lett., 2014, 1, 356–360 CrossRef CAS.
- M. M. Ma, S. L. Zhao, H. L. Liu and Z. L. Xu, AIChE J., 2017, 63, 1785–1791 CrossRef CAS.
- S. Trzcinski, K. M. Varum, D. U. Staszewska, O. Smidsrod and M. Bohdanecky, Carbohydr. Polym., 2002, 48, 171–178 CrossRef CAS.
- J. Cohen and Z. Priel, J. Chem. Phys., 1990, 93, 9062–9068 CrossRef CAS.
- C. G. Malmberg and A. A. Maryott, J. Res. Natl. Bur. Stand., 1956, 56, 1–8 CrossRef CAS.
- J. Lyklema, Fundamentals of Interface and Colloid Science, Academic Press, Londres, 1995, vol. II Search PubMed.
- S. Ahualli, M. L. Jimenez, M. M. Fernandez, G. Iglesias, D. Brogioli and A. V. Delgado, Phys. Chem. Chem. Phys., 2014, 16, 25241–25246 RSC.
- R. J. Hunter, Foundations of Colloid Science, Clarendon Press, Oxford, 1987 Search PubMed.
- A. V. Delgado, Interfacial Electrokinetics and Electrophoresis, Marcel Dekker, New York, USA, 2002 Search PubMed.
- M. Bijmans, O. Burnheim, M. Bryak, A. V. Delgado, P. Hack, F. Mantegazza, S. Tennison and B. Hamelers, Energy Procedia, 2012, 20, 108–115 CrossRef CAS.
- M. L. Jimenez, M. M. Fernandez, S. Ahualli, G. Iglesias and A. V. Delgado, J. Colloid Interface Sci., 2013, 402, 340–349 CrossRef CAS PubMed.
- F. J. Arroyo, F. Carrique, S. Ahualli and A. V. Delgado, Phys. Chem. Chem. Phys., 2004, 6, 1446–1452 RSC.
- F. Liu, O. Schaetzle, B. B. Sales, M. Saakes, C. J. N. Buisman and H. V. M. Hamelers, Energy Environ. Sci., 2012, 5, 8642–8650 RSC.
- G. R. Iglesias, M. M. Fernandez, S. Ahualli, M. L. Jimenez, O. P. Kozynchenko and A. V. Delgado, J. Power Sources, 2014, 261, 371–377 CrossRef CAS.
- S. Ahualli, G. R. Iglesias, M. M. Fernandez, M. L. Jimenez and A. V. Delgado, Environ. Sci. Technol., 2017, 51, 5326–5333 CrossRef CAS PubMed.
| This journal is © The Royal Society of Chemistry 2021 |

