 Open Access Article
Modeling and design guidelines of high-temperature photoelectrochemical devices†
Ronald R.
Gutierrez
and
Sophia
Haussener
 *
*
Institute of Mechanical Engineering, École Polytechnique Fédérale de Lausanne, 1015 Lausanne, Switzerland. E-mail: sophia.haussener@epfl.ch
First published on 22nd March 2021
Abstract
Operation of photoelectrochemical devices at high temperatures can provide a pathway to reduce the operating voltage, increase the production rate, and allow for the use of more earth abundant catalysts. Additionally, high-temperature operation offers the promise to utilize a larger fraction of the solar spectrum through the use of thermal energy and therefore has the potential for higher efficiency operation. However, PEC devices operating at temperatures above 100 °C require the use of new semiconducting junctions for charge separation and ceramic solid electrolytes for ion conduction. The feasibility and design of such devices is not known. We developed a non-isothermal computational model of a high-temperature PEC device, consisting of a photo-enhanced thermionic emitter for photon absorption, charge generation and separation, and a solid oxide electrolyzer for the ionic conduction and the water and CO2 splitting reactions. The model predicted that such a device made of established materials is feasible with operating temperatures of the photoabsorber in the range of 600–800 K, reaching solar-to-fuel efficiencies between 8 to 13%, and H2 evolution rates between 17 to 72 mmol m−2 s−1. It also has the possibility of generating syngas for the generation of synthetic fuels, when the appropriate amount of water is supplied to the device. The device concept was assessed under different scenarios that consider variations in design, operating conditions, and material properties in order to provide general device design guidelines and highlight the potential of high-temperature PEC devices.
1 Introduction
The electrolysis of H2O and CO2 at high temperatures (above 700 °C) is interesting since it allows for the use of earth abundant and inexpensive catalysts (e.g. Ni-YSZ, compared to Pt or Ir for room temperature electrolysis), the electrochemical equilibrium potential is reduced (e.g. 18% voltage drop in the equilibrium voltage for water splitting when increasing the operating temperature from room temperature to 700 °C), the catalytic activity of the electrodes is improved (e.g. 12 orders of magnitude improvement in the exchange current density of Ni-YSZ when increasing the operating temperature from room temperature to 700 °C), and the products can be easily evacuated from the electrodes (avoiding back-reactions). Using solar energy to provide both charge carriers and heat to the reactants is an interesting approach to generate clean fuels and chemicals. This can be done in integrated photovoltaic-electrolysis (PV-EC) or photoelectrochemical (PEC) devices. However, a device combining a traditional PV with a high-temperature electrolyzer would not be feasible given that the PV wouldn't be able to provide enough photovoltage at these high temperatures (see Fig. S1†) as the band-bending, which keeps the photo-generated carriers separated, cannot be maintained at high temperatures and the photocarriers recombine. Generally, recombination increases with increasing temperature, reducing the available photocarriers. Therefore, alternative approaches must be implemented to separate the photocarriers. To date, there is no experimental or theoretical research of solid-state PEC devices, only PV-driven high-temperature electrolysis has been investigated.1–3Licht et al.4,5 conducted a theoretical analysis of solar thermal electrochemical photogeneration of energetic molecules. They used part of the absorbed solar spectrum (super-bandgap energy) to drive a photovoltaic component while the remaining solar spectrum (super and sub-bandgap energy) was used for heating the electrolyzer components. They predicted a solar conversion efficiency of 50% for CO2 splitting at 650 °C in a cell with 1 bar of CO2 and 58 mbar CO. However, they focused on devices where the PV cell and the electrolyzer are physically separated and the incident solar spectrum is spectrally split to avoid excessive heating of the PV cell. Lin et al.3 proposed the use of concentrated radiation for a PV-driven high-temperature electrolyzer and solar receiver for the evaporation and superheating of the reactant, where the PV was cooled and physically separated from the high-temperature parts of the reactor.
Here, we aim at exploring the possibility to work with a more integrated device design approach that would not require a complicated and dedicated cooling systems and eliminate the need for a spectral beam splitter, overall resulting in a more compact, simple and cost-competitive solution. Such an integrated design combines the solar cells and the electrolyzer elements into one device. The in-series arrangement (in terms of light path) of the solar cell and the electrolyzer removes the need for a spectral beam splitter as the solar cells absorbs high-energy photons to produce electron–hole pairs and transmit the low-energy photons towards the electrolyzer. This opaque electrolyzer absorbs the remaining photons, allowing for increasing its operational temperature. The reactant flow can be partially used to provide cooling to the photoabsorber while ensuring high operating temperature of the electrolyzer (T > 800 K). However, the cooling capability is limited for such an integrated design, requiring the solar cells to effectively operate at higher temperatures (T > 500 K).
Yang6 and Ye7 studied modified photon-enhanced thermionic emission, proposed by Schwede et al.,8 in which the characteristic vacuum layer was replaced by a semiconductor with larger band-gap than the main photoabsorber. This high-temperature solar cell (HTSC) effectively separates the electrons by a small conduction band offset and a large valence band offset to block the holes, avoiding the recombination of the photocarriers (Fig. 1a).
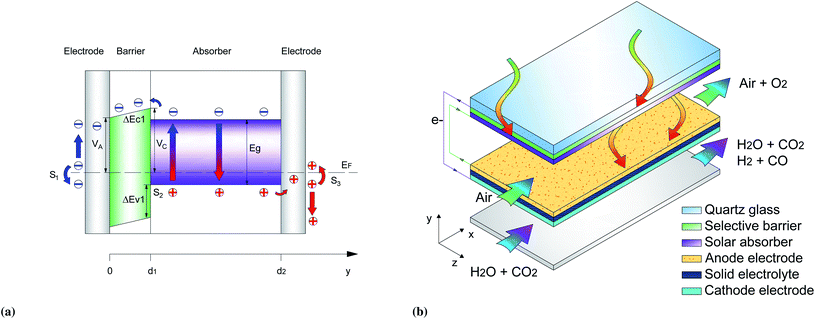 | ||
| Fig. 1 (a) Schematic band diagram of the HTSC, including carrier extraction and surface recombination, and (b) schematic representation of HTSC-SOE device. | ||
Here we model the performance of a high temperature solar cell-solid oxide electrolyzer device (HTSC-SOE) by developing and using a non-isothermal 2D SOE model combined with a 1D HTSC model. The device is not completely integrated since there is no direct contact of the HTSC and the SOE. However, the HTSC is located in close proximity (below few millimeters) of the electrolyzer components. Therefore, acting as a wall that separates the hot reactants and products in the anode chamber from the environment (Fig. 1b). Such a design can potentially use electrode and catalyst materials that are well known in the solid oxide electrolyzer community, such as Ni/YSZ, titanate/ceria,9 highly dispersed Ni-SDC,10 or LSCM11 for the hydrogen and carbon monoxide reactions, and LSM-YSZ, GDC-impregnated LSM, LSF, LSCo,12 MIEC, LSCuF, LSCF,9 or SFM13 for the oxygen evolution reaction. Our model is used to assess the potential of such a HTSC-SOE device and, through an extensive parameter study, provide general design guidelines.
2 Model development and governing equations
2.1 Device description and algorithm
The modeled device is composed of a high-temperature photoabsorber assembly and a solid oxide electrolyzer (Fig. 1b). Part of the incoming solar irradiation is absorbed by the photoabsorber assembly in order to generate electron–hole pairs. The internal heat losses and the heat generated at the boundaries of the photoabsorber assembly (Qvb) are used to heat the reactants in the anode chamber (Fig. 2a). The lower-energy photons (Pnabs) are transmitted to the SOE, where they are absorbed in the opaque porous electrode and heat the other components and reactants by multi-mode heat transfer.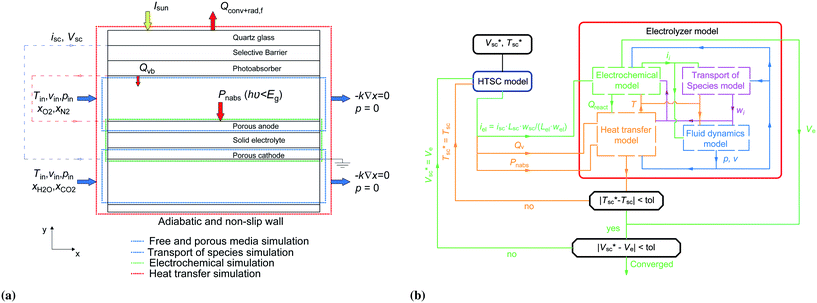 | ||
| Fig. 2 (a) Boundary conditions of the governing equations, and (b) algorithm of the calculation process to predict the performance and operating conditions of the device. | ||
The device is modeled by considering a 1D model (y-direction) for the HTSC and a 2D model (x–y direction) for the SOE. Fig. 2b shows the flow diagram of the model algorithm and indicates which variables are exchanged between the different models. First, the 1D model computes the photocurrent density and heat sources by solving Poisson, transport, continuity, radiative transfer, and energy conservation equations along the thickness of the photoabsorber assembly. Since the equations are temperature dependent, the process of calculation starts by guessing the temperature of the HTSC  , and compute the current density (isc) and the heat sources (Qvb, Pnabs). These values are used as inputs for the SOE model to compute the required voltage (Ve) and the temperature field by solving energy conservation, electrochemical reactions, species transport and mass and momentum conservation. This allows to compare the computed mean temperature of the photoabsorber assembly with the initial value
  . If this difference is smaller than 0.5 K, it is assumed that the model has converged. This tolerance showed a good compromise between calculation accuracy and computational effort. Typically, it took about 9 h to determine the operating point for a given solar concentration. The process is repeated for different photovoltages until the difference between the provided photovoltage by the HTSC and the required voltage by the SOE
  is smaller than 1 × 10⁻⁴ V. This converged voltage corresponded to the operating point of the HTSC-SOE device.
2.2 High-temperature solar cell model
The HTSC is composed of a narrow band-gap semiconductor (termed absorber) that absorbs portion of the solar irradiation, and a wide band-gap semiconductor (termed barrier) that is located in front of the absorber. When the absorber is illuminated, electron–hole pairs are generated. The selective extraction of electrons is possible by a small conduction band offset that allows the emission of electrons from the absorber to a metal contact, while a large valence band offset blocks the passage of holes in the same direction of the electrons, avoiding recombination of the carriers. Holes are extracted by a metal contact at the back of the absorber. Fig. 1a shows a schematic representation of the carriers extraction, similar to the one given in Yang et al.,6 but here including the implementation of charge recombination at the surface of the metal contacts and at the barrier–absorber interface. Further details about the principle of operation for different voltages is shown in the ESI (see Fig. S3†).For the reference case, GaP was selected as a barrier due to its large bandgap (2.27 eV), while Si (1.12 eV) and GaAs (1.42 eV) were selected as possible absorbers as they use a large portion of the solar spectrum (80% and 65% at 298 K, respectively). Furthermore, the conduction band level difference is small when they are in contact with GaP (0.25 eV and 0.27 eV for Si and GaAs, respectively, at 298 K) while the valence band level difference is much larger (0.894 eV and 0.605 eV for Si and GaAs, respectively, at 298 K).
We use a p-doped absorber and a n-doped barrier at steady state. The minority carrier concentration was determined by solving Poisson's equation, the transport and continuity equations for electrons and holes, see eqn (S1).† The generation of carriers was computed by solving the radiative transfer equation in the barrier and the absorber,14,15 see eqn (S2) to (S4).† Three recombination mechanisms were considered for the minority-carrier lifetime,16 which depends on the radiative recombination coefficient, B, the Auger recombination coefficient, Ci, and the Shockley–Read–Hall recombination lifetime, τsrh,i. The parameters used to compute the life time of carriers are shown in Table 1.
| Parameter | Material | ||
|---|---|---|---|
| GaP | GaAs | Si | |
| B (cm3 s−1) | 3 × 10⁻¹⁵ (ref. 17) | 1 × 10⁻¹⁰ (ref. 17) | 0 (ref. 17) |
| C e (cm6 s−1) | 5 × 10⁻³⁰ (ref. 17) | 5 × 10⁻³⁰ (ref. 17) | 2.8 × 10⁻³¹ (ref. 17) |
| C h (cm6 s−1) | 3 × 10⁻³⁰ (ref. 17) | 3 × 10⁻³⁰ (ref. 17) | 9.9 × 10⁻³² (ref. 17) |
| τ srh,e (s) | 1 × 10⁻⁷ (ref. 18) | 5 × 10⁻⁹ (ref. 18) | τ(Na)14 |
| τ srh,h (s) | 1 × 10⁻⁶ (ref. 18) | 3 × 10⁻⁶ (ref. 18) | τ(Nd)14 |
We assumed surface recombination at the surface of the barrier, and that the electric field sweep the photogenerated holes into the absorber due to the electric field:
 | (1a) |
| nh = 0 | (1b) |
While the boundary conditions in the absorber also consider the emitted and reversed photocarriers by thermionic emission:
 | (2a) |
 | (2b) |
The surface recombination velocity varies in the range of Si = 102 to 107 cm s−1 according to Sahasrabuddhe et al.19 We have used the same values as Couderc et al.15 for the contact recombination, namely S1 = 103 cm s−1 and S3 = 104 cm s−1, while for the interface recombination a value of S2 = 102 cm s−1 was used, considering a high-quality heterostructure.20 The emitted photocurrent from the absorber, eqn (3a), and the reversed photocurrent from the metal contact, eqn (3b), depend on the relative work function of the absorber, VC, the relative work function of the electrode, VA (both measured from the conduction band of the barrier,6 see Fig. 1a), the local temperature, Tsc, the Richardson constant (A = 120 A cm−2 K−2),21–23 the flat band potential, Vfb = VC − VA, and the operating voltage, Vsc.
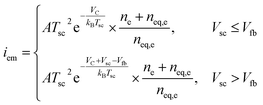 | (3a) |
 | (3b) |
The concept is analogous to the photon-enhanced thermionic emission,8,23 but replacing the vacuum level by the conduction band level of the semiconductor barrier to extract the electrons.6,7 The total photocurrent, isc, is the sum of the electron and hole current at the interface between the barrier and the absorber, eqn (S5).†
Once the current density and the electric field were solved, we can find the volumetric heat sources that are inputs for the electrolyzer model, eqn (4), which includes thermalization, Qt(y), Joule heating, Qj(y), Thomson heating, QT(y), nonradiative recombination heating, Qrec(y), and a local radiative heat source, Sr(y). Further details about the equations are found elsewhere.14,15,24 However, we adapted the coefficients,  , in order to close the energy balance, instead of using a constant value.
 | (4a) |
| Qj(y) = isc(y)E(y) | (4b) |
 | (4c) |
| Qrec(y) = R(y)(Eg(y) + 3kBTsc(y)) | (4d) |
 | (4e) |
Besides the internal heat sources, we also considered the boundary heat sources, eqn (5), which include nonradiative recombination at the surfaces, Qb,rec, the Thomson effect, Qb,T, and the Peltier effect (losses induced by current flow at a metal–semiconductor interface), Qb,P.
| Qb,rec = (S1nh + S3ne)(Eg + 3kcTsc)/Lsc | (5a) |
 | (5b) |
| Qb,P = ((Ec − EFn) + (Ev − EFp))isc/Lsc | (5c) |
2.3 Electrolyzer model
The electrolyzer model solves the transport and conservation equations for the multi-physical phenomena happening in a high-temperature electrolyzer with porous electrodes, i.e. electrochemical and thermochemical reactions inside porous electrodes, fluid dynamics, transport of species and heat transfer through channels and porous media (Fig. 2a).Within the porous cathode electrode, the following electrochemical half-reactions and thermochemical reaction occur:
| H2O + 2e− → H2 + O2− | (6a) |
| CO2 + 2e− → CO + O2− | (6b) |
| H2O + CO ⇌ H2 + CO2 | (6c) |
The electrochemical half-reaction within the porous anode electrode is:
| 2O2− → O2 + 4e− | (7) |
The operating voltage (eqn (8)) is determined taking into account the equilibrium potential, EH2O/CO2, the activation overpotentials, ηi, and the ohmic losses in the electrolyte and the electrodes, ηohm.
| Ve = EO2 − Ei + ηO2 + ηi + ηohm | (8) |
The overpotentials are computed by solving the Butler–Volmer equation, (S6d).† The morphology of the porous electrode is taken into account by considering the active specific surface area, av. The temperature dependence of the exchange current density, i0,i, follows an Arrhenius-type law.
According to Ni et al.25 and experiment results,26,27 the exchange current density for carbon monoxide can be approximated as i0,CO = 0.4i0,H2. The conductivity of the electrodes and the solid electrolyte are temperature dependent and can be described by an Arrhenius-type law, see eqn (S6f) and (S6g).† A summary of the material and parameter values for the electrolyzer is given in Table S1.†. Further details about the electrolyzer model (fluid flow, species transport, and heat transfer equations) are given in the ESI.†
3 Device setup
3.1 Photoabsorber materials
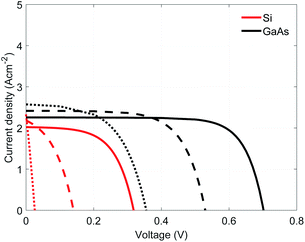
For our reference case, two absorber materials were analyzed: Si and GaAs. The first one was selected due to its small band gap (1.1 eV at room temperature) while the second one was selected for its higher absorption coefficient, allowing the use of thinner absorbers. These materials are assembled with GaP as selective electron contact, given its larger bandgap (2.27 eV) and the matching band level positions. The performance of these assemblies, GaP/Si and GaP/GaAs, were computed in the range of 600 to 800 K (expected photoabsorber operating temperatures), a solar concentration of 100 suns (1 sun corresponds to 1 kW m−2 at AM1.5 spectrum), using a 0.5 μm thick n-doped barrier (ND = 1 × 1016 cm−3) and a p-doped absorber (NA = 1 × 1018 cm−3) of 5 μm Si or 1 μm GaAs. In both cases, the short-circuit current density increases while the open circuit potential decreases when the operating temperature is increased (Fig. 3). The GaP/GaAs assembly performs better than the GaP/Si assembly, showing larger current densities and larger open circuit voltages. This increased performance results from the higher absorption coefficient of GaAs and also the relative position of the Fermi levels of the barrier and absorber, determining the built-in voltage. This voltage is larger in GaP/GaAs than in GaP/Si (0.97 V against 0.63 V at 600 K). However, given the various overpotentials, the required electrolyzer voltage is larger than the equilibrium potential of water or syngas, which will necessitate the use of multiple assemblies connected in series.3.2 Electrolyte material
Fig. S8† shows a comparison of the temperature-dependent ion conductivity of well known materials used in solid oxide fuel cells.28,29,31–34 Yttria-stabilized zirconia (YSZ) requires operating temperatures above 700 °C for reasonable conductivity (1 × 10⁻² S cm−1), while gadolinium-doped ceria (CGO) or lanthanum strontium gallium magnesium oxide (LSGM) show similar conductivities already at 550 °C.35 Proton conducting electrolytes could be used for lower operating temperatures (350–600 °C) due to their high proton mobility. However, protonic conductors are relatively novel, dealing with mayor stability challenges in CO2 environments and require significant sintering temperature.36 For example, yttrium doped BaZrO3 (BZY) shows good chemical stability but poor sinter ability.37 Therefore, our reference solid electrolyte was CGO.3.3 Reference case
For the reference case, the reactant inlet temperature is 150 °C, large enough to ensure operation of the electrolyte. The inlet velocity is set to 2 m s−1 to avoid mass transport limitations. The absorber and electrode lengths are equal, Lel = Lsc, and are 4 cm. The absorber width, wsc, is 1 cm per cell with 4 cells in series, Nsc, arranged next to one another in order to ensure enough photovoltage. The electrode width is wel = Nscwsc, the electrolyte thickness is 10 μm to reduce the ohmic losses and the electrodes thickness is 100 μm as in Momma et al.30 The anode chamber height is set to 2 mm to keep the photoabsorber at a lower temperature than the electrolyzer components. Table S2† summarizes the reference parameters.3.4 Alternative configurations
We conducted a full sensitivity and parameter study in order to see the effect on the performance of the device from the energetic and production point of view. Specifically, we combined different designs, incorporating variations of operating conditions, architectures and materials. The parameters used for each scenario are shown in Table 2.| Scenario | Electrolyte | Absorber | N sc | h a (mm) | T in (°C) | u c (m s−1) | k H2 (A m−1) | Flow | x H2O/xCO2 | TJ (—) | |
|---|---|---|---|---|---|---|---|---|---|---|---|
| Hydrogen | Ref | CGO | GaAs | 4 | 2 | 150 | 2.0 | 3.9 × 10 8 | PF | 0.60/0.00 | 1j |
| ha-1 | — | — | — | 1 | — | — | — | — | — | — | |
| ha-3 | — | — | — | 3 | — | — | — | — | — | — | |
| N-3 | — | — | 3 | — | — | — | — | — | — | — | |
| u-1.5 | — | — | — | — | — | 1.5 | — | — | — | — | |
| u-1.0 | — | — | — | — | — | 1.0 | — | — | — | — | |
| u-0.5 | — | — | — | — | — | 0.5 | — | — | — | — | |
| CF | — | — | — | — | — | — | — | CF | — | — | |
| ia1 | — | Ideal 1 | — | — | — | — | — | — | — | — | |
| ia2 | — | Ideal 2 | — | — | — | — | — | — | — | — | |
| ie | Ideal | — | — | — | — | — | — | — | — | — | |
| k H2 | — | — | — | — | — | — | 3.9 × 10 9 | — | — | — | |
| tj-2j | — | — | — | — | — | — | — | — | — | 2j | |
| Syngas | Ref | CGO | GaAs | 4 | 2 | 150 | 2.0 | 3.9 × 10 8 | PF | 0.60/0.25 | 1j |
| N-3 | — | — | 3 | — | — | — | — | — | — | — | |
| T250 | — | — | — | — | 250 | — | — | — | — | — | |
| ia2 | — | Ideal 2 | — | — | — | — | — | — | — | — | |
| xh2o-35 | — | — | — | — | — | — | — | — | 0.35/0.50 | — | |
| xh2o-25 | — | — | — | — | — | — | — | — | 0.25/0.60 | — |
4 Results
The performance metrics used to compare the different designs are the solar-to-fuel efficiency (STF) and the molar flow of fuel produced (ṅi), measured at the outlet of the device: | (9) |
 is the Gibbs free energy at 298 K (for water splitting:
  , and for CO2 splitting:
  ).
).
4.1 Water splitting
It is important to note that thermal gradients could lead to thermal stresses in the ceramic electrolyte and electrodes, resulting in device degradation or failure. Here, we show the computed thermal gradients as an indication of the thermomechanical behavior. Stress computations, not considered here, would be required to provide more detailed insights. For the reference case, the solid electrolyte operates under a thermal gradient of 85 K cm−1 at a concentration of 50 suns. This gradient increases linearly as function of the solar concentration, reaching 228 K cm−1 at concentrations of 170 suns (Fig. S10b†).
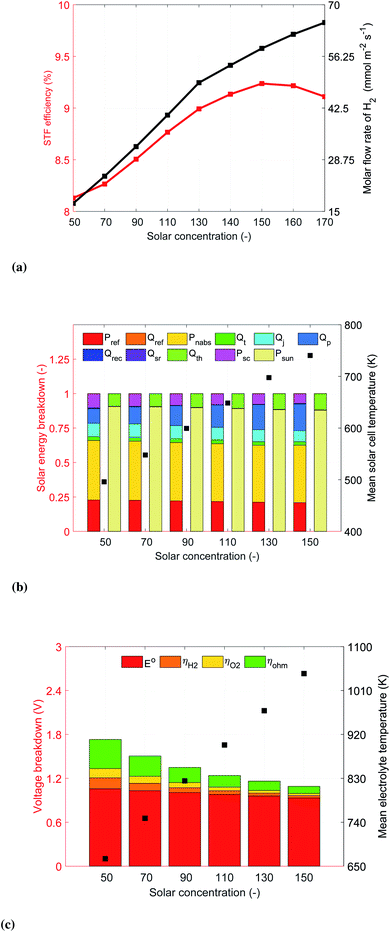
From the energetic point of view, the reference device is able to achieve 8.13% STF efficiency at a solar concentration of 50 suns (Fig. 4a). The performance is limited by the photocurrent density provided by the four HTSCs connected in series and the low operating temperature in the electrolyzer components (mean temperature ∼ 630 K). As the solar concentration is increased, the temperature of the photoabsorber assemblies and the electrolyzer elements rise, which decreases the conversion of solar energy into electrical power density, Psc, and the potential requirements for the electrolyzer, see Fig. 4b and c. The deterioration in performance of the photoabsorber assemblies is due to a reduction in the electric field of the barrier semiconductor, which leads to smaller open circuit potentials, this can be observed in the reduction and increase of the Joule and Peltier heat sources, respectively. Overall, the reduction and improvement of the HTSC and SOE components of the device lead to an initial improvement of the device with increasing irradiation concentration, followed by a decrease in the energetic and production performance of the device. Note that the maximum H2 production rate of 65.25 mmol m−2 s−1 was at a solar concentration of 170 suns while the maximum STF efficiency of 9.24% was achieved at a concentration of 150 suns. The model was not able to converge at higher solar concentrations, which we associate to a lack of photovoltage (at those concentrations the temperature of the solar cells is above 800 K) and mass transport limitations (the current density is above 1400 mA cm−2, see Fig. S11†). The peak in efficiency vs. concentration occurs due to a steeper slope of the I–V curve of the HTSCs at concentrations above 150 suns. This results from the rise of the operating temperature, resulting in smaller improvements of the operating current density with respect to increased concentration while the operating current continues to increase. This behaviour also explains why the maximum molar concentration doesn't occur at the same solar concentration. We didn't reach the peak in H2 generation for the concentrations investigated, but expect that for higher solar concentrations the operating point will eventually decrease due to the high operating temperatures.
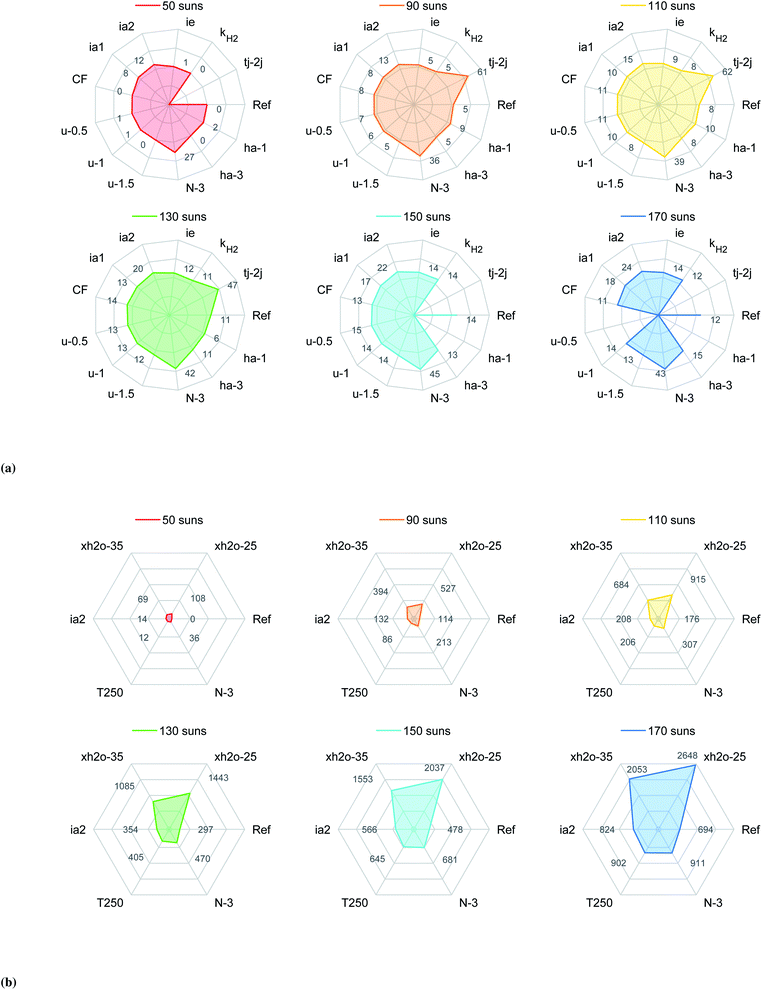
Anode chamber height. The separation between the solar cells and the electrolyzer elements affect their operation temperatures (scenarios ha-1 and ha-3). Reducing the anode chamber to 1 mm improves the efficiency of the device by 2 to 4% (Fig. 5a) and the generation of H2 by 2 to 8% (Fig. S15a†) with respect to the reference case at the same solar concentrations. This improvement is due to a rise in the operating temperature of the photoabsorber assembly which increases the photogenerated current density in the upper region of its I–V curve. However, the higher temperatures also limit the range of operation since at 130 suns the solar cells already reached a temperature of nearly 750 K, which is similar to the one achieved by the reference case at 170 suns, see Fig. S14a.† On the other hand, increasing the separation between the HTSC and the anode electrode doesn't improve the performance of the device for most of the analyzed solar concentrations. One exception is observed at 170 suns where the device can perform better than the reference case, which is due to a small reduction of the temperature of the photoabsorber assembly (∼3 K for all solar concentrations) while the temperature of the electrolyzer elements increases due to an increase in the non-absorbed solar irradiation (increase in the band gap of the absorber).
Cathode flow velocity. The reduction of cathode-side inlet velocity is an alternative approach to increasing the SOE temperature while keeping the HTSCs at a lower temperature since the anode-side inlet velocity is kept at 2 m s−1. Decreasing the inlet cathode velocity to 1.5, 1.0, and 0.5 m s−1 (scenarios u-1.5, u-1.0, and u-0.5) resulted in a hotter fluid in the cathode chamber and a cooler fluid in the anode chamber. This induced a shift of the electrolyzer curves towards lower voltages (see Fig. S11b and S14†). The temperature of the electrolyzer was increased by reducing the inlet velocity. However, the improvement of the current provided by the solar cell was very low, improving the efficiency of the device by 1 to 3% only, and the generation of H2 by 1 to 7%, all with respect the reference case working at the same concentrations. It is important to note that reducing the inlet velocity leads to higher thermal gradients in the solid electrolyte. The highest values of 125 to 300 K cm−1 were reached for an inlet velocity of 0.5 m s−1, see Fig. S10b.†
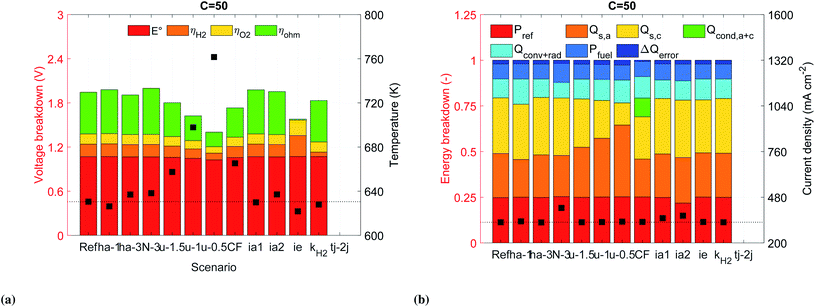
Flow direction. Alternatively, the flow direction design (parallel flow (PF) versus counter flow (CF)) can be used to affect the temperature field. Working in counter-flow rises the temperature along the solid electrolyte and the photoabsorber faster than in the previous case, given the larger thermal difference between the anode and cathode chamber (Fig. S9b†). This temperature field also increases the conduction losses at the inlet (see Fig. 6b). Similarly to the previous scenario, the improvement in the electrolyzer and a negligible improvement in the solar cell leads to efficiencies improvements of nearly 3%, and H2 generation improvements between 6 and 9% with respect the reference case at the same concentrations. The maximum performance occurs at 130 suns, for higher solar concentrations the temperature of the solar cell is close to 800 K. From a mechanical point of view, the thermal gradients in the ceramic electrolyte were even higher than the previous case, reaching values between 400 and 1300 K cm−1. The probability of mechanical failure is higher for a device working in counter-flow.
Number of photoabsorbers. Since the photoabsorbers play an important role in the performance, cost, and scalability of the device, we tried to increase the operating current density by reducing the number of photoabsorbers connected in series. By using three photoabsorbers (scenario N-3) instead of four, the operating point was much closer to the maximum power point (MPP) of the HTSC, reducing the conversion of solar energy into heat (Fig. S12 and S14a†). These conditions allowed to improve the STF efficiency by 27 to 31% (Fig. 5a) and the generation rate of H2 by 27 to 106% (Fig. S15a†) compared to the reference case at the same concentrations. However, reducing the number of photoabsorbers also reduces the photovoltage, which leads to a decrease in performance when increasing irradiation concentration, showing a maximum performance at 150 suns.
Tandem solar cells. The current density can be increased by using multiple junctions. Such solar cells provide a higher open circuit voltage allowing for the use of one tandem cell only to drive the reactions. For this study we selected a cell composed of GaP/GaInP–GaP/GaAs. GaInP was the secondary absorber given its band gap is larger than GaAs and its adequate band level positions with respect to the barrier GaP. The calculation of the I–V performance revealed that the current density of the tandem cell was limited by the GaInP. A comparison between single and tandem solar cells is shown in Fig. S17.† When connected to the electrolyzer, it was not possible to drive the reactions at a solar concentration of 50 suns only due to high voltage requirements by the electrolyzer. However, at higher concentrations the device reached substantial improvements with respect the reference case, i.e. between 53 to 62% improvement in efficiency and between 76 to 119% improvement in production of H2. The maximum efficiency for this case occurred at 110 suns, further increasing the concentrations led to a very fast drop in the photovoltage, reducing the operating current density.
Ideal photoabsorber. Since the photovoltage of the HTSC is reduced at high solar concentrations (mainly because of the rise of the operating temperature), alternative materials need to be researched for that allow for an increased open circuit voltage (Voc). Increasing the Shockley–Read–Hall life time by one order of magnitude (τsrh,e = 5 × 10⁻⁸ s), reducing the radiative recombination coefficient by one order of magnitude (B = 1 × 10⁻¹¹ cm3 s−1), and reducing the surface velocity recombination at the back of the HTSC by one order of magnitude (S3 = 1 × 103 cm s−1), lead to a significant improvement in the Voc. A more systematic improvement was achieved at high temperatures. For instance at 600 K and 800 K, the Voc was improved by 18% and 43%, respectively, compared to the initial design (Fig. S16†). A photoabsorber with those material properties (scenario ia1) would have a similar energetic performance as the counter-flow case, but without the inconveniences of large thermal gradients in the ceramic materials and the possibility to work at higher solar concentrations. Furthermore, the H2 generation rate would be improved by 8% to 19% with respect the reference case (Fig. S15a†).
We also noted that a significant portion of the solar irradiation was lost by reflection. Decreasing this loss can be achieved by reducing the refractive coefficient of GaP. This assumption aimed at approximating an anti-reflection coating through texturization or passivation. Assuming a reduction by an absolute value of 0.5 for the whole spectrum (scenario ia2) reduced the reflection losses by 3% with respect the reference case, see Fig. 6b. This change also allowed to improve the STF efficiency by 7 to 12% and the molar production rate of H2 by 12 and 26%.
Ideal solid electrolyte. We addressed the large ohmic losses by replacing the realistic solid electrolyte with an ideal solid electrolyte with a similar ionic conductivity as a SDC/Na2CO3 nanocomposite,34 but following an Arrhenius behavior (Fig. S8†). This allowed to reduce the ohmic losses in the solid electrolyte by nearly 98% at a concentration of 50 suns. However, the results showed an unexpected increase in the activation overpotentials (Fig. 6a). This increase in activation overpotential turned out to be a result of the decrease in the Joule heating within the solid electrolyte (QJH, eqn (S11b)†), decreasing the temperature of the electrodes and therefore activity. The improvement regarding the STF efficiency was between 1 to 2%, while the improvement of H2 generation was between 1 to 5% with respect the reference case at the same concentrations. Further improvements in the ionic conductivity of the electrolyte will possibly won't be beneficial for the improvement of the device.
Cathode catalyst. We investigated the effect of the catalyst's activation overpotential, ηH2, by increasing the pre-exponential factor of the exchange current density, kH2, by one order of magnitude. The hydrogen reaction overpotential, ηH2, was reduced by 64% at a concentration of 50 suns (Fig. 6a). However, the reduction in voltage just allowed to slightly improve the operating current density which resulted in no improvement of the energetic efficiency but around 1% regarding the molar flow rate of H2, see Fig. S15a.†
4.2 Water and carbon dioxide splitting
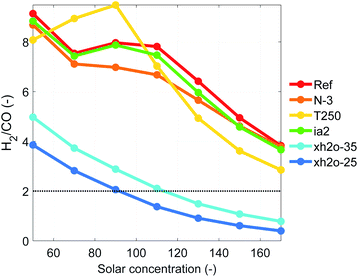
The advantage of high-temperature electrochemistry is the relatively straight forward reduction of CO2 to CO at reasonable overpotentials. Similarly, our HTSC-SOE device can be used for the concurrent generation of syngas. When generating syngas, the performance of the device is slightly higher than when generating only H2. For instance, the STF efficiency for the reference case at a concentration of 50 suns is 8.29% with molar flow rates of 15.5 mmol m−2 s−1 and 1.69 mmol m−2 s−1 for H2 and CO, respectively (Fig. S18†). The generation of CO is smaller compared to H2, leading to large H2/CO ratios. However, it is possible to improve the generation of CO by increasing the solar concentration, which increases the temperature in the electrodes (Fig. 7). A minimum H2/CO ratio of 3.8 is reached for the reference case at a concentration of 170 suns due to limitations in the current density provided to the electrolyzer. A H2/CO ratio of 2 is desired for feedstock in a Fischer–Tropsch reactor for the generation of synthetic fuels. We tried to reach this ratio through two approaches. Firstly by increasing the operating temperature of the electrodes and secondly by reducing the amount of water at the inlet of the cathode chamber. For the first approach, we either increased the operating current density (use of three photoabsorbers N-3 or an ideal photoabsorber ia2) so the electrodes can reach a higher temperature by Joule heating or we increased the inlet temperature of the reactants at the inlet of cathode chamber (T250). Both approaches allowed to decrease the H2/CO ratio, but the results were not satisfactory. Playing with the inlet water fraction showed more promise since there was simply less water available for the H2 formation, see Fig. 5b. This improved the generation rate of CO by 60 to 1360% with respect to the reference case at the same concentrations. A H2/CO ratio of 2 was achieved when the inlet molar fraction of water was reduced to 0.35 and 0.25, and the inlet molar fraction of carbon dioxide was between 0.5 and 0.6. Also under these conditions, the generation of CO by the thermochemical water gas shift reaction is more significant than the other cases. For other conditions, the thermochemical reaction mostly consumes CO to convert it into H2 (S20).† The maximum conversion of H2O and CO2 achieved by our device was only 27% and ∼6%, respectively (Fig. S19†), indicating that large amounts of reactants were not used, a shortcoming that should be improved for practical implementation.5 Conclusions
We investigate the feasibility, design and potential of a high-temperature (Tsc ≥ 500 K) photoelectrochemical device. High-temperature approaches have the potential to operate at significantly reduced potentials and with the use of more earth abundant materials. Particularly, the proposed device utilizes photon-enhanced thermionic emission for the charge generation and separation in semiconducting materials (called a high temperature solar cell, HTSC) and a solid oxide electrolyte (SOE) based electrolyzer. The two components (HTSC and SOE) are in close vicinity. We developed a multi-dimensional and multi-physics model of such a high temperature photoelectrochemical device. The model accounts for generation, recombination and transport of photocarriers by solving Poisson, transport, continuity, radiative transfer and energy equations, but also the generation, consumption and transport of species by solving the Butler–Volmer, Stokes–Brinkman, continuity and energy equations.We show that such a quasi-integrated HTSC-SOE device is feasible and can work at high temperatures, generating H2 or syngas. Two photoabsorber assemblies were investigated: GaP/GaAs or GaP/Si. The former showed better performance due to a better absorption coefficient and a larger built-in voltage. Nevertheless, the generally low photovoltages at high temperatures made it necessary to use multiple GaP/GaAs assemblies connected in series, but at the expense of reduced injected photocurrent. Larger photovoltages (830 mV at 600 K) could be achieved by ideal absorber materials with significantly reduced recombination and increased life time of electrons. Finding new synthesis methods, new fabrication techniques, or new combination of materials could open the possibility of improving the performance of high-temperature photoelectrochemical devices. We investigated the role of design, operation and material choice on the energetic and production performance of the HTSC-SOE device. It was found that the limiting factor in the device is the photoabsorber. Improved performance was achieved mainly by increasing the current density provided by the solar cells, rather than reducing the voltage requirements from the electrolyzer. A smaller number of photoabsorbers allows to reach higher efficiencies but it will be limited by the photovoltage at high solar concentrations. This issue could be addressed by reducing the recombination of photocarriers. Alternatively, tandem solar cells are a good option for increasing the maximum photovoltage which reduces the number of solar cells to only one assembly, which at the same time increases the operating current density. However, this assembly is limited to work at lower solar concentrations (110 suns), which also limits the generation of H2 in comparison with solar cells connected in series.
Syngas generation was feasible with the proposed device. It was found that an appropriate H2/CO ratio of 2 could be achieved when limiting the amount of water available for H2 formation. The inlet molar fraction of H2O and CO2 can be varied in order to reach the correct H2/CO ratio at different solar concentrations which allows to control the production of syngas.
The developed model and the presented results provide design guidance for such a high-temperature photoelectrochemical device, indicate its feasibility (with current materials), and show that it can be operated at efficiencies in the range of 8 to 12%, a value warranting further investigation regarding alternative designs to improve the performance of the device, analyze the mechanical structure regarding thermal stresses, and evaluate cost competitiveness.
Nomenclature
Conflicts of interest
There are no conflicts to declare.Acknowledgements
This material is based upon work performed with the financial support of a Starting Grant of the Swiss National Science Foundation, as part of the SCOUTS project (grant #155876). We would like to thank Meng Lin from LRESE-EPFL, for useful discussions on multi-physics modeling.References
- S. Licht, B. Wang, S. Ghosh, H. Ayub, D. Jiang and J. Ganley, J. Phys. Chem. Lett., 2010, 1, 2363–2368 CrossRef CAS.
- S. Licht, H. Wu, J. Lau, B. Wang, C. Hettige, H. Bergmann and J. Asercion, Electrochem. Soc., 2012, 41, 191–199 CAS.
- M. Lin and S. Haussener, J. Power Sources, 2018, 400, 592–604 CrossRef CAS.
- S. Licht, J. Phys. Chem. B, 2003, 107, 4253–4260 CrossRef CAS.
- S. Licht, J. Phys. Chem., 2009, 113, 16283–16292 CAS.
- Y. Yang, W. Yang, W. Tang and C. Sun, Appl. Phys. Lett., 2013, 103, 083902 CrossRef.
- X. Ye, J. Melas-Kyriazi, Z. A. Feng, N. A. Melosh and W. C. Chueh, Phys. Chem. Chem. Phys., 2013, 15, 15459 RSC.
- J. W. Schwede, I. Bargatin, D. C. Riley, B. E. Hardin, S. J. Rosenthal, Y. Sun, F. Schmitt, P. Pianetta, R. T. Howe, Z.-X. Shen and N. A. Melosh, Nat. Mater., 2010, 9, 762–767 CrossRef CAS PubMed.
- O. A. Marina, L. R. Pederson, M. C. Williams, G. W. Coffey, K. D. Meinhardt, C. D. Nguyen and E. C. Thomsen, J. Electrochem. Soc., 2007, 154, B452–B459 CrossRef CAS.
- N. Osada, H. Uchida and M. Watanabe, J. Electrochem. Soc., 2006, 153, A816–A820 CrossRef CAS.
- X. Yang and J. T. S. Irvine, J. Mater. Chem., 2008, 18, 2349–2354 RSC.
- W. Wang, Y. Huang, S. Jung, J. M. Vohs and R. J. Gorte, J. Electrochem. Soc., 2006, 153, A2066–A2070 CrossRef CAS.
- Q. Liu, C. Yang, X. Dong and F. Chen, Int. J. Hydrogen Energy, 2010, 35, 10039–10044 CrossRef CAS.
- R. Vaillon, L. Robin, C. Muresan and C. Ménézo, Int. J. Heat Mass Transfer, 2006, 49, 4454–4468 CrossRef.
- M. A. Romain Couderc and M. Lemiti, IEEE J. Photovolt., 2016, 6, 1123–1131 Search PubMed.
- S. H. Antonio Luque, Handbook of Photovoltaic Science and Engineering, Wiley, 2003 Search PubMed.
- V. Palankovski, Ph.D. thesis, Technischen Universitat Wien, 2000.
- Semiconductors on NSM, characteristics and properties, retrieved from http://www.ioffe.ru/SVA/NSM/Semicond/ Search PubMed.
- K. Sahasrabuddhe, J. W. Schwede, I. Bargatin, J. Jean, R. T. Howe, Z. Shen and N. A. Melosh, J. Appl. Phys., 2012, 112, 094907 CrossRef.
- P. Dawson and K. Woodbridge, Appl. Phys. Lett., 1984, 45, 1227–1229 CrossRef CAS.
- C. R. Crowell, Solid-State Electron., 1965, 8, 395–399 CrossRef.
- A. Varpula and M. Prunnila, J. Appl. Phys., 2012, 112, 044506 CrossRef.
- G. Segev, Y. Rosenwaks and A. Kribus, Sol. Energy Mater. Sol. Cells, 2015, 140, 464–476 CrossRef CAS.
- C. Muresan, R. Vaillon, C. Menezo and R. Morlot, J. Quant. Spectrosc. Radiat. Transfer, 2004, 84, 551–562 CrossRef CAS.
- M. Ni, J. Power Sources, 2012, 202, 209–216 CrossRef CAS.
- Y. Matsuzaki and I. Yasuda, J. Electrochem. Soc., 2000, 147, 1630–1635 CrossRef CAS.
- A. M. Sukeshinia, B. Habibzadehb, B. P. Beckerb, C. A. Stoltza, B. W. Eichhorna and G. S. Jacksona, J. Electrochem. Soc., 2006, 153, A705–A715 CrossRef.
- M. Andersson, J. Yuan and B. Sunden, J. Power Sources, 2013, 232(42), 54 Search PubMed.
- P. Huang and A. Petric, J. Electrochem. Soc., 1996, 143, 1644–1648 CrossRef CAS.
- A. Momma, T. Kato, Y. Kaga and S. Nagata, J. Ceram. Soc. Jpn., 1997, 105, 369–373 CrossRef CAS.
- J. Huang, Z. Gao and Z. Mao, Int. J. Hydrogen Energy, 2010, 35, 4270–4275 CrossRef CAS.
- C. Zuo, S. Zha, M. Liu, M. Hatano and M. Uchiyama, Adv. Mater., 2006, 18, 3318–3320 CrossRef CAS.
- F. Abraham, J. C. Boivin, G. Mairesse and G. Nowogrocki, Solid State Ionics, 1990, 40–41, 934–937 CrossRef CAS.
- X. Wang, Y. Ma, R. Raza, M. Muhammed and B. Zhu, Electrochem. Commun., 2008, 10, 1617–1620 CrossRef CAS.
- A. J. Jacobson, Chem. Mater., 2009, 2010, 660–674 Search PubMed.
- B. Singh, S. Ghosh, S. Aich and B. Roy, J. Power Sources, 2017, 339, 103–135 CrossRef CAS.
- H. Bae, J. Choi, K. J. Kim, D. Park and G. M. Choi, Int. J. Hydrogen Energy, 2015, 40, 2775–2784 CrossRef CAS.
Footnote |
| † Electronic supplementary information (ESI) available. See DOI: 10.1039/d0se01749c |
| This journal is © The Royal Society of Chemistry 2021 |

