
 Open Access Article
 This Open Access Article is licensed under a Creative Commons Attribution-Non Commercial 3.0 Unported Licence
Automated discovery of noncovalent inhibitors of SARS-CoV-2 main protease by consensus Deep Docking of 40 billion small molecules†
Francesco
Gentile
 a,
Michael
Fernandez
a,
Fuqiang
Ban
a,
Anh-Tien
Ton
a,
Hazem
Mslati
a,
Carl F.
Perez
a,
Eric
Leblanc
a,
Jean Charle
Yaacoub
a,
James
Gleave
a,
Abraham
Stern
b,
Bill
Wong
c,
François
Jean
d,
Natalie
Strynadka
e and
Artem
Cherkasov
*a
a,
Michael
Fernandez
a,
Fuqiang
Ban
a,
Anh-Tien
Ton
a,
Hazem
Mslati
a,
Carl F.
Perez
a,
Eric
Leblanc
a,
Jean Charle
Yaacoub
a,
James
Gleave
a,
Abraham
Stern
b,
Bill
Wong
c,
François
Jean
d,
Natalie
Strynadka
e and
Artem
Cherkasov
*a
aVancouver Prostate Centre, Department of Urologic Sciences, The University of British Columbia, 2660 Oak Street, Vancouver, BC V6H3Z6, Canada. E-mail: acherkasov@prostatecentre.com
bNVIDIA Corporation, Santa Clara, CA, USA
cDell Canada, North York, ON, Canada
dDepartment of Microbiology and Immunology, The University of British Columbia, Vancouver, BC, Canada
eDepartment of Biochemistry and Molecular Biology, The University of British Columbia, Vancouver, BC, Canada
First published on 17th November 2021
Abstract
Recent explosive growth of ‘make-on-demand’ chemical libraries brought unprecedented opportunities but also significant challenges to the field of computer-aided drug discovery. To address this expansion of the accessible chemical universe, molecular docking needs to accurately rank billions of chemical structures, calling for the development of automated hit-selecting protocols to minimize human intervention and error. Herein, we report the development of an artificial intelligence-driven virtual screening pipeline that utilizes Deep Docking with Autodock GPU, Glide SP, FRED, ICM and QuickVina2 programs to screen 40 billion molecules against SARS-CoV-2 main protease (Mpro). This campaign returned a significant number of experimentally confirmed inhibitors of Mpro enzyme, and also enabled to benchmark the performance of twenty-eight hit-selecting strategies of various degrees of stringency and automation. These findings provide new starting scaffolds for hit-to-lead optimization campaigns against Mpro and encourage the development of fully automated end-to-end drug discovery protocols integrating machine learning and human expertise.
Introduction
Make-on-demand chemical libraries will soon exceed the 100 billion threshold,1–3 while structure-based virtual screening (SBVS) is well projected to remain the gold standard method for early-stage drug discovery. Molecular docking implemented on high-performing computational resources has already been proven successful in identifying potent ligands from extensive databases (from 100s of millions to up to 1 billion chemicals) for several targets.4–8 However, billion-scale SBVS remains out of reach for most academic research groups due to prohibitive computational cost.6,9,10 Therefore, universal access to ultra-large chemical libraries is not yet part of the global trend to democratize drug discovery.6,11–15 To make the situation even more challenging, conventional docking is remarkably inefficient, where the vast majority of docked molecules is discarded, while only an exceedingly small subset of top-scoring compounds is considered for analysis.16 Furthermore, docking is notoriously prone to highly ranked artifacts, which can hinder identification of true binders, a tendency that is particularly exacerbated in large-scale SBVS campaigns.4,17 Therefore, different levels of human intervention are required to efficiently discard false positives, making human inspection of docking poses a vital part of SBVS campaigns.18 Hence, ultra-large scale SBVS would greatly benefit from automatic hit selection, considering that meaningful human inspection of millions of seemingly well-docked molecules is impossible.In order to speed up and automate conventional docking (without significant loss of valuable information), we recently developed Deep Docking (DD) – an AI-driven platform that can work in conjunction with any docking program and provides economical yet reliable access to billion-sized chemical libraries for SBVS.19 Recently, similar approaches to DD that utilize AI to predict docking outcomes have emerged, including but not limited to MolPAL (molecular pool-based active learning),20 lean-docking,21 and AutoQSAR/DeepChem models.22 Importantly, the high-throughput nature of DD can be utilized for docking ultra-large libraries but also enables the simultaneous use of multiple docking programs, facilitating the deployment of stringent consensus protocols, as advocated by the best practices of computer-aided drug design (CADD).23 In other words, one could safely assume that when multiple independent docking approaches agree on a hit, the result should be associated with experimental activity with higher confidence.
In this study, we developed and deployed twenty-six hit-calling strategies that rely on DD integration with Autodock GPU,24 Glide SP,25 FRED,26 ICM,27 ad QuickVina2![[thin space (1/6-em)]](https://www.rsc.org/images/entities/char_2009.gif) 28 programs, combined with pharmacophore modeling, molecular clustering, root mean square deviation (RMSD)-based pose selection and other hit filtering approaches. These consensus-based protocols were applied to the stereoisomer-expanded Enamine Real SPACE library,29 combined with the ZINC15 database,30 totaling 40 billion molecular entries that were screened against the active site of SARS-CoV-2 main protease (Mpro). The performance of these automated hit-calling approaches was further benchmarked against two strategies, implemented by human experts and involving visual examination of docking poses.
28 programs, combined with pharmacophore modeling, molecular clustering, root mean square deviation (RMSD)-based pose selection and other hit filtering approaches. These consensus-based protocols were applied to the stereoisomer-expanded Enamine Real SPACE library,29 combined with the ZINC15 database,30 totaling 40 billion molecular entries that were screened against the active site of SARS-CoV-2 main protease (Mpro). The performance of these automated hit-calling approaches was further benchmarked against two strategies, implemented by human experts and involving visual examination of docking poses.
Results
Docking performance against Mpro
Since the beginning of the COVID-19 pandemic, countless drug discovery campaigns have been directed towards the SARS-CoV-2 Mpro enzyme. Mpro has a critical role as it mediates the proteolytic cleavage of large polyproteins resulting from viral gene translation to initiate the formation of the replication–transcription complex.31 These studies resulted in a number of confirmed micromolar and nanomolar hits, including covalent32,33 and noncovalent binders,34 fragment-like molecules,35 and some repurposed drugs.36–38 Notably, only a handful of experimentally confirmed compounds were identified via SBVS despite the release of thousands of computational predictions,9,39,40 illustrating that Mpro is a particularly challenging target for CADD in general, and for molecular docking in particular.Thus, we anticipated that the use of DD will facilitate significant expansion of the docking base (shown to be beneficial in previously reported campaigns4,5), and will also enable the use of particularly stringent consensus protocols, relying on up to five independent docking programs. To benchmark the performance of the five docking programs (Glide SP, Autodock GPU, FRED, ICM and QuickVina2) on Mpro enzymatic site as a target, we collected a set of 214 confirmed inhibitors from the literature (listed in Table S1†) and generated computational decoys using the Directory of Useful Decoys – Enhanced (DUD-E) server.41 Utilizing all five docking programs, the resulting benchmark dataset was docked into the Mpro catalytic site of the PDB:6W63's crystal structure42 (Fig. S1†).
The ability of each program to identify actives was then assessed by the resulting top 1% enrichment factor (EF) values featured on Fig. 1. Notably, these values range from 1.4 to 10.4 for individual docking programs, illustrating their remarkable variability in retrospective performances on SARS-CoV-2 Mpro. Consequently we evaluated how the application of consensus approaches could influence the docking outcomes, specifically focusing on ranking by average scores (A.S.), and selecting compounds based on 3 of 5 or 5 of 5 consensus rules43 requiring at least three or all five programs to agree on the docking pose (with the corresponding pose superpositions yielding RMSD < 2Å). We observed that consensus-based performance improved substantially with the corresponding EF values consistently increasing along with the levels of stringency from 11.5 for only A.S.-based ranking, up to 59.0 when considering all five programs agreeing on the pose (5 of 5 rule), strongly advocating in favor of consensus-centric best practices of CADD previously published by us.23
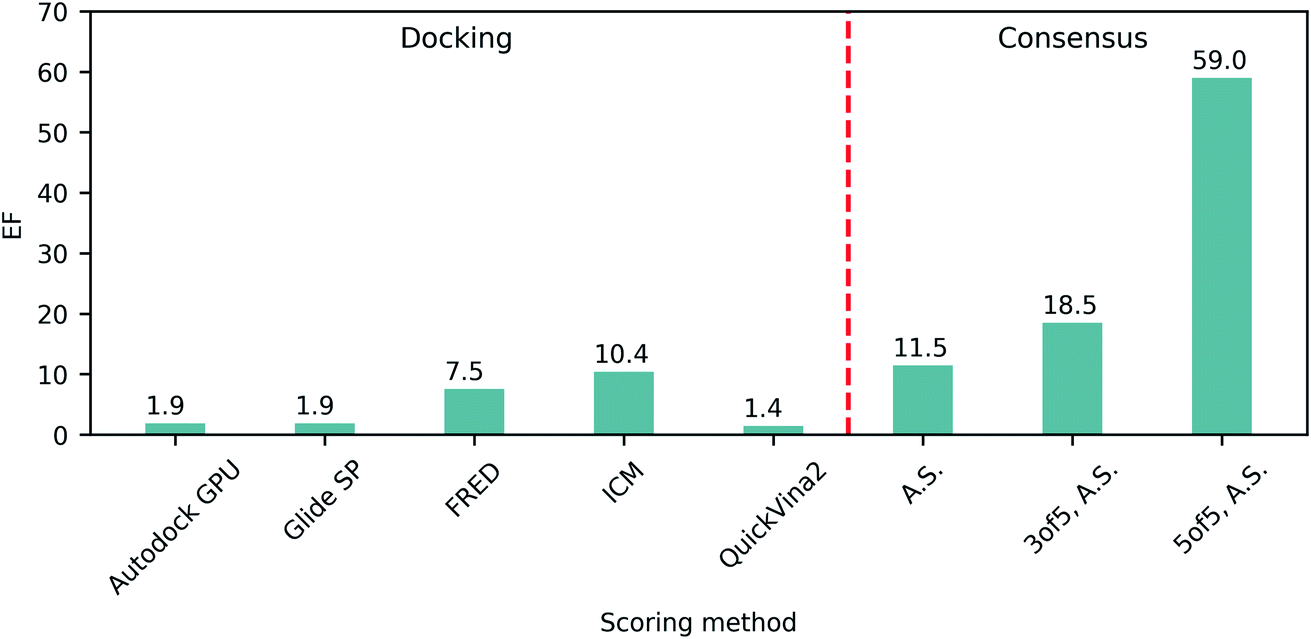 | ||
| Fig. 1 Retrospective docking benchmark. Enrichment factors (EF) of top 1% molecules from docking of ligands and decoys to the SARS-CoV-2 Mpro active site utilizing different docking programs and consensus approaches. A.S., average scores. | ||
Data-driven and expert-driven pharmacophore modeling
To deal with potential docking artifacts, an automated procedure was employed to design a pharmacophore model, as outlined in the Methods section. Notably, this model was generated in a data-driven, automated fashion, and contained only consensus features shared by multiple active ligands superposed into the active site of Mpro (as identified by the Consensus Pharmacophore Query Editor of Molecular Operating Environment (MOE) program). Human intervention was only limited to removing unnecessary pharmacophore features upon visual inspection of the binding poses. The resulting pharmacophore shown on Fig. 2 recapitulates six key protein–ligand interaction features: a hydrogen bond acceptor with His163 in the S1 sub-site (F1), an aromatic/hydrophobic feature engaging S1 in hydrophobic, π–π, or cation–π interactions (F2), a hydrogen bond acceptor engaging Glu166's backbone amide (F3), a aromatic/hydrophobic moiety placed in the S2 sub-site (F4), a hydrogen bond acceptor feature in S1′ (F5) and an aromatic moiety occupying S1′ (F6).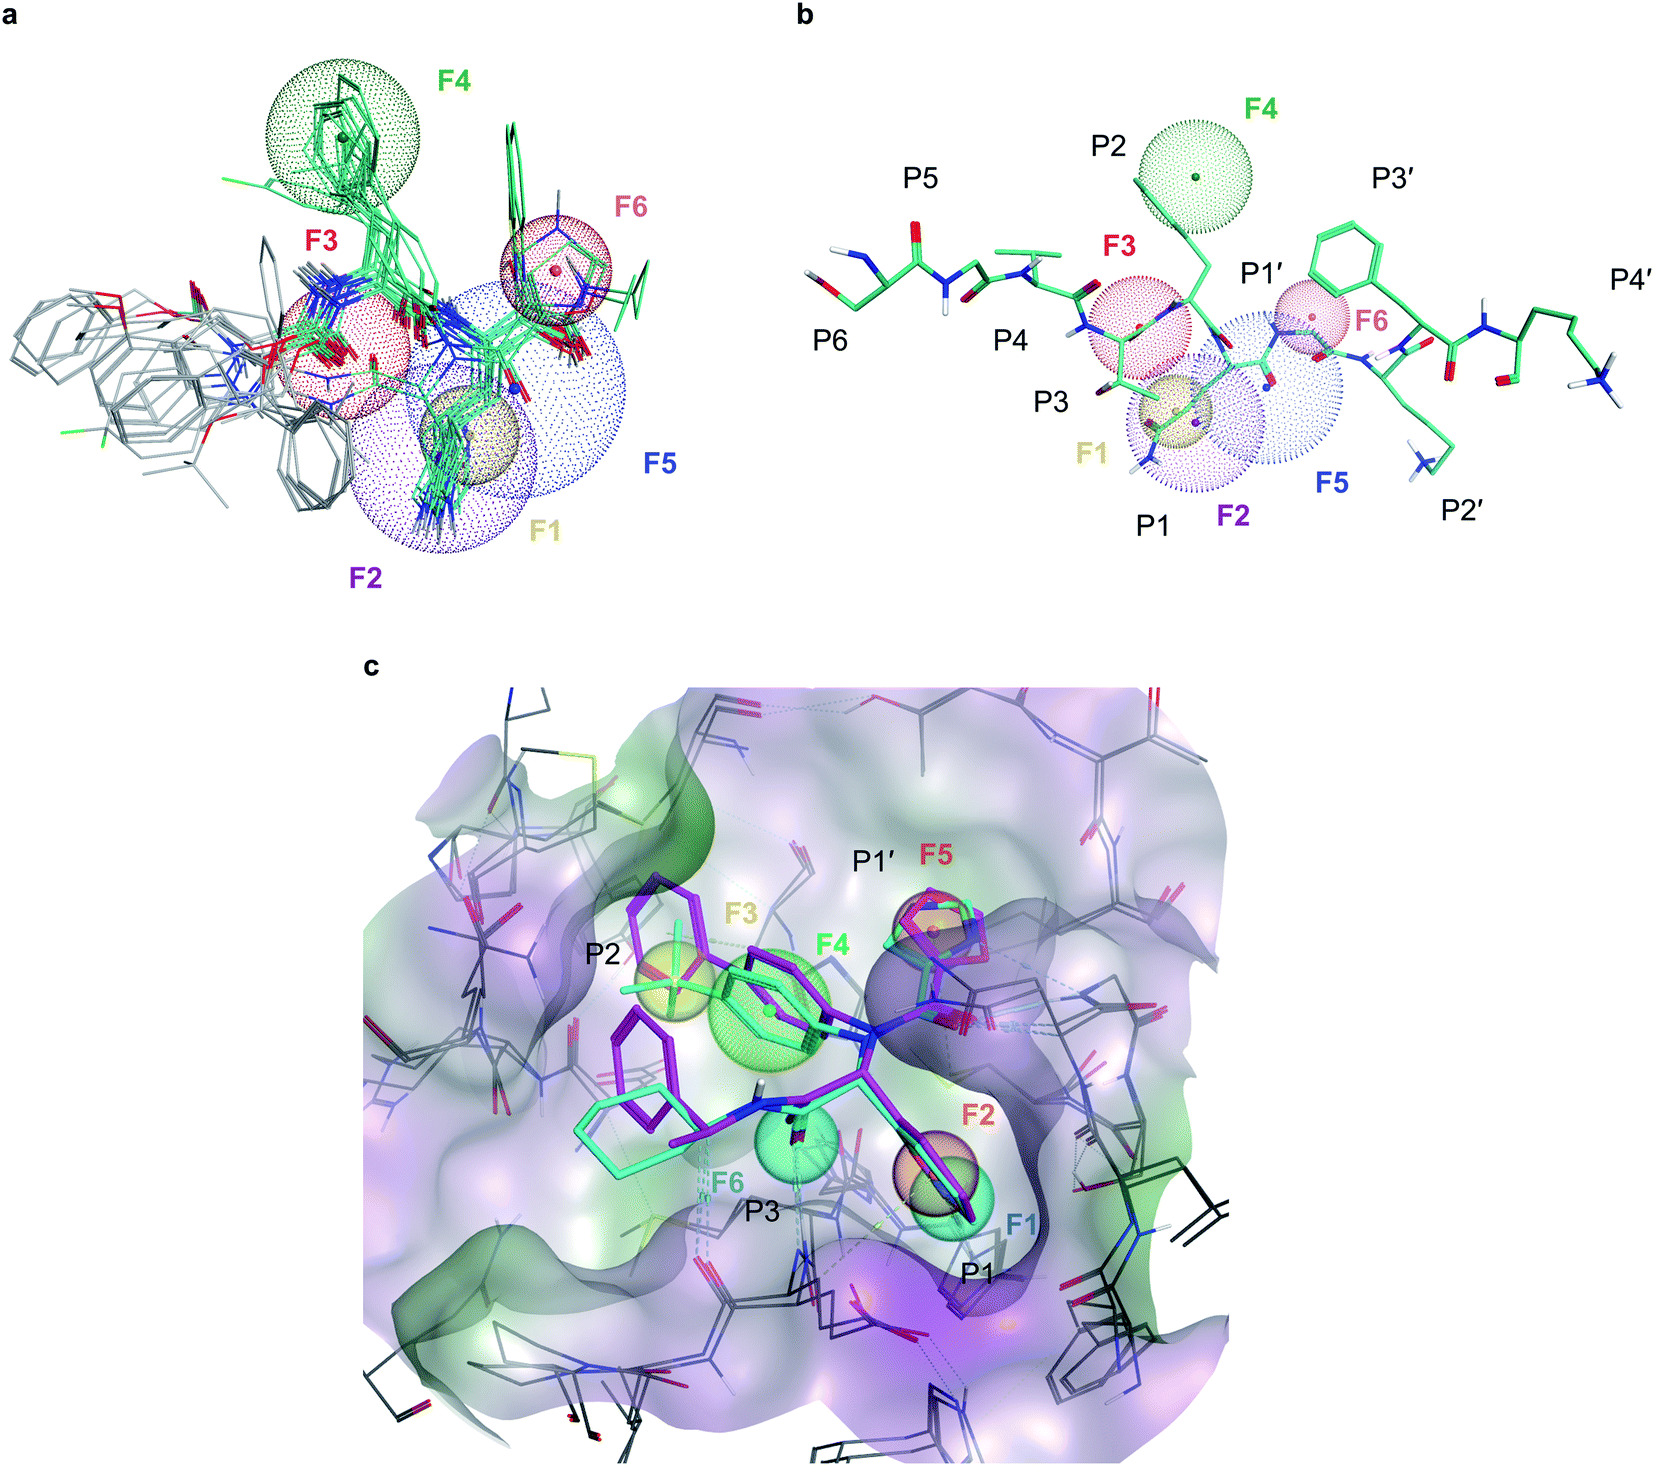 | ||
| Fig. 2 Pharmacophore models developed for Mpro inhibition (a), six-point pharmacophore model generated by superposing the structures of potent Mpro inhibitors from literature. F1: hydrogen bond acceptor feature, F2: hydrophobic/aromatic feature, F3: hydrogen bond acceptor feature, F4: hydrophobic/aromatic feature, F5: hydrogen bond acceptor feature, F6: aromatic feature (b), superposition of the pharmacophore model with C-terminal domain substrate of SARS-CoV-1 (same auto-cleavage sequence than SARS-CoV-2 before the cleavage site, extracted from PDB:5B6O45). (c) The expert-designed pharmacophore model was generated by overlapping the binding pocket of two Mpro ligands (PDB:6W63, cyan and 7KX5, purple) and manually selecting features. F1: hydrogen bond acceptor feature, F2: hydrophobic/aromatic feature, F3: hydrophobic/aromatic feature, F4: hydrophobic/aromatic feature, F5: hydrophobic/aromatic feature, F6: hydrogen bond acceptor feature. | ||
In parallel, a highly detailed pharmacophore model was constructed by an expert using the binding pose of X77 compound from the PDB:6W63 structure42 of Mpro, and from the structure of Jun8-76-3A molecule found in PDB:7KX5.44 This expert-designed pharmacophore model involved aromatic/hydrophobic (F1) and hydrogen donor (F2) features respectively placed at P1 position, one aromatic/hydrophobic feature (F3) at P2, an aromatic/hydrophobic linker (F4) between P1 and P2, an aromatic/hydrophobic feature (F5) at P1′ and a hydrogen bond acceptor feature (F6) at P3, as shown on Fig. 2c. Unlike the pharmacophore model generated by MOE, the design of this model was fundamentally expert-driven and did not rely on automatic detection of binding features from available crystallographic data.
Deep Docking of 40 billion molecules
To carry out the ultra-large DD campaign, we generated a combined library of purchasable chemicals by merging ZINC1530 with an enumerated Enamine REAL Space library,29 resulting in 40061717551 unique molecular entries. The conventional docking of a library of this size would require extraordinary resources, and up to 10 years of running time with the fastest Autodock GPU program implemented on 250 GPU units. Instead, we utilized the DD method to screen the library.
In its essence, DD is a classification model that is trained with the chemical fingerprints and docking scores of a small sample of a chemical library, and used to predict the top scoring molecules (virtual hits) while discarding unfavorable molecules without requiring to dock the entire database. Virtual hits are defined as molecules ranked by their scores within a user-defined top percentage of the library's molecules (see Methods section for the values used in this work). DD is an iterative process, where at each iteration the training set (initially a random sample of the library) is enriched with predicted virtual hits from the previous iteration, the virtual hit criterion becomes more stringent, training is repeated and inference is run over the whole library. As a result of this progressive model improvement, the number of molecules predicted as virtual hits is expected to decrease with every new iteration, enabling the user to conventionally dock the remaining molecules comprising true virtual hits without requiring prohibitive amounts of computational power.19
In this work, we sequentially used the DD method with five popular docking programs, switching to a different program when model performance did not significantly improve with further training augmentation: starting with Autodock GPU, we ran DD iterations on the original library of 40 billion compounds, and we compared the number of predicted virtual hits at the end of an iteration with the number of predicted virtual hits in the previous one; after three iterations, we observed that the decrease power of DD did not improve significantly with further training, as more than 80% of the previously predicted virtual hits were still retained despite augmenting the training set, and thus we did not proceed further with Autodock GPU. Nevertheless, this yielded 10-fold reduction of a docking database by Autodock GPU with a remaining ∼4 billion molecules predicted as probable virtual hits. The same procedure was then repeated with Glide SP-DD using the 4 billion remaining molecules as the starting point, followed by FRED, ICM, and the slowest QuickVina2, until the total number of predicted virtual hits was reduced to ∼24 million molecules (Table 1). The consecutive DD runs with the five programs took us approximately nineteen days of computing on 250 GPUs and 640 CPU cores, and resulted in a significant 1500-fold reduction of the initial 40 billion docking library. It should be noted that the extend of reduction of the docking database is expected to depend on the order of the application of the docking programs. Therefore, we prioritize the high-throughput capability of each docking algorithm to achieve faster library reduction. The fact that the five popular programs collectively qualified only 24 million compounds out of more than 40 billion docked molecules (0.06%), once again may highlight a very approximate nature of molecular docking.
| Program | Initial database size | Iterations | Final database size | Docked molecules |
|---|---|---|---|---|
| Autodock GPU | 40061717551 |
3 | 4111746581 |
140959099 |
| Glide SP | 4111746581 |
2 | 1076353681 |
10700509 |
| FRED | 1076353681 |
2 | 386798133 |
2647683 |
| ICM | 386798133 |
2 | 113133068 |
1044151 |
| QuickVina2 | 113133068 |
3 | 24016409 |
411160 |
| Total | 45853473572 |
12 | — | 155762602 |
Top-ranked compound selection from independent docking programs
While only 0.06% of molecules were consistently ranked by all five programs (in DD mode), the remaining 24 million candidate compounds still posed a significant challenge for meaningful hit selection and required the use of various post-docking scoring and filtering tools. Hence, we experimented with a broad variety of CADD filters and consensus procedures to reduce this amount of chemicals to manageable hitlists. The corresponding hit-calling strategies are illustrated by Fig. 3 and discussed below in greater details.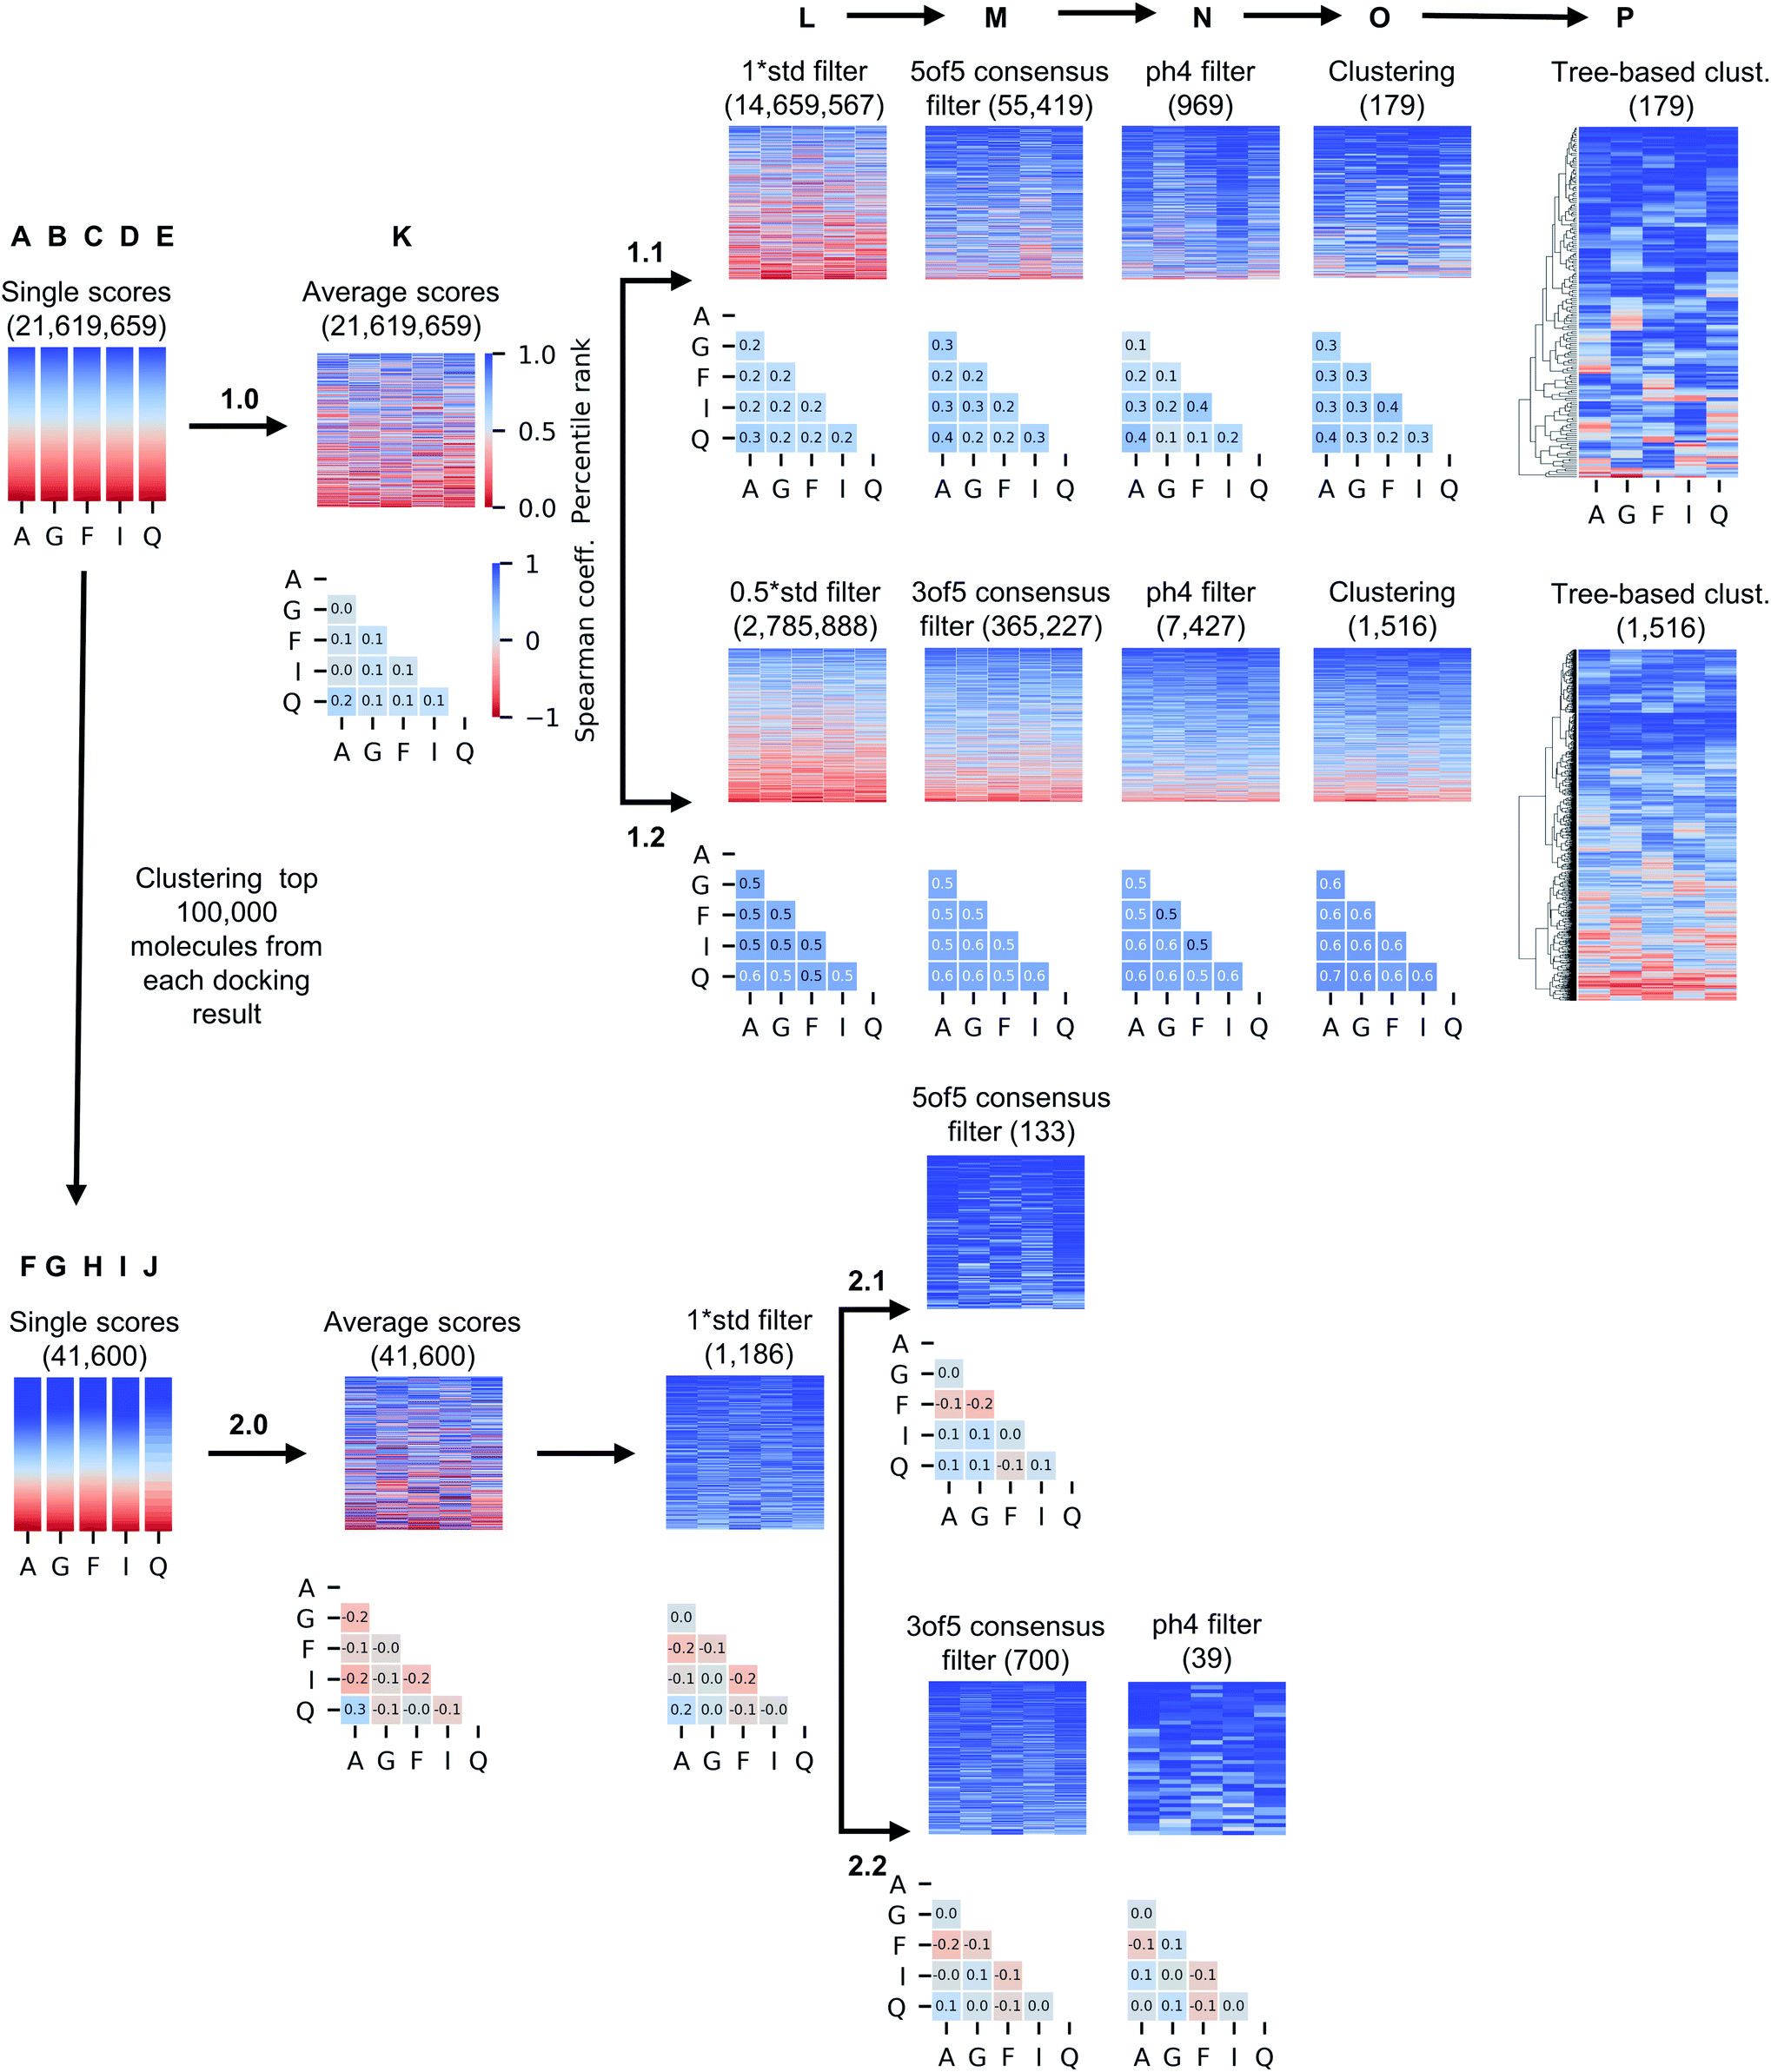 | ||
| Fig. 3 Computational hit selection strategies. In arm 1, molecules were ranked by average docking scores (1.0_K) and then serially filtered by standard deviation (std) of the docking scores (L), consensus docking (M), pharmacophore (ph4) modelling (N), and best-first clustering based on average scores (O), and then re-ranked using tree-based clustering based on five scores (P). Two different combinations of std values and numbers of consensus programs were used (1.1 and 1.2 branch). In arm 2, top 100000 molecules from each individual docking result were best-first clustered and the same process was repeated, using 1 std cutoff (2.0_L). Compounds in the heatmaps are colored by their individual, original ranks from docking, and the number of retained compounds is reported below the name of the strategy. Correlation values of single docking ranks improved with the filtering procedure, although ranking correlation was less significant when best-first clustering was applied to the outcomes of single docking programs, as illustrated by the Spearman matrices below heatmaps. A: Autodock GPU, G: Glide SP, F: FRED, I: ICM, Q: QuickVina2. | ||
Firstly, we selected hits solely from the ranks obtained by individual docking programs (lists A, B, C, D, E in Fig. 3). The top-100 compounds on these five hit lists were then clustered based on Tanimoto similarity to determine their underlying chemical diversity (as depicted in Fig. 4). The constructed structure-similarity trees exhibited rather close agglomeration scores and maximum tree depth values for all five docking approaches, which suggest equally diverse nature of identified hits, except for FRED that yielded fewer chemical scaffolds (details in Fig. S2†).
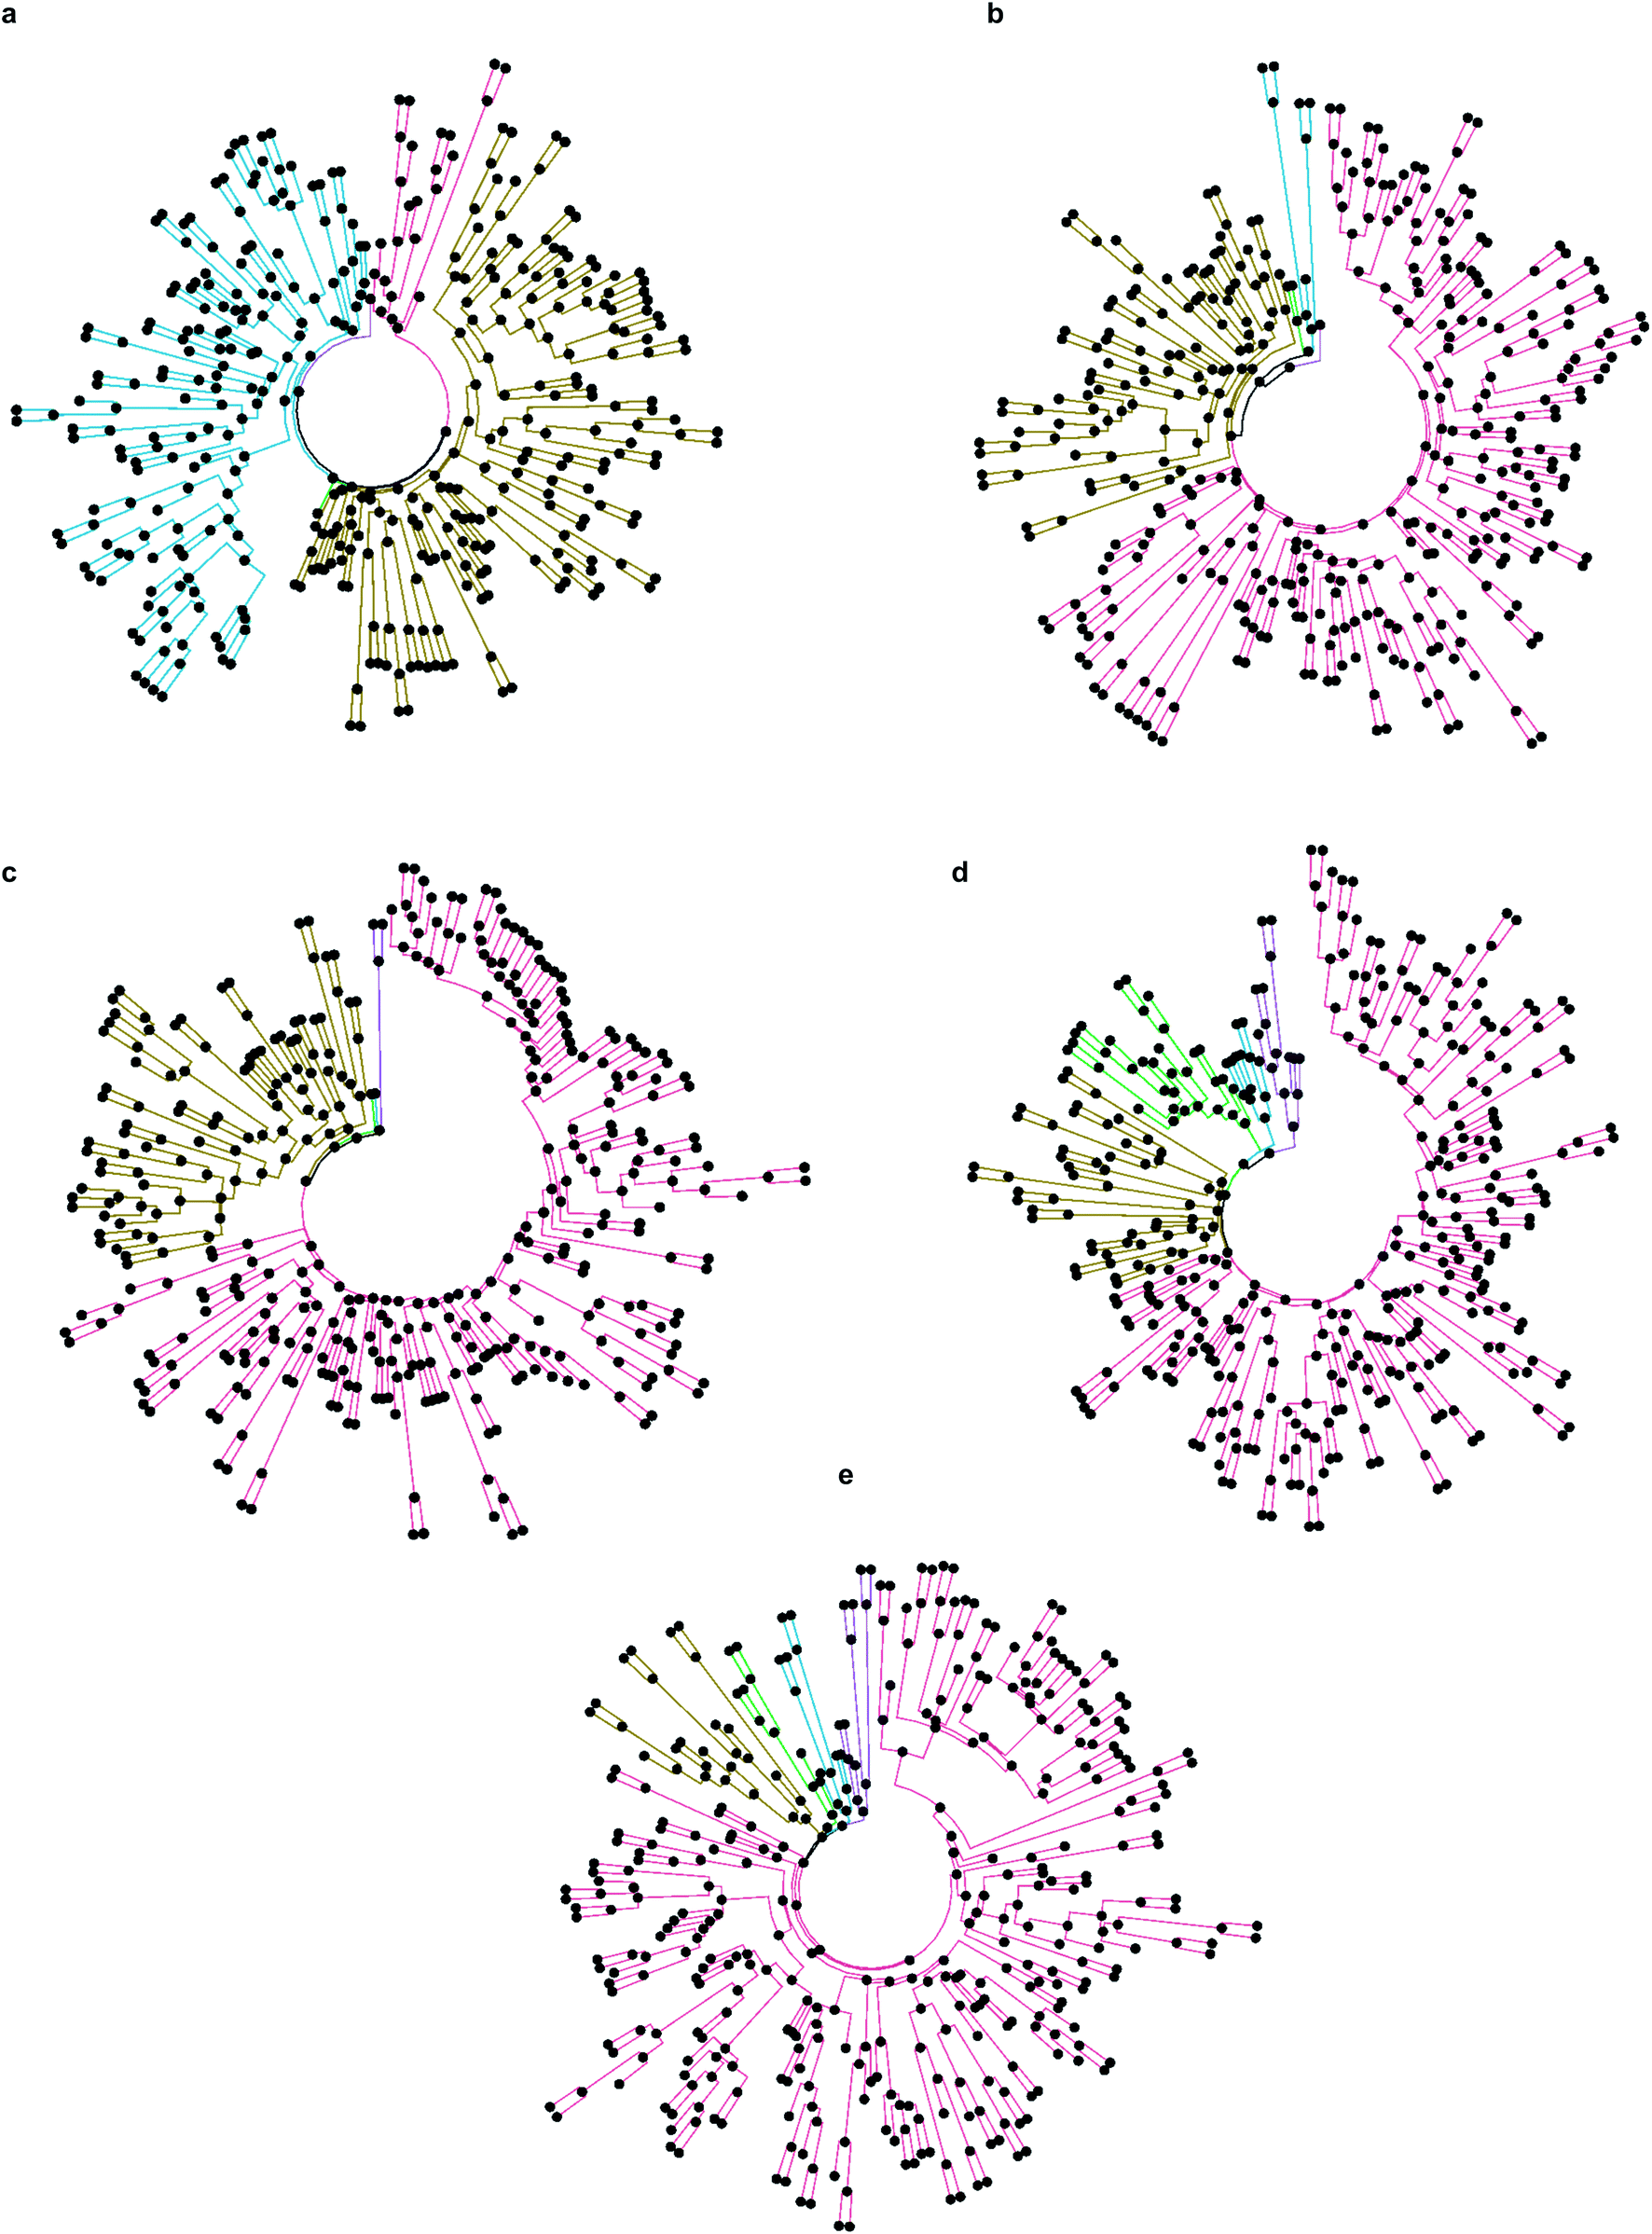 | ||
| Fig. 4 Tanimoto similarity trees of selected top-100 compounds from individual docking programs, where the top-five clusters are highlighted by different colors in each dendrogram. (a) Autodock GPU, (b) Glide SP, (c) FRED, (d) ICM and (e) QuickVina2. | ||
Top-ranked compounds selection from consensus of five docking programs
The generated five hitlists were then re-clustered based on the average values of normalized docking scores resulting in a matrix (K), that was further processed with a series of consecutive score- and geometry-based filters to aggressively reduce potential hits to ‘high-confidence’ subsets (sequential filtering paths 1.1 and 1.2 on Fig. 3 corresponding to overall more- and less-stringent selection strategies).Thus, the first filter L was used to remove compounds presenting high standard deviation values of the five docking scores (hence, inconsistently ranked), using thresholds of 1.0 (list 1.1_L on the path 1.1) or 0.5 of the standard deviation unit (list 1.2_L, path 1.2). Next, we applied the two previously described consensus filters: 5 of 5 rule for path 1.1 (resulted in a hitlist 1.1_M) and 3 of 5 rule for path 1.2 (hitlist 1.2_M). The resulting lists on 1.1 and 1.2 paths (corresponding to most consistently docked and ranked compounds) were further filtered with the above-described pharmacophore model (resulting in hitlists 1.1_N and 1.2_N respectively), followed by best-first structural4 (O) and score tree-based (P) clustering procedures that aimed to increase diversity in the resulting hitlists.
As Fig. 3 illustrates, the implemented less aggressive sequential filtering (path 1.2) resulted in 14000-fold reduction of the initial 24 million dataset, while a stricter 1.1 filtering path led to 680000-fold database reduction and yielded only 179 molecules that justified all consensus prediction criteria. Of note, the implemented filtering procedures were all highly automated and enabled handling raw docking results with minimal human intervention.
Chemical diversity filtering of docking results
It is well known that combinatorial databases like REAL Space tend to contain redundant chemotypes, and therefore could benefit from structure-based clustering to ensure chemical diversity.4 For that reason, we implemented selection strategy 2.0 (Fig. 3), where we began filtering of 24 million hits by selecting 100000 molecules that were top-scored by each docking program (due to technical limitations of clustering algorithms), and grouped them based on structural similarity, selecting the top-ranked member as cluster representative and discarding the others4 (see Methods section for details), resulting in hitlists marked as F, G, H, I and J on Fig. 3.
Unsurprisingly, the generated hitlists were significantly more diverse than the ones obtained from raw docking results, as illustrated by the comparison of the distribution of Tanimoto similarity scores (computed on 1024 bits, radius 2 Morgan fingerprints) for the top-100 ranked molecules prior and after clustering, reported in Fig. 5, and by the circular dendrograms (Fig. S3†) that exhibit lower agglomeration scores (Fig. S2†) than that in Fig. 4, indicating higher chemical diversity of the compounds. The consecutive filtering on the path 2.0 were identical to those used for 1.0, but the number of compounds that passed the next filter was significantly smaller and the corresponding Spearman correlations between the ranks were lower (details are given on Fig. 3 and S4†).
 | ||
| Fig. 5 Tanimoto similarity distributions of top-100 compounds from individual docking programs before (in blue) and after chemical diversity selection (in orange). (a) Autodock GPU, (b) Glide SP, (c) FRED, (d) ICM and (e) QuickVina2. | ||
Hit selection by expert strategies and visual inspection
In addition to the automated strategies detailed in the previous sections, we composed two ‘expert curated’ hitlists that were constructed with significant involvement of human intervention, such as visual inspection of docking poses. No specific requirements were imposed for the expert analysis and only docking and post-docking results generated in this study were used as well as up-to-date experimental binding information for Mpro ligands. The expert-generated pharmacophore filter turned out to be significantly more stringent than the data-driven version, returning only 1119 and 304 unique compounds when respectively applied to Glide and ICM results. Considerably fewer molecules were returned by other three docking programs, that were therefore not included in the analysis. After visual inspection and prioritization of noncovalent interactions, 150 compounds from Glide and ICM docking ‘streams’ were finally selected.Experimental evaluation of candidate Mpro inhibitors and hit analysis
The DD processing of 40 billion small molecules with five popular docking programs provided a unique opportunity of compiling a large list of potential hits (∼24 millions) on which a variety of fully or partially automated CADD filtering and consensus procedures could be assessed (including the most stringent ones, reducing 40 billion chemicals to just a few dozens, such as for 2.1_M and 2.2_N). To provide experimental evaluation for each of the twenty-eight employed hit-selection strategies, we selected up to 200 top ranked chemicals from each hit list (for the smaller ones we considered all molecules). After quoting with vendors and selecting up to 100 compounds based on their synthetic feasibility, price, and number of chiral centers, a total of 1700 chemicals were ordered, from which 1283 (∼75% synthesis success rate) were received and evaluated in Mpro enzymatic assay. Of those, 117 compounds demonstrated >10% inhibition of SARS-CoV-2 Mpro enzymatic activity at 5 μM, and have been regarded by us as potential hits (all presented in Table S2†).Next, we computationally assessed the drug-like properties of the identified active compounds as well as their novelty. Remarkably, all 117 molecules satisfied the Lipinski's rule of 5 for orally active drugs,46 as calculated by MOE. In addition, 42 of the identified inhibitors also passed the Oprea lead-like test indicating their potential as starting points for medicinal chemistry optimization efforts.47 Notably, all the identified hits belong to the REAL Space library, hence they can be synthesized in few weeks at high success rate, and purchased at a reasonable cost. We then compared the structures of the 117 active molecules with the ones of the 214 known inhibitors used in our benchmarking (Table S1†), by evaluating Tanimoto similarity scores computed on Morgan fingerprints (Table S3†). The average similarity score was 0.15 with a standard deviation of 0.04, clearly indicating that the novel Mpro inhibitors occupy a significantly different region of the chemical space than known actives.
Returns by various hit-calling strategies
Notably, we observed a very low overlap between compounds emerging from different hit calling approaches (Fig. 6a). Out of 3424 molecules from the top-200 hitlists, 2069 were identified only by a single selection strategy, and the number of compounds appearing in the hitlists of multiple strategies steadly decreased with the number of those. Only three molecules commonly appeared in in eight different hitlists, and none was picked by nine or more strategies (Fig. 6b). Such variability in prioritizing molecules was also illustrated by the total lack of overlap between automatically generated hitlists A-2.2_N and expert-selected hitlists exp_G and exp_I (Fig. 6c). In terms of the resulting hit rates, the performances of individual strategies also appeared as highly variable (Fig. 6c). | ||
| Fig. 6 Hit selection for inhibiting Mpro. (a) Overlap (0–1 range) of candidate hits selected from different strategies; blank cells indicate no overlap (b), number of molecules appearing in top-200 hitlists of multiple selection strategies versus number of strategies where molecules appeared (c), compounds selected for quotation (color-coded with the individual percentile rank in each hitlist, white cells indicate no presence of the compound; compounds are indexed by decreasing number of strategies on y-axis) and number of quoted, ordered, received, active compounds, and hit rate percentage values. | ||
Importantly, none of the constructed hitlists returned a null hit rate, with the lowest observed value being 3% for hitlist C corresponding to unprocessed docking outcomes from FRED while the highest hit rate of 11% for a single program was achieved by Autodock GPU. The consequently applied consensus docking and scoring procedures, as well as automated pharmacophore filtering procedures did not significantly improved hit returns (1.0_K to 1.2_P). Nevertheless, we observed that introducing best-first clustering based on chemical fingerprints, as initially proposed by Lyu et al.4 did consistently improve hit rates for individual docking program outcomes (F to J) as well as for consensus-based strategies (2.0_K to 2.2_N), resulting in hit rates as high as 13%.
Mpro active site occupancy by active compounds
Seventeen compounds showing promising Mpro inhibition were selected to be subjected to concentration dependent evaluation, and eight demonstrated half-maximal inhibitory concentration (IC50) values below 100 μM (Table S2 and Fig. S5†). Notably, the most potent compounds emerged from the data-driven pharmacophore filtering of consensus docking results and from the expert selection (Table S2†). Based on conventional subdivision of the Mpro catalytic site,48 all the identified inhibitors could be assigned to simultaneous occupation of the S1 and S2 regions (Table S2†). Of note, these particular sub-pockets are widely considered the most critical sites to inhibit the catalytic activity of Mpro.49,50 Thus, the docking poses of the three most potent compounds (Z4921675438, Z4927220858 and Z4921678803, Fig. 7) all highlight a critical hydrogen bond interaction established with His163 in S1, and the occupancy of S2 by hydrophobic groups that are well-buried into the site. The linking region between S1 and S2 (S1/S2) was also occupied in all three cases, as well as in ∼80% of all the active molecules listed in Table S2.† Notably, Z4921675438 (Fig. 7a) and Z4921678803 (Fig. 7c) both interact with S1′/S3′ through hydrogen bonding, while Z4927220858 (Fig. 7b) interacted with the S3/S4 site. Each of these two distinct subpockets was occupied by roughly half of the active compounds, as they both are able to accommodate a variety of groups, which can be further exploited to improve activity and specificity of the inhibitors.51 However, none of the identified hits occupied all five sub-pockets of Mpro catalytic region. | ||
| Fig. 7 Docking poses and ligand-receptor interaction diagrams of most potent Mpro inhibitors. (a) Z4921675438 (IC50 10.84 μM), (b), Z4927220858 (IC50 11.20 μM), (c), Z4921678803 (IC50 12.13 μM). | ||
Conclusion
The developed workflow enabled us to rapidly and efficiently reduce 40 billion compounds to a manageable subset of potential hits against the SARS-CoV-2 Mpro. To refine compounds that were well-docked by all five programs, we explored a variety of hit-selecting strategies, that can be seamlessly integrated into an almost fully automated SBVS pipeline and compared against non-automated, expert-relying approaches. As a result, more than a hundred novel SARS-CoV-2 Mpro inhibitors were identified with minimal or no human intervention. This study yielded a significant number of novel chemotypes, suitable for future medicinal chemistry optimization, but also yielded some of the most potent Mpro inhibitors that emerged from only molecular docking.8,52–54Our results also demonstrate that automated hit-calling strategies based on raw docking scores can identify a significant number of actives (with approximately 10% hit rate), and yet there is a very little agreement between different programs. The introduction of successive consensus filters slightly improved hit rates and consistency of docking outcomes. However, it is the combination of docking pose consensus with structural diversity filtering that returned the highest rates of actives. Notably, all these automated strategies still fall short of outperforming human expert selection. The factor that limits the performance of the automatic filtering likely comes from the inaccurate scoring function of docking and/or even wrong prediction of the binding poses by the programs,18,55 generating a large number of inactive artifacts that hinder active molecules constituting a minimal percentage of the screened library. The expert selection of binding features and refinement of pharmacophore model on the basis of knowledge-driven experience and visual inspection appeared to be critical to the hit selection process. Hence, it should be adopted as essential last step in the general practice of current SBVS.
The results of this ultra-large docking campaign also enabled to conduct a broad analysis of the occupancy of critical sub-pockets of Mpro catalytic site by active noncovalent ligands. Notably, none of them span the entire catalytic cavity, which is likely to explain their lower inhibition activity compared to latest peptidomimetic covalent inhibitors that entered clinical trials.56 These results jointly corroborate the complexity of Mpro as a CADD target and once more highlighted the limited success of recent SBVS campaigns in general and docking studies in particular.57 Nevertheless, the novel noncovalent Mpro inhibitors that we report here provide a significant number of starting points for their future optimization into drug candidates, following the path of recent successful stories in developing low nanomolar noncovalent Mpro inhibitors from high micromolar hits identified by docking and consensus filtering.34,37
Taken together, these results suggest that in silico discovery of inhibitors of SARS-CoV-2 Mpro (among any other targets) can be successfully automated, but still will largely benefit from human expert intervention. Thus, we envision a multifaceted role for AI in CADD in the upcoming era of giga-libraries,2,15 boosting the high-throughput capabilities of emerging large-scale docking platforms,4,6,9 while closing the gap with knowledge and experience of seasoned CADD experts.
Methods
Docking grids
The structure of Mpro with X77 noncovalent ligand bound in the active site (PDB:6W63)42 was optimized using the Protein Preparation Wizard58 of Maestro suite from Schrödinger59 with default parameters. Autodock maps for all supported atom types were generated with autogrid4,60 using a box of 18 Å × 19.50 Å × 21.75 Å centered on X77, and a grid spacing value of 0.375 Å. The Glide docking grid was prepared using the Receptor Grid Generation tool from Schrödinger59 defining a 10 Å box centered on the ligand. For ICM docking, the grid was prepared using the Receptor Setup tool61 on the ligand-receptor complex. The FRED grid was prepared using the Make Receptor tool.62 The box shape was defined around the ligand with dimensions of 16 Å × 20 Å × 21 Å. QuickVina2 box's dimension and coordinates were set to the same values as for Autodock.Molecular docking
QUACPAC62 was used to generate a dominant ionized, tautomer form at pH 7.4 for each compound to dock. Omega's pose mode63 was used to generate multiple 3D conformations for FRED docking. Omega's classic mode was used to generate single low energy conformations as inputs for the other programs. Openbabel64 was used to translate compounds from sdf to pdbqt format for Autodock and QuickVina2 docking. Docking was performed with five programs, using default parameters unless differently specified: Autodock GPU (https://github.com/scottlegrand/Autodock-GPU/tree/relicensing version),24 with 5 million energy evaluations and 10 Lamarckian genetic algorithm65 runs for each compound, considering the lowest energy pose from the most populated cluster as the best solution; Glide SP module;25 FRED;26 ICM27 with an effort value of 2; and QuickVina2.28Benchmarking
214 Mpro ligands with available crystal structures were collected from the Protein Data Bank (RCSB PDB)66 and the Fragalysis database.14,35 50 decoys per known active ligand were generated using the DUD-E server.41 Compounds were docked with the five programs discussed above. EF67 at 1% were calculated as | (1) |
Pharmacophore modeling
Structures of 54 covalent and noncovalent Mpro active site binders were downloaded from RCSB PDB's COVID-19 Resources collection. In addition, 295 crystals of Mpro complexed with ligands were obtained from the Fragalysis database14,35 and filtered to retain only noncovalent active site inhibitors with reported IC50 below or equal to 5 μM. The protein sequences were aligned and superimposed on the pocket residues of the reference compound X77 in MOE.68 Pharmacophore modeling was performed using the MOE Ph4 Query tool with the application of Extended Hückel Theory annotation scheme.69 Consensus pharmacophore features were automatically computed using a default tolerance distance of 1.2 Å from the ligands' atoms and a 50% threshold of overlapping features. Features were then selected based on visual inspection of known actives in complex with Mpro.Library preparation
At the time of this research, the REAL Space library consisted of 12.3 billion compounds in SMILES format. Stereochemical expansion of the database was performed using flipper63 to enumerate unspecified stereocenters, resulting in 38.7 billion unique molecules. Morgan fingerprints (considering chirality) of 1024 bits and radius 2 were calculated using rdkit chemoinformatic package.70 The resulting library was then merged with the previously prepared19 ZINC15 set (1.36 billion compounds).30Deep Docking
DD was run using a recall of 0.9 for virtual hits. The sizes of validation, test and training (both initial and augmentation batches) sets were set equal to 0.07% of the starting database, as previously described.19 For all the runs, virtual hits were defined as top 1% ranked molecules of the library in the first iteration, 0.9% in the second, 0.8% in the third, and so on.Automated hit selection
Compounds showing extremely high docking scores (>50) for at least one program were discarded. All docking scores were standardized to ensure mean of 0 and standard deviation of 1. Best-first clustering as proposed by Lyu et al.4 was applied using Tanimoto scores calculated over Morgan fingerprints as similarity measure, and a threshold of 0.5. Dendogram-based clustering was applied considering the five docking scores as implemented in the heatmap.2 R package.71Prioritization of molecules based on human inspection
Two expert-selected hitlists were generated by following a standard procedure, removing non-neutral and/or compounds with many chiral centers, and processing separately the docking results from Glide and ICM results using a pharmacophore filter. After careful visual inspection on the fragments binding in S1, S2 and S1′ subpockets, 150 compounds were selected for quotation from each list.Compound clustering
A hierarchical agglomerative clustering (HAC) algorithm was applied to investigate the chemical diversity of the lists of selected compounds. HAC utilized Tanimoto scores as measure of diversity and was performed using function agnes (Agglomerative Nesting) implemented in cluster package as described by Kaufman and Rousseeuw72 and available in R programing language.71 HAC results were depicted as a circular hierarchical dendrograms, where each merge is represented by a horizontal line that represent the Tanimoto similarity of the two clusters that were merged at each step.72 To compare the chemical diversity of the lists, we calculated the minimum and maximum number of nodes from the root to the leaves as well as the agglomerative coefficient of the HAC dendrograms. The coefficient describes the strength of the clustering structure, with values closer to 1 suggesting a more balanced clustering structure while values closer to 0 suggest less well-formed clusters.High throughput screening and IC50 determination
SARS-CoV-2 Mpro (Cat #100823) and internally quenched fluorogenic Mpro substrate (Cat #79952) assay kits were purchased from PBS Bioscience. All procedures were performed in accordance with the manufacturer's instructions and protocols. Assays were adapted to a 384-well plate format with compound concentrations at 5 μM (n = 1) in two independent runs. The assay was initiated by dispensing 150 nL of compound per well, to which 7.5 μL of Mpro protease at 2.25μg mL−1 (62.5 nM) and 7.5 μL of Mpro substrate at 15 μM, were added. Plates were read at 460 nm emission upon excitation at 360 nm. HTS percent inhibition was calculated for each compound from the signal in fluorescence units (FU) and the mean of the plate controls and the mean of the plate blanks using the following equation: | (2) |
The compounds of interest were defined as those with a percentage of inhibition over 10% compared with the reaction in absence of inhibitors. Dose–response testing of hit inhibitors were measured using the same reaction mixture as the one used for HTS, but compounds were instead serially diluted in 12 concentration points 2-fold from 200 μM (n = 2). All experimental data were calculated and analysed using GraphPad Prism.
Computational resources
For GPU-based docking and machine learning, we used 250 Tesla V100 GPUs from the Vancouver Prostate Centre's Juggernaut cluster, Dell Technologies HPC and AI Innovation Lab's Rattler cluster, and the Sockeye supercomputing cluster at The University of British Columbia. All other computations were run on Intel® Xeon® Silver 4116 CPU @ 2.10 GHz cores available at the Vancouver Prostate Centre.Data availability
Data for this paper, including raw experimental data, computational data for identified inhibitors, structures used for pharmacophore generation, and scripts and results for filtering procedures have been deposited in the Federated Research Data Repository at DOI: 10.20383/102.0524. The Deep Docking code is freely available from https://github.com/jamesgleave/DD_protocol.Author contributions
Conceptualization: F. G., A. C. data curation: F. G., M. F., A. T., H. M. formal analysis: F. G., M. F. funding acquisition: F. J., N. S., A. C. investigation: F. G., M. F., F. B., A. T., H. M. methodology: F. G, M. F., A. C. project administration: C. F. P., E. L. resources: B. W., A. S. software: F. G., M. F., H. M., J. C. Y., J. G. supervision: A. S., F. J., N. S., A. C. validation: E. L. visualization: F. G., M. F., A. T., H. M. writing original draft: F. G., M. F., A. C. writing, reviewing and editing: F. G., A. C.Conflicts of interest
There are no conflicts to declare.Acknowledgements
This work was funded by Canadian Institutes of Health Research (CIHR), Canadian 2019 Novel Coronavirus (2019-nCoV) Rapid Research grants (OV3-170631 and VR3-172639), and generous donations for COVID-19 research from TELUS, Teck Resources, 625 Powell Street Foundation, Tai Hung Fai Charitable Foundation, Vancouver General Hospital Foundation. F. G.'s work is supported by fellowships from the CIHR (MFE-171324), Michael Smith Foundation for Health Research/VCHRI & VGH UBC Hospital Foundation (RT-2020-0408), and Ermenegildo Zegna Foundation. The authors thank the Dell Technologies HPC and AI Innovation Lab for their support and partnership in providing the HPC platform (PowerEdge servers) to accelerate the AI algorithms, and the UBC Advanced Research Computing team for providing access and technical support for the Sockeye supercomputing cluster. The authors thank Dr Larry Goldenberg for his tireless support of research efforts on COVID-19 therapeutics development.References
- J. J. Irwin, K. G. Tang, J. Young, C. Dandarchuluun, B. R. Wong, M. Khurelbaatar, Y. S. Moroz, J. Mayfield and R. A. Sayle, J. Chem. Inf. Model., 2020, 60, 6065–6073 CrossRef CAS PubMed.
- O. O. Grygorenko, D. S. Radchenko, I. Dziuba, A. Chuprina, K. E. Gubina and Y. S. Moroz, iScience, 2020, 23, 101681 CrossRef CAS PubMed.
- C. Grebner, E. Malmerberg, A. Shewmaker, J. Batista, A. Nicholls and J. Sadowski, J. Chem. Inf. Model., 2020, 60, 4274–4282 CrossRef CAS PubMed.
- J. Lyu, S. Wang, T. E. Balius, I. Singh, A. Levit, Y. S. Moroz, M. J. O'Meara, T. Che, E. Algaa, K. Tolmachova, A. A. Tolmachev, B. K. Shoichet, B. L. Roth and J. J. Irwin, Nature, 2019, 566, 224–229 CrossRef CAS PubMed.
- R. M. Stein, H. J. Kang, J. D. McCorvy, G. C. Glatfelter, A. J. Jones, T. Che, S. Slocum, X. P. Huang, O. Savych, Y. S. Moroz, B. Stauch, L. C. Johansson, V. Cherezov, T. Kenakin, J. J. Irwin, B. K. Shoichet, B. L. Roth and M. L. Dubocovich, Nature, 2020, 579, 609–614 CrossRef CAS PubMed.
- C. Gorgulla, A. Boeszoermenyi, Z. F. Wang, P. D. Fischer, P. W. Coote, K. M. Padmanabha Das, Y. S. Malets, D. S. Radchenko, Y. S. Moroz, D. A. Scott, K. Fackeldey, M. Hoffmann, I. Iavniuk, G. Wagner and H. Arthanari, Nature, 2020, 580, 663–668 CrossRef CAS PubMed.
- A.-T. T. Ton, F. Gentile, M. Hsing, F. Ban and A. Cherkasov, Mol. Inf., 2020, 39, 1–18 Search PubMed.
- G. G. Rossetti, M. Ossorio, S. Barriot, L. Tropia, V. S. Dionellis, C. Gorgulla, H. Arthanari, P. Mohr, R. Gamboni and T. D. Halazonetis, bioRxiv, 2020, 1–21 CAS.
- A. Acharya, R. Agarwal, M. B. Baker, J. Baudry, D. Bhowmik, S. Boehm, K. G. Byler, S. Y. Chen, L. Coates, C. J. Cooper, O. Demerdash, I. Daidone, J. D. Eblen, S. Ellingson, S. Forli, J. Glaser, J. C. Gumbart, J. Gunnels, O. Hernandez, S. Irle, D. W. Kneller, A. Kovalevsky, J. Larkin, T. J. Lawrence, S. Legrand, S. H. Liu, J. C. Mitchell, G. Park, J. M. Parks, A. Pavlova, L. Petridis, D. Poole, L. Pouchard, A. Ramanathan, D. M. Rogers, D. Santos-Martins, A. Scheinberg, A. Sedova, Y. Shen, J. C. Smith, M. D. Smith, C. Soto, A. Tsaris, M. Thavappiragasam, A. F. Tillack, J. V. Vermaas, V. Q. Vuong, J. Yin, S. Yoo, M. Zahran and L. Zanetti-Polzi, J. Chem. Inf. Model., 2020, 60, 5832–5852 CrossRef CAS PubMed.
- Giga Docking Guide—Orion Programming Guide 2020.1.0 documentation, https://docs.eyesopen.com/orion-developer/2020-2-1/modules/large-scale-floes/docs/source/giga_docking_guide.html, accessed 13 April 2021 Search PubMed.
- R. G. Coleman, M. Carchia, T. Sterling, J. J. Irwin and B. K. Shoichet, PLoS One, 2013, 8, e75992 CrossRef CAS PubMed.
- S. Forli, R. Huey, M. E. Pique, M. F. Sanner, D. S. Goodsell and A. J. Olson, Nat. Protoc., 2016, 11, 905–919 CrossRef CAS PubMed.
- H. Altae-Tran, B. Ramsundar, A. S. Pappu and V. Pande, ACS Cent. Sci., 2017, 3, 283–293 CrossRef CAS PubMed.
- J. Chodera, A. A. Lee, N. London and F. von Delft, Nat. Chem., 2020, 12, 581 CrossRef CAS PubMed.
- J. J. Irwin, K. G. Tang, J. Young, C. Dandarchuluun, B. R. Wong, M. Khurelbaatar, Y. S. Moroz, J. Mayfield and R. A. Sayle, J. Chem. Inf. Model., 2020, 60, 6065–6073 CrossRef CAS PubMed.
- B. K. Shoichet, Nature, 2004, 432, 862–865 CrossRef CAS PubMed.
- Y. O. Adeshina, E. J. Deeds and J. Karanicolas, Proc. Natl. Acad. Sci. U. S. A., 2020, 117, 18477–18488 CrossRef CAS PubMed.
- A. Fischer, M. Smieško, M. Sellner and M. A. Lill, J. Med. Chem., 2021, 64, 2489–2500 CrossRef CAS PubMed.
- F. Gentile, V. Agrawal, M. Hsing, A. T. Ton, F. Ban, U. Norinder, M. E. Gleave and A. Cherkasov, ACS Cent. Sci., 2020, 6, 939–949 CrossRef CAS PubMed.
- D. E. Graff, E. I. Shakhnovich and C. W. Coley, Chem. Sci., 2021, 12, 7866–7881 RSC.
- F. Berenger, A. Kumar, K. Y. J. Zhang and Y. Yamanishi, J. Chem. Inf. Model., 2021, 61, 2341–2352 CrossRef CAS PubMed.
- Y. Yang, K. Yao, M. P. Repasky, K. Leswing, R. Abel, B. K. Shoichet and S. V. Jerome, J. Chem. Theory Comput., 2021, 17, 7106–7119 CrossRef CAS PubMed.
- F. Ban, K. Dalal, H. Li, E. LeBlanc, P. S. Rennie and A. Cherkasov, J. Chem. Inf. Model., 2017, 57, 1018–1028 CrossRef CAS PubMed.
- D. Santos-Martins, L. Solis-Vasquez, A. F. Tillack, M. F. Sanner, A. Koch and S. Forli, J. Chem. Theory Comput., 2021, 17, 1060–1073 CrossRef CAS PubMed.
- R. A. Friesner, J. L. Banks, R. B. Murphy, T. A. Halgren, J. J. Klicic, D. T. Mainz, M. P. Repasky, E. H. Knoll, M. Shelley, J. K. Perry, D. E. Shaw, P. Francis and P. S. Shenkin, J. Med. Chem., 2004, 47, 1739–1749 CrossRef CAS PubMed.
- M. McGann, J. Chem. Inf. Model., 2011, 51, 578–596 CrossRef CAS PubMed.
- M. A. C. Neves, M. Totrov and R. Abagyan, J. Comput.-Aided Mol. Des., 2012, 26, 675–686 CrossRef CAS PubMed.
- A. Alhossary, S. D. Handoko, Y. Mu and C.-K. Kwoh, Bioinformatics, 2015, 31, 2214–2216 CrossRef CAS PubMed.
- Enamine REAL Space, https://enamine.net/library-synthesis/real-compounds/real-space-navigator, accessed 28 August 2020 Search PubMed.
- T. Sterling and J. J. Irwin, J. Chem. Inf. Model., 2015, 55, 2324–2337 CrossRef CAS PubMed.
- A. Dömling and L. Gao, Chem, 2020, 6, 1283–1295 Search PubMed.
- W. Dai, B. Zhang, X. M. Jiang, H. Su, J. Li, Y. Zhao, X. Xie, Z. Jin, J. Peng, F. Liu, C. Li, Y. Li, F. Bai, H. Wang, X. Cheng, X. Cen, S. Hu, X. Yang, J. Wang, X. Liu, G. Xiao, H. Jiang, Z. Rao, L. K. Zhang, Y. Xu, H. Yang and H. Liu, Science, 2020, 368, 1331–1335 CrossRef CAS PubMed.
- B. Boras, R. M. Jones, B. J. Anson, D. Arenson, L. Aschenbrenner, M. A. Bakowski, N. Beutler, J. Binder, E. Chen, H. Eng, J. Hammond, R. Hoffman, E. P. Kadar, R. Kania, E. Kimoto, M. G. Kirkpatrick, L. Lanyon, E. K. Lendy, J. R. Lillis, S. A. Luthra, C. Ma, S. Noell, R. S. Obach, M. N. O’Brien, R. O’Connor, K. Ogilvie, D. Owen, M. Pettersson, M. R. Reese, T. Rogers, M. I. Rossulek, J. G. Sathish, C. Steppan, M. Ticehurst, L. W. Updyke, Y. Zhu, J. Wang, A. K. Chatterjee, A. D. Mesecar, A. S. Anderson and C. Allerton, bioRxiv, 2021 DOI:10.1101/2020.09.12.293498 , preprint.
- C. H. Zhang, E. A. Stone, M. Deshmukh, J. A. Ippolito, M. M. Ghahremanpour, J. Tirado-Rives, K. A. Spasov, S. Zhang, Y. Takeo, S. N. Kudalkar, Z. Liang, F. Isaacs, B. Lindenbach, S. J. Miller, K. S. Anderson and W. L. Jorgensen, ACS Cent. Sci., 2021, 7, 467–475 CrossRef CAS PubMed.
- A. Douangamath, D. Fearon, P. Gehrtz, T. Krojer, P. Lukacik, C. D. Owen, E. Resnick, C. Strain-Damerell, A. Aimon, P. Ábrányi-Balogh, J. Brandão-Neto, A. Carbery, G. Davison, A. Dias, T. D. Downes, L. Dunnett, M. Fairhead, J. D. Firth, S. P. Jones, A. Keeley, G. M. Keserü, H. F. Klein, M. P. Martin, M. E. M. Noble, P. O'Brien, A. Powell, R. N. Reddi, R. Skyner, M. Snee, M. J. Waring, C. Wild, N. London, F. von Delft and M. A. Walsh, Nat. Commun., 2020, 11, 1–11 Search PubMed.
- L. Riva, S. Yuan, X. Yin, L. Martin-Sancho, N. Matsunaga, L. Pache, S. Burgstaller-Muehlbacher, P. D. De Jesus, P. Teriete, M. V. Hull, M. W. Chang, J. F. W. Chan, J. Cao, V. K. M. Poon, K. M. Herbert, K. Cheng, T. T. H. Nguyen, A. Rubanov, Y. Pu, C. Nguyen, A. Choi, R. Rathnasinghe, M. Schotsaert, L. Miorin, M. Dejosez, T. P. Zwaka, K. Y. Sit, L. Martinez-Sobrido, W. C. Liu, K. M. White, M. E. Chapman, E. K. Lendy, R. J. Glynne, R. Albrecht, E. Ruppin, A. D. Mesecar, J. R. Johnson, C. Benner, R. Sun, P. G. Schultz, A. I. Su, A. García-Sastre, A. K. Chatterjee, K. Y. Yuen and S. K. Chanda, Nature, 2020, 586, 113–119 CrossRef CAS PubMed.
- M. M. Ghahremanpour, J. Tirado-Rives, M. Deshmukh, J. A. Ippolito, C. H. Zhang, I. Cabeza De Vaca, M. E. Liosi, K. S. Anderson and W. L. Jorgensen, ACS Med. Chem. Lett., 2020, 11, 2526–2533 CrossRef CAS PubMed.
- W. D. Jang, S. Jeon, S. Kim and S. Y. Lee, Proc. Natl. Acad. Sci. U. S. A., 2021, 118 DOI:10.1073/pnas.2024302118.
- A. Fischer, M. Sellner, S. Neranjan, M. Smieško and M. A. Lill, Int. J. Mol. Sci., 2020, 21, 3626 CrossRef CAS PubMed.
- O. O. Olubiyi, M. Olagunju, M. Keutmann, J. Loschwitz and B. Strodel, Molecules, 2020, 25, 3193 CrossRef CAS PubMed.
- M. M. Mysinger, M. Carchia, J. J. Irwin and B. K. Shoichet, J. Med. Chem., 2012, 55, 6582–6594 CrossRef CAS PubMed.
- RCSB PDB:6W63: Structure of COVID-19 main protease bound to potent broad-spectrum non-covalent inhibitor X77, https://www.rcsb.org/structure/6w63, accessed 2 June 2020 Search PubMed.
- D. R. Houston and M. D. Walkinshaw, J. Chem. Inf. Model., 2013, 53, 384–390 CrossRef CAS PubMed.
- RCSB PDB:7KX5: Crystal structure of the SARS-CoV-2 (COVID-19) main protease in complex with noncovalent inhibitor Jun8-76-3A, https://www.rcsb.org/structure/7kx5, accessed 24 August 2021 Search PubMed.
- T. Muramatsu, C. Takemoto, Y. T. Kim, H. Wang, W. Nishii, T. Terada, M. Shirouzu and S. Yokoyama, Proc. Natl. Acad. Sci. U. S. A., 2016, 113, 12997–13002 CrossRef CAS PubMed.
- C. A. Lipinski, F. Lombardo, B. W. Dominy and P. J. Feeney, Adv. Drug Delivery Rev., 2001, 46, 3–26 CrossRef CAS PubMed.
- T. I. Oprea, A. M. Davis, S. J. Teague and P. D. Leeson, J. Chem. Inf. Comput. Sci., 2001, 41, 1308–1315 CrossRef CAS PubMed.
- J. Lee, L. J. Worrall, M. Vuckovic, F. I. Rosell, F. Gentile, A.-T. Ton, N. A. Caveney, F. Ban, A. Cherkasov, M. Paetzel and N. C. J. Strynadka, Nat. Commun., 2020, 11, 5877 CrossRef CAS PubMed.
- M. D. Sacco, C. Ma, P. Lagarias, A. Gao, J. A. Townsend, X. Meng, P. Dube, X. Zhang, Y. Hu, N. Kitamura, B. Hurst, B. Tarbet, M. T. Marty, A. Kolocouris, Y. Xiang, Y. Chen and J. Wang, Sci. Adv., 2021, 6 DOI:10.1126/sciadv.abe0751.
- H. M. Mengist, T. Dilnessa and T. Jin, Front. Chem., 2021, 7 Search PubMed.
- D. W. Kneller, G. Phillips, K. L. Weiss, S. Pant, Q. Zhang, H. M. O'Neill, L. Coates and A. Kovalevsky, J. Biol. Chem., 2020, 295, 17365–17373 CrossRef CAS PubMed.
- L. S. Franco, R. C. Maia and E. J. Barreiro, RSC Med. Chem., 2021, 12, 110–119 RSC.
- T. Zhai, F. Zhang, S. Haider, D. Kraut and Z. Huang, Front. Mol. Biosci., 2021, 8 DOI:10.3389/fmolb.2021.661424.
- A. Clyde, S. Galanie, D. W. Kneller, H. Ma, Y. Babuji, B. Blaiszik, A. Brace, T. Brettin, K. Chard, R. Chard, L. Coates, I. Foster, D. Hauner, V. Kertesz, N. Kumar, H. Lee, Z. Li, A. Merzky, J. G. Schmidt, L. Tan, M. Titov, A. Trifan, M. Turilli, H. Van Dam, S. C. Chennubhotla, S. Jha, A. Kovalevsky, A. Ramanathan, M. S. Head and R. Stevens, bioRxiv, 2021 DOI:10.1101/2021.03.27.437323 , preprint.
- W. L. Jorgensen, Science, 2004, 303, 1813–1818 CrossRef CAS PubMed.
- D. R. Owen, C. M. N. Allerton, A. S. Anderson, L. Aschenbrenner, M. Avery, S. Berritt, B. Boras, R. D. Cardin, A. Carlo, K. J. Coffman, A. Dantonio, L. Di, H. Eng, R. Ferre, K. S. Gajiwala, S. A. Gibson, S. E. Greasley, B. L. Hurst, E. P. Kadar, A. S. Kalgutkar, J. C. Lee, J. Lee, W. Liu, S. W. Mason, S. Noell, J. J. Novak, R. S. Obach, K. Ogilvie, N. C. Patel, M. Pettersson, D. K. Rai, M. R. Reese, M. F. Sammons, J. G. Sathish, R. S. P. Singh, C. M. Steppan, A. E. Stewart, J. B. Tuttle, L. Updyke, P. R. Verhoest, L. Wei, Q. Yang and Y. Zhu, medRxiv, 2021 DOI:10.1101/2021.07.28.21261232 , preprint.
- E. N. Muratov, R. Amaro, C. H. Andrade, N. Brown, S. Ekins, D. Fourches, O. Isayev, D. Kozakov, J. L. Medina-Franco, K. M. Merz, T. I. Oprea, V. Poroikov, G. Schneider, M. H. Todd, A. Varnek, D. A. Winkler, A. V. Zakharov, A. Cherkasov and A. Tropsha, Chem. Soc. Rev., 2021, 50, 9121–9151 RSC.
- G. Madhavi Sastry, M. Adzhigirey, T. Day, R. Annabhimoju and W. Sherman, J. Comput.-Aided Mol. Des., 2013, 27, 221–234 CrossRef CAS PubMed.
- Schrödinger LLC, Maestro v9.3, New York, NY, 2019 Search PubMed.
- G. M. Morris, R. Huey, W. Lindstrom, M. F. Sanner, R. K. Belew, D. S. Goodsell and A. J. Olson, J. Comput. Chem., 2009, 30, 2785–2791 CrossRef CAS PubMed.
- R. Abagyan, M. Totrov and D. Kuznetsov, J. Comput. Chem., 1994, 15, 488–506 CrossRef CAS.
- OpenEye Scientific Software Inc., 2019.
- P. C. D. Hawkins, A. G. Skillman, G. L. Warren, B. A. Ellingson and M. T. Stahl, J. Chem. Inf. Model., 2010, 50, 572–584 CrossRef CAS PubMed.
- N. M. O'Boyle, M. Banck, C. A. James, C. Morley, T. Vandermeersch and G. R. Hutchison, J. Cheminf., 2011, 3, 33 Search PubMed.
- G. M. Morris, D. S. Goodsell, R. S. Halliday, R. Huey, W. E. Hart, R. K. Belew and A. J. Olson, J. Comput. Chem., 1998, 19, 1639–1662 CrossRef CAS.
- H. M. Berman, Nucleic Acids Res., 2000, 28, 235–242 CrossRef CAS PubMed.
- A. Bender and R. C. Glen, J. Chem. Inf. Model., 2005, 45, 1369–1375 CrossRef CAS PubMed.
- Chemical Computing Group Inc., Molecular Operating Environment 2019, Montreal, QC, 2019 Search PubMed.
- P. Labute, M. Kossner, A. Ajamian, M. Santavy and A. Lin, J. Cheminf., 2014, 6, P54 Search PubMed.
- The RDKit Documentation—The RDKit 2020.03.1 documentation, https://www.rdkit.org/docs/, accessed 19 October 2020 Search PubMed.
- R Core Team, 2017 Search PubMed.
- L. Kaufman and P. J. Rousseeuw, Finding Groups in Data: An Introduction to Cluster Analysis, John Wiley, 1990 Search PubMed.
Footnote |
| † Electronic supplementary information (ESI) available. See DOI: 10.1039/d1sc05579h |
| This journal is © The Royal Society of Chemistry 2021 |