DOI:
10.1039/D1SC04387K
(Edge Article)
Chem. Sci., 2021,
12, 13857-13869
Systematic investigation of the aza-Cope reaction for fluorescence imaging of formaldehyde in vitro and in vivo†
Received
10th August 2021
, Accepted 22nd September 2021
First published on 5th October 2021
Abstract
Increasing evidence has highlighted the endogenous production of formaldehyde (FA) in a variety of fundamental biological processes and its involvement in many disease conditions ranging from cancer to neurodegeneration. To examine the physiological and pathological relevance and functions of FA, fluorescent probes for FA imaging in live biological samples are of great significance. Herein we report a systematic investigation of 2-aza-Cope reactions between homoallylamines and FA for identification of a highly efficient 2-aza-Cope reaction moiety and development of fluorescent probes for imaging FA in living systems. By screening a set of N-substituted homoallylamines and comparing them to previously reported homoallylamine structures for reaction with FA, we found that N-p-methoxybenzyl homoallylamine exhibited an optimal 2-aza-Cope reactivity to FA. Theoretical calculations were then performed to demonstrate that the N-substituent on homoallylamine greatly affects the condensation with FA, which is more likely the rate-determining step. Moreover, the newly identified optimal N-p-methoxybenzyl homoallylamine moiety with a self-immolative β-elimination linker was generally utilized to construct a series of fluorescent probes with varying excitation/emission wavelengths for sensitive and selective detection of FA in aqueous solutions and live cells. Among these probes, the near-infrared probe FFP706 has been well demonstrated to enable direct fluorescence visualization of steady-state endogenous FA in live mouse brain tissues and elevated FA levels in a mouse model of breast cancer. This study provides the optimal aza-Cope reaction moiety for FA probe development and new chemical tools for fluorescence imaging and biological investigation of FA in living systems.
Introduction
Formaldehyde (FA) has been notorious as an environmental hazard that is detrimental and carcinogenic to human health.1 FA has also found widespread applications in chemical industry and medical science as disinfectant and preservative.2 Beyond the traditional knowledge, recent studies have shown that FA is endogenously produced in living systems during a series of normal physiological processes,3 including epigenetic regulation, one-carbon metabolism, and alcohol detoxification. In epigenetic regulation, FA is generated as a by-product during removal of the methyl groups on N-methylated lysines of histone proteins by lysine-specific demethylase 1 (LSD1)4 or JmjC domain-containing histone demethylases (JHDM).5 Similarly, demethylation of N-methylated DNA and RNA bases mediated by RNA demethylase ALKBH5 (ref. 6) or alpha-ketoglutarate-dependent dioxygenase (FTO) also produces FA. In the process of one-carbon metabolism, oxidative deamination of endogenous methylamine by semicarbazide-sensitive amine oxidases (SSAO)7 or demethylation of dimethylglycine by dimethylglycine dehydrogenase (DMGDH)8 actively produces FA. Demethylation of folate derivatives that are essential for mitochondrial one-carbon metabolism also generates FA.9 In alcohol detoxification, FA is released through the oxidation of methanol by alcohol dehydrogenase 1 (ADH1) or catalase.10
Despite multiple endogenous sources, FA is actively metabolized by cellular enzymes, such as aldehyde dehydrogenase 2 (ALDH2) and alcohol dehydrogenase 3 (ADH3, also known as ADH5), to yield formate and CO2/H2O.11 Due to the generation and degradation balance, endogenous FA is maintained at submillimolar levels in living tissues and cells (e.g., 0.2–0.5 mM in the brain and intracellularly) under physiological conditions,12 serving as a crucial one-carbon source for making important cellular building blocks, as well as a signaling molecule to mediate normal physiological processes.3b,13 However, abnormal accumulation of endogenous FA has been implicated in many disease conditions, including cancer,14 Alzheimer's disease,12d,15 stroke,16 diabetes,17 and liver disorders.3b For instance, FA concentrations in lung and breast cancer tissues were found to be significantly higher than in surrounding normal tissues, reaching as high as 0.8 mM.18 Elevated levels of FA were found in the urine samples of patients with medium and severe degrees of dementia,19 as well as in the brain tissues of Alzheimer's animal models.20 Nevertheless, the precise roles of FA in physiological and pathological contexts remain to be elucidated.
During the past several years, FA-responsive fluorescent probes affording noninvasive and spatiotemporal fluorescence imaging have emerged as powerful tools for directly monitoring FA generation in intact living biological samples and interrogating its biological roles. In this regard, a panel of activity-based fluorescent probes have been developed to detect and visualize FA,21 based on its 2-aza-Cope reactivity22 and formimine-, aminal-, and hemiaminal-formation reactivity.23 The 2-aza-Cope reactivity of FA, first demonstrated and elegantly utilized for developing FA fluorescent probes by the laboratories of Chang and Chan,22a,b involves the reaction of a homoallylamine with FA to generate an aldehyde product through a cascade of imine formation, 2-aza-Cope rearrangement, and hydrolysis (Fig. 1A). Notably, the 2-aza-Cope reactivity of FA has received great interest due to its modularity and generality, and has been widely applied to a variety of small-molecule fluorophores22,24 and luminophores,25 green fluorescent proteins,26 and luciferase,26 for constructing various fluorescent and luminescent probes for FA detection and imaging. Despite this progress, we envisioned that the 2-aza-Cope reaction could be further optimized to enhance the reaction efficiency of the probe with FA and thereby improve probe sensitivity for FA detection. Moreover, to the best of our knowledge, near-infrared fluorescent probes for imaging endogenous FA in live tissues and animals have not been reported yet. To address these questions, we herein report a systematic investigation of the 2-aza-Cope reactivity of FA by screening a series of N-substituted homoallylamine-derived probes and comparing them with probes containing previously reported homoallylamine moieties, which demonstrates that N-p-methoxybenzyl homoallylamine provides the optimal 2-aza-Cope reaction with FA. Theoretical calculations suggest that condensation is likely the rate-determining step in the reaction of N-substituted homoallylamine with FA. We then show that the N-p-methoxybenzyl homoallylamine moiety with a self-immolative β-elimination linker can be generally incorporated into a series of fluorophore scaffolds to construct differently colored fluorescent probes, including probe FFP706 with near-infrared fluorescence, for detection of FA in aqueous solutions as well as imaging of FA level changes in live cells. We further establish the utility of the near-infrared probe FFP706 to visualize steady-state endogenous FA in live cells, tissues, and animals, and demonstrate elevated FA levels in a breast cancer mouse model via in vivo fluorescence imaging using FFP706.
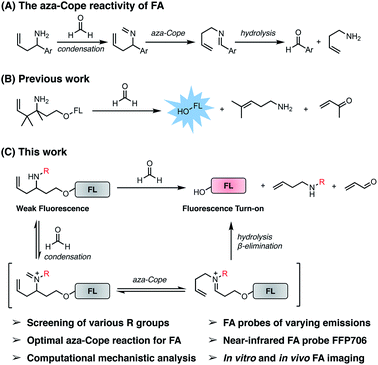 |
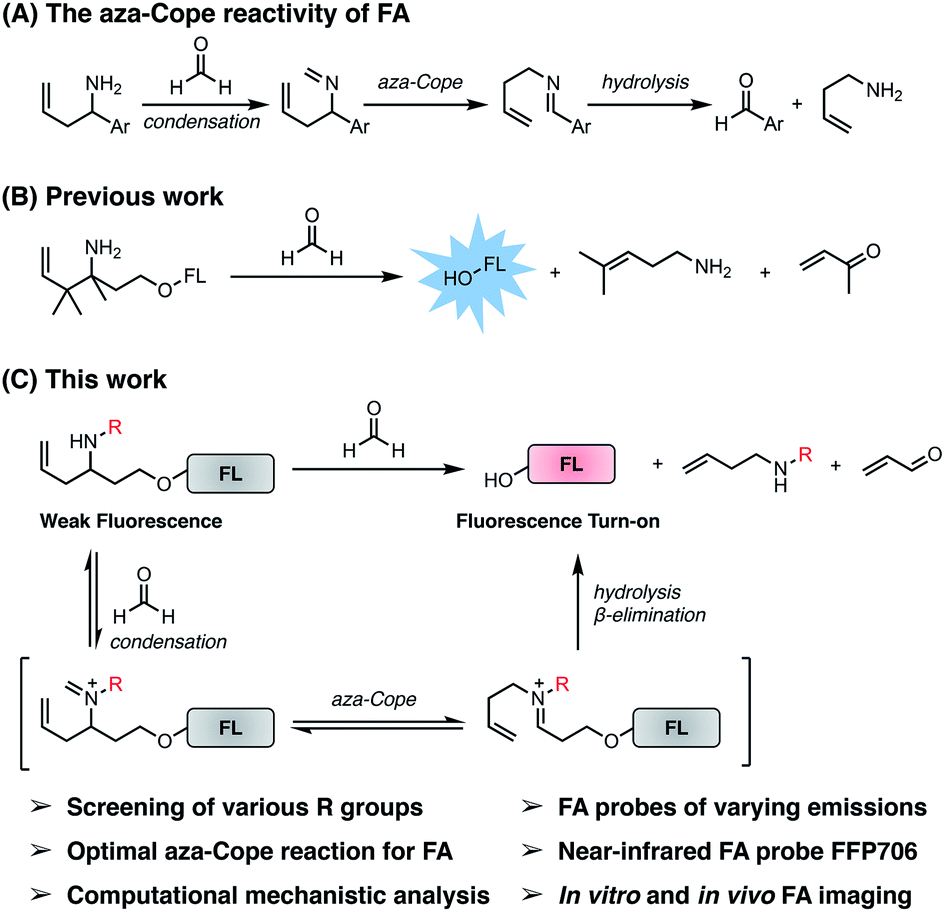
| | Fig. 1 The self-immolative aza-Cope strategy to construct fluorescent probes for detection and bioimaging of FA. (A) Previously reported aza-Cope reactivity of FA. (B) Previous work on the self-immolative aza-Cope strategy featuring the gem-dimethyl effect for enhanced aza-Cope reactivity to FA. (C) The present work focuses on systematic exploration of the effect of the N-substituent for identifying the optimal aza-Cope reaction with FA and provides a series of fluorescent probes for imaging FA in vitro and in vivo. | |
Results and discussion
Design and synthesis of N-substituted homoallylamine-based coumarin probes with aza-Cope reactivity for FA
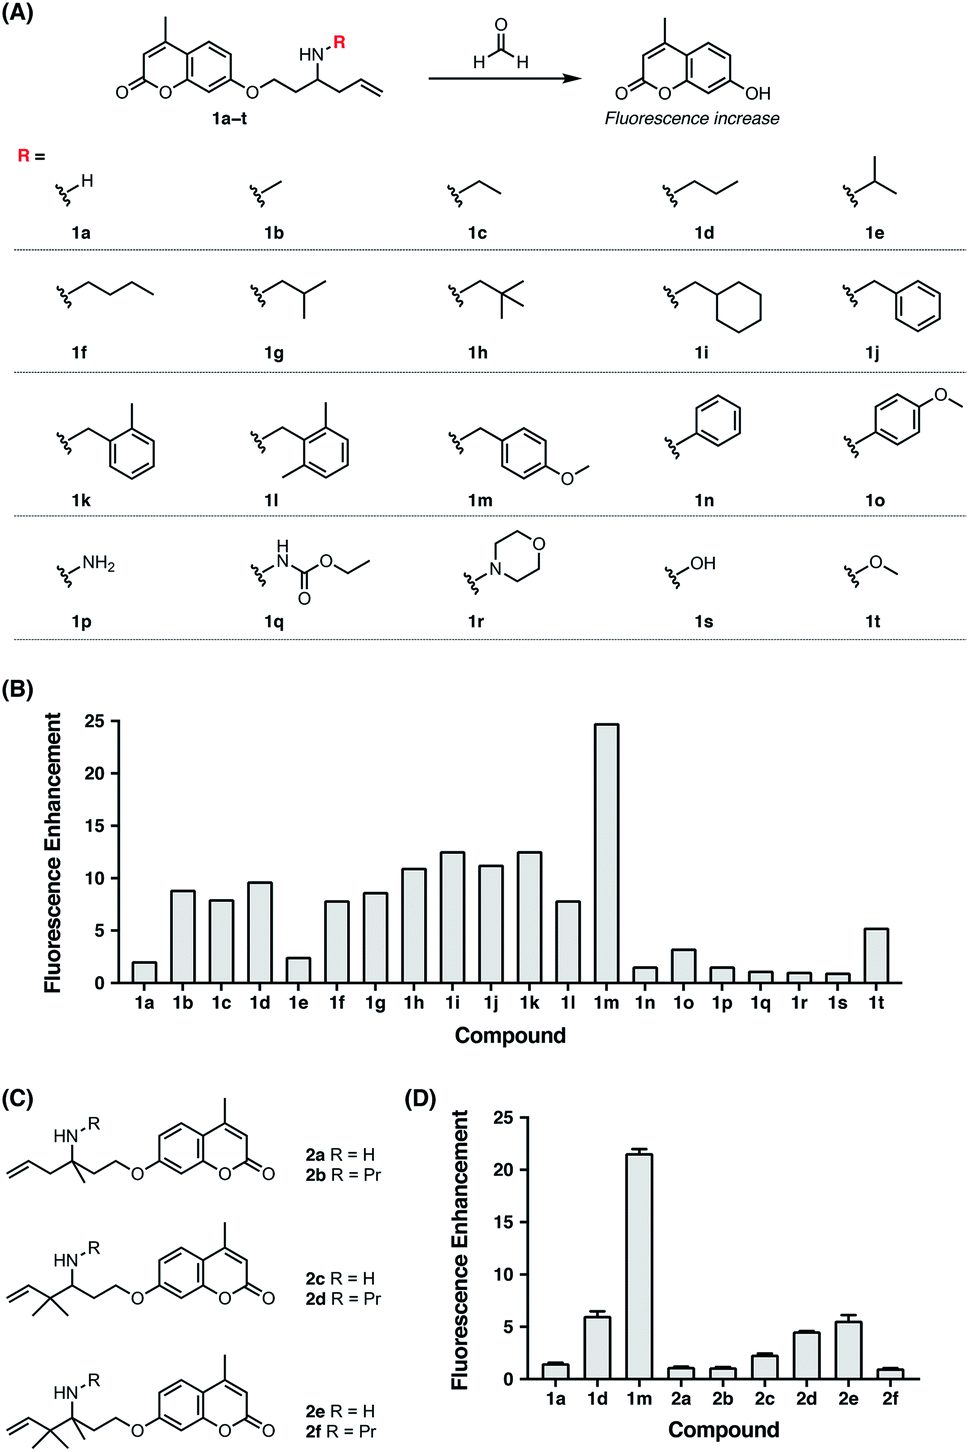
Previously, the seminal work from Chang laboratory reported a self-immolative aza-Cope strategy to construct FA fluorescent probes, which relies on incorporation of the homoallylamine aza-Cope reaction trigger and a β-elimination linker into phenolic fluorophore scaffolds (Fig. 1B).22c It was demonstrated that additional gem-dimethyl groups on the homoallylamine moiety (Fig. 1B) were crucial to increase the rate of aza-Cope rearrangement due to the gem-disubstituent effect.27 However, whether and how substituents on the nitrogen atom influence the aza-Cope reaction have not been systematically investigated (Fig. 1B).22c At the time of this report, we had initiated a similar approach for developing FA fluorescent probes and envisioned that the N-substituent on the homoallylamine moiety would affect efficiencies of the nucleophilic addition of homoallylamine with FA and/or the following aza-Cope rearrangement. Therefore, we sought to systematically explore various N-substituents with the aim to optimize the homoallylamine-based aza-Cope reaction for constructing sensitive and fast-responsive FA fluorescent probes (Fig. 1C). To this end, we designed a series of coumarin-derived probes, which contained the commercially available 7-hydroxy-4-methylcoumarin fluorophore caged with N-substituted homoallylamine moieties via a self-immolative β-elimination linker (Fig. 1C and 2A). These coumarin-derived probes were expected to react with FA through the cascade of imine formation, 2-aza-Cope rearrangement, hydrolysis, and β-elimination to generate the coumarin fluorophore with fluorescence increases (Fig. 1C and 2A). Diverse N-substituents ranging from alkyl and phenyl to heteroatomic groups with distinct steric and electronic effects were chosen and incorporated into the homoallylamine moieties for our systematic investigation (compounds 1b–1t in Fig. 2A). Generally, these probes were synthesized through O-alkylation of the coumarin fluorophore with the β-elimination linker bearing protected N-substituted homoallylamines (Scheme S1, ESI†). In some cases, the N-substituents were introduced through late-stage N-alkylation of the primary homoallylamine (Scheme S1, ESI†). Alternatively, a coumarin-derived intermediate bearing the β-elimination linker and an allyl ketone was prepared, followed by reductive amination reactions to transform the ketone into designed N-phenyl- and N-heteroatom-substituted probes (Scheme S2, ESI†). The synthetic routes and procedures for the coumarin-derived probes are detailed in the ESI.†
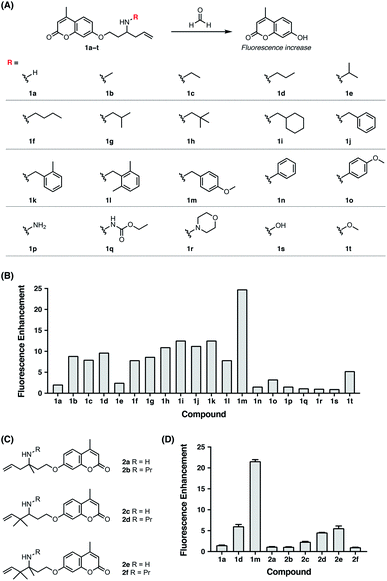 |
| | Fig. 2 Screening and comparison of various self-immolative aza-Cope-based coumarin probes for determining optimal aza-Cope reactivity of FA. (A) Chemical structures of aza-Cope-based coumarin probes with varying N-substituents synthesized in this study. (B) Screening of coumarin probes shown in (A) by fluorescence enhancement of the probes toward FA. (C) Chemical structures of aza-Cope-based coumarin probes with additional methyl groups. (D) Comparison of the N-substituent effect with the gem-dimethyl effect on aza-Cope reactivity by fluorescence enhancement of the probes toward FA. Probe (10 μM) was treated with 1 mM FA in PBS (20 mM, pH 7.4) at 37 °C for 2 h. The fluorescence intensity at 445 nm was recorded with excitation at 317 nm. Data are shown as mean fluorescence enhancement after versus before FA treatment ± standard deviation (n = 3). | |
Screening of the coumarin-derived probes for the optimal aza-Cope reaction with FA
With the family of N-substituted homoallylamine-based coumarin probes in hand, we evaluated their reactivity toward FA in vitro using fluorescence spectroscopy. Our initial tests showed that the probes displayed comparable fluorescence responses to FA at 25 °C and 37 °C (Fig. S1A, ESI†). The biologically relevant temperature, i.e., 37 °C, was subsequently used throughout our study. Specifically, the probes (10 μM) were individually treated with FA (1 mM) in aqueous solutions buffered at physiological pH (20 mM PBS buffer, pH 7.4) at 37 °C, and the fluorescence spectra before and after FA treatment were recorded and compared. As expected, most of the probes exhibited apparent new fluorescence peaks with the emission maxima at 445 nm upon treatment with FA (Fig. S1B, ESI†). It was observed that N-substituents on the homoallylamine moieties significantly and differentially affected the fluorescence responses of probes at 445 nm (Fig. 2B). Generally, N-substitution with alkyl and benzyl groups (i.e., 1b–1m) greatly enhanced the probe response compared to non-substitution (i.e., 1a), with the N-p-methoxybenzyl derivative (i.e., 1m) providing the highest fluorescence increase (Fig. 2B). We speculated that N-substituents contributed to the observed enhancement of the fluorescence response in two aspects. On one hand, N-substituted homoallylamines react with FA to generate iminium ions that are known to accelerate the aza-Cope rearrangement due to the presence of charge.28 By contrast, reaction of the non-substituted homoallylamine with FA may generate neutral imine upon deprotonation of the iminium ion. On the other hand, N-alkyl and N-benzyl substituents enhance the nucleophilicity of homoallylamines,29 thereby leading to accelerated condensation reactions with FA. In line with this, N-isopropyl, previously reported to slightly increase nitrogen nucleophilicity,29b only marginally enhanced the fluorescence response of the probe (i.e., 1e) (Fig. 2B). The greater response of the N-p-methoxybenzyl-bearing probe (i.e., 1m) relative to other N-benzyl-bearing probes (i.e., 1j–1l) may also be explained by increased nitrogen nucleophilicity due to the electron-donating effect of the p-methoxyl group. It is still worth mentioning that the N-p-methoxybenzyl substituent may also contribute to efficiently quench the fluorescence of coumarin via photoinduced electron transfer,30 resulting in low background fluorescence and outstanding fluorescence enhancement of 1m to FA. Interestingly, the N-o-dimethylbenzyl-bearing probe (i.e., 1l) displayed a weaker fluorescence response than other N-benzyl-bearing probes (i.e., 1j–1k) (Fig. 2B), which may be attributed to the steric effects of o-dimethyl groups decelerating condensation with FA. Notably, probes with N-phenyl and N-heteroatomic substituents (i.e., 1n–1t) exhibited fluorescence responses generally comparable with the non-substituted probe (i.e., 1a) and weaker than those with N-alkyl and N-benzyl substituents (i.e., 1b–1m) (Fig. 2B). We speculated that N-phenyl and N-heteroatomic substituents may result in relatively slow iminium-forming reactions at neutral pH as previously noted.31 To further corroborate the screening results, we monitored the fluorescence responses of selected probes to FA over time and confirmed that the N-p-methoxybenzyl-bearing probe (i.e., 1m) exhibited a greatly enhanced reaction rate and fluorescence response toward FA (Fig. S2, ESI†).
We then sought to compare our newly identified N-p-methoxybenzyl homoallylamine moiety with the previously reported gem-dimethyl aza-Cope reaction trigger for FA detection.22c For this purpose, homoallylamine moieties bearing additional methyl groups at the α or β position were installed into the coumarin fluorophore via the β-elimination linker, providing probe derivatives 2a–2f with additional methyl groups (Fig. 2C and Scheme S3, ESI†). Their fluorescence responses to FA were measured as described above and compared (Fig. 2D and S3, ESI†). We observed that the addition of a single methyl group at the α position (i.e., 2a) resulted in a similar fluorescence response relative to 1a, whereas gem-dimethyl groups at the β position (i.e., 2c) led to a higher fluorescence response compared to probes 1a and 2a (Fig. 2D). Probe 2e with methyl groups at both the α and β positions displayed an even higher fluorescence response than 2c, indicating that the methyl group at the α position and the gem-dimethyl groups at the β position are indispensable for the previously reported gem-disubstitution effect leading to accelerated aza-Cope rearrangement.22c Interestingly, the introduction of the N-propyl substituent on β-gem-dimethyl probe 2c further increased the fluorescence response (2dversus2c). However, N-propyl substitution on α-methyl probes 2a and 2e produced a similar (i.e., 2b) or greatly decreased (i.e., 2f) fluorescence response relative to parent probes 2a and 2e (Fig. 2D), respectively, probably resulting from increased steric encumbrance. Nevertheless, the probes 2a–2f that possess additional methyl or gem-dimethyl groups were all less responsive to FA than the N-p-methoxybenzyl-bearing probe 1m (Fig. 2D). Additional comparison of response kinetics further confirmed the greater fluorescence enhancement and faster response rate of 1m toward FA compared to 2e that contains the previously reported gem-dimethyl aza-Cope reaction trigger22c (Fig. S4, ESI†). The N-substituted homoallylamine moiety possesses other advantages such as simple synthesis and structural versatility. The N-substituent on simple homoallylamine may be utilized for further derivatization to construct, for example, two-fluorophore cassettes for ratiometric detection of FA.32 Taken together, these results identify N-p-methoxybenzyl homoallylamine as a more efficient and versatile aza-Cope reaction moiety for FA, which provides new opportunities for developing FA fluorescent probes.
Theoretical calculations on the reaction of N-substituted homoallylamine with FA
To understand the different reactivities of N-substituted homoallylamines with FA, density functional theory (DFT) calculations were performed.33 As illustrated in Fig. 3A, the reactions of homoallylamines with FA undergo multiple steps including nucleophilic addition with transition state I (TS1) and aza-Cope rearrangement with transition state II (TS2). The Chang laboratory previously reported that aza-Cope rearrangement of high efficiency enhanced the signal-to-noise responses of self-immolative aza-Cope fluorescent probes to FA.22c Therefore, we first focused on the aza-Cope rearrangement step and calculated the activation free energies of TS2 (Fig. 3A, ΔG‡2 shown in red). However, the aza-Cope rearrangement barriers of N-substituted homoallylamines are not well-correlated with the fluorescence responses of the corresponding coumarin probes (Fig. 3B). This finding suggests that the fluorescence increases of probes to FA, as well as the aza-Cope reactivity of homoallylamine, is not governed by aza-Cope rearrangement. We then calculated the energy barriers of condensation (TS1) for a series of N-substituted homoallylamines (Fig. 3A, ΔG‡1 shown in black), and found that the activation free energies of condensation processes were largely correlated with the measured fluorescence increases of the corresponding probes (Fig. 3B). Specifically, N-substituted homoallylamines with high barriers of condensation processes (ΔG‡1) were generally corresponding to probes showing low fluorescence responses to FA, and vice versa (Fig. 3B). With the p-methoxybenzyl group as the N-substituent, the calculated lowest energy barrier was consistent with the highest fluorescence response of the corresponding probe 1m. We also noticed two exceptions, i.e. non-substitution (R = H) and N-amino substitution (R = NH2), that were calculated to be inconsistent with this trend (Table S1, ESI†). The former exception (R = H) may be explained by deprotonation of the iminium ion to form neutral imine that disfavors the following aza-Cope rearrangement,28 whereas the latter exception (R = NH2) may be presumably due to the side-reaction of FA with the primary amino group. Overall, these results suggest that the condensation, rather than the aza-Cope rearrangement, is more likely to be the rate-determining step in the reaction of N-substituted homoallylamine with FA.
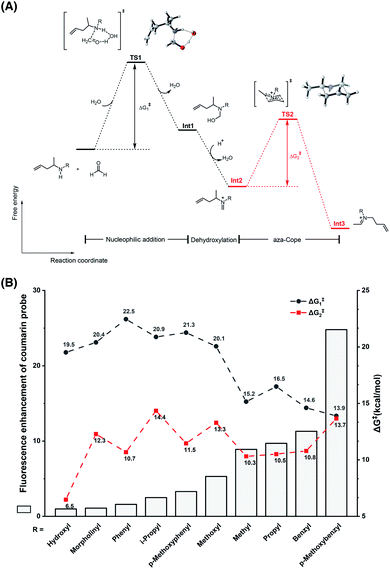 |
| | Fig. 3 Theoretical calculations on the effect of the N-substituent in the reaction of homoallylamine with FA. (A) The reaction and free energy profiles in the reaction of N-substituted homoallylamine with FA. TS: transition state; Int: intermediate. (B) Relationship between fluorescence enhancement of coumarin probes and energy barriers of condensation and aza-Cope processes. Calculations were performed with Gaussian software and optimizations were conducted with B3LYP-D3 and 6-31G(d) basis sets for all atoms as detailed in the ESI.† | |
Development of a series of FA fluorescent probes with the optimal aza-Cope reaction moiety
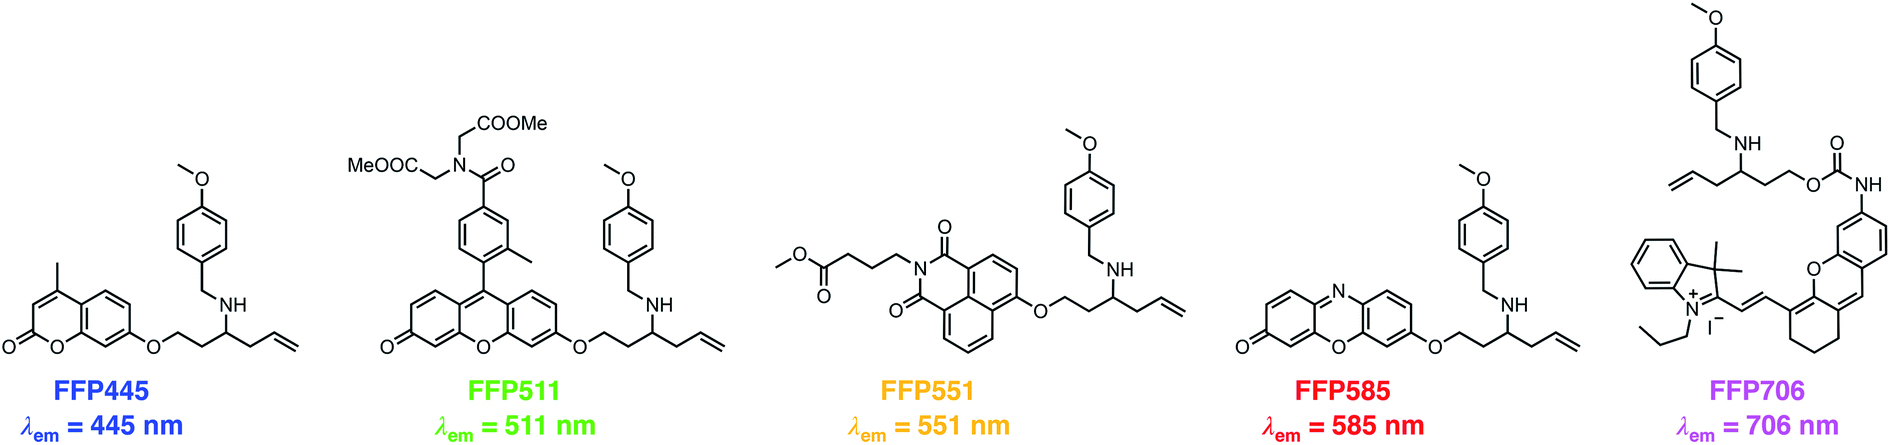
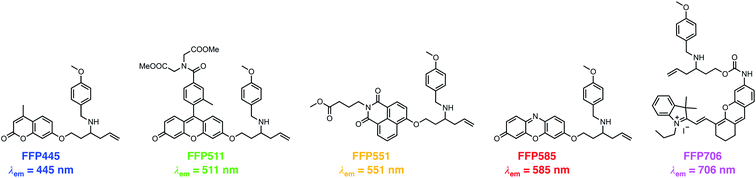
The N-p-methoxybenzyl-bearing coumarin probe 1m exhibited the maximum emission wavelength at 445 nm in aqueous buffer upon FA treatment and hereby was named FA Fluorescent Probe 445 (FFP445). We further created a palette of FA fluorescent probes that possess varying fluorescence emission wavelengths by caging a series of fluorophore scaffolds with the optimal N-p-methoxybenzyl homoallylamine moiety via the self-immolative β-elimination linker (Chart 1). Specifically, a Tokyo Green34 analogue was utilized to prepare FFP511 as a green-fluorescing probe with a maximum fluorescence emission wavelength of 511 nm. 1,8-Naphthalimide was derivatized with N-p-methoxybenzyl homoallylamine to provide FFP551, a yellow-fluorescing probe with a maximum fluorescence emission wavelength of 551 nm. Additional carboxylic ester functionalities were introduced into the structures of FFP511 and FFP551 to enhance the intracellular retention of the probes.35 In addition, the resorufin scaffold was chosen to prepare the red-fluorescing probe FFP585 with a maximum fluorescence emission wavelength of 585 nm. The N-p-methoxybenzyl homoallylamine moiety was also installed into the near-infrared hemicyanine fluorophore36via a carbamate linkage, generating probe FFP706 with a maximum fluorescence emission wavelength of 706 nm in the near-infrared spectral region. The synthetic routes and procedures for FFP511, FFP551, FFP585, and FFP706 are detailed in Schemes S4–S7, respectively, in the ESI.†
 |
| | Chart 1 Chemical structures of a palette of differently colored aza-Cope-based FA fluorescent probes with N-p-methoxybenzyl substituents. | |
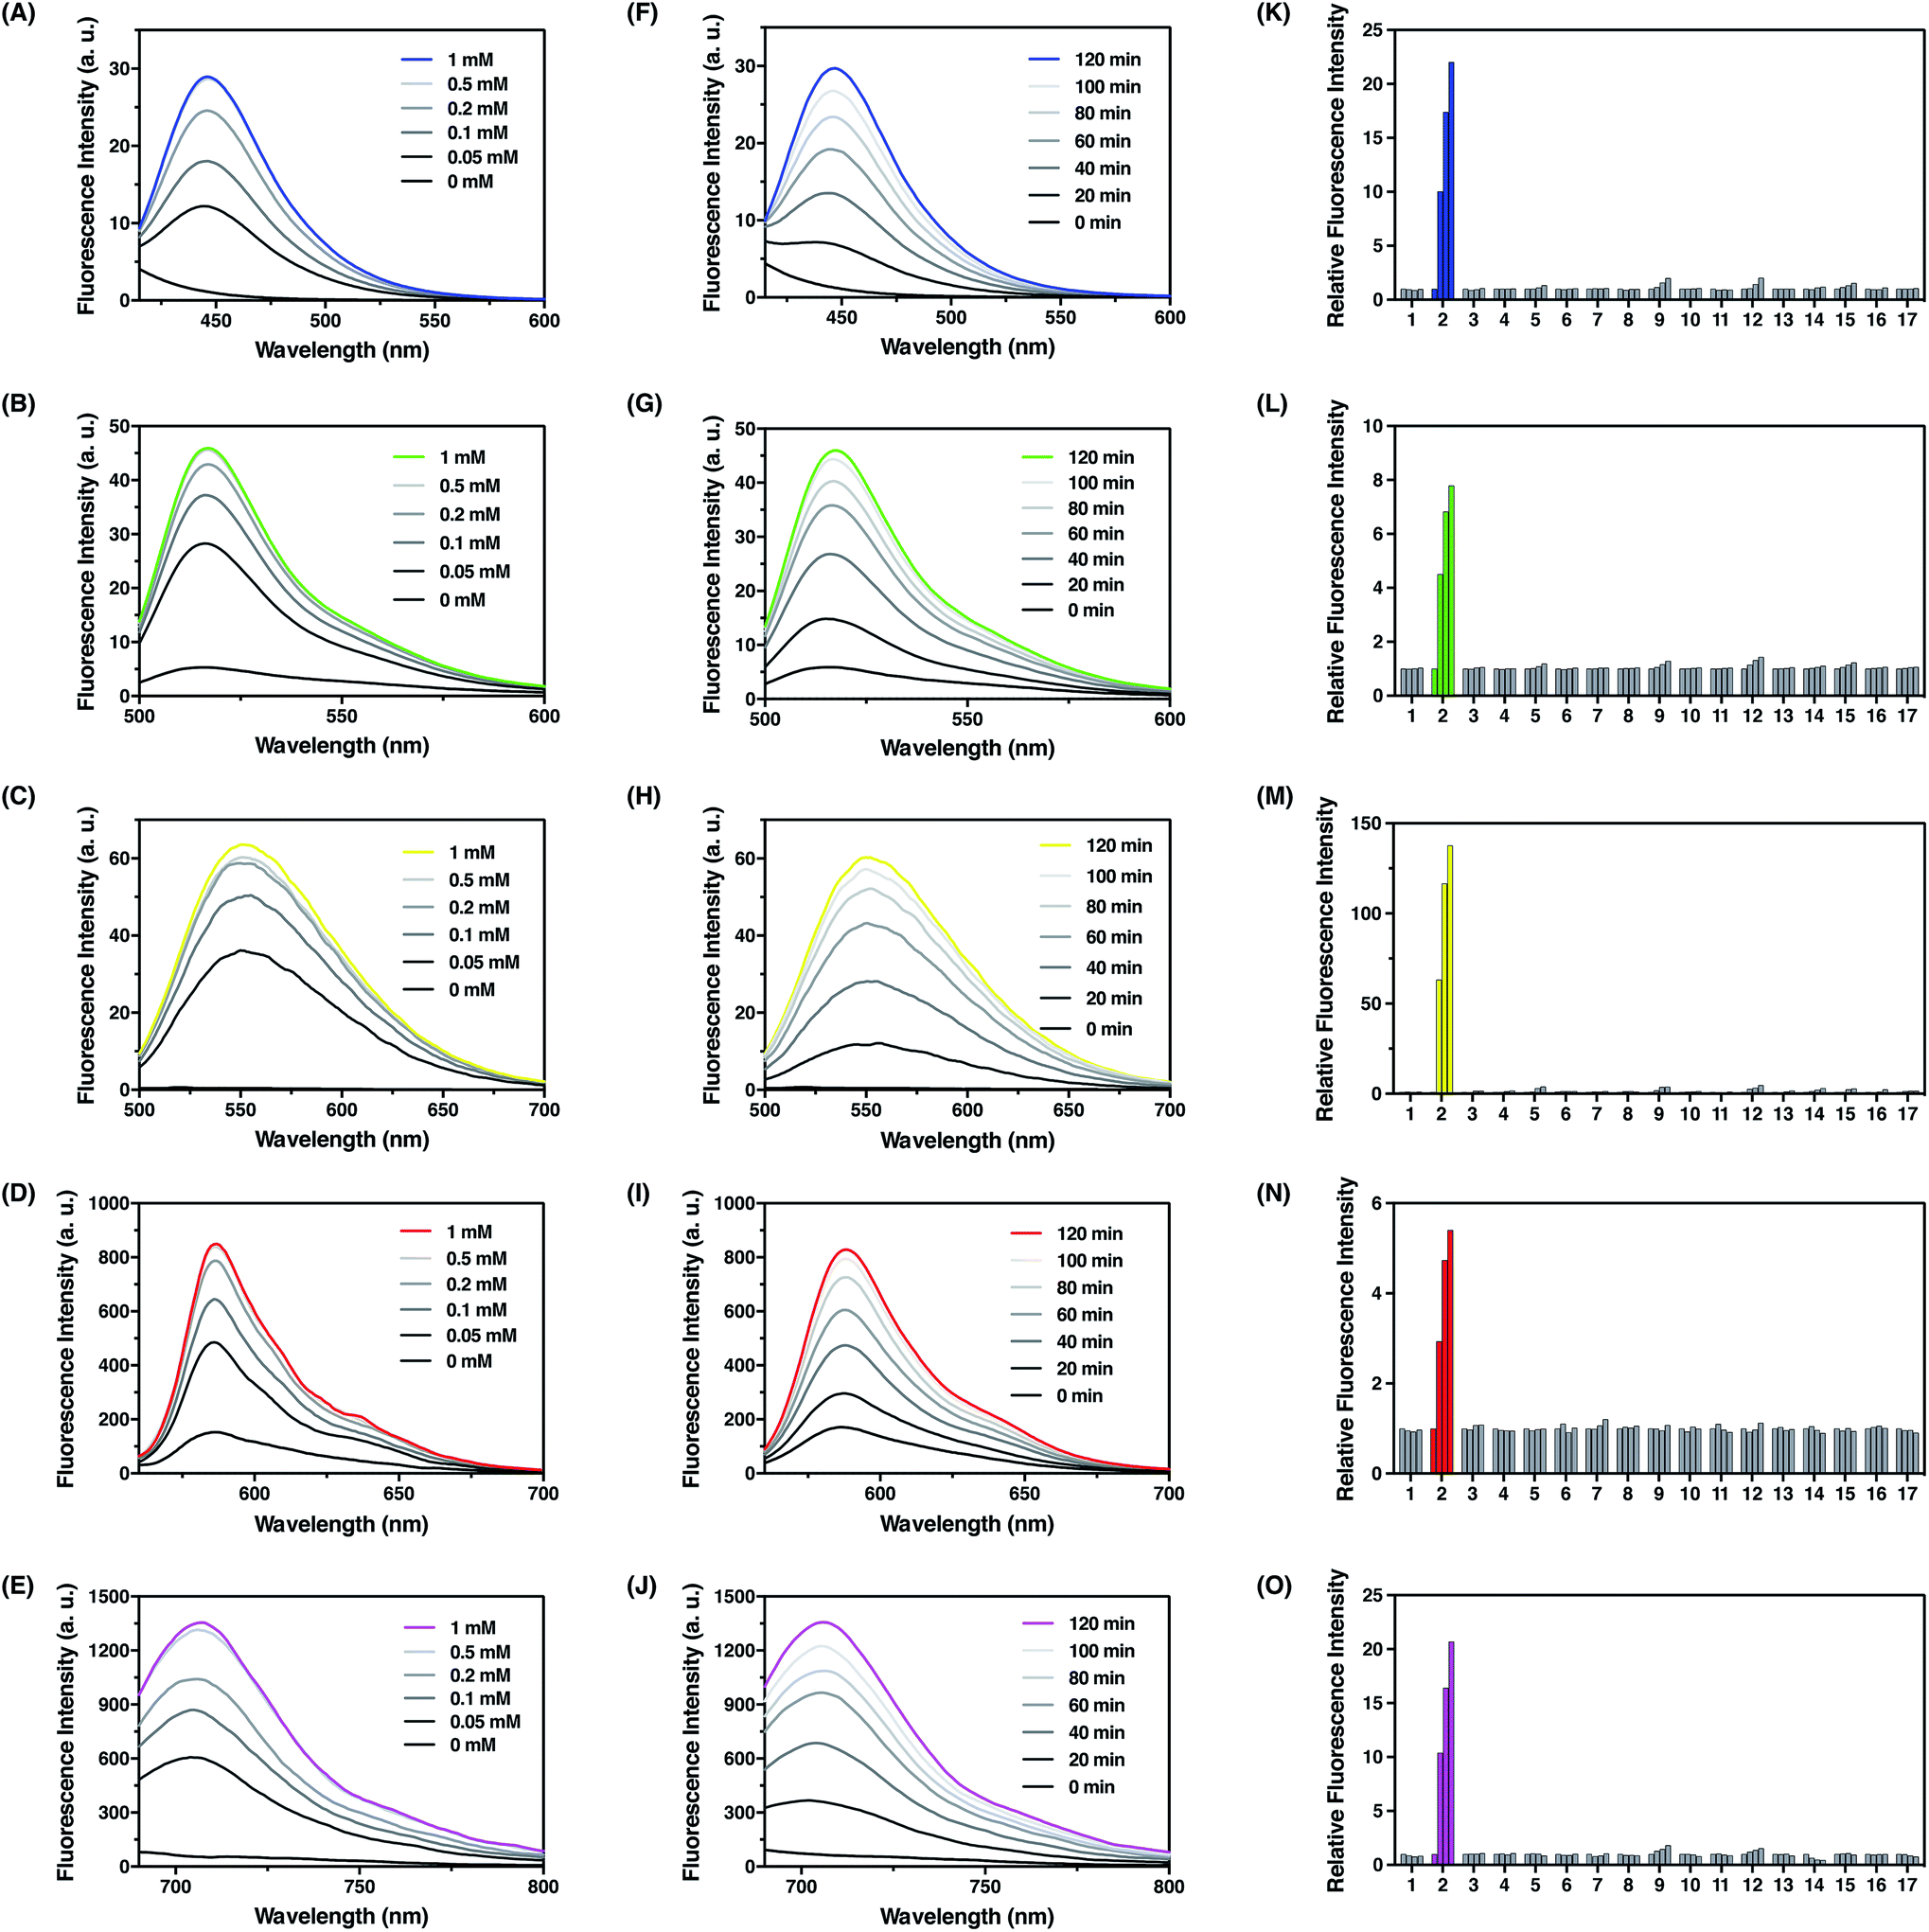
With these probes in hand, we evaluated their fluorescence responses to FA in aqueous PBS buffer at physiological pH. Generally, dose-dependent (Fig. 4A–E) and time-dependent (Fig. 4F–J) fluorescence increases were observed for all probes upon FA treatment, and the maximum fluorescence emission intensities were linearly correlated with the treatment time and FA concentration at low levels (Fig. S5–S9, ESI†). In particular, FFP445 exhibits a ca. 15.5 fold fluorescence enhancement to 100 μM FA after 2 h. FFP511 exhibits a ca. 6.6 fold fluorescence increase upon treatment with 100 μM FA for 2 h. Meanwhile, FFP551 shows a ca. 116.8 fold fluorescence turn-on response to 100 μM FA after 2 h. FFP585 displays a ca. 4.3 fold fluorescence enhancement to 100 μM FA after 2 h. FFP706 exhibits a ca. 13.1 fold fluorescence increase upon treatment with 100 μM FA for 2 h. With a 10 μM probe after 2 h treatment at 37 °C, the detection limits of FFP445, FFP511, FFP551, FFP585, and FFP706 for FA were estimated to be in the range of 1–2.5 μM (Fig. S5C–S9C, ESI†). To assess the reaction rates with FA, we monitored the fluorescence increases of these probes over time immediately after the addition of large excess of FA (5 mM). The rate constants of pseudo-first-order reactions at 25 °C were thereby calculated to be around 9.3–10 × 10−4 s−1 for FFP445, FFP511, FFP551, FFP585, and FFP706 (Fig. S10–S14, ESI†), suggesting faster reactions of these probes than the previously reported gem-dimethyl-based probes.22c Moreover, LC-MS analyses were performed to confirm the generation of corresponding decaged fluorophores upon reactions of the probes with FA (Fig. S15–S19, ESI†).
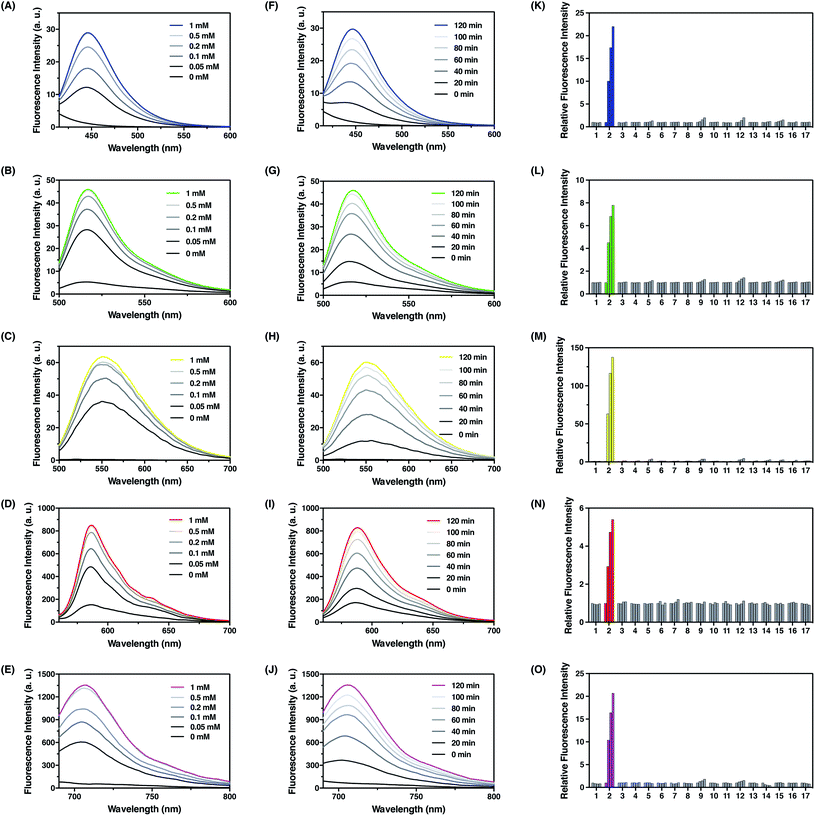 |
| | Fig. 4 Photophysical characterization of FA fluorescent probes in chemical systems. (A–E) Fluorescence emission spectra of (A) FFP445, (B) FFP511, (C) FFP551, (D) FFP585, and (E) FFP706 upon treatment with different amounts of FA at 37 °C for 2 h. Data were acquired in PBS (20 mM, pH 7.4) with 10 μM probe concentration. Probes FFP445, FFP511, FFP551, FFP585, and FFP706 were excited at 317 nm, 490 nm, 441 nm, 542 nm, and 670 nm, respectively. (F–J) Fluorescence emission spectra of (F) FFP445, (G) FFP511, (H) FFP551, (I) FFP585, and (J) FFP706 upon treatment with 0.5 mM FA at 37 °C for indicated time periods. (K–O) Relative fluorescence intensity of (K) FFP445 at 445 nm, (L) FFP511 at 511 nm, (M) FFP551 at 551 nm, (N) FFP585 at 585 nm, and (O) FFP706 at 706 nm upon treatment with various RCS and relevant biological species (0.5 mM) at 37 °C for different time periods: (1) blank, (2) FA, (3) acetaldehyde, (4) glucose, (5) L-dehydroascorbate, (6) glucosone, (7) pyruvate, (8) oxaloacetate, (9) methylglyoxal, (10) H2O2, (11) glutathione, (12) glyoxal, (13) benzaldehyde, (14) 4-hydroxynonenal, (15) p-nitrobenzaldehyde, (16) p-methoxybenzaldehyde, and (17) trichloroacetaldehyde. Bars in (K–O) represent relative fluorescence intensities upon treatment with each species for 0, 40, 80, and 120 min. | |
We then examined the selectivity of the probes for FA detection. As expected, FFP445, FFP511, FFP551, FFP585, and FFP706 all displayed obvious fluorescence turn-on responses only in the presence of FA, but were largely irresponsive to a panel of biologically relevant aldehydes (e.g., 4-hydoxynonenal, acetaldehyde, and methylglyoxal), intracellular oxidizing and reducing conditions (e.g., H2O2 and glutathione) (Fig. 4K–O), and various representative cations, anions, amino acids, reductants, and oxidants (Fig. S20, ESI†). Moreover, we showed that the addition of HEK293T cell lysates did not cause obvious fluorescence changes of the probes and hardly interfered with their fluorescence responses to FA (Fig. S21, ESI†). We also investigated the effect of NaHSO3 as a FA scavenger.23a While NaHSO3 does not induce significant fluorescence changes of the probes (Fig. S20, ESI†), it can indeed suppress the fluorescence responses of the probes to FA in a dose-dependent manner (Fig. S22, ESI†), thus confirming the scavenging ability of NaHSO3 toward FA. Lastly, we examined the effect of pH on detection of FA with the probes. Our results demonstrated that upon FA treatment the fluorescence intensities of these probes increased drastically within wide pH ranges, especially at physiological pH values around 7.4 (Fig. S23, ESI†). Overall, these results demonstrate that the N-p-methoxybenzyl homoallylamine aza-Cope reaction moiety could be generally incorporated into a variety of fluorophore scaffolds via an ether or carbamate linkage to construct highly efficient fluorescent probes for FA detection.
Fluorescence imaging of exogenous FA in live cells
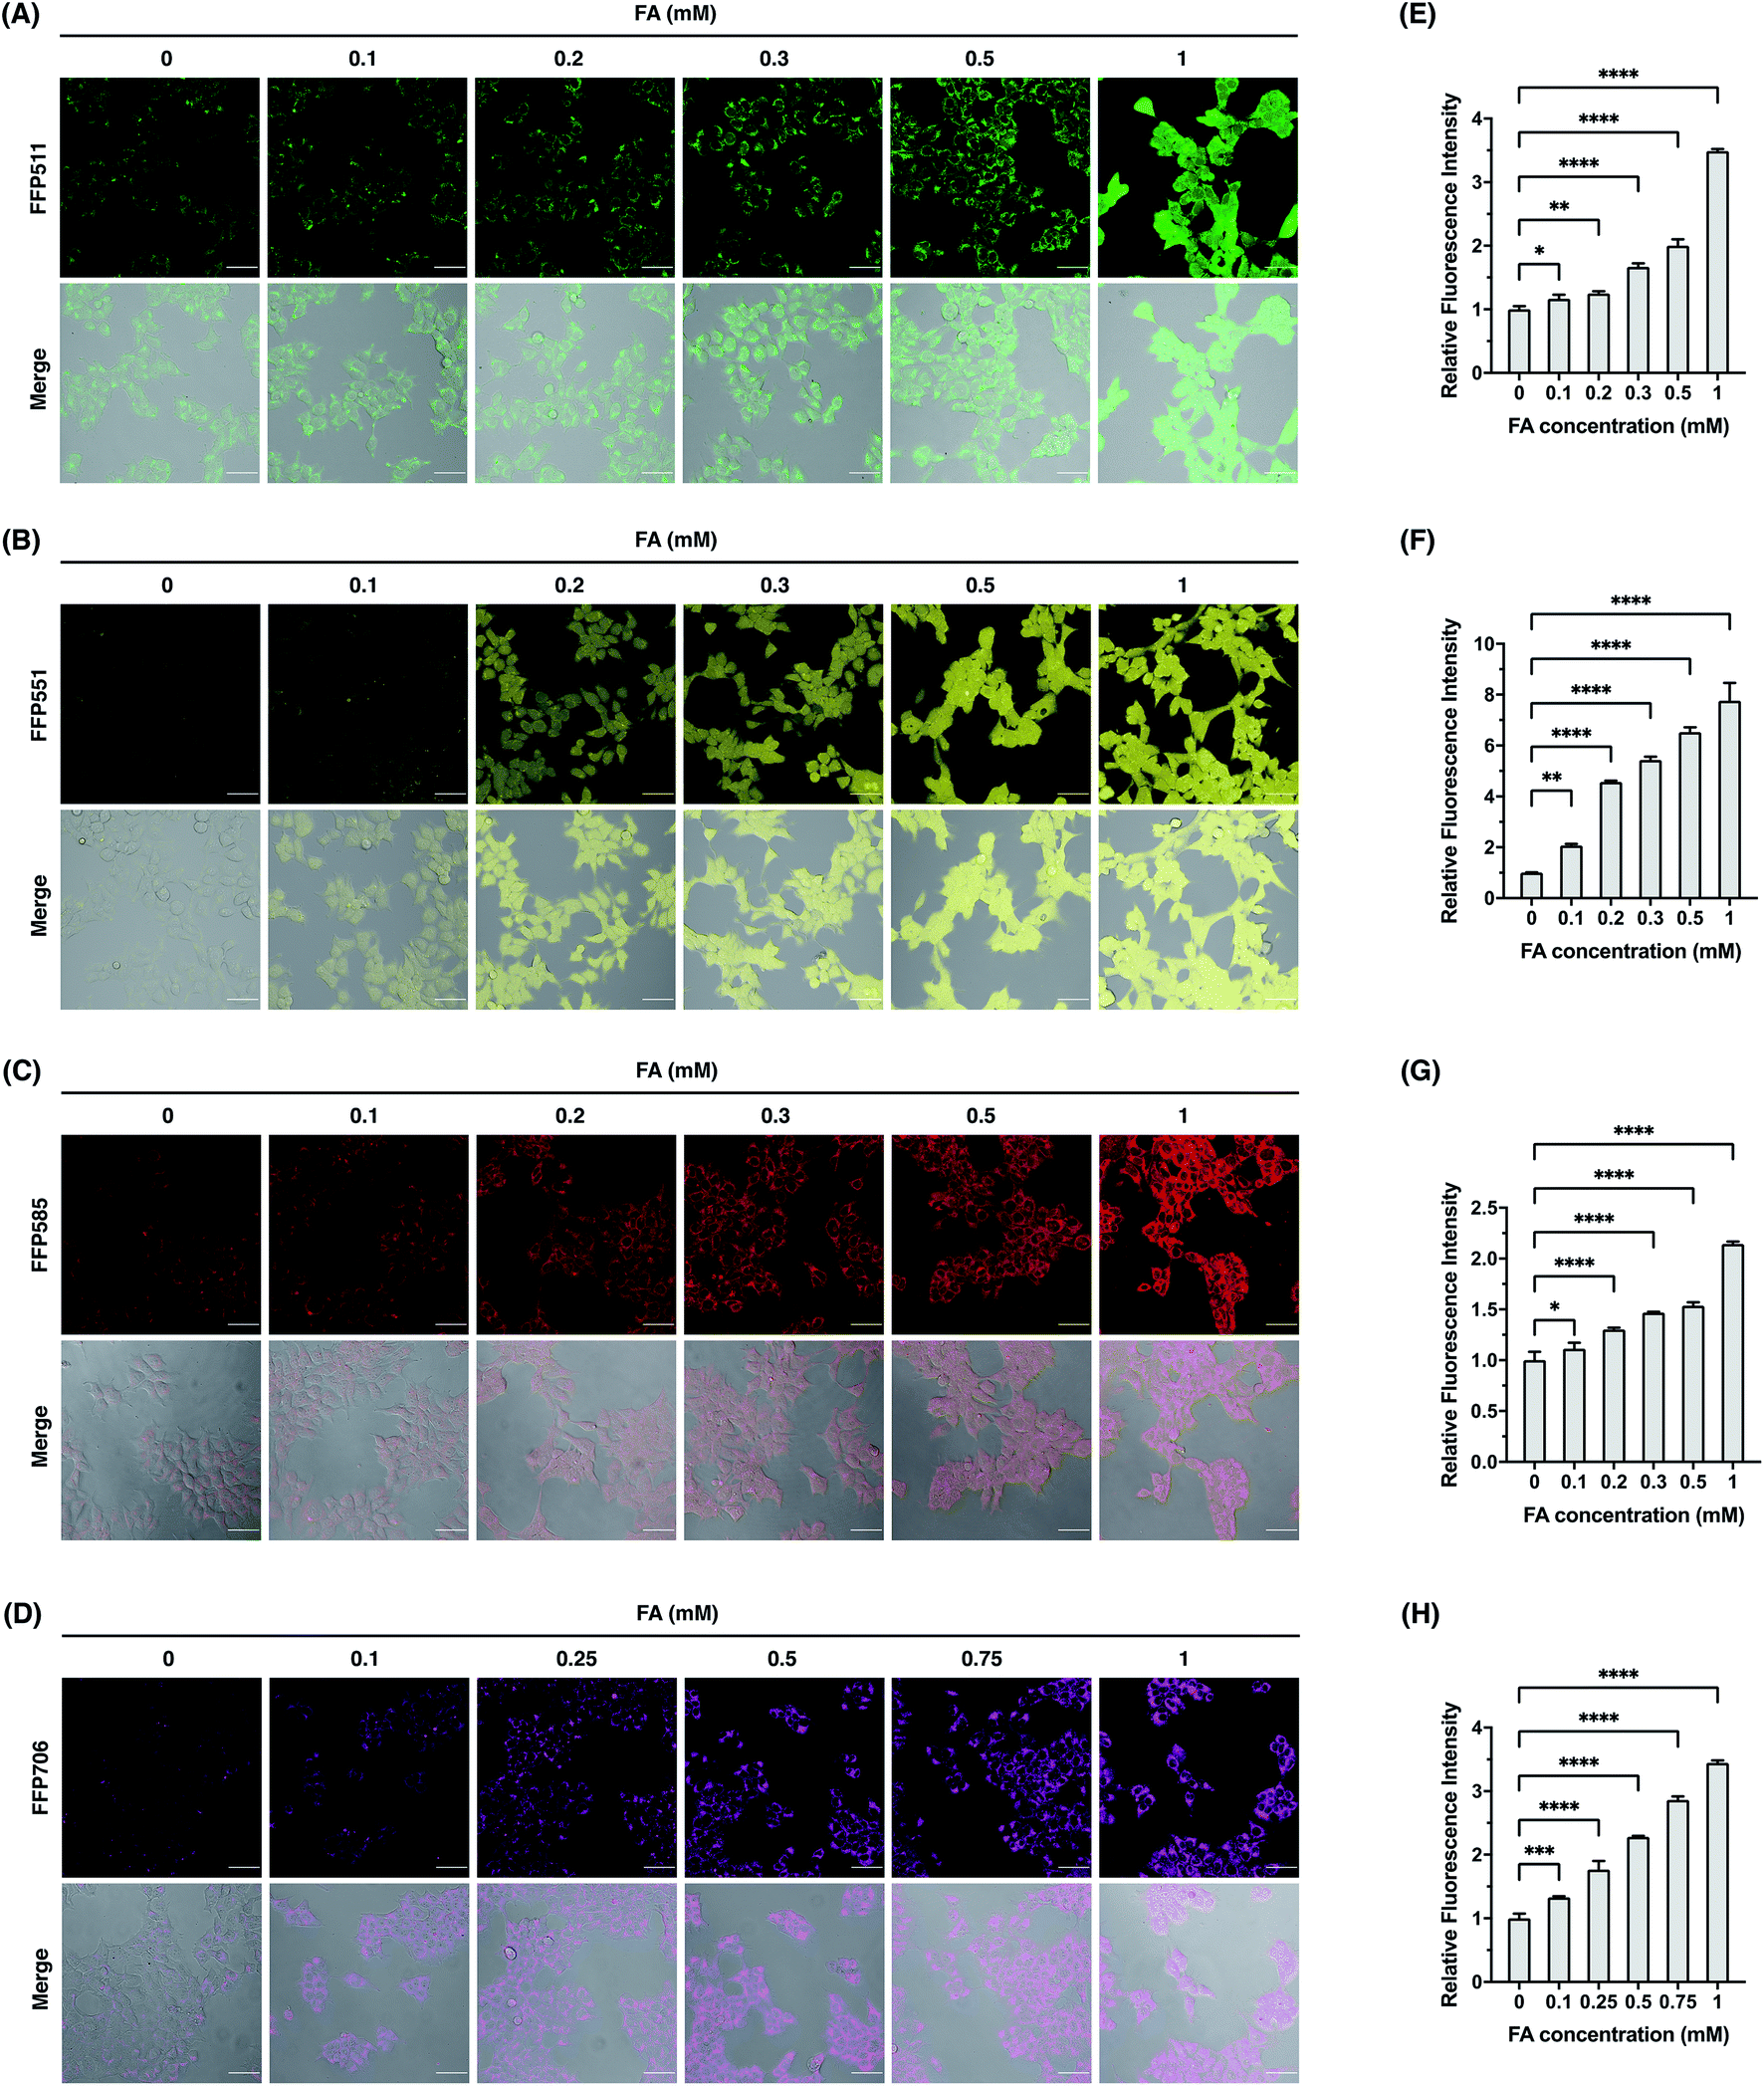
We continued to evaluate the potential of FFP probes to visualize intracellular FA changes in living cells. For these experiments, we mainly focused on FFP511, FFP551, FFP585, and FFP706, as these probes possess fluorescence excitation and emission wavelengths above the ultraviolet spectral region and therefore are more suitable for fluorescence imaging in living cells. Generally, HEK293T cells were incubated with the probe, treated with FA, and then monitored by confocal fluorescence microscopy. As shown in Fig. 5, HEK293T cells loaded with FFP511 (20 μM), FFP551 (10 μM), FFP585 (5 μM), and FFP706 (2 μM) generally showed low fluorescence imaging signals. These results, together with the in vitro assays using HEK293T cell lysates (Fig. S21, ESI†), suggest that the probes are minimally responsive to intracellular enzymes or components. In contrast, treatment of probe-loaded cells with exogenous FA at physiologically relevant levels (0.1–1 mM) resulted in significant and dose-dependent increases of green, yellow, red, and near-infrared intracellular fluorescence for FFP511, FFP551, FFP585, and FFP706, respectively. The cytotoxicities of these probes were assessed in HEK293T cells using MTT assays (Fig. S24, ESI†), which confirmed that they were largely nontoxic to cells at working concentrations. Taken together, these results demonstrate that the FFP probes are capable of detecting changes in intracellular FA levels in living cells by fluorescence imaging.
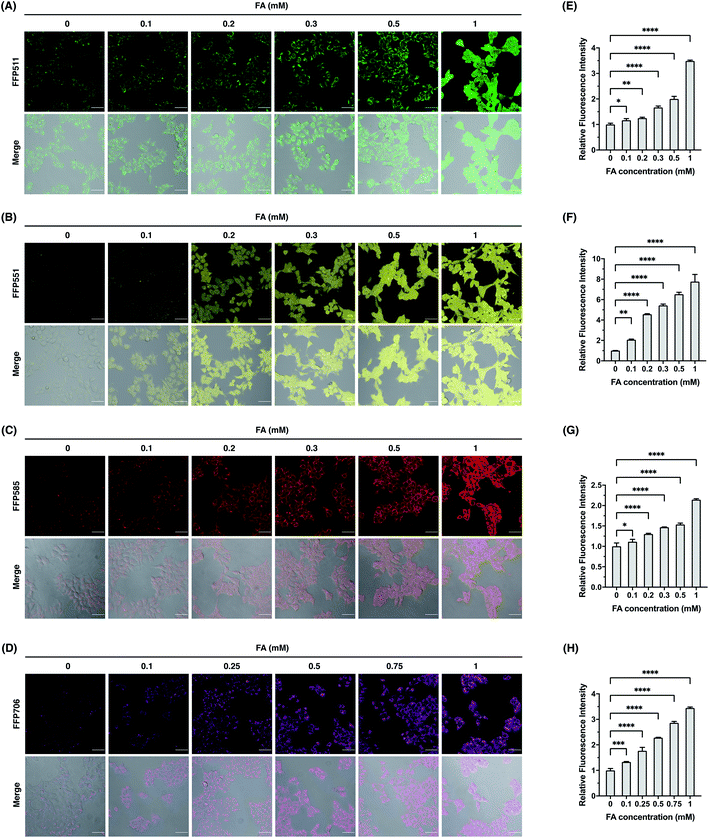 |
| | Fig. 5 Confocal fluorescence imaging of exogenous FA with FFP fluorescent probes in HEK293T cells. (A–D) Cells were loaded with (A) FFP511 (20 μM), (B) FFP551 (10 μM), (C) FFP585 (5 μM), or FFP706 (2 μM) for 30 min and treated with FA of varying concentrations (0–1 mM) for 60 min before being imaged by confocal fluorescence microscopy. Scale bars represent 50 μm. (E–H) Quantification of fluorescence images shown in (A–D), respectively. The y-axis represents fluorescence intensities of cells upon FA treatment relative to those without FA treatment. Data are shown as mean relative fluorescence intensity ± standard deviation (n = 3 independent experiments). Statistical analysis for multiple comparison was performed using one-way ANOVA. *p < 0.05, **p < 0.01, ***p < 0.001, ****p < 0.0001. | |
Fluorescence imaging of endogenous FA in breast cancer cell models
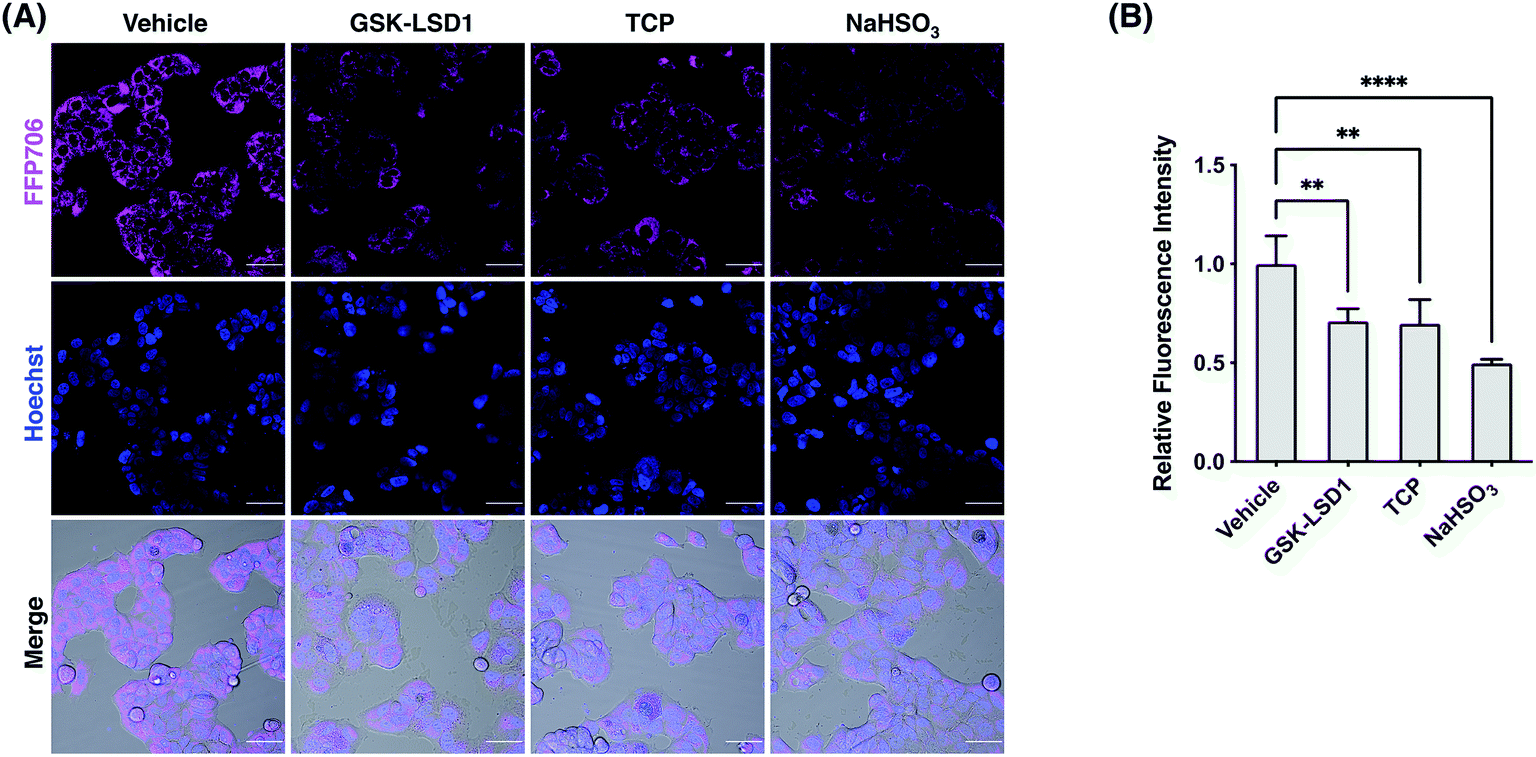
We next focused on FFP585 and FFP706 to evaluate their utility in detecting endogenously produced FA due to their relatively long fluorescence excitation and emission wavelengths. To this end, we chose the MCF7 breast cancer cells that are known to overexpress LSD1 and thereby may have elevated endogenous FA levels.22a,37 Indeed, MCF7 cells loaded with FFP585 or FFP706 exhibited strong intracellular fluorescence signals (Fig. 6, S25, and S26, ESI†). By contrast, pretreatment of the cells with LSD1 inhibitors, e.g., GSK-LSD1 (ref. 38) or TCP,39 substantially attenuated intracellular fluorescence intensities of FFP585 and FFP706 (Fig. 6, S25, and S26, ESI†), suggesting that inhibition of LSD1 resulted in reduced FA levels. In addition, incubation of probe-loaded MCF7 cells with FA scavengers, such as NaHSO3,23a β-mercaptoethanol (BME),40 and dimedone (DMD),41 led to greatly decreased intracellular fluorescence (Fig. 6, S25, and S26, ESI†). We also applied FFP706 to MDA-MB-231 breast cancer cells that were also reported to overexpress LSD1 (ref. 37a) for imaging endogenous FA. Similarly, the results showed that the strong fluorescence signals of FFP706 in MDA-MB-231 cells were greatly suppressed in the presence of LSD1 inhibitors or FA scavengers (Fig. S27, ESI†). Lastly, MTT assays suggested that FFP706 exhibited low cytotoxicity in MCF7 and MDA-MB-231 cells below 20 μM (Fig. S28, ESI†). Together, these data show that both FFP585 and FFP706 are able to visualize changes in endogenous FA levels in breast cancer cell models.
 |
| | Fig. 6 Confocal fluorescence imaging of endogenous FA with FFP706 in MCF7 cells. (A) Cells were pre-treated with GSK-LSD1 (1 μM) or TCP (20 μM) for 24 h and then loaded with FFP706 (2 μM) for 60 min before being imaged by confocal fluorescence microscopy. For the NaHSO3 group, cells were treated with NaHSO3 (200 μM) for 30 min before probe loading. Nuclei were stained with Hoechst 33342. Scale bars represent 50 μm. (B) Quantification of fluorescence images shown in (A). The y-axis represents fluorescence intensities of cells relative to those with vehicle treatment. Data are shown as mean relative fluorescence intensity ± standard deviation (n = 3 independent experiments). Statistical analysis for multiple comparison was performed using one-way ANOVA. **p < 0.01, ****p < 0.0001. | |
Fluorescence imaging of FA in live tissues from mouse brains
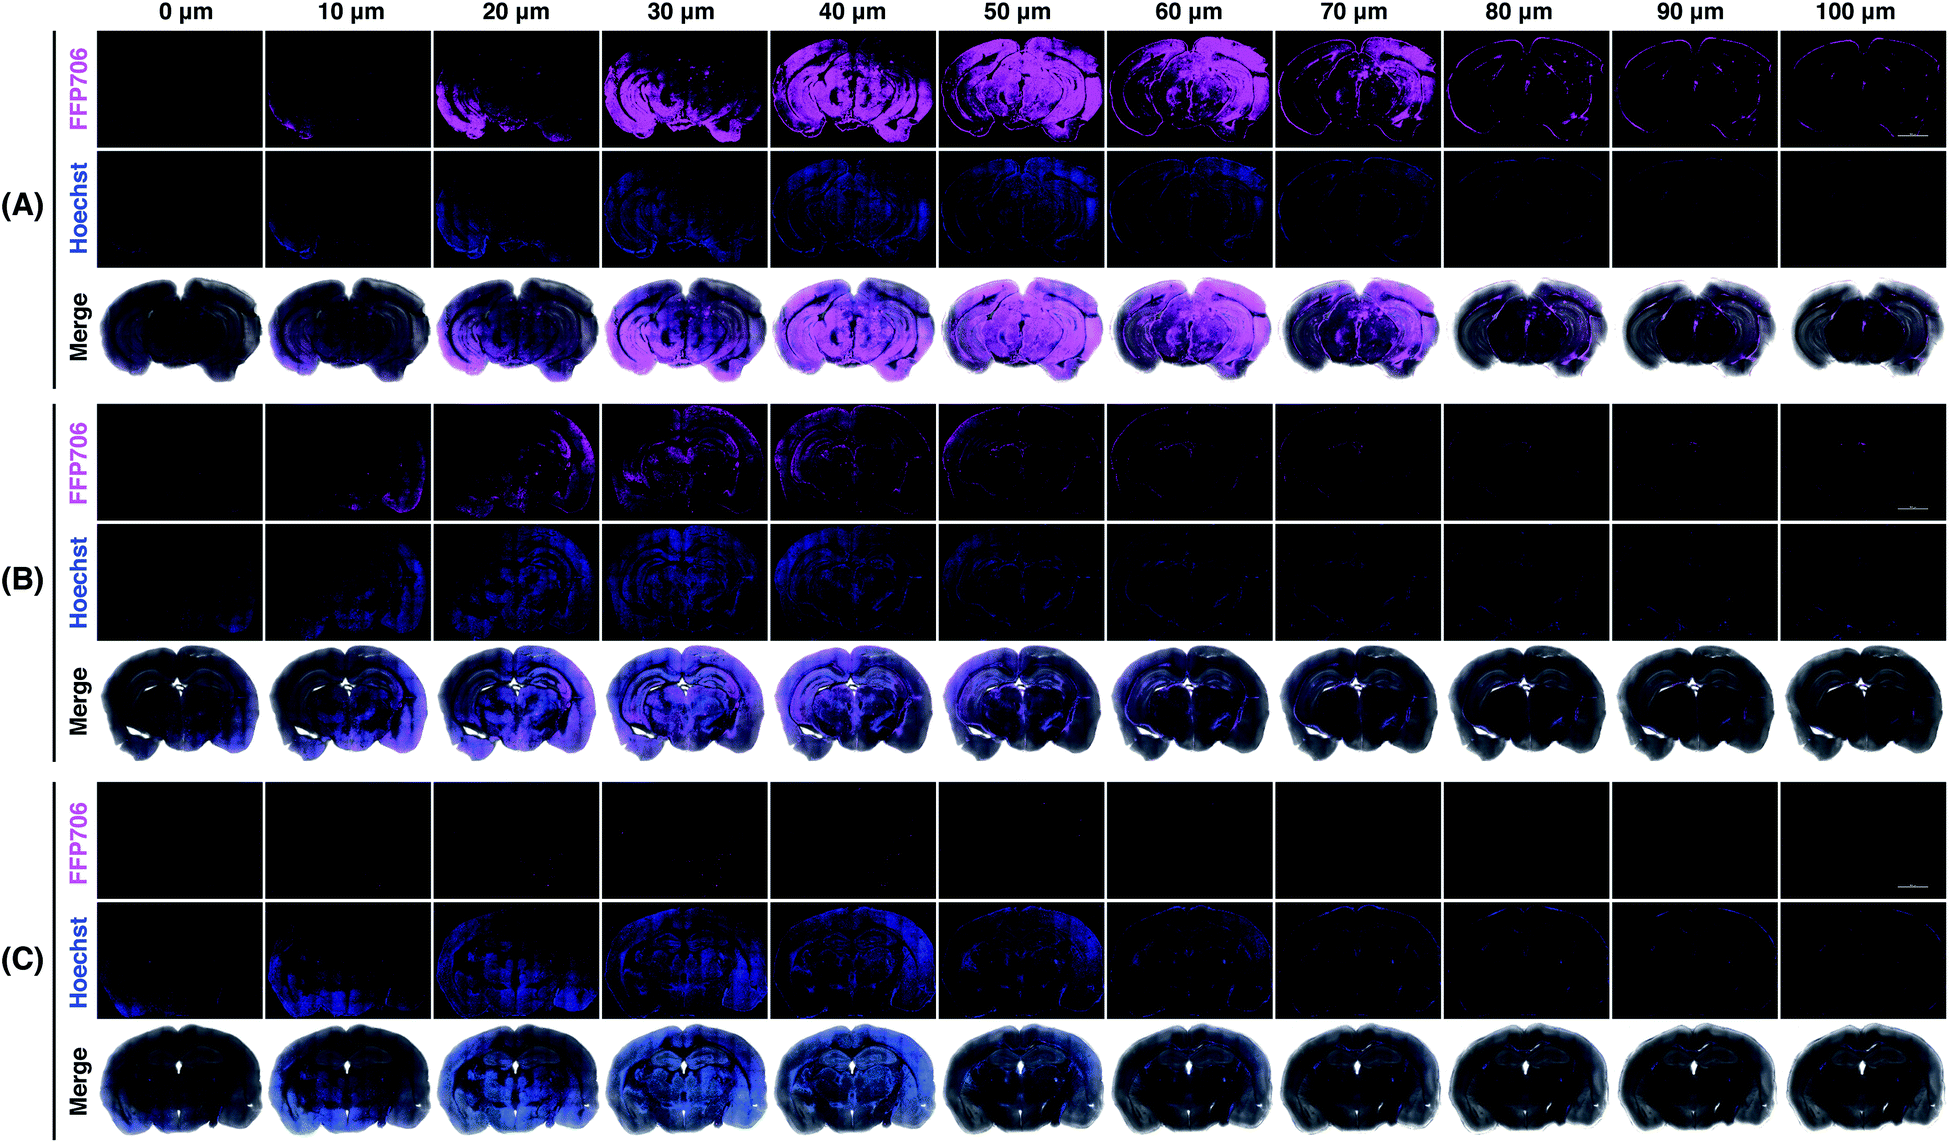
Encouraged by the fluorescence imaging results in live cells, we proceeded to apply the near-infrared probe FFP706 to visualization of endogenous FA in live tissue samples. It has been reported that high steady-state levels of FA are maintained in the brain under physiological conditions.12d However, direct imaging evidence on endogenously produced FA in the brain is still limited. In this context, fresh brain tissues were isolated from four-month-old C57BL/6J mice (n = 3) and cut into slices on a vibratome. The brain slices were incubated with FFP706 and then monitored by confocal fluorescence imaging. As shown in Fig. 7, brain slices loaded with FFP706 displayed strong near-infrared fluorescence with a depth of up to 80–90 μm. On the other hand, brain slices from the same mouse that were pretreated with NaHSO3 before probe loading exhibited significantly lower fluorescence, confirming that the fluorescence observed in FFP706-loaded slices was attributed to endogenously maintained FA. Moreover, no fluorescence was observed in slices that were only treated with NaHSO3 but not loaded with FFP706. These results thus provide direct visualization evidence on endogenously maintained FA in the mouse brain, and also suggest that FFP706 is well-suited for fluorescence imaging of endogenous FA in live tissue samples.
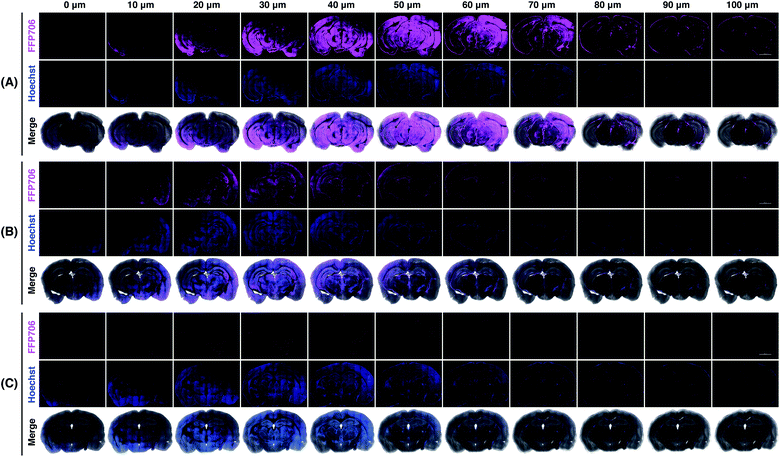 |
| | Fig. 7 Confocal fluorescence imaging of endogenous FA with FFP706 in mouse brains. (A) Mouse brain specimens were sliced into 400 μm thick sections and the slices were incubated with FFP706 (2 μM) for 60 min before imaging. (B) Mouse brain slices were pre-treated with NaHSO3 (400 μM) for 30 min and incubated with FFP706 (2 μM) for 60 min before imaging. (C) Mouse brain slices were treated with NaHSO3 (400 μM) for 90 min before imaging. Nuclei were stained with Hoechst 33342. Scale bar represents 2 mm. Labels above the images from 0–100 μm indicate scanning depths of the brain tissue slices. | |
In vivo fluorescence imaging of FA in living mice
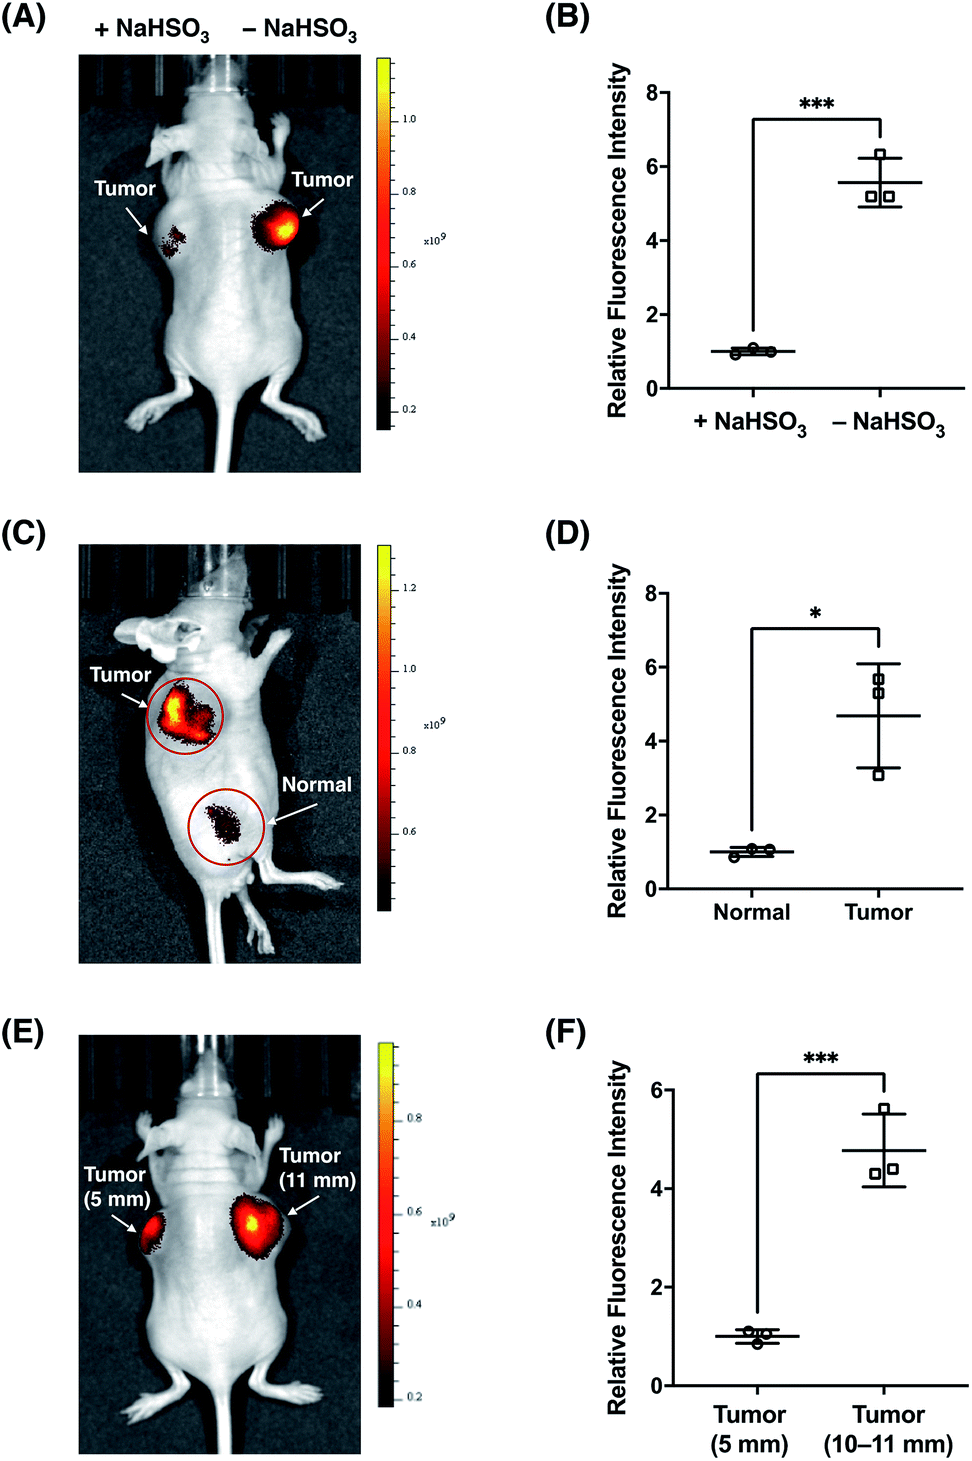
Finally, we sought to investigate the suitability of FFP706 as a near-infrared fluorescent probe for imaging FA in vivo. Elevated FA levels have been implicated in certain cancers, such as breast and lung cancers. In this regard, we employed a breast cancer mouse model in which tumors were grown in the living mice via subcutaneous implantation of MDA-MB-231 breast cancer cells. After injection of FFP706 (20 μM) in saline into the tumor region, the fluorescence emission was collected at 720 nm upon excitation at 675 nm. Kinetic monitoring of the fluorescence demonstrated that the near-infrared fluorescence signals in the tumor region increased gradually over time, with about 10 min to reach the plateau (Fig. S29, ESI†). The fast in vivo kinetics may be due to high local concentrations of FA and the probe that was directly injected into the tumor region, as also noted in intratumoral drug administration.42 These high locoregional concentrations could accelerate the reaction between the probe and FA. Similarly, a faster in vivo response, relative to in vitro, was previously observed for a nitroreductase fluorescent probe during in vivo fluorescence imaging.43 By contrast, the FFP706 solution in the syringe alongside the mouse showed negligibly low fluorescence over time (Fig. S29, ESI†). A ca. 5 fold fluorescence increase was observed in the tumor region post injection of FFP706 (Fig. 8A and B). To confirm that the fluorescence increase was induced by FA, a solution of NaHSO3 or DMD was injected into the tumor region prior to FFP706 injection. As a result, significantly lower fluorescence signals were observed due to scavenging of FA by NaHSO3 or DMD (Fig. 8A and B, and S30, ESI†). Comparison of FFP706 fluorescence in the tumor region versus normal tissue indicated that endogenous FA was indeed highly accumulated in MDA-MB-231 breast cancer tumors (Fig. 8C and D, and S31, ESI†). We further explored whether the endogenous FA level is related to the tumor size. As shown in Fig. 8E and F, the fluorescence signal was about 5 fold higher in the 45 day tumor (d = 10–11 mm) than that in the 20 day tumor (d = 5 mm), suggesting more FA accumulation in larger tumors (Fig. 8E and F, and S32, ESI†). We attempted to administer FFP706 to MDA-MB-231 tumor-bearing mice via tail-vein injection for tumor imaging, but failed to observe fluorescence signals in the tumor region, probably because of notable FA levels in blood (i.e., about 0.1 mM)12b and lack of tumor-targeting ability of FFP706.
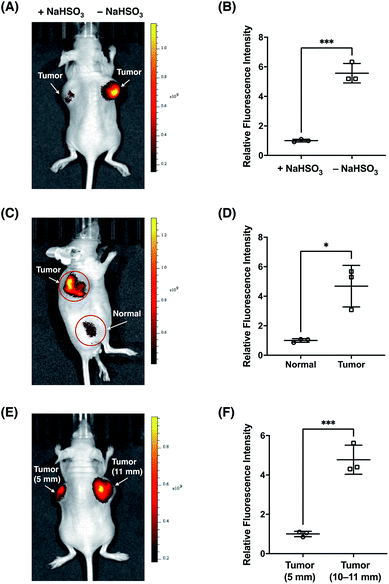 |
| | Fig. 8
In vivo fluorescence imaging of endogenous FA with FFP706 in the MDA-MB-231 breast cancer mouse model. (A) Representative in vivo fluorescence imaging of the MDA-MB-231 tumor-bearing mouse after intratumoral injection of FFP706 in saline (20 μM, 100 μL) with (left-side tumor, d = 11 mm) or without (right-side tumor, d = 11 mm) pre-injection of NaHSO3 (400 μM, 100 μL). (B) Relative fluorescence intensities of FFP706 in the tumor regions with or without pre-injection of NaHSO3 shown in (A). (C) Representative in vivo fluorescence imaging of the tumor region (d = 9 mm) versus normal region in the MDA-MB-231 tumor-bearing mouse after intratumoral injection of FFP706 in saline (20 μM, 100 μL). (D) Relative fluorescence intensities of FFP706 in the tumor regions versus in the normal regions shown in (C). (E) Representative in vivo fluorescence imaging of FA in differently sized MDA-MB-231 tumors (left-side tumor, d = 5 mm; right-side tumor, d = 11 mm) in the tumor mouse model after intratumoral injection of FFP706 in saline (20 μM, 100 μL). (F) Relative fluorescence intensities of FFP706 in differently sized MDA-MB-231 tumors shown in (E). The fluorescence signal was collected at an emission wavelength of 720 ± 10 nm upon excitation with a 675 nm laser. Quantification data in (B, D, and F) are shown as mean relative fluorescence intensity ± standard deviation (n = 3 independent MDA-MB-231 tumor-bearing mice). Statistical analysis for multiple comparison was performed using Student's t-test. *p < 0.05, ***p < 0.001. | |
We also applied FFP706 to in vivo fluorescence imaging of endogenous FA in living mice under physiological conditions. To this end, living mice were intravenously injected with FFP706 in saline and imaged with near-infrared fluorescence. As shown in Fig. S33,† strong and time-dependent fluorescence signals were observed in the mice that were only given FFP706. By contrast, intravenous injection of NaHSO3 before FFP706 resulted in weaker fluorescence signals in the living mice, due to scavenging of endogenous FA by NaHSO3in vivo.
Together, these data demonstrate that FA is indeed endogenously produced and maintained at high levels over the progression of breast tumors. Moreover, our study also suggests that the near-infrared probe FFP706 represents a powerful tool for direct visualization of endogenous FA in live animals through fluorescence imaging.
Conclusions
In summary, we present a systematic investigation of the aza-Cope reaction between homoallylamine and FA, identification of the optimal N-p-methoxybenzyl homoallylamine moiety for reaction with FA, and its application in general construction of a set of fluorescent probes for imaging FA in live cells, tissues, and animals. We initially examined a series of N-substituted homoallylamine-based coumarin probes by comparing their fluorescence responses to FA and found that N-p-methoxybenzyl homoallylamine afforded the most efficient aza-Cope reactivity to FA. Further comparison with previously reported gem-dimethyl aza-Cope reactive structures revealed that newly identified N-p-methoxybenzyl homoallylamine provided a greater fluorescence enhancement and a faster response rate toward FA. Theoretical calculations on the reaction of N-substituted homoallylamine with FA suggested that the fluorescence increases of coumarin probes to FA were mainly determined by the condensation reaction step, rather than the following aza-Cope rearrangement. By incorporating the optimal N-p-methoxybenzyl homoallylamine moiety into a series of fluorophore scaffolds via a self-immolative β-elimination linker, a total of five new fluorescent probes, i.e., FFP445, FFP511, FFP551, FFP585, and FFP706, were convergently developed. This probe series exhibits different excitation and emission wavelengths that span the visible and near-infrared spectral regions and has been thoroughly characterized for sensitive and selective fluorescence turn-on detection of FA in chemical systems, and for fluorescence imaging of physiologically relevant FA levels in live cells. Among them, FFP706 shows desirable fluorescence enhancement to FA and a near-infrared excitation/emission profile, and is therefore favorable for imaging of FA in living systems. Using FFP706, we have directly detected the endogenously produced FA in live breast cancer cells. In addition, FFP706 allows fluorescence imaging of steady-state endogenous FA in live mouse brain tissues. More importantly, we demonstrate that FFP706 is capable of imaging endogenous FA in live animals and enables direct visualization of endogenous FA in a mouse model of breast cancer, providing new insights into FA production during tumor progression. Compared with the previously reported FA fluorescent probes (Table S2, ESI†), the series of probes presented in this work show some advantages such as modular design, low detection limits, great fluorescence enhancement, high selectivity, excellent water-solubility, near-infrared fluorescence longer than 700 nm, and broad biological applicability in living cells, tissues, and mice. Overall, the optimal aza-Cope reaction moiety and new FA fluorescent probes, especially near-infrared FFP706, should greatly facilitate FA probe development and biological studies on FA physiology and pathology in various contexts of living systems.
Data availability
Primary data for probe synthesis, characterization, photophysical measurements, and fluorescence imaging, as well as atomic coordinates and electronic energy calculations, are provided in the ESI.†
Author contributions
Y. Du synthesized fluorescent probes and performed the photophysical characterization. Y. Zhang performed the fluorescence imaging experiments. M. Huang performed the theoretical calculations. S. Wang assisted in synthesis of coumarin probes and fluorescence imaging in live animals. J. Wang provided live tissue samples and assisted in fluorescence imaging in live tissues. K. Liao provided key intermediates in synthesis of probes. X. Wu participated in fluorescence imaging in live animals. Q. Zhou supervised the fluorescence imaging experiments in live tissues. X. Zhang and Y.-D. Wu designed and supervised the theoretical calculations. T. Peng conceived and supervised the project, and wrote the manuscript with input from all authors.
Conflicts of interest
There are no conflicts to declare.
Acknowledgements
This study was performed in strict accordance with guidelines in the Guide for the Care and Use of Laboratory Animals (Eighth Edition, National Research Council, 2011, Washington, DC: The National Academies Press) and was approved by the Institutional Animal Care and Use Committee of Peking University Shenzhen Graduate School (Shenzhen, China). We thank Peng lab members for helpful discussion, Dr Xibao Zhao at Shenzhen University and the Laboratory Animal Center at Peking University Shenzhen Graduate School for animal experiments. T. P. acknowledges support from the National Natural Science Foundation of China (21602009) and Shenzhen Science and Technology Innovation Committee (GXWD20201231165807007-20200814103057002). This work was also supported by Shenzhen-Hong Kong Institute of Brain Science-Shenzhen Fundamental Research Institutions (2019SHIBS0004).
Notes and references
-
R. Liteplo, R. Beauchamp, M. Meek and R. Chenier, Formaldehyde (Concise International Chemical Assessment Documents), World Health Organization, Geneva, 2002 Search PubMed
 .
.
- T. Salthammer, S. Mentese and R. Marutzky, Chem. Rev., 2010, 110, 2536–2572 CrossRef CAS PubMed .
-
(a) K. Huba, Mini-Rev. Med. Chem., 2003, 3, 175–192 CrossRef PubMed ;
(b) K. Tulpule and R. Dringen, J. Neurochem., 2013, 127, 7–21 CrossRef CAS PubMed .
- F. Forneris, E. Battaglioli, A. Mattevi and C. Binda, FEBS J., 2009, 276, 4304–4312 CrossRef CAS PubMed .
- Y.-I. Tsukada, J. Fang, H. Erdjument-Bromage, M. E. Warren, C. H. Borchers, P. Tempst and Y. Zhang, Nature, 2006, 439, 811–816 CrossRef CAS PubMed .
-
(a) G. Jia, Y. Fu, X. Zhao, Q. Dai, G. Zheng, Y. Yang, C. Yi, T. Lindahl, T. Pan, Y.-G. Yang and C. He, Nat. Chem. Biol., 2011, 7, 885–887 CrossRef CAS PubMed ;
(b) G. Zheng, J. A. Dahl, Y. Niu, P. Fedorcsak, C.-M. Huang, C. J. Li, C. B. Vågbø, Y. Shi, W.-L. Wang, S.-H. Song, Z. Lu, R. P. G. Bosmans, Q. Dai, Y.-J. Hao, X. Yang, W.-M. Zhao, W.-M. Tong, X.-J. Wang, F. Bogdan, K. Furu, Y. Fu, G. Jia, X. Zhao, J. Liu, H. E. Krokan, A. Klungland, Y.-G. Yang and C. He, Mol. Cell, 2013, 49, 18–29 CrossRef CAS PubMed ;
(c) C. Feng, Y. Liu, G. Wang, Z. Deng, Q. Zhang, W. Wu, Y. Tong, C. Cheng and Z. Chen, J. Biol. Chem., 2014, 289, 11571–11583 CrossRef CAS PubMed .
- J. O'Sullivan, M. Unzeta, J. Healy, M. I. O'Sullivan, G. Davey and K. F. Tipton, Neurotoxicology, 2004, 25, 303–315 CrossRef .
- T. Tralau, P. Lafite, C. Levy, J. P. Combe, N. S. Scrutton and D. Leys, J. Biol. Chem., 2009, 284, 17826–17834 CrossRef CAS PubMed .
- G. Burgos-Barragan, N. Wit, J. Meiser, F. A. Dingler, M. Pietzke, L. Mulderrig, L. B. Pontel, I. V. Rosado, T. F. Brewer, R. L. Cordell, P. S. Monks, C. J. Chang, A. Vazquez and K. J. Patel, Nature, 2017, 548, 549–554 CrossRef CAS PubMed .
- C. Harris, S.-W. Wang, J. J. Lauchu and J. M. Hansen, Reprod. Toxicol., 2003, 17, 349–357 CrossRef CAS PubMed .
-
(a) S. Teng, K. Beard, J. Pourahmad, M. Moridani, E. Easson, R. Poon and P. J. O'Brien, Chem.-Biol. Interact., 2001, 130–132, 285–296 CrossRef CAS PubMed ;
(b) S. L. MacAllister, J. Choi, L. Dedina and P. J. O'Brien, Chem.-Biol. Interact., 2011, 191, 308–314 CrossRef CAS PubMed .
-
(a) H. d. A. Heck, M. Casanova-Schmitz, P. B. Dodd, E. N. Schachter, T. J. Witek and T. Tosun, Am. Ind. Hyg. Assoc. J., 1985, 46, 1–3 CrossRef CAS PubMed ;
(b) H. D. A. Heck and M. Casanova, Regul. Toxicol. Pharmacol., 2004, 40, 92–106 CrossRef CAS PubMed ;
(c) M. E. Andersen, H. J. Clewell III, E. Bermudez, D. E. Dodd, G. A. Willson, J. L. Campbell and R. S. Thomas, Toxicol. Sci., 2010, 118, 716–731 CrossRef CAS PubMed ;
(d) Z. Tong, C. Han, W. Luo, X. Wang, H. Li, H. Luo, J. Zhou, J. Qi and R. He, Age, 2013, 35, 583–596 CrossRef PubMed .
-
J. T. Fox and P. J. Stover, in Vitam. Horm., Academic Press, 2008, vol. 79, pp. 1–44 Search PubMed .
-
(a) R. Baan, Y. Grosse, K. Straif, B. Secretan, F. El Ghissassi, V. Bouvard, L. Benbrahim-Tallaa, N. Guha, C. Freeman, L. Galichet and V. Cogliano, Lancet Oncol., 2009, 10, 1143–1144 CrossRef PubMed ;
(b) S. Hayami, J. D. Kelly, H.-S. Cho, M. Yoshimatsu, M. Unoki, T. Tsunoda, H. I. Field, D. E. Neal, H. Yamaue, B. A. J. Ponder, Y. Nakamura and R. Hamamoto, Int. J. Cancer, 2011, 128, 574–586 CrossRef CAS PubMed ;
(c) L. B. Pontel, I. V. Rosado, G. Burgos-Barragan, J. I. Garaycoechea, R. Yu, M. J. Arends, G. Chandrasekaran, V. Broecker, W. Wei, L. Liu, J. A. Swenberg, G. P. Crossan and K. J. Patel, Mol. Cell, 2015, 60, 177–188 CrossRef CAS PubMed ;
(d) X. Shen, R. Wang, M. J. Kim, Q. Hu, C.-C. Hsu, J. Yao, N. Klages-Mundt, Y. Tian, E. Lynn, T. F. Brewer, Y. Zhang, B. Arun, B. Gan, M. Andreeff, S. Takeda, J. Chen, J.-i. Park, X. Shi, C. J. Chang, S. Y. Jung, J. Qin and L. Li, Mol. Cell, 2020, 80, 1013–1024 CrossRef CAS PubMed .
-
(a)
J. Miao and R. He, in Neurodegeneration, ed. L. M. Martins and S. H. Y. Loh, InTech, Rijeka, 2012, pp. 59–76 Search PubMed ;
(b) F. Wang, D. Chen, P. Wu, C. Klein and C. Jin, Chem. Res. Toxicol., 2019, 32, 820–830 Search PubMed .
- G. Ucar, E. Topaloglu, H. Burak Kandilci and B. Gumusel, Life Sci., 2005, 78, 421–427 CrossRef CAS PubMed .
-
(a) T. Obata, Life Sci., 2006, 79, 417–422 CrossRef CAS PubMed ;
(b) T. Tan, Y. Zhang, W. Luo, J. Lv, C. Han, J. N. R. Hamlin, H. Luo, H. Li, Y. Wan, X. Yang, W. Song and Z. Tong, FASEB J., 2018, 32, 3669–3679 CrossRef CAS PubMed .
- Z. Tong, W. Luo, Y. Wang, F. Yang, Y. Han, H. Li, H. Luo, B. Duan, T. Xu, Q. Maoying, H. Tan, J. Wang, H. Zhao, F. Liu and Y. Wan, PLoS One, 2010, 5, e10234 CrossRef PubMed .
- Z. Tong, J. Zhang, W. Luo, W. Wang, F. Li, H. Li, H. Luo, J. Lu, J. Zhou, Y. Wan and R. He, Neurobiol. Aging, 2011, 32, 31–41 CrossRef CAS PubMed .
- L. Ai, T. Tan, Y. Tang, J. Yang, D. Cui, R. Wang, A. Wang, X. Fei, Y. Di, X. Wang, Y. Yu, S. Zhao, W. Wang, S. Bai, X. Yang, R. He, W. Lin, H. Han, X. Cai and Z. Tong, Commun. Biol., 2019, 2, 446 CrossRef CAS PubMed .
-
(a) Z. Xu, J. Chen, L.-L. Hu, Y. Tan, S.-H. Liu and J. Yin, Chin. Chem. Lett., 2017, 28, 1935–1942 CrossRef CAS ;
(b) K. J. Bruemmer, T. F. Brewer and C. J. Chang, Curr. Opin. Chem. Biol., 2017, 39, 17–23 CrossRef CAS PubMed ;
(c) J. Ohata, K. J. Bruemmer and C. J. Chang, Acc. Chem. Res., 2019, 52, 2841–2848 CrossRef CAS PubMed ;
(d) Y. Tang, Y. Ma, J. Yin and W. Lin, Chem. Soc. Rev., 2019, 48, 4036–4048 RSC ;
(e) K. J. Bruemmer, S. W. M. Crossley and C. J. Chang, Angew. Chem., Int. Ed., 2020, 59, 13734–13762 CrossRef CAS PubMed ;
(f) X. Liu, N. Li, M. Li, H. Chen, N. Zhang, Y. Wang and K. Zheng, Coord. Chem. Rev., 2020, 404, 213109 CrossRef CAS .
-
(a) T. F. Brewer and C. J. Chang, J. Am. Chem. Soc., 2015, 137, 10886–10889 CrossRef CAS PubMed ;
(b) A. Roth, H. Li, C. Anorma and J. Chan, J. Am. Chem. Soc., 2015, 137, 10890–10893 CrossRef CAS PubMed ;
(c) K. J. Bruemmer, R. R. Walvoord, T. F. Brewer, G. Burgos-Barragan, N. Wit, L. B. Pontel, K. J. Patel and C. J. Chang, J. Am. Chem. Soc., 2017, 139, 5338–5350 CrossRef CAS PubMed .
-
(a) Y. Tang, X. Kong, A. Xu, B. Dong and W. Lin, Angew. Chem., Int. Ed., 2016, 55, 3356–3359 CrossRef CAS PubMed ;
(b) Y. H. Lee, Y. Tang, P. Verwilst, W. Lin and J. S. Kim, Chem. Commun., 2016, 52, 11247–11250 RSC ;
(c) Y. Tang, X. Kong, Z.-R. Liu, A. Xu and W. Lin, Anal. Chem., 2016, 88, 9359–9363 CrossRef CAS PubMed ;
(d) F. Wu, Y. Zhang, L. Huang, D. Xu and H. Wang, Anal. Methods, 2017, 9, 5472–5477 RSC ;
(e) X.-G. Liang, B. Chen, L.-X. Shao, J. Cheng, M.-Z. Huang, Y. Chen, Y.-Z. Hu, Y.-F. Han, F. Han and X. Li, Theranostics, 2017, 7, 2305–2313 CrossRef CAS PubMed ;
(f) Y. Tang, Y. Ma, A. Xu, G. Xu and W. Lin, Methods Appl. Fluoresc., 2017, 5, 024005 CrossRef PubMed ;
(g) B. Han, J. Sun, K. Chen, Z. Chen, M. Huang, Z. Gao and X. Hou, Tetrahedron, 2018, 74, 7193–7197 CrossRef CAS ;
(h) A. Xu, Y. Tang and W. Lin, New J. Chem., 2018, 42, 8325–8329 RSC ;
(i) X.-G. Liang, J. Cheng, S. Qin, L.-X. Shao, M.-Z. Huang, G. Wang, Y. Han, F. Han and X. Li, Chem. Commun., 2018, 54, 12010–12013 RSC ;
(j) H.-W. Chen, H. Li and Q.-H. Song, ACS Omega, 2018, 3, 18189–18195 CrossRef CAS ;
(k) F. Xin, Y. Tian, J. Jing and X. Zhang, Anal. Methods, 2019, 11, 2969–2975 RSC ;
(l) F. Xin, Y. Tian, C. Gao, B. Guo, Y. Wu, J. Zhao, J. Jing and X. Zhang, Analyst, 2019, 144, 2297–2303 RSC ;
(m) H.-R. Cheng, L.-W. Zou, L. Yang, Z.-G. Wang and X.-J. Lu, ChemistrySelect, 2019, 4, 432–436 CrossRef CAS ;
(n) W. Chen, M. Yang, N. Luo, F. Wang, R.-Q. Yu and J.-H. Jiang, Analyst, 2019, 144, 6922–6927 RSC ;
(o) W. Yuan, X. zhong, Q. Han, Y. Jiang, J. Shen and B. Wang, J. Photochem. Photobiol., A, 2020, 400, 112701 CrossRef CAS ;
(p) Z. Ma, J. Li, K. Lin, M. Ramachandran, M. Li and Y. Li, Anal. Chem., 2020, 92, 12282–12289 CrossRef CAS PubMed ;
(q) H. Ding, G. Yuan, L. Peng, L. Zhou and Q. Lin, J. Agric. Food Chem., 2020, 68, 3670–3677 CrossRef CAS PubMed ;
(r) Y. Cao, Z. Teng, J. Zhang, T. Cao, J. Qian, J. Wang, W. Qin and H. Guo, Sens. Actuators, B, 2020, 320, 128354 CrossRef CAS ;
(s) L. Jiang, Q. Hu, T. Chen, D. Min, H.-Q. Yuan and G.-M. Bao, Spectrochim. Acta, Part A, 2020, 228, 117789 CrossRef CAS PubMed ;
(t) L. Zhou, J. Cui, Z. Yu, D. Zou, W. Zhang and J. Qian, Sens. Actuators, B, 2021, 332, 129494 CrossRef CAS ;
(u) A. Nasirian, A. F. Tikum, M. M. Fortibui, S. Lee and J. Kim, Dyes Pigm., 2021, 188, 109156 CrossRef CAS ;
(v) H. Xu, H. Xu, S. Ma, X. Chen, L. Huang, J. Chen, F. Gao, R. Wang, K. Lou and W. Wang, J. Am. Chem. Soc., 2018, 140, 16408–16412 CrossRef CAS PubMed ;
(w) W. Chen, J. Han, X. Wang, X. Liu, F. Liu, F. Wang, R.-Q. Yu and J.-H. Jiang, ACS Omega, 2018, 3, 14417–14422 CrossRef CAS PubMed ;
(x) Y. Wu, Z. Zheng, J. Wen, H. Li, S. Sun and Y. Xu, Sens. Actuators, B, 2018, 260, 937–944 CrossRef CAS ;
(y) X. Song, X. Han, F. Yu, J. Zhang, L. Chen and C. Lv, Analyst, 2018, 143, 429–439 RSC ;
(z) L. He, X. Yang, M. Ren, X. Kong, Y. Liu and W. Lin, Chem. Commun., 2016, 52, 9582–9585 RSC ;
(a
a) C. Liu, X. Jiao, S. He, L. Zhao and X. Zeng, Dyes Pigm., 2017, 138, 23–29 CrossRef CAS ;
(a
b) T. Cao, D. Gong, S.-C. Han, A. Iqbal, J. Qian, W. Liu, W. Qin and H. Guo, Talanta, 2018, 189, 274–280 CrossRef CAS PubMed ;
(a
c) S. Cai, C. Liu, X. Jiao, L. Zhao and X. Zeng, Tetrahedron, 2020, 76, 131617 CrossRef CAS ;
(a
d) S. Cai, C. Liu, J. Gong, S. He, L. Zhao and X. Zeng, Spectrochim. Acta, Part A, 2021, 245, 118949 CrossRef CAS PubMed ;
(a
e) J. Cheng, Y. Ren, Y. Huang, X. Li, M. Huang, F. Han, X. Liang and X. Li, Anal. Chem., 2020, 92, 1409–1415 CrossRef CAS PubMed ;
(a
f) P. Li, D. Zhang, Y. Zhang, W. Lu, W. Wang and T. Chen, ACS Sens., 2018, 3, 2394–2401 CrossRef CAS PubMed ;
(a
g) K. Wechakorn, S. Supalang and S. Suanpai, Tetrahedron, 2020, 76, 131411 CrossRef CAS ;
(a
h) Y. Tang, Y. Zhao and W. Lin, Nat. Protoc., 2020, 15, 3499–3526 CrossRef CAS PubMed .
-
(a) L. He, X. Yang, Y. Liu, X. Kong and W. Lin, Chem. Commun., 2016, 52, 4029–4032 RSC ;
(b) J. Xu, Y. Zhang, L. Zeng, J. Liu, J. M. Kinsella and R. Sheng, Talanta, 2016, 160, 645–652 CrossRef CAS PubMed ;
(c) J.-B. Li, Q.-Q. Wang, L. Yuan, Y.-X. Wu, X.-X. Hu, X.-B. Zhang and W. Tan, Analyst, 2016, 141, 3395–3402 RSC ;
(d) Z. Xie, J. Ge, H. Zhang, T. Bai, S. He, J. Ling, H. Sun and Q. Zhu, Sens. Actuators, B, 2017, 241, 1050–1056 CrossRef CAS ;
(e) Z. Li, Y. Xu, H. Zhu and Y. Qian, Chem. Sci., 2017, 8, 5616–5621 RSC ;
(f) S. Singha, Y. W. Jun, J. Bae and K. H. Ahn, Anal. Chem., 2017, 89, 3724–3731 CrossRef CAS PubMed ;
(g) X. Xie, F. Tang, X. Shangguan, S. Che, J. Niu, Y. Xiao, X. Wang and B. Tang, Chem. Commun., 2017, 53, 6520–6523 RSC ;
(h) T. F. Brewer, G. Burgos-Barragan, N. Wit, K. J. Patel and C. J. Chang, Chem. Sci., 2017, 8, 4073–4081 RSC ;
(i) K. Dou, G. Chen, F. Yu, Y. Liu, L. Chen, Z. Cao, T. Chen, Y. Li and J. You, Chem. Sci., 2017, 8, 7851–7861 RSC ;
(j) T. Gao, X. Cao, A. Bi, J. Dong, S. Huang, X. Huang, S. Wen and W. Zeng, Sens. Actuators, B, 2018, 273, 1139–1145 CrossRef CAS ;
(k) M. Yang, J. Fan, J. Du, S. Long, J. Wang and X. Peng, Front. Chem., 2018, 6, 488 CrossRef CAS PubMed ;
(l) X. Yang, L. He, K. Xu, Y. Yang and W. Lin, New J. Chem., 2018, 42, 12361–12364 RSC ;
(m) H. Yang, G. Fang, M. Guo, P. Ning, Y. Feng, H. Yu and X. Meng, Sens. Actuators, B, 2018, 270, 318–326 CrossRef CAS ;
(n) X. Yang, L. He, K. Xu, Y. Yang and W. Lin, Anal. Methods, 2018, 10, 2963–2967 RSC ;
(o) D. Zhang, D. Liu, M. Li, Y. Yang, Y. Wang, H. Yin, J. Liu, B. Jia and X. Wu, Anal. Chim. Acta, 2018, 1033, 180–184 CrossRef CAS PubMed ;
(p) Z. Xie, B. Yin, J. Shen, D. Hong, L. Zhu, J. Ge and Q. Zhu, Org. Biomol. Chem., 2018, 16, 4628–4632 RSC ;
(q) Y. Zhou, J. Yan, N. Zhang, D. Li, S. Xiao and K. Zheng, Sens. Actuators, B, 2018, 258, 156–162 CrossRef CAS ;
(r) X. Zhao, C. Ji, L. Ma, Z. Wu, W. Cheng and M. Yin, ACS Sens., 2018, 3, 2112–2117 CrossRef CAS PubMed ;
(s) M. Li, X. Kong, B. Dong, N. Zhang, W. Song, Y. Lu and W. Lin, New J. Chem., 2019, 43, 11844–11850 RSC ;
(t) Y. Wang, Y. Chen, Y. Huang, Q. Zhang, Y. Zhang, J. Li and C. Jia, Anal. Methods, 2019, 11, 2311–2319 RSC ;
(u) C. Ji, L. Ma, H. Chen, Y. Cai, X. Zhao and M. Yin, ACS Appl. Bio Mater., 2019, 2, 555–561 CrossRef CAS ;
(v) J. Chen, C. Shao, X. Wang, J. Gu, H.-L. Zhu and Y. Qian, Chem. Commun., 2020, 56, 3871–3874 RSC ;
(w) Y. Hao, Y. Zhang, A. Zhang, Q. Sun, J. Zhu, P. Qu, S. Chen and M. Xu, Spectrochim. Acta, Part A, 2020, 229, 117988 CrossRef CAS PubMed .
-
(a) K. J. Bruemmer, O. Green, T. A. Su, D. Shabat and C. J. Chang, Angew. Chem., Int. Ed., 2018, 57, 7508–7512 CrossRef CAS PubMed ;
(b) C. Liu, R. Zhang, W. Zhang, J. Liu, Y.-L. Wang, Z. Du, B. Song, Z. P. Xu and J. Yuan, J. Am. Chem. Soc., 2019, 141, 8462–8472 CrossRef CAS PubMed .
- Y. Zhang, Y. Du, M. Li, D. Zhang, Z. Xiang and T. Peng, Angew. Chem., Int. Ed., 2020, 59, 16352–16356 CrossRef CAS PubMed .
- M. E. Jung and G. Piizzi, Chem. Rev., 2005, 105, 1735–1766 CrossRef CAS PubMed .
-
(a) R. P. Lutz, Chem. Rev., 1984, 84, 205–247 CrossRef CAS ;
(b) L. E. Overman, Acc. Chem. Res., 1992, 25, 352–359 CrossRef CAS .
-
(a) S. Minegishi and H. Mayr, J. Am. Chem. Soc., 2003, 125, 286–295 CrossRef CAS PubMed ;
(b) F. Brotzel, Y. C. Chu and H. Mayr, J. Org. Chem., 2007, 72, 3679–3688 CrossRef CAS PubMed .
-
(a) T. Miura, Y. Urano, K. Tanaka, T. Nagano, K. Ohkubo and S. Fukuzumi, J. Am. Chem. Soc., 2003, 125, 8666–8671 CrossRef CAS PubMed ;
(b) H. Sunahara, Y. Urano, H. Kojima and T. Nagano, J. Am. Chem. Soc., 2007, 129, 5597–5604 CrossRef CAS PubMed .
-
(a) A. Dirksen, T. M. Hackeng and P. E. Dawson, Angew. Chem., Int. Ed., 2006, 45, 7581–7584 CrossRef CAS PubMed ;
(b) D. K. Kölmel and E. T. Kool, Chem. Rev., 2017, 117, 10358–10376 CrossRef PubMed ;
(c) C. Godoy-Alcántar, A. K. Yatsimirsky and J.-M. Lehn, J. Phys. Org. Chem., 2005, 18, 979–985 CrossRef .
- J. Fan, M. Hu, P. Zhan and X. Peng, Chem. Soc. Rev., 2013, 42, 29–43 RSC .
-
M. J. Frisch, G. W. Trucks, H. B. Schlegel, G. E. Scuseria, M. A. Robb, J. R. Cheeseman, G. Scalmani, V. Barone, B. Mennucci, G. A. Petersson, H. Nakatsuji, M. Caricato, X. Li, H. P. Hratchian, A. F. Izmaylov, J. Bloino, G. Zheng, J. L. Sonnenberg, M. Hada, M. Ehara, K. Toyota, R. Fukuda, J. Hasegawa, M. Ishida, T. Nakajima, Y. Honda, O. Kitao, H. Nakai, T. Vreven, J. A. Montgomery Jr, J. E. Peralta, F. Ogliaro, M. Bearpark, J. J. Heyd, E. Brothers, K. N. Kudin, V. N. Staroverov, T. Keith, R. Kobayashi, J. Normand, K. Raghavachari, A. Rendell, J. C. Burant, S. S. Iyengar, J. Tomasi, M. Cossi, N. Rega, J. M. Millam, M. Klene, J. E. Knox, J. B. Cross, V. Bakken, C. Adamo, J. Jaramillo, R. Gomperts, R. E. Stratmann, O. Yazyev, A. J. Austin, R. Cammi, C. Pomelli, J. W. Ochterski, R. L. Martin, K. Morokuma, V. G. Zakrzewski, G. A. Voth, P. Salvador, J. J. Dannenberg, S. Dapprich, A. D. Daniels, O. Farkas, J. B. Foresman, J. V. Ortiz, J. Cioslowski, and D. J. Fox, All calculations were performed with Gaussian 09, Revision D.01, Gaussian, Inc., Wallingford CT, 2013 Search PubMed .
- Y. Urano, M. Kamiya, K. Kanda, T. Ueno, K. Hirose and T. Nagano, J. Am. Chem. Soc., 2005, 127, 4888–4894 CrossRef CAS PubMed .
- S. Izumi, Y. Urano, K. Hanaoka, T. Terai and T. Nagano, J. Am. Chem. Soc., 2009, 131, 10189–10200 CrossRef CAS PubMed .
-
(a) L. Yuan, W. Lin, S. Zhao, W. Gao, B. Chen, L. He and S. Zhu, J. Am. Chem. Soc., 2012, 134, 13510–13523 CrossRef CAS PubMed ;
(b) H. Chen, B. Dong, Y. Tang and W. Lin, Chem.–Eur. J., 2015, 21, 11696–11700 CrossRef CAS PubMed .
-
(a) S. Lim, A. Janzer, A. Becker, A. Zimmer, R. Schüle, R. Buettner and J. Kirfel, Carcinogenesis, 2010, 31, 512–520 CrossRef CAS PubMed ;
(b) J. Liu, F.-Y. Liu, Z.-Q. Tong, Z.-H. Li, W. Chen, W.-H. Luo, H. Li, H.-J. Luo, Y. Tang, J.-M. Tang, J. Cai, F.-F. Liao and Y. Wan, PLoS One, 2013, 8, e58957 CrossRef CAS PubMed .
- G. Stazi, C. Zwergel, S. Valente and A. Mai, Expert Opin. Ther. Pat., 2016, 26, 565–580 CrossRef CAS PubMed .
- M. G. Lee, C. Wynder, D. M. Schmidt, D. G. McCafferty and R. Shiekhattar, Chem. Biol., 2006, 13, 563–567 CrossRef CAS PubMed .
- I. V. Rosado, F. Langevin, G. P. Crossan, M. Takata and K. J. Patel, Nat. Struct. Mol. Biol., 2011, 18, 1432–1434 CrossRef CAS PubMed .
- T. Su, W. C. Monte, X. Hu, Y. He and R. He, Curr. Top. Med. Chem., 2016, 16, 472–484 CrossRef CAS PubMed .
-
(a) E. P. Goldberg, A. R. Hadba, B. A. Almond and J. S. Marotta, J. Pharm. Pharmacol., 2010, 54, 159–180 CrossRef PubMed ;
(b) I. Melero, E. Castanon, M. Alvarez, S. Champiat and A. Marabelle, Nat. Rev. Clin. Oncol., 2021, 18, 558–576 CrossRef CAS PubMed .
- Y. Li, Y. Sun, J. Li, Q. Su, W. Yuan, Y. Dai, C. Han, Q. Wang, W. Feng and F. Li, J. Am. Chem. Soc., 2015, 137, 6407–6416 CrossRef CAS PubMed .
Footnotes |
| † Electronic supplementary information (ESI) available: Supplemental figures, data, and experimental methods. See DOI: 10.1039/d1sc04387k |
| ‡ These authors contributed equally. |
|
| This journal is © The Royal Society of Chemistry 2021 |
Click here to see how this site uses Cookies. View our privacy policy here. 
 Open Access Article
 This Open Access Article is licensed under a Creative Commons Attribution-Non Commercial 3.0 Unported Licence
 a,
Shushu
Wang
a,
Jianzheng
Wang
a,
Kongke
Liao
a,
Xiaojun
Wu
a,
Qiang
Zhou
a,
Xinhao
Zhang
a,
Shushu
Wang
a,
Jianzheng
Wang
a,
Kongke
Liao
a,
Xiaojun
Wu
a,
Qiang
Zhou
a,
Xinhao
Zhang