 Open Access Article
Effects of intervalence charge transfer interaction between π-stacked mixed valent tetrathiafulvalene ligands on the electrical conductivity of 3D metal–organic frameworks†
Shiyu
Zhang
a,
Dillip K.
Panda
a,
Ashok
Yadav
 a,
Wei
Zhou
 b and
Sourav
Saha
 *a
*a
aDepartment of Chemistry, Clemson University, Clemson, South Carolina 29634, USA. E-mail: souravs@clemson.edu
bNIST Center for Neutron Research, National Institute of Standards and Technology, Gaithersburg, Maryland 20899, USA
First published on 20th September 2021
Abstract
Achieving a molecular-level understanding of how the structures and compositions of metal–organic frameworks (MOFs) influence their charge carrier concentration and charge transport mechanism—the two key parameters of electrical conductivity—is essential for the successful development of electrically conducting MOFs, which have recently emerged as one of the most coveted functional materials due to their diverse potential applications in advanced electronics and energy technologies. Herein, we have constructed four new alkali metal (Na, K, Rb, and Cs) frameworks based on an electron-rich tetrathiafulvalene tetracarboxylate (TTFTC) ligand, which formed continuous π-stacks, albeit with different π–π-stacking and S⋯S distances (dπ–π and dS⋯S). These MOFs also contained different amounts of aerobically oxidized TTFTC˙+ radical cations that were quantified by electron spin resonance (ESR) spectroscopy. Density functional theory calculations and diffuse reflectance spectroscopy demonstrated that depending on the π–π-interaction and TTFTC˙+ population, these MOFs enjoyed varying degrees of TTFTC/TTFTC˙+ intervalence charge transfer (IVCT) interactions, which commensurately affected their electronic and optical band gaps and electrical conductivity. Having the shortest dπ–π (3.39 Å) and the largest initial TTFTC˙+ population (∼23%), the oxidized Na-MOF 1-ox displayed the narrowest band gap (1.33 eV) and the highest room temperature electrical conductivity (3.6 × 10⁻⁵ S cm−1), whereas owing to its longest dπ–π (3.68 Å) and a negligible TTFTC˙+ population, neutral Cs-MOF 4 exhibited the widest band gap (2.15 eV) and the lowest electrical conductivity (1.8 × 10⁻⁷ S cm−1). The freshly prepared but not optimally oxidized K-MOF 2 and Rb-MOF 3 initially displayed intermediate band gaps and conductivity, however, upon prolonged aerobic oxidation, which raised the TTFTC˙+ population to saturation levels (∼25 and 10%, respectively), the resulting 2-ox and 3-ox displayed much narrower band gaps (∼1.35 eV) and higher electrical conductivity (6.6 × 10⁻⁵ and 4.7 × 10⁻⁵ S cm−1, respectively). The computational studies indicated that charge movement in these MOFs occurred predominantly through the π-stacked ligands, while the experimental results displayed the combined effects of π–π-interactions, TTFTC˙+ population, and TTFTC/TTFTC˙+ IVCT interaction on their electronic and optical properties, demonstrating that IVCT interactions between the mixed-valent ligands could be exploited as an effective design strategy to develop electrically conducting MOFs.
Introduction
Electrically conducting metal–organic frameworks (MOFs)1–5 have recently emerged as one of the most attractive smart materials because of their diverse functions as supercapacitors,6–8 chemiresistive sensors,9 electrochromic devices,10,11 light-harvesting systems,12–16 electrocatalysts,17 and energy storage systems18–20 that can help advance modern electronics and energy technologies. The electrical conductivity (σ) of MOFs is the product of their charge carrier (i.e., electrons and holes) concentration and charge mobility (i.e., charge transport capability),1,2 which depend on their structures and compositions. Therefore, deciphering how framework structures and compositions influence these two key parameters is vital for the development of electrically conducting MOFs and fine-tuning their conductivity for specific applications. While MOFs can be easily endowed with the charge carriers by introducing redox-active metal ions, ligands, and guests,21–23 promoting charge movement across 3D frameworks often proves to be a much greater challenge and requires a molecular-level understanding of charge transport mechanisms and structure–function relationships. Recent studies have revealed that depending on their structures and compositions, charge movement in MOFs can occur predominantly through one of the following pathways:1–5 (i) through coordination bonds with high covalent character made of soft N- and S-coordinating ligands and transition metal ions that create significant metal–ligand orbital overlap,24–30 (ii) via resonance in π-conjugated ligands,31–39 (iii) through π-stacked aromatic ligands,40–45 and (iv) via redox hopping mechanism.46 In addition, guest mediated framework oxidation and reduction,47–54 node crosslinking,55 and π-donor/acceptor charge transfer interaction56–59 and also lead to a notable increase of framework conductivity.Although effective through-bond charge movement pathways consisting of covalent coordination bonds and π-conjugated ligands are often found in various 2D networks and usually lead to high electrical conductivity,9,17,28,29,37–39 they are not so common and effective in 3D frameworks made of hard carboxylate and other oxo-ligands,24–27,33–36 which do not create sufficient metal–ligand orbital overlap. As a result, the latter often rely on through-space charge movement pathways to display electrical conductivity.1 In this context, Dincă and coworkers have demonstrated that several 3D semiconducting MOFs benefitted from out-of-plane charge movement along closely π-stacked tetrathiafulvalene (TTF)40–42 and hexahydroxy-terphenylene43 ligands, the efficacy of which depended on the π–π-distance between the stacked ligands. We have also shown that π-donor/acceptor stacks made of complementary redox-active ligands and intercalated guests56,57 facilitated through-space charge delocalization, reducing the electronic band gaps and enhancing the electrical conductivity of 3D frameworks. Although intervalence charge transfer (IVCT) interactions between mixed valent redox-active π-systems are responsible for the electrical conductivity of many organic semiconductors and synthetic metals60–62 and similar interactions between mixed valent metal ions have also been exploited to develop electrically conducting MOFs,25–27 mixed-valent ligands34,35 are much less prevalent in MOFs, and the effects of ligand-based IVCT interactions51–53,63,64 on the framework conductivity have yet to be studied systematically. Recently, D'Alessandro et al.49–51 and we53 have demonstrated that π-donor/acceptor IVCT interactions between electron-rich neutral TTF and extended TTF (ExTTF) and partially oxidized (by air or I2) TTF˙+ and ExTTF˙+ radical cations facilitated through-space charge delocalization and thereby enhanced the MOF conductivity. The IVCT interaction between isolated π-donor/acceptor pairs of π-acidic thiazolothiazole (TTZ) ligand and TTZ˙− radical cation has also been observed inside MOFs,63,64 but the impact of this phenomenon on the framework conductivity remains largely unexplored. Therefore, comprehensive structure–property relationship studies are needed to establish this promising charge transport mechanism as a future design strategy for electrically conducting MOFs.
To demonstrate how the structures and compositions of MOFs influence their charge carrier concentration and charge transport capability, which ultimately dictate their electronic and optical band gaps and electrical conductivity, herein, we have constructed four new alkali metal-based MOFs (Na, K, Rb, and Cs) using an electron-rich tetrathiafulvalene tetracarboxylate (TTFTC) ligand.65,66 The single-crystal structures revealed that all four frameworks contained extended π-stacks of TTFTC ligands, but the π–π and S⋯S distances (dπ–π and dS⋯S), the angle between the two adjacent TTF layers, i.e., the degree of π-overlap varied significantly (Table 1). Cyclic voltammetric (CV) analysis shed light on their redox properties and the possibility of aerobic oxidation of TTFTC ligands. Solid-state quantitative electron spin resonance (ESR) spectroscopy confirmed that these MOFs contained different amounts of aerobically generated paramagnetic TTFTC˙+ radical cations, while diffuse reflectance spectroscopy (DRS) revealed intervalence charge transfer (IVCT) interactions between the mixed-valent TTFTC0/˙+ ligands, which commensurately facilitated charge delocalization and thereby dictated their optical band gaps (Eopt) and electrical conductivity (Fig. 1). Density functional theory (DFT) calculations showed that the π–π-distance and π-overlap between the stacked TTFTC ligands in these MOFs influenced their through-space charge transport capability, which in turn dictated their electronic band gap (Eel). In a nutshell, having the shortest π–π-distance and the largest initial TTFTC˙+ population, the oxidized Na-MOF (1-ox) displayed the narrowest band gaps and the highest room temperature electrical conductivity, whereas Cs-MOF 4, which possessed the longest π–π-distance and a negligible TTFTC˙+ population, exhibited the widest band gap and the lowest electrical conductivity (Tables 1 and 2). Equipped with intermediate π–π-stacking distances and mediocre initial TTFTC˙+ populations, freshly prepared K-MOF 2 and Rb-MOF 3 initially displayed intermediate band gaps and electrical conductivity, but upon complete aerobic oxidation, which raised the TTFTC˙+ population to the saturation levels, the resulting 2-ox and 3-ox displayed much narrower band gaps and higher electrical conductivity (Tables 1 and 2). These comprehensive studies systematically demonstrated how the structures and compositions of four new TTFTC-based MOFs influenced their charge transport pathways and consequently, the electronic and optical band gaps and electrical conductivity, delivering a promising design strategy for the development of electrically conducting MOFs involving IVCT interactions between the π-stacked mixed-valent ligands.
| Na-MOF 1-ox | K-MOF 2 | Rb-MOF 3 | Cs-MOF 4 | |
|---|---|---|---|---|
| d π–π (Å) | 3.391 | 3.673 | 3.666 | 3.707 |
| d S⋯S (Å) | 3.729 | 3.791 | 3.820 | 3.774 |
| ∠ between staggered TTF layers | 36° | 65° | 64° | 87° |
| TTF central C–C bond length (Å) | 1.342 | 1.347 | 1.330 | 1.317 |
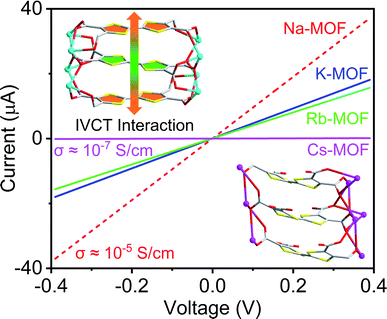 | ||
| Fig. 1 A representation of how π–π-distance, TTFTC˙+ population, and ICVT interactions between the mixed valent TTFTC ligands in MOFs affected their electrical conductivity. | ||
Results and discussions
Syntheses and crystal structures of MOFs
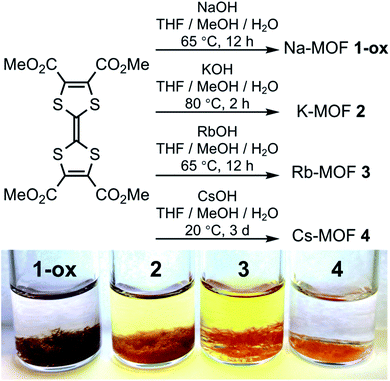
To take advantage of facile aerobic oxidation of electron-rich TTFTC to TTFTC˙+ radical cation and the subsequent TTFTC/TTFTC˙+ IVCT interaction that can promote long-range charge delocalization, herein, we have constructed a family of TTFTC-based MOFs, in which the π–π-distances, the degree of π-overlap, and the amount of TTFTC˙+ radical cations varied systematically, showing a clear trend that commensurately influenced their band gaps and electrical conductivity. Solvothermal reactions between TTFTC–Me4 tetramethyl ester,67 a precursor to TTFTC ligand, and MOH (M = Na, K, Rb, and Cs) in THF/MeOH/H2O mixtures at temperatures below 80 °C yielded needle-shaped crystals of the corresponding 3D MOF (Na-MOF: 1-ox, K-MOF: 2, Rb-MOF: 3, and Cs-MOF: 4) via in situ saponification of the tetra-ester (Scheme 1, see ESI† for details). The structures, compositions, and phase purity of these MOFs were determined by single-crystal and powder X-ray diffraction (SXRD and PXRD) studies, elemental analysis, and vibrational (infrared and Raman) spectroscopies. Although these four MOFs were not strictly isostructural, they all possessed continuous π-stacks of TTFTC ligands with increasing π–π- and S⋯S distances and decreasing TTFTC˙+ population, enabling us to identify their structure–property relationships, which were summarized in Tables 1 and 2. Unlike previously reported66 TTFTC-based MIL-132–135 series where two trans-COOH groups of each ligand remained protonated and contributed to proton conductivity, in our MOFs, all four carboxylate groups were fully deprotonated and involved in the secondary building unit (SBU) formation.The brown-colored as-synthesized Na-MOF ([Na4(TTFTC)(H2O)2]·0.5H2O) crystallized in an orthorhombic Ibam space group with an asymmetric unit containing one Na+ ion, 0.25 TTFTC ligand, 0.5 coordinated and 0.125 guest H2O molecules (Fig. 2a–d and S1†). Its SBU consisted of two different hexacoordinated Na+ ions (violet and cyan polyhedrons in Fig. 2b) bridged by COO− groups that formed [Na2O10]∞ sheets located in the ac-planes. These clusters were linked by perfectly planar TTFTC ligands located in the ab-planes and stacked co-facially along the c-axis (Fig. 2c) with a uniform interplanar distance (dπ–π = 3.39 Å, dS⋯S = 3.73 Å). The perfectly octahedral Na+ ions (violet) situated inside the [Na2O10]∞ chains were coordinated by six carboxylate-O atoms, whereas the distorted octahedral Na+ ions (cyan) located around the framework cavities were coordinated to five carboxylate-O atoms and one H2O molecule. The carboxylate groups of TTFTC had two different coordination patterns: a pair of trans-COO− groups coordinated two Na+ ions in μ2–η1:η1 bridging mode, while the other two trans-COO− groups bound three Na+ ions in μ3–η1:η2 fashion (Fig. 2d). The two consecutive TTF layers inside the π-stacks were slightly staggered, as their long molecular axes formed a 36° angle, the smallest among all four MOFs. The alternating TTF layers were perfectly eclipsed by each other (Fig. S1†). Thus, Na-MOF enjoyed the shortest π–π distances and maximum π-overlap between the TTF layers among the four MOFs (Table 1), presenting the strongest π–π-interaction and the most favorable conditions for out-of-plane charge movement. Notably, all TTFTC ligands of Na-MOF were perfectly planar and had the same central C–C bond length (1.347 Å), which was noticeably longer than that of Cs-MOF (1.317 Å, Table 1). Since the TTF˙+ radical cations are known to have a planar shape due to their aromatic nature and longer central C–C bonds due to partial single-bond character,66,68 the planar geometry and the uniformly long central C–C bonds of all TTFTC ligands in Na-MOF strongly suggested that they all enjoyed the same partial TTFTC˙+ radical cation character, i.e., the charges were fully delocalized throughout the framework, not just on the crystal surfaces, rendering all ligands the same mixed-valent nature. These structural features also suggested that the solvothermal synthesis yielded Na-MOF in its optimally oxidized form (hence called 1-ox) containing charge delocalized TTFTC˙+ radical cations or mixed-valent TTFTC0/˙+ ligands. If the oxidation of TTFTC ligands were limited only to the crystal surface and the resulting TTFTC˙+ radical cations had remained isolated not delocalized, then the neutral and oxidized TTFTC ligands would have displayed different structural characteristics, as found recently in a different TTF-based 2D MOF.68 However, that was not observed in any of our MOFs presented here. The presence of paramagnetic TTFTC˙+ radical cations and the IVCT interaction between mixed-valent TTFTC0/˙+ ligands were further evident from the ESR and DRS data (vide infra). Upon drying and exposure to air, the crystalline brown powder of the resulting Na-MOF did not change the color and appearance. The PXRD patterns of a freshly prepared and a weeks old Na-MOF powders were in excellent agreement with the simulated pattern of as-synthesized Na-MOF (Fig. S2a†), confirming that the framework structure and crystallinity remained largely intact upon drying and aerobic oxidation.
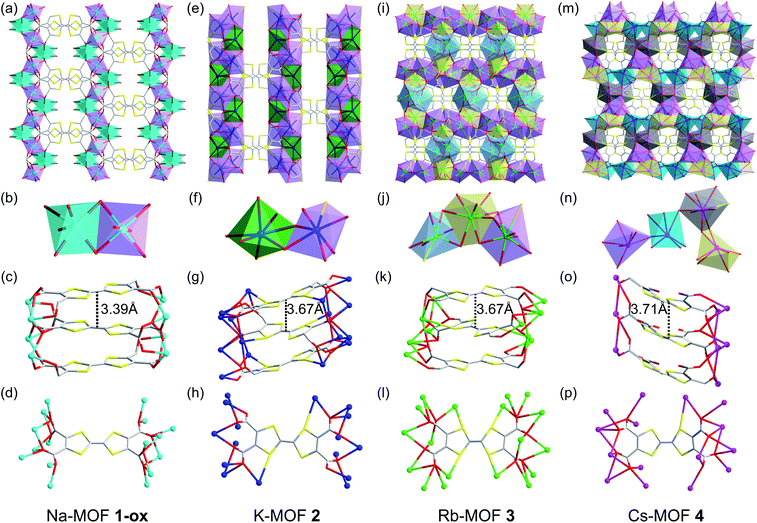 | ||
| Fig. 2 (a–d) Na-MOF (1-ox): (a) the crystal structure viewed along the c-axis, (b) the SBU contains two distinct hexacoordinated Na+ ions bridged by carboxylate groups, (c) the alignment of perfectly planar TTFTC ligands π-stacked along the c-axis, and (d) the coordination pattern of each TTFTC ligand. (e–h) K-MOF (2): (e) the crystal structure viewed along the c-axis, (f) the SBU features two distinct hepta-coordinated K+ ions bridged by the carboxylate groups, (g) the alignment of slightly bent TTFTC ligands π-stacked along the c-axis, and (h) the coordination pattern of each TTFTC ligand. (i–l) Rb-MOF (3): (i) the crystal structure viewed along the c-axis, (j) the SBU contains two octa-coordinated (yellow and violet polyhedrons) and one hepta-coordinated (blue polyhedron) Rb+ ions, (k) the alignment of puckered TTFTC ligands π-stacked along the c-axis, and (l) the coordination pattern of each TTFTC ligand. (m–p) Cs-MOF (4): (m) the crystal structure viewed along the a-axis, (n) the SBU contains four distinct Cs+ ions (cyan, grey, violet, and yellow polyhedrons) bridged by the carboxylate groups, (o) the alignment of boat-shaped TTFTC ligands π-stacked along the b-axis, and (p) the coordination pattern of each TTFTC ligand. C: grey, O: red, S: yellow, Na+: cyan ball, K+: navy blue ball, Rb+: green ball, and Cs+: pink ball. The asymmetric units and additional structural features of all four MOFs are shown in Fig. S1.† | ||
The reddish-orange colored as-synthesized K-MOF 2 ([K4(TTFTC)(H2O)2]·2H2O) crystallized in a monoclinic P21/c space group with an asymmetric unit containing four K+ ions, one TTFTC ligand, two coordinated and two guest H2O molecules (Fig. 2e–h and S1†). The SBU consisted of two different hepta-coordinated K+ ions (green and violet polyhedrons in Fig. 2f), which were bridged by the carboxylate groups forming 2D metal cluster sheets located in the bc-planes. The K+ ions located around the framework cavities (green polyhedrons) were coordinated by five carboxylate-O atoms and two H2O molecules, while those buried inside the metal cluster chains (violet polyhedrons) were attached to five carboxylate-O and one S-atom of TTFTC ligands and one H2O molecule. These clusters were connected by the TTF cores aligned roughly along the a-axis and stacked along the c-axis at a uniform distance (Fig. 2g, dπ–π = 3.67 Å, dS⋯S = 3.79 Å). In addition to all four COO− groups, a pair of trans-S atoms of each TTFTC ligand was also involved in K+ coordination (Fig. 2h). The carboxylate-O atoms of TTFTC ligands had two different coordination modes: those pointing away from the K+-coordinated S-atoms (O4 and O5) bound one K+ ion each, whereas the rest (O1–O3 and O6–O8) had a μ3-bridging mode. The adjacent TTF layers were more staggered in 2, as their long molecular axes formed a 65° angle (Fig. S1†). The alternating TTF cores were perfectly eclipsed by each other. Furthermore, all TTFTC ligands in K-MOF 2 were slightly bent and had uniform central C–C bond length (1.347 Å, Table 1), indicating that they all possessed the same charge or oxidation state. The longer central C–C bond of TTFTC ligands in 2 than in Cs-MOF 4 (Table 1) may be attributed to a partial radical cation character of the ligands and/or the coordination of their two trans-S atoms with K+ ions in the former. Upon drying and exposure to air, the originally reddish-orange crystals of as-synthesized K-MOF 2 quickly turned dark brown to almost black within few days, yielding an optimally oxidized 2-ox, which contained more TTFTC˙+ radical cations than 2, as demonstrated by the quantitative ESR analysis (vide infra). The PXRD profiles of freshly prepared and optimally oxidized 2-ox powders were in good agreement with the simulated pattern of as-synthesized K-MOF (Fig. S2b†), confirming that the framework structure and crystallinity remained largely intact upon drying and aerobic oxidation for several weeks.
The bright orange-colored as-synthesized Rb-MOF 3 ([Rb4(TTFTC)(H2O)3]·H2O) crystallized in an orthorhombic Pbcn space group with an asymmetric unit featuring two Rb+ ions, 0.5 TTFTC ligand, 1.5 coordinated H2O molecules, and 0.5 guest H2O molecule (Fig. 2i–I and S1†). The SBU consisted of three distinct Rb+ ions having different coordination geometries (Fig. 2j)—two octa-coordinated (violet and yellow polyhedrons) and one hepta-coordinated (blue polyhedron)—which were bridged by carboxylate-O atoms forming 2D metal cluster sheets. The hepta-coordinated Rb+ ions were surrounded by the TTF cores and filled the framework pores. Without these Rb+ ions, the overall structure of 3 would closely resemble that of 2. The TTFTC ligands in this framework were also stacked along the c-axis at a uniform interplanar distance (Fig. 2k, dπ–π = 3.67 Å, dS⋯S = 3.82 Å). The adjacent TTF layers were staggered, which formed a 64° angle between their molecular axes, while the alternating TTF layers were perfectly eclipsed. Unlike MOFs 1 and 2, all TTFTC ligands of 3 were highly bent (chair-shaped) and had shorter central C–C bonds (1.330 Å, Fig. S1† and Table 1), indicating that they were practically neutral. This was further confirmed by the ESR spectrum, which showed a negligible TTFTC˙+ signal (vide infra). All four carboxylate groups, as well as all four S-atoms of each TTFTC ligand were coordinated to Rb+ ions (Fig. 2l). Upon drying and longer exposure to air, the crystalline orange powder of Rb-MOF slowly became dark brown to almost black within a week, indicating that some TTFTC ligands in the resulting 3-ox were aerobically oxidized to TTFTC˙+ radical cations and participated in IVCT interaction (vide infra). The PXRD profiles of aerobically oxidized 3-ox powders were in good agreement with the simulated pattern of as-synthesized Rb-MOF crystals (Fig. S2c†), confirming that the framework structure and crystallinity were largely preserved upon drying and aerobic oxidation.
The bright orange-colored as-synthesized Cs-MOF 4 ([Cs4(TTFTC)(H2O)2]) crystallized in an orthorhombic Pna21 space group with an asymmetric unit containing four Cs+ ions, one TTFTC ligand, and two coordinated H2O molecules (Fig. 2m–p and S1†). Its SBU contained four distinct Cs+ ions with different coordination geometries and environments (violet, cyan, grey, and yellow polyhedrons in Fig. 2n), which were bridged by the carboxylate groups. Cs-MOF 4 displayed the longest interplanar distance between the π-stacked TTFTC ligands (Fig. 2o, dπ–π = 3.71 Å, dS⋯S = 3.77 Å) among the four frameworks. The adjacent TTFTC layers were nearly orthogonal to each other (87° angle between their molecular axes), which created the weakest π–π-interaction. Furthermore, all TTFTC ligands in Cs-MOF 4 were extremely bent (boat-shaped) and had the shortest central C–C bonds (1.317 Å, Table 1), indicating that they were neutral species, which was further confirmed by the ESR and DRS analyses (vide infra). All carboxylate groups and one S atom of each TTFTC ligand were involved in the Cs+ ion coordination (Fig. 2p). Unlike MOFs 2 and 3, which gradually became darker due to aerobic oxidation leading to the formation of more TTFTC˙+ radical cations, the orange-colored Cs-MOF 4 remained unchanged upon drying and exposure to air for months, showing that it was highly resistant to aerobic oxidation. The PXRD profiles of dry and air-exposed Cs-MOF powder matched well with the simulated pattern of the as-synthesized material (Fig. S2d†), confirming its phase purity and stability.
Notably, the PXRD patterns (Fig. S2†) of all evacuated pristine and aerobically oxidized MOFs recorded after several weeks were still in good agreement with the simulated patterns obtained from the SXRD data of the corresponding as-synthesized MOFs, demonstrating that all these materials largely retained their crystalline structures when stored in screw-capped vials under normal laboratory conditions (∼20 °C, 30–40% relative humidity) for several weeks to months.
Thermogravimetric analysis and porosity measurements
Thermogravimetric analysis (TGA) revealed that all four MOFs lost ca. 5–10% weight up to 100–150 °C due to the loss of residual solvent molecules and then maintained a stable plateau until ca. 300 °C, indicating that the frameworks were stable up to that point before decomposing at even higher temperatures (Fig. S3†). The N2-sorption studies (Fig. S4†) showed that, like previously reported TTFTC-based MIL-132–135, the optimally oxidized 1-ox and 2-ox had very small Brunauer–Emmett–Teller (BET) surface area (3.56 and 6.64 m2 g−1, respectively) and pore volume (5.03 × 10⁻³ and 6.52 × 10⁻³ cm3 g−1, respectively). The Rb- and Cs-MOFs did not display any meaningful N2 adsorption isotherms. These results were fully consistent with their small solvent-accessible pore volumes (Na-MOF: 8.82 Å3, 0.5% of unit cell volume; K-MOF: 29.24 Å3, 1.4% of unit cell volume; Rb-MOF: 21.65 Å3, 1% of unit cell volume; and Cs-MOF: 43.1 Å3, 2% of unit cell volume) calculated by Mercury software from the crystal structures after removing the solvent molecules using PLATON/SQUEEZE model (Fig. S5†). Since our main goal here was to determine how the mixed valency of electron-rich TTFTC ligands and the IVCT interaction in the resulting TTF/TTF˙+ π-donor/acceptor stacks influenced the electrical conductivity of these MOFs, the lack of framework porosity was not a pertinent concern.Solid-state ESR analysis: quantification of TTFTC˙+ radical cations in the MOFs
To determine the presence and the population of aerobically generated TTFTC˙+ radical cations inside these MOFs, their solid-state quantitative ESR spectra (Fig. 3) were recorded at different stages, from which the number of spins, i.e., the unpaired electrons were calculated (see ESI† for details).30,54 Among all four freshly prepared and evacuated MOFs, 1-ox displayed the most intense characteristic ESR spectrum of TTFTC˙+ radical cation (g ≈ 2.00), followed by 2 and 3, whereas 4 displayed a negligible ESR signal. Based on the ESR signal intensity and assigning each unpaired electron to a TTFTC˙+ radical cation, we estimated that freshly prepared 1-ox, 2, 3, and 4 contained 1.40 × 10²³, 9.42 × 10²², 2.79 × 10²¹, and 1.60 × 10²¹ spins per mol, respectively, which corresponded to ca. 23%, 16%, 0.5%, and 0.3% TTFTC˙+ population, respectively (Table 2). Upon prolonged exposure to air, the color and ESR signal intensity of brown 1-ox and orange 4 remained unchanged, indicating that the former was already saturated with TTFTC˙+ from the beginning, whereas the latter was resistant to aerobic oxidation. In contrast, after prolonged exposure to air, optimally oxidized dark brown/black 2-ox and 3-ox powders displayed more intense ESR spectra, revealing that they contained more spins (1.53 × 10²³ and 6.20 × 10²² spins/mol, respectively) and higher TTFTC˙+ population (ca. 25% and 10%, respectively). Given that all TTFTC ligands in each framework had the same shape and central C–C bond length (vide supra), it appears that they all possessed the same amount of spin or partial radical cation character. In other words, each TTFTC ligand of 1-ox, 2, 2-ox, 3, 3-ox, and 4 on an average contained 0.23, 0.16, 0.25, 0.005, 0.1, and 0.003 unpaired electrons, respectively, i.e., the spins were evenly distributed among all mixed-valent TTFTC0/˙+ ligands via IVCT interactions.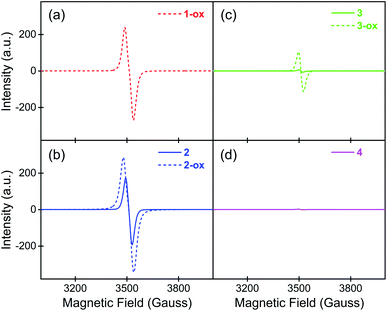 | ||
| Fig. 3 The solid-state quantitative ESR spectra of (a) 1-ox, (b) 2 and 2-ox, (c) 3 and 3-ox, and (d) 4 show the relative populations of paramagnetic TTFTC˙+ radical cations in each material. | ||
Electrochemical behavior of TTFTC ligand and MOFs
To understand the redox properties of these TTFTC-based MOFs and their ability to undergo aerobic oxidation, their solid-state cyclic voltammograms (CVs) were recorded using drop-cast films deposited on Pt-disc working electrodes in 0.1 M TBAPF6/MeCN (Pt-wire counter electrode, Ag/AgCl reference electrode) and compared with the solution-phase CVs of the free ligand recorded in the same electrolyte medium (Fig. 4 and S6†). TTFTC–Me4 tetra-ester displayed (Fig. S6a†) two fully reversible oxidation steps at 880 and 1180 mV corresponding to its radical cation and dication formations, respectively. By contrast, TTFTC–H4 tetra-acid displayed (Fig. S6b†) a reversible first oxidation step at 580 mV corresponding to its radical cation formation, followed by a quasi-reversible second oxidation peak at 980 mV corresponding to the dication formation. These observations were consistent with the literature reports,66,69,70 which suggested that the first oxidation of TTF-carboxylic acids, including TTFTC–H4, is a fully reversible process because the resulting TTF˙+ radical cations do not undergo any decarboxylation, but the second oxidation step is quasi-reversible due to the possibility of decarboxylation of the resulting TTF2+ dications.The solid-state CVs of the MOFs (Fig. 4) revelated that the fully deprotonated TTFTC ligands in these MOFs were oxidized at much lower potentials than free TTFTC–H4 tetra-acid molecules in a MeCN solution. For instance, 1-ox, which contained aerobically oxidized TTFTC˙+ radical cations, displayed (Fig. 4a) the first oxidation peak at ∼200 mV corresponding to complete electrochemical ligand oxidation to TTFTC˙+ radical cations, followed by another anodic peak at ∼620 mV corresponding to TTFTC2+ dication formation. Similarly, the freshly prepared and evacuated K-MOF 2, which also contained aerobically generated TTFTC˙+ radical cations, also displayed (Fig. 4b) a broad first anodic peak centered at ∼200 mV corresponding to electrochemical TTFTC˙+ radical cation formation, followed by second anodic peak at ∼600 mV corresponding to TTFTC˙+ dication formation. The first anodic peak of 2-ox at ∼200 mV was less prominent compared to that of 2, but the second one at ∼600 mV peak persisted. This can be attributed to the preexistence of a greater number of aerobically generated TTFTC˙+ radical cations that left fewer neutral ligands for electrochemical first oxidation at ∼200 mV, but all of them underwent second electrochemical oxidation to dication at a higher potential. By comparison, freshly prepared Rb- and Cs-MOFs (3 and 4), which contained negligible amounts of aerobically generated TTFTC˙+ radical cations according to their ESR data, displayed (Fig. 4c and d) very similar CVs featuring two distinct and prominent anodic peaks—the first one at ∼170 mV corresponding to TTFTC˙+ radical cation formation and the second at ∼550 mV corresponding to TTFTC2+ dication formation. Notably, the electrochemical oxidation peaks of these two largely neutral materials (3 and 4) were much more prominent than the broad and muted peaks of 1-ox, 2, and 2-ox that contained a significant population of aerobically generated TTFTC˙+ radical cations. This can be attributed to the IVCT interactions between the aerobically generated mixed valent ligands, which influenced their electrochemical ligand oxidation. Like 2-ox, 3-ox also displayed a muted first oxidation peak due to the preexistence of a larger population of aerobically generated TTFTC˙+ radical cation and a second anodic peak at ∼550 mV, indicating the TTFTC2+ dication formation. On the other hand, the CV profile of neutral Cs-MOF 4 remained practically unchanged after a long time, as it was very resistant to aerobic oxidation. The CV data revealed that owing to their relatively low first oxidation potentials, the TTFTC ligands in these MOFs could undergo aerobic oxidation to TTFTC˙+ radical cations that were stabilized by TTFTC/TTFTC˙+ IVCT interactions in 1-ox–3-ox, but their further aerobic oxidation to TTFTC2+ dication was not feasible. Although all four MOFs enjoyed similar first oxidation potential, the longest π–π-distance and almost orthogonal orientation of two successive TTF layers in 4 (vide supra)—i.e., the poorest conditions for π–π-interaction—hindered its ability to stabilize the TTFTC˙+ radical cations through IVCT interaction, which in turn prevented its aerobic oxidation, whereas the stabilizing IVCT interactions in 1-ox–3-ox facilitated their aerobic oxidation.
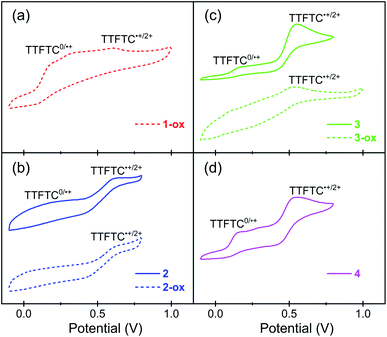 | ||
| Fig. 4 The CV plots of (a) 1-ox, (b) 2 and 2-ox, (c) 3 and 3-ox, and (d) 4 thin-films drop-cast on Pt-disc working electrode in 0.1 M TBAPF6/MeCN (Ag/AgCl reference electrode, Pt counter electrode). | ||
| Na-MOF 1-ox | K-MOF | Rb-MOF | Cs-MOF 4 | |||
|---|---|---|---|---|---|---|
| 2 | 2-ox | 3 | 3-ox | |||
| % TTFTC˙+ population | 23 (0.23) | 16 (0.16) | 25 (0.25) | 0.5 (0.005) | 10 (0.1) | 0.3 (0.003) |
| E opt (eV)—expt. | 1.33 | 1.99 | 1.35 | 2.12 | 1.37 | 2.11 |
| σ avg (S cm−1, 293 K) | 3.4 (±0.11) × 10−5 | 1.7 (±0.3) × 10−5 | 6.3 (±0.6) × 10−5 | 1.5 (±0.2) × 10−5 | 4.1 (±0.4) × 10−5 | 1.3 (±0.3) × 10−7 |
| σ max (S cm−1, 293 K) | 3.6 × 10⁻⁵ | 2.1 × 10⁻⁵ | 6.6 × 10⁻⁵ | 1.7 × 10⁻⁵ | 4.7 × 10⁻⁵ | 1.75 × 10⁻⁷ |
| E a (eV) | 0.06 | 0.18 | 0.16 | 0.19 | 0.19 | — |
Optical properties and IVCT interaction
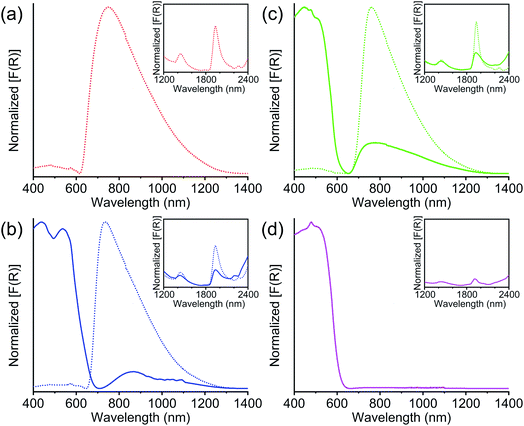
The UV-Vis-NIR diffuse reflectance spectroscopy (Fig. 5) further confirmed the presence of TTFTC˙+ radical cations and TTFTC/TTFTC˙+ IVCT interaction in the aerobically oxidized MOFs. Like other previously reported TTF-based partially oxidized MOFs,42,49–51,68 all three optimally oxidized frameworks 1-ox, 2-ox, and 3-ox, which possessed significant TTFTC˙+ populations according to quantitative ESR analysis, also displayed (Fig. 5a–c) a broad peak centered at ca. 750 nm (∼13![[thin space (1/6-em)]](https://www.rsc.org/images/entities/char_2009.gif) 300 cm−1) and another prominent peak at ca. 2000 nm (∼5000 cm−1), which were the characteristic signs of TTFTC˙+ radical cation and TTFTC/TTFTC˙+ IVCT interaction, respectively. Freshly prepared K-MOF 2 and Rb-MOF 3, which contained much fewer TTFTC˙+ radical cations according to the ESR data, displayed much weaker peaks at ca. 800 and 2000 nm corresponding to TTFTC˙+ and IVCT interactions, respectively, and intense peaks at ca. 500 nm, which corresponded to neutral TTFTC ligand. In contrast, neutral Cs-MOF 4, which was resistant to aerobic oxidation and contained a negligible population of TTFTC˙+, only displayed an intense 500 nm peak for neutral TTFTC ligands and a very weak ∼1900 nm peak (Fig. 5d). Thus, the DRS studies confirmed the presence of TTFTC˙+ radical cation and IVCT interaction in our TTFTC-based oxidized MOFs. The computational studies (vide infra) revealed significant contributions of ligand p-orbitals in the valence and conduction bands of the MOFs, shining light on the feasibility of IVCT interactions between the mixed valent TTFTC0/˙+ ligands.
300 cm−1) and another prominent peak at ca. 2000 nm (∼5000 cm−1), which were the characteristic signs of TTFTC˙+ radical cation and TTFTC/TTFTC˙+ IVCT interaction, respectively. Freshly prepared K-MOF 2 and Rb-MOF 3, which contained much fewer TTFTC˙+ radical cations according to the ESR data, displayed much weaker peaks at ca. 800 and 2000 nm corresponding to TTFTC˙+ and IVCT interactions, respectively, and intense peaks at ca. 500 nm, which corresponded to neutral TTFTC ligand. In contrast, neutral Cs-MOF 4, which was resistant to aerobic oxidation and contained a negligible population of TTFTC˙+, only displayed an intense 500 nm peak for neutral TTFTC ligands and a very weak ∼1900 nm peak (Fig. 5d). Thus, the DRS studies confirmed the presence of TTFTC˙+ radical cation and IVCT interaction in our TTFTC-based oxidized MOFs. The computational studies (vide infra) revealed significant contributions of ligand p-orbitals in the valence and conduction bands of the MOFs, shining light on the feasibility of IVCT interactions between the mixed valent TTFTC0/˙+ ligands.
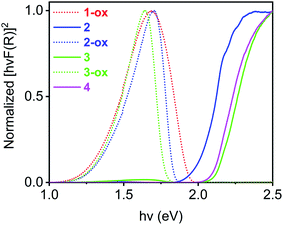
The optical band gaps of all these materials were calculated from the corresponding Tauc plots (Fig. 6) and summarized in Table 2. Among the freshly prepared materials, Na-MOF 1-ox, which possessed the shortest dπ–π and the largest TTFTC˙+ population from the beginning, enjoyed the narrowest optical band gap (1.33 eV), whereas Cs-MOF 4, which had the widest dπ–π and a negligible TTFTC˙+ population, displayed the widest band gap (2.11 eV). Consistent with their constant ESR spectra (vide supra), the optical spectra and band gaps of these two materials did not change over time. On the other hand, freshly prepared K- and Rb-MOFs 2 and 3 initially displayed wider optical band gaps (ca. 2 eV) due to the lack of adequate TTFTC˙+ population and IVCT interaction, but the optimally oxidized 2-ox and 3-ox enjoyed much narrower band gaps (1.35 and 1.37 eV, respectively), which were comparable to that of 1-ox. Thus, the presence of adequate TTFTC˙+ radical cations enabled TTFTC/TTFTC˙+ IVCT interaction in the aerobically oxidized MOFs leading to their much narrower band gaps than the neutral forms.
Electronic band structures, band gaps, and density of states
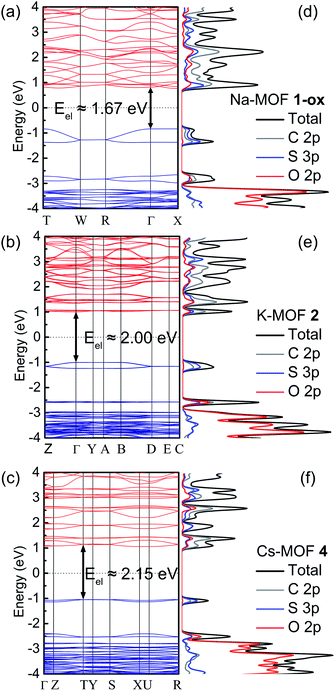
The electronic band structures, band gaps, and density of states of MOFs 1-ox, 2, and 4 (Fig. 7a–c) were computed by DFT calculations, which provided valuable insights into their predominant charge transport mechanism and revealed the correlations between π–π stacking distances, band gaps, and electrical conductivity of these frameworks (Table 2). The structural complexity stemming from the presence of the S-coordinated Rb+ ions inside the ‘pores’ of 3 made it extremely difficult and time-consuming to calculate its band structure. Nevertheless, the strong similarities between the overall structures and π–π distances of MOFs 2 and 3 helped us to understand their similar electronic and optical properties.Having the shortest π–π-distance (3.39 Å) and maximum π-overlap (i.e., the least staggered orientation) between the perfectly planar successive TTF layers, Na-MOF 1-ox enjoyed the narrowest electronic band gap (Eel = 1.67 eV) and the most dispersed valence band (ca. 0.43 eV dispersion). The effect of the partial TTFTC˙+ radical cation nature of the ligands in as-synthesized Na-MOF was partly built into its SXRD structure (i.e., the planar geometry and longer central C–C bonds), which also possibly contributed to its narrower calculated Eel than other as-synthesized MOFs containing much fewer TTFTC˙+ radical cations. By comparison, K-MOF 2 and Cs-MOF 4, which had much larger dπ–π (ca. 3.7 Å) and less π-overlap between the π-stacked TTFTC ligands, displayed much wider electronic band gaps (Eel = 2.0 and 2.15 eV, respectively) and less dispersed valence bands (0.16 and 0.07 eV, respectively). Notably, calculated Eel and experimental Eopt (DRS) of neutral Cs-MOF 4, which barely contained any TTFTC˙+, were in good agreement because its Eopt was not influenced by any IVCT interaction. Similarly, the calculated Eel of 2 based on the single-crystal structure of neutral as-synthesized K-MOF was in good agreement with the Eopt of freshly prepared 2 used for DRS analysis but significantly wider than that of aerobically oxidized 2-ox (Eopt = 1.35 eV), which contained a much larger TTFTC˙+ population and enjoyed significant IVCT interaction that caused a much narrower Eopt. Thus, the computational results based on the single-crystal structures of MOFs largely showed the effects of π–π stacking interaction on their electronic band gaps but did not fully account for the effects of aerobically oxidized TTFTC˙+ radical cations. On the other hand, the experimental results based on the DRS data encapsulated the combined effects of the structural features as well as IVCT interactions between mixed-valent TTFTC0/˙+ ligands on their electronic and optical properties. These results suggested that the charge movement in these MOFs occurred predominantly through the TTFTC π-stacks, and its efficacy was dictated by π–π-distance and the degree of π-overlap.
The corresponding DOS diagrams (Fig. 7d–f) shined additional light on the orbital contributions of different components of these MOFs to their electronic band structures, revealing that their valence band maximums (VBMs) and conduction band minimums (CBMs) consisted of mainly S-3p and C-2p orbitals with a smaller contribution of O-2p orbital of TTFTC ligand and practically none from the metal ions. The major contributions of ligand-p orbitals, especially S-3p orbital, to the VBMs and CBMs indicated significant interlayer S⋯S and π–π-interactions that facilitated out-of-plane charge movement through the TTFTC π-stacks (and the TTFTC/TTFTC˙+ π-donor/acceptor stacks in the oxidized materials). Furthermore, the absence of metal orbitals in the VBMs and CBMs of these MOFs indicated the highly ionic nature of the coordination bonds and ruled out the possibility of through-bond charge movement.
Electrical conductivity
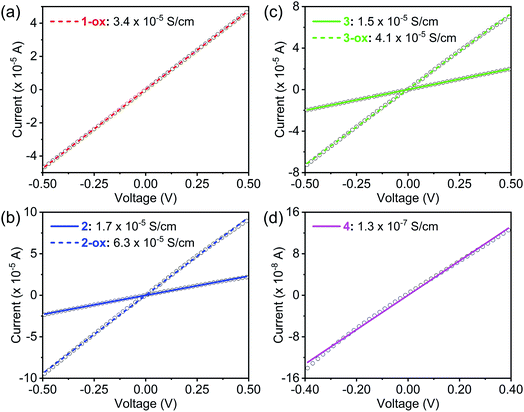
The electrical conductivity of these materials (Table 2) was measured by a two-probe method using pressed pellets sandwiched between two Ag-coated stainless-steel electrodes surrounded by a snugly fit Teflon tube.30,53 All these materials displayed linear current–voltage (I–V) plots (Fig. 8), indicating ohmic contact between the electrodes and sandwiched MOF pellets. Having the shortest dπ–π and dS⋯S, maximum π-surface overlap, the narrowest electronic and optical band gaps, and a large population of TTFTC˙+ radical cations from the outset, which collectively facilitated charge delocalization via TTFTC/TTFTC˙+ IVCT interaction, Na-MOF 1-ox displayed the highest room temperature electrical conductivity (3.4 (±0.1) × 10−5 S cm−1) among all four freshly prepared MOFs. The conductivity of Na-MOF 1-ox did not change after being exposed to air for longer time, as it was already saturated with TTFTC˙+ from the beginning. In contrast, the room temperature electrical conductivities of freshly prepared K-MOF 2 and Rb-MOF 3, which had wider dπ–π and dS⋯S, less π-surface overlap, wider band gaps, and much fewer TTFTC˙+ radical cations in the beginning, were lower (1.7 (±0.3) × 10−5 and 1.5 (±0.2) × 10−5 S cm−1, respectively) than that of 1-ox. However, after prolonged aerobic oxidation, which raised the TTFTC˙+ population in the resulting 2-ox and 3-ox to the optimum levels, their room temperature electrical conductivity increased to 6.3 (±0.6) × 10−5 and 4.1 (±0.4) × 10−5 S cm−1, respectively. In contrast, Cs-MOF 4, which possessed the longest dπ–π and dS⋯S, least π-surface overlap, widest bad gap, and a negligible amount of TTFTC˙+ radical cation even after prolonged exposure to air, displayed the lowest (and constant) room temperature electrical conductivity (1.3 (±0.3) × 10−7 S cm−1) among all these materials. Interestingly, although 1-ox has shorter π–π-distance between the adjacent ligands and a greater TTFTC˙+ population than 3-ox, the former displayed slightly lower electrical conductivity, which suggested that other factors possibly contributed to the electrical conductivity of the latter. While these MOFs show clear trends of increasing π–π- and S⋯S-distances and decreasing π-overlap between the TTFTC ligands, they are not strictly isostructural and have some notable differences in the coordination environments of TTFTC ligands. Notably, unlike other three MOFs, in Rb-MOF all four S-atoms were coordinated to Rb+ ions and it contained a hepta-coordinated Rb+ ion surrounded by the TTF core that filled the pores. These structural features possibly contributed to the higher electrical conductivity of 3-ox. Finally, the conductivities of free ligands (Fig. S7†) were several orders of magnitude lower than that of all four MOFs: TTFTC–Me4 ester acted as an insulator with a conductivity below the measurable limit (σ < 10−12 S cm−1), whereas TTFTC–H4 tetra-acid displayed a barely measurable conductivity (8.5 × 10⁻¹¹ S cm−1).It is worth noting that these pellet conductivity values of MOFs are usually 1–2 orders of magnitude underestimated than the corresponding single-crystal conductivity values due to the contributions of grain boundary and contact resistances in the former. Furthermore, the single-crystal structures combined with the calculated electronic band structures and DOS of these MOFs suggested that the charge movement through the TTFTC π-stacks or TTFTC/TTFTC˙+ IVCT stacks located along certain directions (the c-axis in 1–3 and a-axis in 4), should be anisotropic and therefore, the single-crystal conductivity measured along these directions should be higher than the bulk electrical conductivity measured with pressed pellets containing randomly oriented MOF crystals. However, single-crystal conductivity measurements require large robust crystals and sophisticated setups, which were not available for these studies.
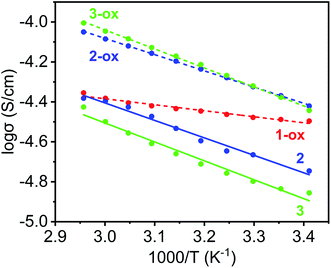
Finally, the thermal activation energies (Ea) of electrical conduction in these materials were determined from the Arrhenius plots (Fig. 9 and Table 2) of their respective temperature-dependent conductivity values (Fig. S8†). Once again, having the shortest π–π-distance and a large TTFTC˙+ population from the outset, which provided significant charge-carrier concentration and facilitated charge movement through IVCT interaction, 1-ox enjoyed the lowest activation energy (Ea = 0.06 eV), followed by the optimally oxidized 2-ox (Ea = 0.16 eV) and 3-ox (Ea = 0.19 eV), which also contained significant amounts of TTFTC˙+ radical cations but less effective π–π-overlap than 1-ox. The poor electrical conductivity of largely neutral 4, which was caused by (i) inadequate charge carrier concentration (contained only 0.3% TTFTC˙+) and (ii) the lack of efficient charge movement through the TTF-stacks having large π–π-distances and highly staggered orientation, did not change much with temperature up to 70 °C, indicating that it has a high thermal activation energy. The PXRD profiles of the MOF pellets used for electrical measurements were in good agreement with that of the corresponding bulk powders (Fig. S2†), confirming that their structures and crystallinity were largely preserved during these measurements. Thus, the electronic properties of these materials were directly impacted by their charge carrier concentration, i.e., the TTFTC˙+ population, as well as the efficacy of charge movement pathways, which was largely dictated by π–π- and TTFTC/TTFTC˙+ IVCT interactions.
Conclusions
In summary, we have synthesized four new TTFTC-based 3D MOFs and demonstrated how their structures, compositions, and the oxidation states of ligands influenced their electronic, optical, and charge transport properties. While all four frameworks contained extended TTF-stacks, the π–π-distance, the extent of π-overlap, and the TTFTC˙+ population varied significantly, which commensurately impacted their electronic and optical band gaps, electrical conductivity, and activation energy of electrical conduction. Having the most effective π–π-interaction as well as the highest TTFTC˙+ population from the outset, which enabled most facile through-space charge delocalization via IVCT interaction, Na-MOF 1-ox displayed the narrowest electronic and optical band gaps, the highest electrical conductivity, and the lowest activation energy among all four freshly prepared MOFs, whereas the opposite was true for Cs-MOF 4. In comparison, freshly prepared and not optimally oxidized K-MOF 2 and Rb-MOF 3 possessed intermediate π–π-overlap and modest TTFTC˙+ population in the beginning, which increased upon aerobic oxidation. As a result, they initially displayed intermediate band gaps and electrical conductivities, which improved dramatically once they became saturated with charge delocalized TTFTC˙+ radical cations after longer aerobic oxidation. The computational results based on the single-crystal structures of MOFs primarily showed the effects of structural features, i.e., dπ–π, dS⋯S, and the degree of overlap on their electronic properties, whereas the experimental results encompassed the combined effects of structural features and TTFTC˙+ population on the electronic and optical properties of these MOFs. The foregoing results demonstrated that both TTFTC˙+ population, which dictated the charge carrier concentration, and the π–π-interaction, which controlled the efficacy of IVCT interaction and charge delocalization, played important roles on the electrical conductivity and band gaps of these frameworks. Importantly, these studies presented a rare, if not the first, comprehensive understanding of how the mixed valency of an electroactive ligand and the subsequent IVCT interaction influenced the electrical conductivity and band gaps of a family of 3D MOFs having systematically variable structural parameters and compositions, delivering a promising design strategy for electrically conductive MOFs.Data availability
All relevant experimental and computational details are provided in the ESI.†Author contributions
Conceptualization and supervision: SS; synthesis and characterization (XRD, PXRD, TGA, IR, EPR, CV, and DRS): SZ, DKP, and AY; electrical conductivity measurement: SZ and DKP; theoretical calculations: WZ; writing, reviewing, & editing: SS, SZ, and WZ. All authors proof-read, provided comments, and approved the final version of this manuscript.Conflicts of interest
The authors declare no conflicts of interest.Acknowledgements
This work was supported by the National Science Foundation (award no. DMR-1809092 and CHE-1660329) of the United States. We thank Dr Collin McMillen for his assistance with single-crystal X-ray diffraction analysis, Prof. Thao Tran and Xudong Huai for NIR-DRS analysis, and Prof. George Chumanov and Dr Tatiana Estrada-Mendoza for Raman spectroscopy. The DFT calculations were performed in part on the NIST Enki HPC cluster.References
- L. S. Xie, G. Skorupskii and M. Dincă, Chem. Rev., 2020, 120, 8536 CrossRef CAS PubMed.
- L. Sun, M. G. Campbell and M. Dincă, Angew. Chem., Int. Ed., 2016, 55, 3566 CrossRef CAS PubMed.
- V. Stavila, A. A. Talin and M. D. Allendorf, Chem. Soc. Rev., 2014, 43, 5994 RSC.
- I. Stassen, N. Burtch, A. Talin, P. Falcaro, M. Allendorf and R. Ameloot, Chem. Soc. Rev., 2017, 46, 3185 RSC.
- H. Wang, Q.-L. Zhu, R. Zou and Q. Xu, Chem, 2017, 2, 52 CAS.
- L. Wang, Y. Han, X. Feng, J. Zhou, P. Qi and B. Wang, Coord. Chem. Rev., 2016, 307, 361 CrossRef CAS.
- D. Sheberla, J. C. Bachman, J. S. Elias, C.-J. Sun, Y. Shao-Horn and M. Dincă, Nat. Mater., 2017, 16, 220 CrossRef CAS PubMed.
- W. H. Li, K. Ding, H. R. Tian, M. S. Yao, B. Nath, W. H. Deng, Y. Wang and G. Xu, Adv. Funct. Mater., 2017, 27, 1702067 CrossRef.
- M. G. Campbell, D. Sheberla, S. F. Liu, T. M. Swager and M. Dincă, Angew. Chem., Int. Ed., 2015, 54, 4349 CrossRef CAS PubMed.
- C. R. Wade, M. Li and M. Dincă, Angew. Chem., Int. Ed., 2013, 52, 13377 CrossRef CAS PubMed.
- K. AlKaabi, C. R. Wade and M. Dincă, Chem, 2016, 1, 264 CAS.
- E. A. Dolgopolova, V. A. Galitskiy, C. R. Martin, H. N. Gregory, B. J. Yarbrough, A. M. Rice, A. A. Berseneva, O. A. Ejegbavwo, K. S. Stephenson, P. Kittikhunnatham, S. G. Karakalos, M. D. Smith, A. B. Greytak, S. Garashchuk and N. B. Shustova, J. Am. Chem. Soc., 2019, 141, 5350 CrossRef CAS PubMed.
- J. Liu, W. Zhou, J. Liu, I. Howard, G. Kilibarda, S. Schlabach, D. Coupry, M. Addicoat, S. Yoneda, Y. Tsutsui, T. Sakurai, S. Seki, Z. Wang, P. Lindemann, E. Redel, T. Heine and C. Wöll, Angew. Chem., Int. Ed., 2015, 54, 7441 CrossRef CAS PubMed.
- W. A. Maza, A. J. Haring, S. R. Ahrenholtz, C. C. Epley, S. Y. Lin and A. J. Morris, Chem. Sci., 2016, 7, 719 RSC.
- M. A. Gordillo, D. K. Panda and S. Saha, ACS Appl. Mater. Interfaces, 2018, 11, 3196 CrossRef PubMed.
- C.-C. Chueh, C.-I. Chen, Y.-A. Su, H. Konnerth, Y.-J. Gu, C.-W. Kung and K. C.-W. Wu, J. Mater. Chem. A, 2019, 7, 17079 RSC.
- E. M. Miner, S. Gul, N. D. Ricke, E. Pastor, J. Yano, V. K. Yachandra, T. V. Voorhis and M. Dincă, ACS Catal., 2017, 7, 7726 CrossRef CAS.
- Y. Zhang, S. N. Riduan and J. Wang, Chem. –Eur. J., 2017, 23, 16419 CrossRef CAS PubMed.
- S. S. Park, Y. Tulchinsky and M. Dincă, J. Am. Chem. Soc., 2017, 139, 13260 CrossRef CAS PubMed.
- D. K. Panda, K. Maity, A. Palukoshka, F. Ibrahim and S. Saha, ACS Sustain. Chem. Eng., 2019, 7, 4619 CrossRef CAS.
- F. A. A. Paz, J. Klinowski, S. M. F. Viela, J. P. C. Tomé, J. A. S. Cavaleiro and J. Rocha, Chem. Soc. Rev., 2012, 41, 1088 RSC.
- W. Lu, Z. Wei, Z.-Y. Gu, T.-F. Liu, J. Park, J. Park, J. Tian, M. Zhang, Q. Zhang, T. Gentle III, M. Bosch and H.-C. Zhou, Chem. Soc. Rev., 2014, 43, 5561 RSC.
- D. D'Alessandro, Chem. Commun., 2016, 52, 8957 RSC.
- L. Sun, C. H. Hendon, M. A. Minier, A. Walsh and M. Dincă, J. Am. Chem. Soc., 2015, 137, 6164 CrossRef CAS PubMed.
- L. S. Xie, L. Sun, R. Wan, S. S. Park, J. A. DeGayner, C. H. Hendon and M. Dincă, J. Am. Chem. Soc., 2018, 140, 7411 CrossRef CAS PubMed.
- F. Gándara, F. J. Uribe-Romo, D. K. Britt, H. Furukawa, L. Lei, R. Cheng, X. Duan, M. O'Keeffe and O. M. Yaghi, Chem. –Eur. J., 2012, 18, 10595 CrossRef PubMed.
- J. G. Park, M. L. Aubrey, J. Oktawiec, K. Chakarawet, L. E. Darago, F. Grandjean, G. J. Long and J. R. Long, J. Am. Chem. Soc., 2018, 140, 8526 CrossRef CAS PubMed.
- X. Huang, P. Sheng, Z. Tu, F. Zhang, J. Wang, H. Geng, Y. Zou, C. Di, Y. Yi, Y. Sun, W. Xu and D. Zhu, Nat. Commun., 2015, 6(1–8), 7408 CrossRef CAS PubMed.
- A. Pathak, J.-W. Shen, M. Usman, L.-F. Wei, S. Mendiratta, Y.-S. Chang, B. Sainbileg, C.-M. Ngue, R.-S. Chen, M. Hayashi, T.-T. Luo, F.-R. Chen, T. W. Tseng, L.-C. Chen and K.-L. Lu, Nat. Commun., 2019, 10(1–7), 1721 CrossRef PubMed.
- A. Yadav, D. K. Panda, S. Zhang, W. Zhou and S. Saha, ACS Appl. Mater. Interfaces, 2020, 12, 40613 CrossRef CAS PubMed.
- S. Takaishi, M. Hosoda, T. Kajiwara, H. Miyasaka, M. Yamashita, Y. Nakanishi, Y. Kitagawa, K. Yamaguchi, A. Kobayashi and H. Kitagawa, Inorg. Chem., 2009, 48, 9048 CrossRef CAS PubMed.
- C. Avendano, Z. Zhang, A. Ota, H. Zhao and K. R. Dunbar, Angew. Chem., Int. Ed., 2011, 50, 6543 CrossRef CAS PubMed.
- C. A. Farnandez, P. C. Martin, T. Schaef, M. E. Bowden, P. K. Thallapally, L. Dang, W. Xu, X. Chen and B. P. McGrail, Sci. Rep., 2014, 4, 6114 CrossRef PubMed.
- L. E. Darago, M. L. Aubrey, C. J. Yu, M. I. Gonzalez and J. R. Long, J. Am. Chem. Soc., 2015, 137, 15703 CrossRef CAS PubMed.
- M. E. Ziebel, L. E. Darago and J. R. Long, J. Am. Chem. Soc., 2018, 140, 3040 CrossRef CAS PubMed.
- M. Hmadeh, Z. Lu, Z. Liu, F. Gándara, H. Furukawa, S. Wan, V. Augustyn, R. Chang, L. Liao, F. Zhou, E. Perre, V. Ozolins, K. Suenaga, X. Duan, B. Dunn, Y. Yamamto, O. Terasaki and O. M. Yaghi, Chem. Mater., 2012, 24, 3511 CrossRef CAS.
- T. Kambe, R. Sakamoto, T. Kusamoto, T. Pal, N. Fukui, K. Hoshiko, T. Shimojima, Z. Wang, T. Hirahara, K. Ishizaka, S. Hasegawa, F. Liu and H. Nishihara, J. Am. Chem. Soc., 2014, 136, 14357 CrossRef CAS PubMed.
- D. Sheberla, L. Sun, M. A. Blood-Forsythe, S. l. Er, C. R. Wade, C. K. Brozek, A. n. Aspuru-Guzik and M. Dincă, J. Am. Chem. Soc., 2014, 136, 8859 CrossRef CAS PubMed.
- J.-H. Dou, L. Sun, Y. Ge, W. Li, C. H. Hendon, J. Li, S. Gul, J. Yano, E. A. Stach and M. Dincă, J. Am. Chem. Soc., 2017, 139, 13608 CrossRef CAS PubMed.
- T. C. Narayan, T. Miyakai, S. Seki and M. Dincă, J. Am. Chem. Soc., 2012, 134, 12932 CrossRef CAS PubMed.
- S. S. Park, E. R. Hontz, L. Sun, C. H. Hendon, A. Walsh, T. V. Voorhis and M. Dincă, J. Am. Chem. Soc., 2015, 137, 1774 CrossRef CAS PubMed.
- L. S. Xie, E. V. Alexandrov, G. Skorupskii, D. M. Proserpio and M. Dincă, Chem. Sci., 2019, 10, 8558 RSC.
- G. Skorupskii, B. A. Trump, T. W. Kasel, C. M. Brown, C. H. Hendon and M. Dincă, Nat. Chem., 2020, 12, 131 CrossRef CAS PubMed.
- X. Kuang, S. Chen, L. Meng, J. Chen, X. Wu, G. Zhang, G. Zhong, T. Hu, Y. Li and C.-Z. Lu, Chem. Commun., 2019, 55, 1643 RSC.
- D. Chen, H. Xing, Z. Su and C. Wang, Chem. Commun., 2016, 52, 2019 RSC.
- S. Goswami, I. Hod, J. D. Duan, C.-W. Kung, M. Rimoldi, C. D. Malliakas, R. H. Palmer, O. K. Farha and J. T. Hupp, Chem. Soc., 2019, 141, 17696 CrossRef CAS PubMed.
- M.-H. Zeng, Q.-X. Wang, Y.-X. Tan, S. Hu, H.-X. Zhao, L.-S. Long and M. Kurmoo, J. Am. Chem. Soc., 2010, 132, 2561 CrossRef CAS PubMed.
- Y. Kobayashi, B. Jacobs, M. D. Allendorf and J. R. Long, Chem. Mater., 2010, 22, 4120 CrossRef CAS.
- H.-Y. Wang, J.-Y. Ge, C. Hua, C.-Q. Jiao, Y. Wu, C. F. Leong, D. M. D'Alessandro, T. Liu and J.-L. Zuo, Angew. Chem., Int. Ed., 2017, 56, 5465 CrossRef CAS PubMed.
- C. F. Leong, C.-H. Wang, C. D. Ling and D. M. D'Alessandro, Polyhedron, 2018, 154, 334 CrossRef CAS.
- J. Su, T.-H. Hu, R. Murase, H.-Y. Wang, D. M. D'Alessandro, M. Kurmoo and J.-L. Zuo, Inorg. Chem., 2019, 58, 3698 CrossRef CAS PubMed.
- J. Su, S. Yuan, H.-Y. Wang, L. Huang, J.-Y. Ge, E. Joseph, J. Qin, T. Cagin, J.-L. Zuo and H.-C. Zhou, Nat. Commun., 2017, 8, 2008 CrossRef PubMed.
- M. A. Gordillo, P. A. Benavides, D. K. Panda and S. Saha, ACS Appl. Mater. Interfaces, 2020, 12, 12955 CrossRef PubMed.
- H. C. Wentz, G. Skorupskii, A. B. Bonfim, J. L. Mancuso, C. H. Hendon, E. H. Oriel, G. T. Sazama and M. G. Campbell, Chem. Sci., 2020, 11, 1342 RSC.
- A. A. Talin, A. Centrone, A. C. Ford, M. E. Foster, V. Stavila, P. Haney, R. A. Kinney, V. Szalai, F. E. Gabaly, H. P. Yoon, F. Léonard and M. D. Allendorf, Science, 2014, 343, 66 CrossRef CAS PubMed.
- Z. Guo, D. K. Panda, K. Maity, D. Lindsey, T. G. Parker, T. E. Albrecht-Schmitt, J. L. Barreda-Esparza, P. Xiong, W. Zhou and S. Saha, J. Mater. Chem. C, 2016, 4, 894 RSC.
- Z. Guo, D. K. Panda, M. A. Gordillo, A. Khatun, H. Wu, W. Zhou and S. Saha, ACS Appl. Mater. Interfaces, 2017, 9, 32413 CrossRef CAS PubMed.
- S. Goswami, D. Ray, K. Otake, C.-W. Kung, S. J. Garibay, T. Islamoglu, A. Atilgan, Y. Cui, C. J. Cramer, O. K. Farha and J. T. Hupp, Chem. Sci., 2018, 9, 4477 RSC.
- A. M. Rice, E. A. Dolgopolova, B. J. Yarbrough, G. A. Leith, C. R. Martin, K. S. Stephenson, R. A. Heugh, A. J. Brandt, D. A. Chen, S. G. Karakalos, M. D. Smith, K. B. Hatzell, P. J. Pellechia, S. Garashchuk and N. B. Shustova, Angew. Chem., Int. Ed., 2018, 57, 11310 CrossRef CAS PubMed.
- M. R. Bryce and L. C. Murphy, Nature, 1984, 309, 119 CrossRef CAS.
- J. R. Kirtley and J. Mannhart, Nature Mat., 2008, 7, 520 CrossRef CAS PubMed.
- Y.-S. Guan, Y. Hu, H. Zhang, G. Wu, H. Yan and S. Ren, Chem. Commun., 2019, 55, 7179 RSC.
- B. Ding, C. Hua, C. J. Kepert and D. M. D'Alessando, Chem. Sci., 2019, 10, 1392 RSC.
- P. W. Dohney, J. K. Clegg, F. Tuna, D. Collison, C. J. Kepert and D. M. D'Alessando, Chem. Sci., 2020, 11, 5213 RSC.
- Y.-R. Qin, Q.-Y. Zhu, L.-B. Huo, Z. Shi, G.-Q. Bia and J. Dai, Inorg. Chem., 2010, 49, 7372 CrossRef CAS PubMed.
- T. L. A. Nguyen, R. Demir-Kakan, T. Devic, M. Morcrette, T. Ahnfeldt, P. Auban-Senzier, N. Stock, A.-M. Goncalvez, Y. Filinchuk, J.-M. Tarascon and G. Férey, Inorg. Chem., 2010, 49, 7135 CrossRef CAS PubMed.
- Y. Qian, Y. Lin, S. Liu, S. Zhang, H. Chen, Y. Wang, Y. Yan, X. Guo and J. Huang, Chem. Commun., 2013, 49, 704 RSC.
- J. Su, N. Xu, R. Murase, Z.-M. Yang, D. M. D'Alessandro, J.-L. Zuo and J. Zhu, Angew. Chem., Int. Ed., 2021, 60, 4789 CrossRef CAS PubMed.
- F. Pontillart, Y. E. Gal, S. Gilhen, O. Cador and L. Ouahab, Chem. Commun., 2009, 3777 RSC.
- C. J. Kepert, D. Hesek, P. D. Beer and M. J. Rosseinsky, Angew. Chem., Int. Ed., 1998, 37, 3158 CrossRef CAS.
Footnote |
| † Electronic supplementary information (ESI) available: Experimental details. CCDC 2060695–2060698. For ESI and crystallographic data in CIF or other electronic format see DOI: 10.1039/d1sc04338b |
| This journal is © The Royal Society of Chemistry 2021 |

