 Open Access Article
Quantifiable stretching-induced fluorescence shifts of an elastically bendable and plastically twistable organic crystal†
Qi
Di
,
Jiaqi
Li
,
Zhanrui
Zhang
,
Xu
Yu
,
Baolei
Tang
,
Houyu
Zhang
 and
Hongyu
Zhang
 *
*
State Key Laboratory of Supramolecular Structure and Materials, College of Chemistry, Jilin University, Qianjin Street, Changchun 130012, P. R. China. E-mail: hongyuzhang@jlu.edu.cn
First published on 29th October 2021
Abstract
Organic crystals with mechanical stimulus-response properties are being developed increasingly nowadays. However, the studies involving tensile-responsive crystals are still lacking due to the strict requirement of crystals with good flexibility. In this work, an organic crystal with the ability of elastic bending and plastic twisting upon loading stress and shearing force, respectively, is reported. The deformability in different directions enables the crystal to be a model for tensile-responsive study. Indeed, blue shifts of fluorescence were observed when the tensile forces loaded upon the needle-shaped crystal were stretched to a certain degree. The mathematical correlation between emission wavelength changes and stretching strain was obtained for the first time, which proves that the crystal has a potential application for tension sensors. In addition, a low detection limit and high sensitivity enabled the crystal to have the ability to detect tension variations in precision instruments. Theoretical calculations and X-ray crystal structure analyses revealed the mechanism of emission wavelength shifts caused by molecular movement during the stretching process. The presented crystal successfully overcame the limitations of traditional mechanochromic organic crystals, which have difficulty in responding to tensile forces.
Introduction
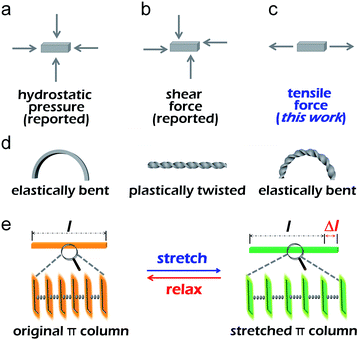
Owing to the excellent optical and electronic properties as well as the highly ordered and compact packing structures, organic single crystals have a wide range of applications including organic light-emitting diodes,1,2 organic lasers3,4 and optical waveguides.5–12 In recent years, many crystals responding to light,13,14 heat15,16 and force stimuli17–20 have been reported. Forces that can be applied to a crystal are pressure,21 shear force22 and tensile force (Fig. 1a–c). External forces can change the emission of crystal by tuning the packing structure and/or molecular configuration inside the crystal. For instance, our group reported a boron-containing organic crystal that exhibited distinct mechanochromism when it was subjected to different isotropic pressures.23 Reddy and his colleagues reported single crystals of a green fluorescent protein analogue with irreversible mechanical bending under shear forces and associated unusual enhancement of the fluorescence, which is attributed to the strained molecular packing in the perturbed region.24The pressure and shear force responses do not rely on the excellent mechanical properties of materials, as for crystals, they could be brittle or even crystalline powder.25,26 However, only materials with good flexibility can respond to tensile stimulus. Polymer materials are often used to study tensile properties because of their good flexibility.27,28 Etienne and co-workers reported a polymer elastomer, which can deform reversibly under large strain.29 When the elastomer was stretched to a certain extent, it would emit bright blue light because the dioxetane group inside the polymer breaks into two ketones. Weder's group presented films of cyclophane-containing polyurethane, which displayed a considerable portion of excimer emission, but upon deformation, the fluorescence became monomer-dominated, and a perceptible change from cyan to blue was observed. The mechanochromic response displayed by the films was instantly reversible.30 In this sense, to study the properties of the tensile stimulus-response of crystals, the key requirement is that crystals should be flexible and stretchable. Since Reddy et al. first reported the elastic bending properties of organic single crystals and proposed the bending mechanism in 2012,31 a few elastically bendable single crystals have been reported by Kahr,32,33 Chandrasekar,34,35 Naumov,36–38 and other groups.39–42 Recently, Hayashi and his co-workers found that the emission spectra of the inner part, center and outer part of the bent 9,10-dibromoanthracene single crystal were markedly different.43 This work proved the feasibility that an organic flexible single crystal can respond to tensile force and provided a new idea for studying the effect of tensile force on crystal luminescence. However, it is still a challenge to study the relationship between crystal luminescence and crystal tensile strain.
In this work, we report an organic crystal capable of elastic bending and plastic twisting, and still has good elasticity after twisting (Fig. 1d). Besides, the crystal can be stretched reversibly within a certain strain (Fig. 1e). Interestingly, the spectra of the crystal under stretching significantly differed from the initial state, and the blue shift of the emission wavelength occurred evidently during the stretching process. There is a definite linear relationship between the wavelength change and stretching strain, so the crystal can be used as a potential tension sensing material. Hence, an organic crystal that can respond to tensile forces has been successfully obtained, which fills the gap of the response of organic single crystal to tensile force and expands the application field of organic crystal greatly.
Results and discussion
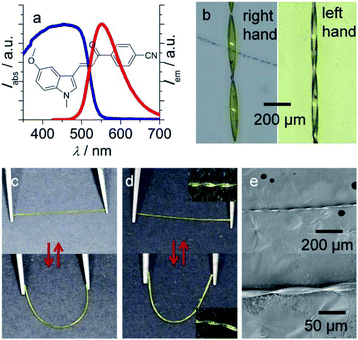
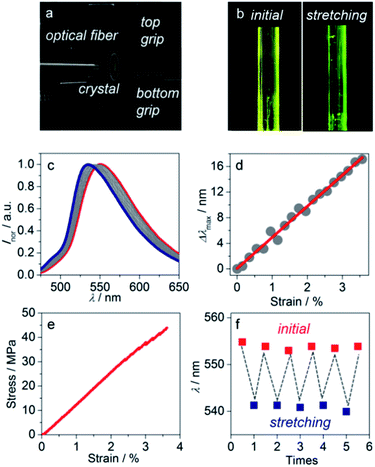
(E)-4-(3-(5-Methoxy-1-methyl-1H-indol-3-yl)acryloyl)benzonitrile (MMIAB; Fig. 2a) was synthesized in good yield through a two-step reaction (ESI Fig. S1–S3†). MMIAB in solution has excellent stability against photoisomerization (ESI Fig. S4†). The crystals of MMIAB were prepared as follows: 3.0 mL saturated dichloromethane solution of MMIAB was added to a test tube, then 6.0 mL ethanol was slowly added using a dropper without destroying the previous solution surface. After about 15 days, yellow needle-shaped crystals with a typical length of about 1.5–2.0 cm were obtained. MMIAB crystals displayed bright yellow fluorescence with an emission peak at about 550 nm and a quantum yield of 0.22 (Fig. 2a). The emission maximum in different polar solvents is from 472 nm to 526 nm, revealing that the solvent polarity has a certain effect on the excited state (ESI Fig. S5†).44,45 To simulate the effect of the solvent on the excited states of MMIAB, the calculated emission and dominant orbital excitations were collected in Table S1.† All the emissions from the optimized S1 state originated from similar orbital excitations. The calculated emission maxima of MMIAB are in the range of 476–502 nm. As the solvent polarity increases, the principal emission peaks are red-shifted, as shown in Fig. S6;† the red-shift trend is consistent with the experimental measurements. Both experiment and simulation results indicate that the solvent polarity has a specific effect on the excited state, thus resulting in the red-shifted emission. The thermal stability of MMIAB has also been verified (ESI Fig. S7†). The crystal could be plastically twisted along the direction perpendicular to its growth to form both left-handed and right-handed morphologies (Fig. 2b) when the twist forces were applied at both ends of the crystal tips in the opposite direction. SEM images illustrated that the crystal was not damaged under the helical condition of small pitch (Fig. 2e). The crystal displayed excellent elasticity so that it can be bent easily to form a half loop by tweezers and then recovered to its original shape when the applied force was released (Fig. 2c). This elasticity is not significantly affected by the plastic twisting of the crystal (Fig. 2d). In addition, the maximum strain of the twisted-elastic crystal was smaller than that of the elastic crystal because of the layered slip of the crystal caused by the torsion process (ESI Fig. S8†).In order to test whether large strain can occur in the length direction of the crystal and explore the change of the crystal emission wavelength during the stretching process, a needle-like crystal was stretched by a universal testing system. The sample was fixed on one surface of the mechanical grip by 502 glue to avoid slippage during testing, and then the optical fiber was placed between two grips (Fig. 3a). To determine the relationship between emission wavelength change and strain, each stretching displacement (0.02 mm) was fixed to get multiple sets of wavelength-strain data. As the bottom grip is fixed and only the top grip can move as setting displacement, some detections for different parts were displayed, and they are not identical with the previous ones. To eliminate the test error, we collected the PL spectra of three different parts of one crystal (ESI Fig. S9†) and found that the wavelengths of these parts are not significantly different. Stretching is homogeneous, and even though the parts were slightly different from one test to the next, the results were still authentic.
The crystal fluorescence underwent a gradual hypsochromic shift upon stretching. When the stretching strain increased, the fluorescence changed from yellow to green gradually (Fig. 3b). Finally, the fluorescence of the crystal was blue-shifted by 17 nm when the crystal was stretched to the maximal strain of 3.56% (Fig. 3c). Note that the fluorescence intensity enhances with the increase of tensile strain (ESI Fig. S10†). It is also worth noting that this property does not depend on the different crystal faces of the crystal. Emission spectra of (100) and (001) faces of stretching crystal were obtained, and it turned out that both have the same blue shift (ESI Fig. S11†). The change of emission wavelength and strain is linearly correlated with the slope 485.85, and the linear fitted curve's R2 was calculated to be 99.03%, as shown in Fig. 3d. To ensure the experimental result is not accidental, four other crystals were picked to conduct parallel experiments. Likewise, the linear correlations between the emission wavelength change and strain were obtained, and the slopes of the fitted curves were nearly close from 454 to 479 (ESI Fig. S12†). The relations among force, stress and strain follow eqn (1)–(3):46
 | (1) |
 | (2) |
 | (3) |
The elastic modulus of crystals is a material intrinsic property so crystals will preserve the feature even though their shape is changing, like stretching or bending. The stress–strain graph indicates that the elastic modulus of the crystal is 1.3 GPa (Fig. 3e). Based on five parallel experiments, the average modulus value was calculated to be 1.3 GPa (ESI Fig. S13 and Table S2†). Crystal width and thickness can be measured using a high-power microscope (ESI Fig. S14 and S15†). The force signal can be transformed to optical signal via this MMIAB crystal, so the crystals have potential to be used as a mechanical sensing material. Associating the mathematical formula mentioned above, the stretching force can be calculated by monitoring the changes of a high quality crystal emission wavelength. The linear range of strain-emission wavelength shift agrees with the linear range of strain–stress, and these two sets of data were obtained simultaneously during the tensile test of the same crystal.
To verify whether the stretching process is reversible, the crystal stretching fatigue test was carried out. The crystal was stretched at a fixed displacement of 0.15 mm with a stretching strain of 2.47%. The emission wavelength blue shifted by 12 nm when the crystal was stretched. Then, the mechanical grip went back to the initial position by the program set in the universal testing system, and the initial PL spectrum was retained. This process was repeated five times, and each time the crystal had the same blue shift and then recovered to the initial state without fracture (Fig. 3f). X-ray diffraction measurements also demonstrated the restorability of stretching. The diffraction peak of the (100) plane from 5.32° shifted to 5.39° under stretching. The distance between the (100) plane and (200) plane changed from 16.60 Å to 16.38 Å, which is calculated using the Bragg equation. When the crystal recovered, the peaks almost returned to the original position, which indicated that the crystal lattice was also recovered (ESI Fig. S16†). To sum up, this experiment result proves that the tensile deformation of the MMIAB crystal is reversible.
As a mechanical sensor, the MMIAB crystal can not only be reused, but also supervise a slight change of force. The wavelength changes in the presence of a load were monitored to show the efficiency of load detection (ESI Fig. S17†). The limit of detection and sensitivity were calculated to be 0.03 N and 64.50 nm N−1, respectively. A low detection limit and high sensitivity mean that the crystal can be used to detect small tension changes in some precision instruments. In addition, the excellent elasticity and twistable capability of the crystal endow the sensor with anti-vibration ability either in horizontal direction or vertical direction.
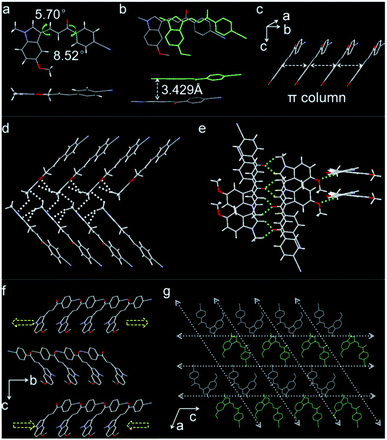
To reveal the mechanism of the crystal's properties, single-crystal X-ray diffraction measurement was performed. The compound crystallized in a monoclinic system and C21/c space group, and its molecular skeleton shows high planarity with the torsion angles around two single chemical bonds between the benzene ring and the indole ring being 8.52° and 5.70°, respectively (Fig. 4a). The molecules stacked in parallel and formed column structures based on π⋯π interactions with a vertical distance of 3.43 Å along the crystallographic [010] direction (Fig. 4b and c). Due to the existence of the C–H⋯π interactions, the molecules linked with each other to form the molecular chain, and the C–H⋯π distance was in the range of 2.718 Å to 2.895 Å (Fig. 4d). Meanwhile, ample C–H⋯π interactions and C–H⋯O interactions (Fig. 4e) existed among the molecular layers; the range of C–H⋯O distance was from 2.510 Å to 2.535 Å. The abundant intermolecular interactions along the crystal a-axis generated the bendable (100) plane (ESI Fig. S18†). Outer interactions' expansion and inner interactions' contraction buffered the bending force effectively,47,48 which meets the requirements of crystal elasticity (Fig. 4f).
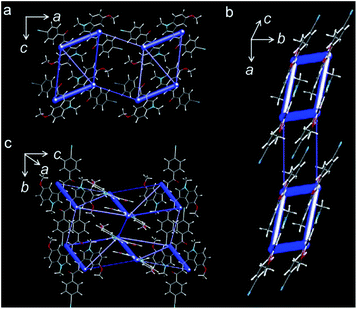
Additionally, the parallel packing structures and interspaces between molecular layers make the plastic twisting possible.41 When double methyl groups are opposite, there were intermolecular interactions between two adjacent molecular layers to connect each other. However, when double cyano groups are opposite, the intermolecular interactions disappeared as the cyano groups are far from others (Fig. 4g). So this part packing structure makes the molecules slip easily, which is more beneficial to the plastic twisting of the crystal. When the twisting force is applied to the crystal, the molecules with weak interactions will slip directly and the C–H⋯π and C–H⋯O interactions among molecules will be affected first, then these interactions will resume to make the crystal structure stable. This is the plastic twisting process. The unit cell in the twisted part of the crystal has clearly changed, which was confirmed by X-ray diffraction patterns (ESI Fig. S19†). The diffraction points of the straight part are clear, and the diffraction peaks are high. For the twisted part, the diffraction points deviated from their original position and the diffraction peak intensity decreased. The results demonstrated that the twisting process changed the unit cells tremendously. Energy calculations among the molecules in one unit cell could help comprehend the crystal bendable and twistable capability (Fig. 5a–c). Energy framework analyses were performed by CrystalExplorer49 using the B3LYP hybrid functional with 6-31G(d,p) basis set, where semiempirical dispersion was included using the D2 version of Grimme's dispersion. The thickness of blue bars represents the high or low energies. The calculated results were consistent with the single-crystal X-ray diffraction results. All the molecules that have plentiful C–H⋯π and C–H⋯O interactions have higher energy, and the blue bars around these molecules are thicker. Meanwhile, the energy between neighboring molecules whose cyano groups are opposite is low, verifying the weak interactions between them. The energy frameworks further illustrated the crystal bendable and twistable capability.
The face indexing confirmed that the crystal growth was along the b-axis. The distance between two molecules would increase with the strengthening of stretching. The connecting link between the double N atoms of adjacent cyano groups was parallel to the b-axis. The distance between two N atoms in the initial condition was determined to be 4.904 Å, and the angle between the benzene ring and the N⋯N connecting line was 46.65°. Thus, a simple triangular mathematical model was established to calculate the change of π⋯π distance. The crystal with the maximal strain of 3.56% was taken here as an example. In this case, the N⋯N distance changed to 5.079 Å, and the π⋯π distance was calculated to be 3.693 Å. Compared to the initial π⋯π distance of 3.429 Å, the length of the stretched crystal had distinct enlargement, which is the reason the emission wavelength showed hypsochromic shift upon stretching.
To understand the relationship between the stretching process and emission shift in depth, theoretical calculations were performed by ORCA,50,51 using CAM-B3LYP/def2-SV(P)52,53 with Grimme D3 dispersion correction.54 The dimer was utilized as the model created by the initial crystal structure and dimerscan.55 The initial excitation energy of the crystal was 3.691 eV, and the emission energy was 2.990 eV. When the crystal was stretching at 3.56% strain, the excitation energy and emission energy changed to 3.758 eV and 3.009 eV, respectively (ESI Fig. S20†). The increase in both of these energy values proved that the wavelength of the crystal emission moves towards the higher energy; thus, the emission peak of the crystal should have blue shifts. The theoretical study was in good agreement with the experimental results.
Conclusions
A crystal with the ability of elastic bending and plastic twisting was obtained. A more significant finding was that the crystal could respond to tensile forces with blue shifts of fluorescence, and this process was reversible within a certain strain. Theoretical calculations revealed the relationship between molecular movements and crystal fluorescence during the stretching process. The linear correlation between the wavelength change and strain was gained for the first time. It was of great significance to explore the influence of structural changes on crystal emission. Moreover, it proved that the crystal has potential application as a mechanical sensor. Low detection limits and high sensitivity indicate that the crystal can detect small tension changes. This work breaks the limitation of a crystal's difficulty in responding to tensile force and further expands the application of organic crystals in the sensing field.Author contributions
Q. Di did the experiments and analysis, validated the results, and wrote the manuscript. Z. Zhang and B. Tang contributed to the material synthesis. X. Yu, J. Li and Houyu Zhang contributed to the theoretical calculations. Hongyu Zhang provided key advice and supervised the study.Conflicts of interest
There are no conflicts to declare.Acknowledgements
This work was supported by the National Natural Science Foundation of China (51773077) and the Graduate Innovation Fund of Jilin University.Notes and references
- M. An, R. Ding, Q. Zhu, G. Ye, H. Wang, M. Du, S. Chen, Y. Liu, M. Xu, T. Xu, W. Wang, J. Feng and H. Sun, Adv. Funct. Mater., 2020, 30, 2002422 CrossRef CAS.
- S. Wu, H. Xia, J. Xu, X. Sun and X. Liu, Adv. Mater., 2018, 30, 1803362 CrossRef PubMed.
- S. Ma, M. Wei, S. K. Rajendran, M. Karl, B. Xu, M. C. Gather, W. Tian, G. A. Turnbull and I. D. W. Samuel, Adv. Opt. Mater., 2020, 8, 1901785 CrossRef CAS.
- P. Baronas, G. Kreiza, M. Mamada, S. Maedera, P. Adomėnas, O. Adomėnienė, K. Kazlauskas, C. Adachi and S. Juršėnas, Adv. Opt. Mater., 2020, 8, 1901670 CrossRef CAS.
- J. M. Halabi, E. Ahmed, L. Catalano, D. P. Karothu, R. Rezgui and P. Naumov, J. Am. Chem. Soc., 2019, 141, 14966–14970 CrossRef CAS PubMed.
- B. Liu, Z. Lu, B. Tang, H. Liu, H. Liu, Z. Zhang, K. Ye and H. Zhang, Angew. Chem., Int. Ed., 2020, 59, 23117–23121 CrossRef CAS PubMed.
- L. Catalano, D. P. Karothu, S. Schramm, E. Ahmed, R. Rezgui, T. J. Barber, A. Famulari and P. Naumov, Angew. Chem., Int. Ed., 2018, 57, 17254–17258 CrossRef CAS PubMed.
- R. Huang, B. Tang, K. Ye, C. Wang and H. Zhang, Adv. Opt. Mater., 2019, 7, 1900927 CrossRef CAS.
- B. Liu, Q. Di, W. Liu, C. Wang, Y. Wang and H. Zhang, J. Phys. Chem. Lett., 2019, 10, 1437–1442 CrossRef CAS PubMed.
- H. Liu, Z. Bian, Q. Cheng, L. Lan, Y. Wang and H. Zhang, Chem. Sci., 2019, 10, 227 RSC.
- R. Huang, C. Wang, Y. Wang and H. Zhang, Adv. Mater., 2018, 30, 1800814 CrossRef PubMed.
- Z. Lu, Y. Zhang, H. Liu, K. Ye, W. Liu and H. Zhang, Angew. Chem., Int. Ed., 2020, 59, 4299–4303 CrossRef CAS PubMed.
- J. Peng, J. Zhao, K. Ye, H. Gao, J. Sun and R. Lu, Chem.–Asian J., 2018, 13, 1719–1724 CrossRef CAS PubMed.
- A. Hirano, T. Hashimoto, D. Kitagawa, K. Kono and S. Kobatake, Cryst. Growth Des., 2017, 17, 4819–4825 CrossRef CAS.
- Z. Skoko, S. Zamir, P. Naumov and J. Bernstein, J. Am. Chem. Soc., 2010, 132, 14191–14202 CrossRef CAS PubMed.
- Y. Takahashi, T. Kondo, S. Yokokura, M. Takehisa, J. Harada, T. Inabe, M. M. Matsushita and K. Awaga, Cryst. Growth Des., 2020, 20, 4758–4763 CrossRef CAS.
- Q. Sun, L. Tang, Z. Zhang, K. Zhang, Z. Xie, Z. Chi, H. Zhang and W. Yang, Chem. Commun., 2018, 54, 94–97 RSC.
- J. Li, J. Zhou, Z. Mao, Z. Xie, Z. Yang, B. Xu, C. Liu, X. Chen, D. Ren, H. Pan, G. Shi, Y. Zhang and Z. Chi, Angew. Chem., 2018, 130, 6559–6563 CrossRef.
- B. Xu, J. He, Y. Mu, Q. Zhu, S. Wu, Y. Wang, Y. Zhang, C. Jin, C. Lo, Z. Chi, A. Lien, S. Liua and J. Xu, Chem. Sci., 2015, 6, 3236–3241 RSC.
- C. Wang, B. Xu, M. Li, Z. Chi, Y. Xie, Q. Li and Z. Li, Mater. Horiz., 2016, 3, 220–225 RSC.
- J. Tu, Y. Fan, J. Wang, X. Li, F. Liu, M. Han, C. Wang and Z. Li, J. Mater. Chem. C, 2019, 7, 12256–12262 RSC.
- Y. Xie, J. Tu, T. Zhang, J. Wang, Z. Xie, Z. Chi, Q. Peng and Z. Li, Chem. Commun., 2017, 53, 11330–11333 RSC.
- L. Wang, K. Wang, B. Zou, K. Ye, H. Zhang and Y. Wang, Adv. Mater., 2015, 27, 2918–2922 CrossRef CAS PubMed.
- B. Bhattacharya, D. Roy, S. Dey, A. Puthuvakkal, S. Bhunia, S. Mondal, R. Chowdhury, M. Bhattacharya, M. Mandal, K. Manoj, P. K. Mandal and C. M. Reddy, Angew. Chem., Int. Ed., 2020, 59, 19878–19883 CrossRef CAS PubMed.
- V. C. Wakchaure, K. C. Ranjeesh, Goudappagouda, T. Das, K. Vanka, R. Gonnade and S. S. Babu, Chem. Commun., 2018, 54, 6028–6031 RSC.
- A. Chowdhury, P. Howlader and P. S. Mukherjee, Chem.–Eur. J., 2016, 22, 1424–1434 CrossRef CAS PubMed.
- H. Zhang, S. Yang, Z. Yang, D. Wang, J. Han, C. Li, C. Zhu, J. Xu and N. Zhao, ACS Appl. Mater. Interfaces, 2021, 13, 4499–4507 CrossRef CAS PubMed.
- Y. Wang, C. Zhu, R. Pfattner, H. Yan, L. Jin, S. Chen, F. Molina-Lopez, F. Lissel, J. Liu, N. I. Rabiah, Z. Chen, J. W. Chung, C. Linder, M. F. Toney, B. Murmann and Z. Bao, Sci. Adv., 2017, 3, e1602076 CrossRef PubMed.
- E. Ducrot, Y. Chen, M. Bulters, R. P. Sijbesma and C. Creton, Science, 2014, 344, 186–189 CrossRef CAS PubMed.
- Y. Sagara, H. Traeger, J. Li, Y. Okado, S. Schrettl, N. Tamaoki and C. Weder, J. Am. Chem. Soc., 2021, 143, 5519–5525 CrossRef CAS PubMed.
- S. Ghosh and C. M. Reddy, Angew. Chem., Int. Ed., 2012, 51, 10319–10323 CrossRef CAS PubMed.
- A. G. Shtukenberg, Y. O. Punin, A. Gujral and B. Kahr, Angew. Chem., Int. Ed., 2014, 53, 672–699 CrossRef CAS PubMed.
- C. Li, A. G. Shtukenberg, D. J. Carter, X. Cui, I. Olson, A. L. Rohl, J. D. Gale, P. Raiteri and B. Kahr, J. Phys. Chem. C, 2018, 122, 25085–25091 CrossRef CAS.
- S. Basak and R. Chandrasekar, J. Mater. Chem. C, 2014, 2, 1404–1408 RSC.
- M. Annadhasan, D. P. Karothu, R. Chinnasamy, L. Catalano, E. Ahmed, S. Ghosh, P. Naumov and R. Chandrasekar, Angew. Chem., Int. Ed., 2020, 59, 13821–13830 CrossRef CAS PubMed.
- E. Ahmed, D. P. Karothu and P. Naumov, Angew. Chem., Int. Ed., 2018, 57, 8837–8846 CrossRef CAS PubMed.
- M. K. Panda, S. Ghosh, N. Yasuda, T. Moriwaki, G. D. Mukherjee, C. M. Reddy and P. Naumov, Nat. Chem., 2015, 7, 65–72 CrossRef CAS PubMed.
- P. Commins, A. B. Dippenaar, L. Li, H. Hara, D. A. Haynes and P. Naumov, Chem. Sci., 2021, 12, 6188–6193 RSC.
- M. Owczarek, K. A. Hujsak, D. P. Ferris, A. Prokofjevs, I. Majerz, P. Szklarz, H. Zhang, A. A. Sarjeant, C. L. Stern, R. Jakubas, S. Hong, V. P. Dravid and J. F. Stoddart, Nat. Commun., 2016, 7, 13108 CrossRef CAS PubMed.
- X. Chu, Z. Lu, B. Tang, B. Liu, K. Ye and H. Zhang, J. Phys. Chem. Lett., 2020, 11, 5433–5438 CrossRef CAS PubMed.
- T. Feiler, B. Bhattacharya, A. A. L. Michalchuk, S. Rhim, V. Schröder, E. List-Kratochvil and F. Emmerling, CrystEngComm, 2021, 23, 5815–5825 RSC.
- J. Maul, D. Ongari, S. M. Moosavi, B. Smit and A. Erba, J. Phys. Chem. Lett., 2020, 11, 8543–8548 CrossRef CAS PubMed.
- S. Hayashi, F. Ishiwari, T. Fukushima, S. Mikage, Y. Imamura, M. Tashiro and M. Katouda, Angew. Chem., Int. Ed., 2020, 59, 16195–16201 CrossRef CAS PubMed.
- D. Wang, X. Zhang, X. Han, Y. Zhou, Y. Lei, W. Gao, M. Liu, X. Huang and H. Wu, J. Mater. Chem. C, 2021, 9, 12868–12876 RSC.
- G. Xia, C. Qu, Y. Zhu, K. Ye, Z. Zhang and Y. Wang, J. Mater. Chem. C, 2021, 9, 6834 RSC.
- A. Worthy, A. Grosjean, M. C. Pfrunder, Y. Xu, C. Yan, G. Edwards, J. K. Clegg and J. C. McMurtrie, Nat. Chem., 2018, 10, 65–69 CrossRef CAS PubMed.
- H. Liu, Z. Lu, Z. Zhang, Y. Wang and H. Zhang, Angew. Chem., Int. Ed., 2018, 57, 8448–8452 CrossRef CAS PubMed.
- H. Liu, Z. Lu, B. Tang, C. Qu, Z. Zhang and H. Zhang, Angew. Chem., Int. Ed., 2020, 59, 12944–12950 CrossRef CAS PubMed.
- M. J. Turner, J. J. McKinnon, S. K. Wolff, D. J. Grimwood, P. R. Spackman, D. Jayatilaka and M. A. Spackman, CrystalExplorer17, University of Western Australia, Perth, 2017 Search PubMed.
- F. Neese, Wiley Interdiscip. Rev.: Comput. Mol. Sci., 2012, 2, 73–78 CAS.
- F. Neese, Wiley Interdiscip. Rev.: Comput. Mol. Sci., 2018, 8, e1327 Search PubMed.
- T. Yanaia, D. P. Tewb and N. C. Handy, Chem. Phys. Lett., 2004, 393, 51–57 CrossRef.
- F. Weigenda and R. Ahlrichs, Phys. Chem. Chem. Phys., 2005, 7, 3297–3305 RSC.
- S. Grimme, J. Antony, S. Ehrlich and H. Krieg, J. Chem. Phys., 2010, 132, 154104 CrossRef PubMed.
- T. Lu, dimerscan program, http://sobereva.com/soft/dimerscan, vol. 5, 2021 Search PubMed.
Footnote |
| † Electronic supplementary information (ESI) available. CCDC 2106756. For ESI and crystallographic data in CIF or other electronic format see DOI: 10.1039/d1sc03818d |
| This journal is © The Royal Society of Chemistry 2021 |

