
 Open Access Article
 This Open Access Article is licensed under a Creative Commons Attribution-Non Commercial 3.0 Unported Licence
A copper-free and enzyme-free click chemistry-mediated single quantum dot nanosensor for accurate detection of microRNAs in cancer cells and tissues†
Zi-yue
Wang‡
,
Dong-ling
Li‡
,
Xiaorui
Tian‡
and
Chun-yang
Zhang
 *
*
College of Chemistry, Chemical Engineering and Materials Science, Collaborative Innovation Center of Functionalized Probes for Chemical Imaging in Universities of Shandong, Key Laboratory of Molecular and Nano Probes, Ministry of Education, Shandong Provincial Key Laboratory of Clean Production of Fine Chemicals, Shandong Normal University, Jinan 250014, China. E-mail: cyzhang@sdnu.edu.cn; Fax: +86 0531-82615258; Tel: +86 0531-86186033
First published on 6th July 2021
Abstract
MicroRNAs (miRNAs) play key roles in the post-transcriptional regulation of genes, and their aberrant expression may disturb the normal gene regulation network to induce various diseases, and thus accurate detection of miRNAs is essential to early clinical diagnosis. Herein, we develop for the first time a single-quantum dot (QD)-based Förster resonance energy transfer (FRET) nanosensor to accurately detect miRNAs based on copper-free and enzyme-free cycling click chemistry-mediated tricyclic ligase chain reaction (LCR) amplification. We design four DNA probes namely DNA probes 1–4, with DNA probes 1 and 3 being modified with azide (N3) and DNA probes 2 and 4 being modified with dibenzocyclooctyne (DBCO). When target miRNA is present, DNA probes 1 and 2 can proceed via copper-free and enzyme-free click chemistry to generate the probes 1–2 ligation product. Subsequently, DNA probes 3 and 4 can hybridize with the probes 1–2 ligation product to generate the probes 3–4 ligation product. Both the probes 1–2 ligation product and probes 3–4 ligation product can act as the templates to initiate cycling click chemistry-mediated tricyclic LCR amplification whose products can be easily measured by the single-QD-based FRET nanosensor. This assay does not involve any enzymatic reverse transcription, copper catalyst, and ligase enzyme, and it exhibits excellent selectivity, high sensitivity, and the capability of differentiating even single-base mismatches. Moreover, this nanosensor can accurately quantify miRNA-155 even at the single-cell level, and it can distinguish the miRNA-155 expression in tissues of healthy persons and nonsmall cell lung cancer (NSCLC) patients.
Introduction
MicroRNAs (miRNAs) are a large family of small non-coding endogenous RNA molecules with ∼22 nt length, and they are produced by a 70 base-sized single stranded RNA precursor with the assistance of Dicer enzyme processing.1 MiRNAs play key roles in the post-transcriptional regulation of genes,2,3 cell differentiation,4 and apoptosis.5 More than 1000 miRNAs identified in humans6 control the activities of over 60% of human protein coding genes.7 Especially, the aberrant expression of miRNAs may inevitably disturb the normal gene regulation network to induce various pathologies such as diabetes,8 neurodegenerative disease,9 myocardial disease10 and cancers (e.g., breast, ovarian, and lung cancers).11 Therefore, miRNAs may function as the potential biomarkers for clinical diagnosis,12 prognosis,13 and cancer therapy,14 and accurate detection of miRNA in a cancer patient's cells and tissues is of significance for early clinical diagnosis and anticancer drug discovery.15,16 However, the unique characteristics of miRNAs (i.e., low abundance, short survival time, small size, and similar member sequence) make it difficult to accurately detect miRNAs.17Traditional methods for the miRNA assay include microarrays,18 next generation sequencing19 and northern blotting.20 Microarrays are characterized by low cost and high throughput, but they involve complicated data analysis with poor sensitivity.18 The next generation sequencing enables high-throughput RNA sequencing, but it cannot be applied for absolute quantification.18,19 Northern blotting is the standard method of miRNA assay,21 but it involves large sample consumption and time-consuming steps with poor sensitivity. Alternatively, quantitative reverse transcriptase polymerase chain reaction (qRT-PCR) can greatly improve the detection sensitivity,22 but the reverse transcription step of converting miRNA to cDNA inevitably increases the probe design complexity and the experimental cost.23 Recently, ligase chain reaction (LCR) was introduced for the miRNA assay to achieve high specificity and high sensitivity,24 without the need for enzymatic reverse transcription of target RNA to the corresponding cDNA. However, the enzymatic ligation efficiency of conventional enzyme-dependent LCR is usually low (typically <50%).25 In addition, the enzyme activities may be disturbed by the environmental factors and reaction media, leading to poor reproducibility.26 In contrast, the click chemistry-assisted ligation can be chosen as an excellent ligation strategy to simulate the action of ligase.27 The classical click chemistry is copper(I)-catalyzed alkyne–azide Huisgen cycloaddition with high ligation yield and excellent specificity under relatively mild reaction conditions.28 Alternatively, the copper-free click chemistry between dibenzocyclooctyne (DBCO)-modified DNA and azide (N3)-modified DNA enables the ligation of nucleic acid sequences with the advantages of proceeding spontaneously and no metal catalyst involved.29 To the best of our knowledge, the copper-free and enzyme-free cycling click chemistry-mediated LCR amplification for sensitive miRNA detection has not been explored.
Quantum dots (QDs) have emerged as novel semi-conductor nanomaterials and fluorescent labels with superior physical and optical properties over fluorescent proteins and organic fluorophores, including broad absorption spectra, large Stokes shift, high quantum yield, long fluorescence lifetime, narrow and size-tunable emission spectra, and excellent photostability.30–33 Single-molecule detection can sensitively quantify target analytes at the single-molecule level with distinct advantages of high sensitivity and low sample consumption.34 The integration of QDs with single-molecule detection facilitates the construction of single QD-based nanosensors.35,36 Herein, we develop a copper-free and enzyme-free click chemistry-mediated single QD nanosensor for accurate detection of microRNAs in cancer cells and tissues. We design four DNA probes namely DNA probes 1–4 (Table 1), with DNA probes 1 and 3 being modified with N3 and DNA probes 2 and 4 being modified with DBCO. When target miRNA is present, DNA probes 1 and 2 can proceed via copper-free and enzyme-free click chemistry to generate the probes 1–2 ligation product. Subsequently, DNA probes 3 and 4 can hybridize with the probes 1–2 ligation product to generate the probes 3–4 ligation product. Both the probes 1–2 ligation product and probes 3–4 ligation product can act as templates to initiate cycling click chemistry-mediated tricyclic LCR amplification whose products can be easily measured by the single-QD-based Förster resonance energy transfer (FRET) nanosensor. This nanosensor is very sensitive and it can differentiate even a single-base mismatch. Moreover, this nanosensor can be applied for the measurement of miRNA-155 in HeLa cells and MCF-7 cells at the single-cell level, and it can distinguish the miR-155 expression in tissues of healthy persons and nonsmall cell lung cancer (NSCLC) patients.
| Name | Sequence (5′–3′) |
|---|---|
| a In probe 2, the “*” indicates the phosphorothioate group. Mismatched single bases are indicated with the underline. | |
| miRNA-155 | UUA AUG CUA AUC GUG AUA GGG GU |
| DNA probe 1 | ACC CCT ATC AC-N3 |
| DNA probe 2 | DBCO-GAT TAG CAT TAA *T*T*T |
| DNA probe 3 | N3-GTG ATA GGG GT |
| DNA probe 4 | AAA TTA ATG CTA ATC-DBCO |
| PCR-primer | TTA ATG CTA ATC GTG ATA GGG GT |
| Synthetic probes 1–2 ligation product | ACC CCT ATC ACG ATT AGC ATT AAT TT |
| Let-7a | UGA GGU AGU AGG UUG UAU AGU U |
| miRNA-141 | UAA CAC UGU CUG GUA AAG AUG G |
| miRNA-210 | CUG UGC GUG UGA CAG CGG CUG A |
| miRNA-214 | ACA GCA GGC ACA GAC AGG CAG U |
| Mismatched target 1 | UUA AUG CUA AU![[A with combining low line]](https://www.rsc.org/images/entities/char_0041_0332.gif) GUG AUA GGG GU GUG AUA GGG GU |
| Mismatched target 2 | UUA AUG CUA AU![[U with combining low line]](https://www.rsc.org/images/entities/char_0055_0332.gif) GUG AUA GGG GU GUG AUA GGG GU |
| Mismatched target 3 | UUA AUG CUA AUC UG AUA GGG GU |
| Mismatched target 4 | UUA AUG CUA AUC UG AUA GGG GU |
| Capture probe | GTG ATA GGG GT-biotin |
| Signal probe | AAA TTA ATG CT-Cy5A ATC |
Results and discussion
The principle of the copper-free and enzyme-free click chemistry-mediated single QD nanosensor for the microRNA assay is shown in Scheme 1. This assay involves (1) miRNA-actuated click chemistry-mediated tricyclic LCR amplification and (2) single-QD-based FRET measurement. We used miRNA-155 (Scheme 1, yellow color) as a model target. The miRNA-155 is overexpressed in various cancers including human cervical cancer and breast cancer.37,38 DNA probes 1 and 2 (Scheme 1, green color) are specially designed to initiate the click chemistry-mediated ligation reaction. DNA probe 1 (Scheme 1, green color) contains an azide (N3) modification (Scheme 1, brilliant blue color) at the 3′ end, and probe 2 (Scheme 1, green color) is modified with some phosphorothioates (Scheme 1, gray color) at the 3′ end and a dibenzocyclooctyne (DBCO) (Scheme 1, yellow color) at the 5′ end, respectively. When target miRNA-155 (Scheme 1, yellow color) is present, it hybridizes with DNA probes 1 and 2 (Scheme 1, green color) to form a sandwich hybrid, bringing DBCO (Scheme 1, yellow color) and N3 (Scheme 1, brilliant blue color) groups into close proximity to form the triazol linkage (Scheme 1, pink color) and complete click chemical ligation in PBS solution (pH = 7.4) (Scheme S1†). The resultant probes 1–2 ligation product (Scheme 1, green color) with the triazol linkage (Scheme 1, pink color) can be used as the template for the following tricyclic LCR reaction. The subsequent denaturation at 85 °C results in the release of target miRNA-155 (Scheme 1, yellow color) which can hybridize with new DNA probes 1 and 2 (Scheme 1, green color) to initiate the cyclic click chemical ligation reaction through the thermal cycle of 85 °C and 25 °C, generating numerous probes 1–2 ligation products (Scheme 1, green color, first cycle) with the triazol linkage (Scheme 1, pink color). Subsequently, we introduced DNA probes 3 and 4 (Scheme 1, red color) which are complementary to DNA probes 1 and 2 (Scheme 1, green color), respectively. DNA probe 3 (Scheme 1, red color) is modified with a N3 (Scheme 1, brilliant blue color) at the 5′ end, and DNA probe 4 (Scheme 1, red color) is modified with DBCO (Scheme 1, yellow color) at the 3′ end. The probes 1–2 ligation products (Scheme 1, green color) with the triazol linkage (Scheme 1, pink color) obtained in the first cycle can act as the templates for DNA probes 3 and 4 (Scheme 1, red color) to obtain the probes 3–4 ligation product (Scheme 1, red color) with the triazol linkage (Scheme 1, pink color) after the click reaction-mediated ligation. The denaturation at 85 °C induces the release of probes 3–4 ligation products (Scheme 1, red color), and the probe 1–2 ligation products (Scheme 1, green color) will unceasingly hybridize with new DNA probes 3 and 4 (Scheme 1, red color) to initiate the cyclic ligation reaction through the thermal cycle of 85 °C and 25 °C, generating abundant probes 3–4 ligation products (Scheme 1, red color, second cycle) with the triazol linkage (Scheme 1, pink color). The probes 3–4 ligation products (Scheme 1, red color) with the triazol linkage (Scheme 1, pink color) obtained in the second cycle can act as the new templates for free DNA probes 1 and 2 (Scheme 1, green color) to obtain abundant new probes 1–2 ligation products (Scheme 1, green color) with the triazol linkage (Scheme 1, pink color) through cycle click reaction-mediated ligation with a thermal cycle of 85 °C and 25 °C (Scheme 1, third cycle). The subsequent addition of Exo III and Exo I can digest the excess DNA probe 1 (Scheme 1, green color), probe 3 (Scheme 1, red color), probe 4 (Scheme 1, red color), and the probes 3–4 ligation product (Scheme 1, red color), but the DNA probes 1–2 ligation product (Scheme 1, green color) cannot be digested due to the phosphorothioate modification (Scheme 1, gray color) of DNA probe 2 (Scheme 1, green color) which can prevent the digestion of Exo III and Exo I. The remaining probes 1–2 ligation products (Scheme 1, green color) can hybridize with the biotinylated capture probes (Scheme 1, blue color) and Cy5-modified reporter probes (Scheme 1, purple color) to obtain the sandwich hybrids which can self-assemble onto the streptavidin-functionalized 605 nm-emitting QD to obtain the QD–oligonucleotide–Cy5 nanostructure via the streptavidin–biotin interaction (Scheme 1), inducing efficient FRET between the QD donor and Cy5 acceptor and consequently the emission of Cy5. Notably, in this FRET nanosensor with 605 nm-emitting QDs as the donor and Cy5 as the acceptor, there is significant spectral overlap between the emission spectrum of QDs (Fig. S1,† red line) and the absorption spectrum of Cy5 (Fig. S1,† blue line), facilitating efficient FRET from the QD donor to the Cy5 acceptor. Moreover, when the excitation wavelength is 488 nm, there is neither direct excitation of Cy5 nor crosstalk between QD and Cy5 emission spectra (Fig. S1†). Consequently, the miRNA-155 (Scheme 1, yellow color) concentration can be simply measured by quantifying the Cy5 signals. When target miRNA-155 (Scheme 1, yellow color) is absent, no click chemical ligation reaction occurs between N3 (Scheme 1, brilliant blue color) and DBCO (Scheme 1, yellow color) because the two DNA probes are far from each other. As a result, neither the probes 1–2 ligation product (Scheme 1, green color) with the triazol linkage (Scheme 1, pink color) nor the QD–oligonucleotides–Cy5 nanostructure can be obtained, and thus no Cy5 emission can be detected.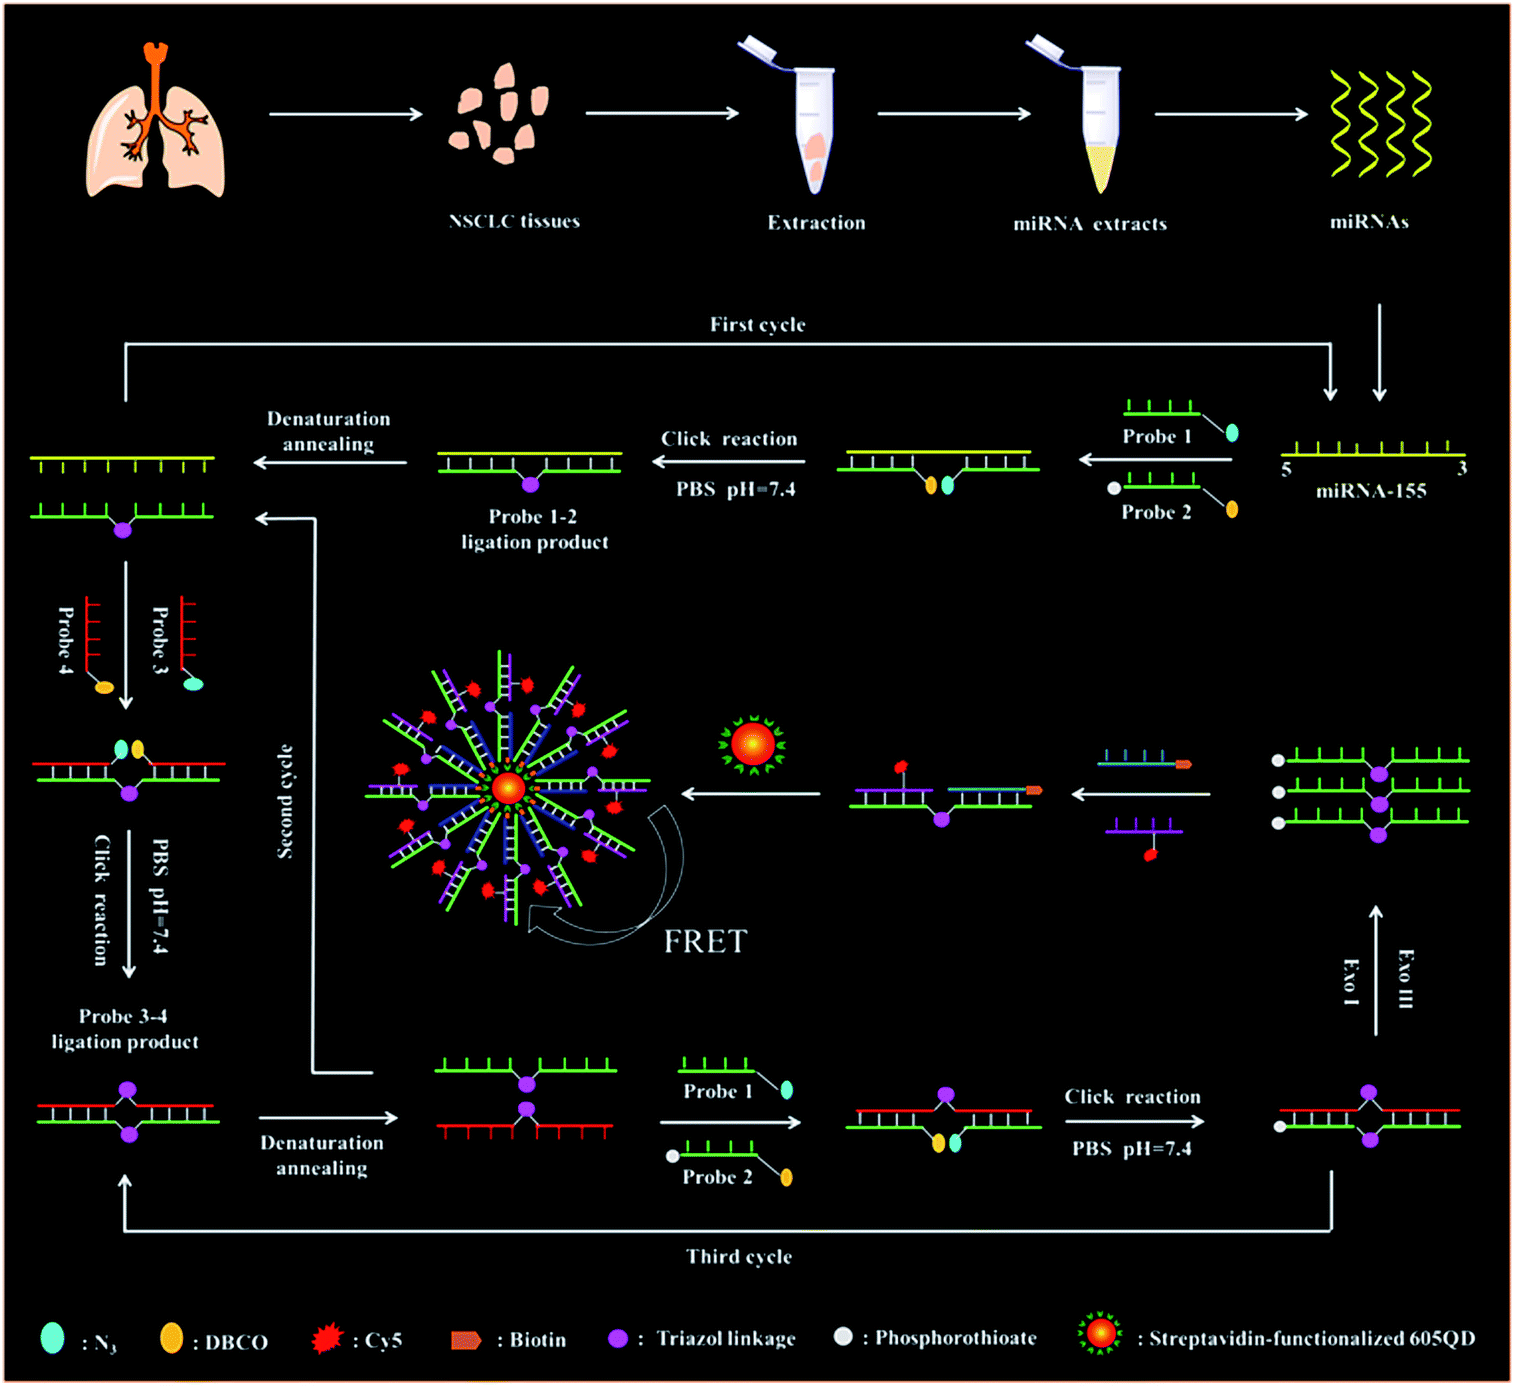 | ||
| Scheme 1 Schematic diagram of the copper-free and enzyme-free click chemistry-mediated single QD nanosensor for the microRNA assay. | ||
We performed nondenaturating polyacrylamide gel electrophoresis (PAGE) and fluorescence measurements to verify this assay (Fig. 1). This assay mainly relies on miRNA-actuated enzyme-free click chemistry ligation for the initiation of tricyclic LCR amplification. The 12% nondenaturating PAGE with SYBR gold as the indicator was used to analyze the LCR amplification products (Fig. 1A). In the absence of miRNA-155, only two bands of 11 bp and 15 bp are observed (Fig. 1A, lane 4), which are identical to the DNA probes 1–3 hybridization product (Fig. 1A, lane 2) and the DNA probes 2–4 hybridization product (Fig. 1A, lane 3), respectively, indicating that neither click chemistry ligation nor LCR amplification occurs. In contrast, the presence of miRNA results in the generation of a distinct new band of 26 bp (Fig. 1A, lane 5), which is the final hybridization product of the DNA probes 1–2 ligation product and DNA probes 3–4 ligation product, indicating that miRNA-155 can successfully initiate cycling click chemistry-mediated tricyclic LCR amplification.
 | ||
| Fig. 1 (A) Analysis of LCR reaction by nondenaturing PAGE with SYBR gold as the indicator. Lane 1, miRNA-155; lane 2, DNA probe 1 + DNA probe 3; lane 3, DNA probe 2 + DNA probe 4; lane 4, DNA probe 1 + DNA probe 2 + DNA probe 3 + DNA probe 4; lane 5, miRNA-155 + DNA probe 1 + DNA probe 2 + DNA probe 3 + DNA probe 4. The miRNA-155 concentration is 500 nM, and the concentration of each DNA probe is 2 μM. (B) Measurement of fluorescence emission spectra in the absence (black curve) and presence (red curve) of miRNA-155. The inset shows the magnified fluorescence spectra from 660 to 690 nm. The concentration of each DNA probe is 100 nM, and the miRNA-155 concentration is 10 nM. (C) Fluorescence lifetime curves of the QD in the absence (control, black line) and presence (red line) of miRNA-155. The lifetime was measured in the emission channel of 605 nm. | ||
We measured the fluorescence emission spectra of QD and Cy5 in the absence (Fig. 1B, black curve) and presence (Fig. 1B, red curve) of miRNA-155 (Fig. 1B). When miRNA-155 is absent, no click reaction-mediated LCR amplification can be initiated and no Cy5-modified reporter probes can assemble on the QD surface. As a result, only the QD fluorescence signal is detected, but no significant Cy5 fluorescence signal is observed (Fig. 1B, black curve). In contrast, the presence of miRNA-155 can initiate copper-free and enzyme-free cycling click chemistry-mediated tricyclic LCR amplification to generate abundant probes 1–2 ligation products which can hybridize with biotinylated capture probes and Cy5-modified reporter probes to obtain the QD–oligonucleotide–Cy5 nanostructures. Consequently, efficient FRET from the QD to Cy5 occurs, resulting in the decrease of the QD fluorescence signal and the increase of the Cy5 fluorescence signal (Fig. 1B, red line). The FRET efficiency (E) is calculated to be 59% based on eqn (1).
| E (%) = (1 − FDA/FD) × 100% | (1) |
To further verify efficient FRET between the QD and Cy5 in the QD–oligonucleotide–Cy5 nanostructure, we measured the fluorescence lifetime of QDs (Fig. 1C). The average lifetime of QDs is 26.44 ns when miRNA-155 is absent (Fig. 1C, black line), whereas the average lifetime of the QD is reduced to 9.68 ns in the presence of miRNA-155 (Fig. 1C, red line), indicating the miRNA-155-induced efficient FRET between the QD and Cy5. The FRET efficiency (E) is calculated to be 63% according to eqn (2).
| E (%) = (1 − τDA/τD) × 100% | (2) |
We employed total internal reflection fluorescence (TIRF) microscopy to record the single-molecule fluorescence images of QDs and Cy5 (Fig. 2). When miRNA-155 is absent, only the QD signals are observed in the donor channel (Fig. 2A, green color), but no Cy5 signal is detected in the acceptor channel (Fig. 2B, red color). In contrast, the presence of miRNA-155 induces the simultaneous generation of both QD (Fig. 2D, green color) and Cy5 signals (Fig. 2E, red color) whose perfect colocalization leads to the appearance of yellow color in the overlay channel (Fig. 2F, yellow color). Notably, the presence of miRNA-155 induces efficient FRET from the QD to Cy5, resulting in the decrease of single QD fluorescence intensity (Fig. 2D, green color) compared with that in the absence of miRNA-155 (Fig. 2A, green color) and meanwhile the appearance of the Cy5 fluorescence signal (Fig. 2E, red color). Therefore, the miRNA-155 concentration can be measured by quantifying the Cy5 signals.
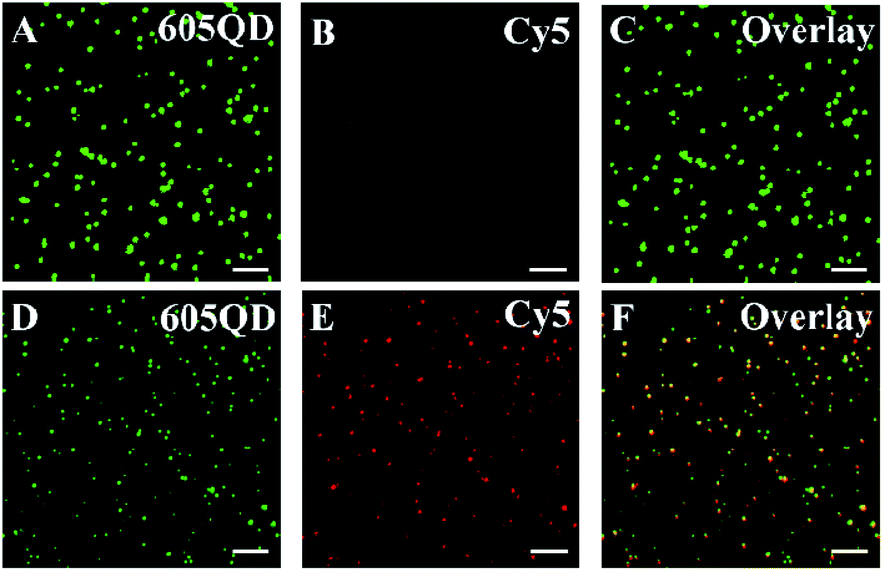 | ||
| Fig. 2 Single-molecule fluorescence image in the absence (A–C) and presence (D–F) of miRNA-155. The QD signal is indicated by green (A and D), and the Cy5 signal is indicated by red (B and E). The colocalization of the QD and Cy5 signals is indicated by yellow (C and F). The concentration of each DNA probe is 100 nM, and the miRNA-155 concentration is 10 nM. The scale bar is 5 μm. | ||
We measured the variance of Cy5 counts with different concentrations of miRNA-155 using the single QD-based nanosensor under the optimized experimental conditions (Fig. S2–S5†). As shown in Fig. 3, the Cy5 counts enhance with the increasing concentration of miRNA-155 from 1 × 10⁻¹⁶ to 1 × 10⁻⁸ M, and a good linear correlation is obtained between the Cy5 counts and the logarithm of miRNA-155 concentration over 7 orders of magnitude in the range of 1 × 10⁻¹⁶–1 × 10⁻⁹ M (inset of Fig. 3). The regression equation is N = 407.72 + 23.38![[thin space (1/6-em)]](https://www.rsc.org/images/entities/char_2009.gif) log10C (R2 = 0.9978), where N is the Cy5 count and C is the miRNA-155 concentration. The limit of detection is calculated to be 3.87 × 10⁻¹⁷ M by calculating the control group plus three times the standard deviation, which is superior to that of ensemble fluorescence measurement (Fig. S6†). The sensitivity of this FRET nanosensor has been enhanced by 5684.75-fold compared with that of label-free fluorescent assay,39 2583.98-fold compared with that of the nano-photon switch fluorescent assay,40 300.52-fold compared with that of the peptide nucleic acid-based electrochemical assay,41 and 258.40-fold compared with that of the nanostructure-based electrochemical assay.42 The enhanced sensitivity can be ascribed to the following four factors: (1) the high efficiency of the click reaction-mediated ligation reaction can generate abundant DNA probes 1–2 ligation products and DNA probes 3–4 ligation products to initiate the tricyclic LCR amplification reaction, (2) the high amplification efficiency of tricyclic LCR can generate large amounts of DNA probes 1–2 ligation product, (3) the improved FRET efficiency results from single QD/multiple Cy5 acceptors in the QD–oligonucleotides–Cy5 nanosensor, and (4) the single-molecule detection has characteristics of high signal-to-noise ratio and the near-zero background.
log10C (R2 = 0.9978), where N is the Cy5 count and C is the miRNA-155 concentration. The limit of detection is calculated to be 3.87 × 10⁻¹⁷ M by calculating the control group plus three times the standard deviation, which is superior to that of ensemble fluorescence measurement (Fig. S6†). The sensitivity of this FRET nanosensor has been enhanced by 5684.75-fold compared with that of label-free fluorescent assay,39 2583.98-fold compared with that of the nano-photon switch fluorescent assay,40 300.52-fold compared with that of the peptide nucleic acid-based electrochemical assay,41 and 258.40-fold compared with that of the nanostructure-based electrochemical assay.42 The enhanced sensitivity can be ascribed to the following four factors: (1) the high efficiency of the click reaction-mediated ligation reaction can generate abundant DNA probes 1–2 ligation products and DNA probes 3–4 ligation products to initiate the tricyclic LCR amplification reaction, (2) the high amplification efficiency of tricyclic LCR can generate large amounts of DNA probes 1–2 ligation product, (3) the improved FRET efficiency results from single QD/multiple Cy5 acceptors in the QD–oligonucleotides–Cy5 nanosensor, and (4) the single-molecule detection has characteristics of high signal-to-noise ratio and the near-zero background.
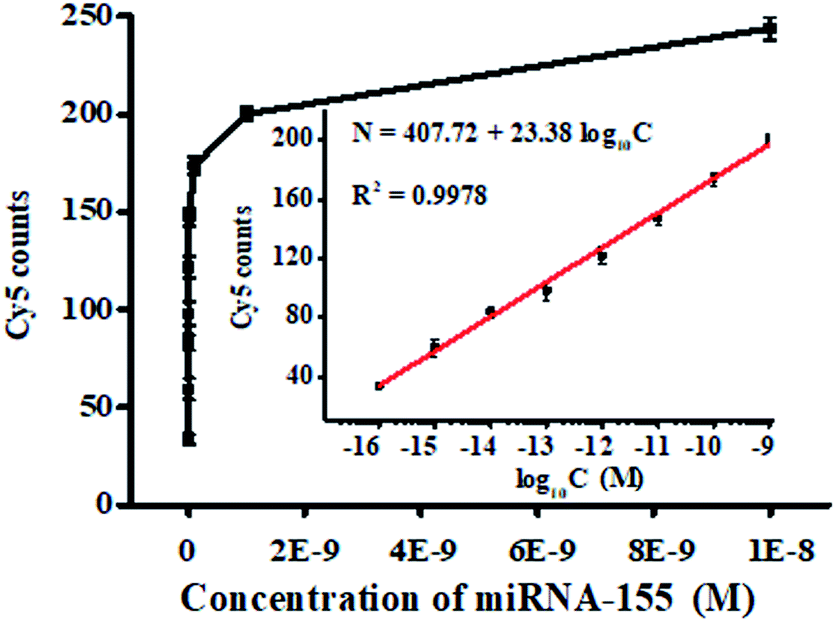 | ||
| Fig. 3 Cy5 counts generated by different concentrations of miRNA-155. Inset shows the linear relationship between the Cy5 counts and the logarithm of miRNA-155 concentration. The concentration of each DNA probe is 100 nM. Error bars are standard derivation obtained from three independent experiments. | ||
We evaluated the specificity of the proposed nanosensor using four irrelevant miRNAs namely miRNA-141, miRNA-210, let-7a, and miRNA-214. As shown in Fig. 4A, 10 nM target miRNA-155 generates a high Cy5 signal (Fig. 4A, red column), which is 9.97, 10.27, 8.81, and 10.27-fold higher than that generated by 10 nM let-7a (Fig. 4A, orange column), 10 nM miRNA-141 (Fig. 4A, blue column), 10 nM miRNA-210 (Fig. 4A, purple column), and 10 nM miRNA-214 (Fig. 4A, green column), respectively. We further used mismatched miRNA 1 (misR-1), mismatched miRNA 2 (misR-2), mismatched miRNA 3 (misR-3), and mismatched miRNA 4 (misR-4) with only one nucleotide difference from target miRNA-155 in different positions to evaluate the capability of this nanosensor to differentiate a single-base mismatch. The Cy5 signal in response to 10 nM miRNA-155 (Fig. 4B, red column) is 5.27, 6.28, 6.23, and 6.07-fold higher than that in response to 10 nM misR-1 (Fig. 4B, pink column), 10 nM misR-2 (Fig. 4B, purple column), 10 nM misR-3 (Fig. 4B, light blue column), and 10 nM misR-4 (Fig. 4B, gray column), respectively, suggesting that this nanosensor possesses good selectivity with the capability of discriminating a single-base mismatch. The high specificity of this nanosensor can be attributed to the following two factors: (1) the high specificity of the click reaction-mediated ligation reaction and tricyclic LCR amplification and (2) the elimination of false positives by Exo III/Exo I-mediated digestion of excess DNA probes 1, 3, and 4, and DNA probes 3–4 ligation products.
 | ||
| Fig. 4 (A) Comparison of Cy5 counts generated by 10 nM let-7a (orange column), 10 nM miRNA-141 (blue column), 10 nM miRNA-210 (magenta column), and 10 nM miRNA-214 (green column), respectively. (B) Measurement of Cy5 counts generated by 10 nM single-base mismatched miRNA 1 (pink column), 10 nM single-base mismatched miRNA 2 (purple column), 10 nM single-base mismatched miRNA 3 (cyan column), 10 nM single-base mismatched miRNA 4 (gray column), and 10 nM miRNA-155 (red column), respectively. The concentration of each DNA probe is 100 nM. Error bars show the standard deviation of three independent experiments. | ||
To demonstrate the proof-of-concept of the proposed nanosensor for complex sample analysis, we measured miRNA-155 spiked in 10% fetal bovine serum samples. A quantitative recovery ratio ranging from 99.10%–100.78% is obtained with a relative standard deviation (RSD) of 1.88–5.05% (Table S1†). We further measured the variance of Cy5 counts with different concentrations of miRNA-155 in 10% fetal bovine serum. As shown in Fig. 5, the Cy5 counts enhance with the increasing concentration of spiked miRNA-155 in the range of 1 × 10⁻¹⁶–1 × 10⁻⁹ M, and a good linear correlation is obtained between the Cy5 counts and the logarithm of spiked miRNA-155 concentration in the range of 1 × 10⁻¹⁶–1 × 10⁻⁹ M. The regression equation is N = 408.40 + 23.56log10C (R2 = 0.9983), where C is the miRNA-155 concentration and N is the Cy5 counts. The limit of detection (LOD) is measured to be 6.32 × 10⁻¹⁷ M, consistent with the LOD (3.87 × 10⁻¹⁷ M) obtained in the absence of 10% fetal bovine serum samples (inset of Fig. 3), suggesting the good performance of the proposed nanosensor in the complex biological matrix.
 | ||
| Fig. 5 Linear relationship between the Cy5 counts and the logarithm of miRNA-155 concentration in 10% fetal bovine serum. The concentration of each DNA probe is 100 nM. Error bars show the standard deviations of three experiments. | ||
We measured target miRNA-155 in HL7702 cells, MCF-7 cells, and HeLa cells, respectively. As shown in Fig. 6A, the miRNA-155-negative HL7702 cells generate a low Cy5 signal (Fig. 6A, green column), but miRNA-155-positive HeLa cells (Fig. 6A, red columns) and MCF-7 cells (Fig. 6A, blue columns) generate a high Cy5 signal, respectively, consistent with the overexpression of miRNA-155 in cancer cells.40,41 We further measured the Cy5 counts generated by different numbers of HeLa cells. As shown in Fig. 6B, the Cy5 counts enhance with the increasing number of HeLa cells from 1 to 10000, with a linear correlation being obtained between the Cy5 counts and the logarithm of HeLa cell number in the range of 1–10000. The corresponding equation is N = 88.53 + 53.38log10X (R2 = 0.9952), where X is the number of HeLa cells and N is the measured Cy5 counts. The detection limit is estimated to be 1 cell. We measured the Cy5 counts generated by different numbers of MCF-7 cells as well. As shown in Fig. 6C, the Cy5 counts enhance with the increasing number of MCF-7 cells from 1 to 10000, with a linear correlation obtained between the Cy5 counts and the logarithm of MCF-7 cell number in the range of 1–10000 cells. The corresponding equation is N = 80.75 + 60.81log10X (R2 = 0.931), where X is the number of MCF-cells and N is the measured Cy5 counts. The detection limit is estimated to be 1 cell, suggesting that the proposed nanosensor can sensitively detect miRNA-155 at the single-cell level.
 | ||
| Fig. 6 (A) Measurement of miRNA-155 expressions in the control group with no miRNA (black column), 10000 HL7702 cells (green column), 10000 HeLa cells (red column), and 10000 MCF-7 cells (blue column), respectively. The concentration of each DNA probe is 100 nM. (B) Linear relationship between the Cy5 counts and the logarithm of HeLa cell number. (C) Linear relationship between the Cy5 counts and the logarithm of MCF-7 cell number. The concentration of each DNA probe is 100 nM. Error bars are standard derivation obtained from three independent experiments. | ||
To investigate the feasibility of the proposed nanosensor for potential clinical applications, we measured the expression levels of miRNA-155 in tissues from healthy persons and nonsmall cell lung cancer (NSCLC) patients, respectively. The expression levels of miRNA-155 obtained by the proposed nanosensor (Fig. 7, red columns) are calculated based on the calibration curve of the inset of Fig. 3. The miRNA-155 levels from the NSCLC patient samples are significantly higher than those obtained from healthy persons (t-test, P < 0.001), in good agreement with those obtained by the standard qRT-PCR assay (Fig. 7, green columns) that were quantified with the threshold cycle (CT) value (Fig. S7†). The mean levels of miRNA-155 in the NSCLC patients (3.36 × 10⁻¹¹ M) are 5.66-fold higher than those of healthy persons (5.93 × 10⁻¹² M), consistent with the previous report.43 These results clearly suggest that the proposed nanosensor has the capability of quantifying miRNA-155 in human tissues with excellent accuracy, providing a new powerful platform for cancer research and clinical diagnosis.
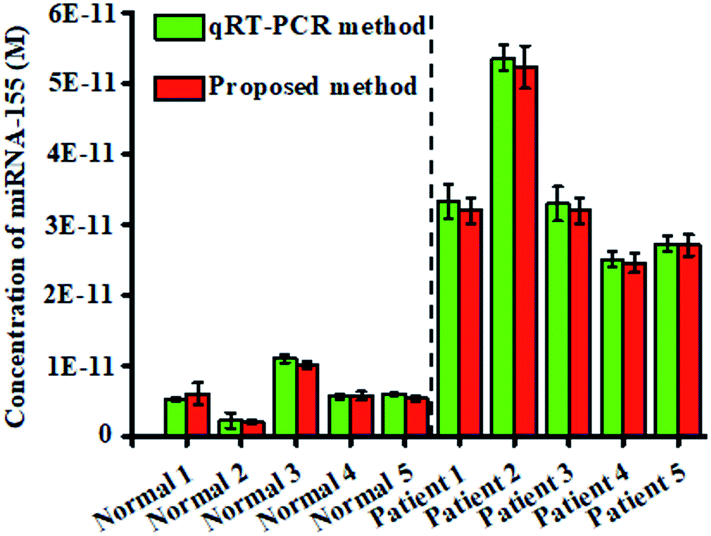 | ||
| Fig. 7 Analysis of the miRNA-155 level in tissues by using the proposed method (P = 0.000591, red column) and qRT-PCR (P = 0.000629, green column). 250 ng of total RNA extracted from five NSCLC patients and five healthy persons was measured, respectively. The concentration of each DNA probe is 100 nM. Error bars show the standard deviations of three experiments. | ||
Conclusions
In conclusion, we have developed a copper-free and enzyme-free click chemistry-mediated single QD nanosensor for sensitive detection of miRNA-155 in cancer cells and human tumor tissues. In this assay, we design four DNA probes namely DNA probes 1–4, with DNA probes 1 and 3 being modified with azide (N3) and DNA probes 2 and 4 being modified with dibenzocyclooctyne (DBCO). When target miRNA is present, DNA probes 1 and 2 can proceed via copper-free and enzyme-free click chemistry to generate the probes 1–2 ligation product. Subsequently, DNA probes 3 and 4 can hybridize with the probes 1–2 ligation product to generate the probes 3–4 ligation product. Both the probes 1–2 ligation product and probes 3–4 ligation product can act as the templates to initiate cycling click chemistry-mediated tricyclic LCR amplification whose products can be easily measured by the single-QD-based FRET nanosensor. This nanosensor is very simple without the involvement of any enzyme-assisted signal amplification, copper catalyst, complicated separation, and purification steps. This nanosensor has significant advantages: (1) the high efficiency of copper-free and enzyme-free click chemical ligation can transform the target miRNA-155 into DNA probes 1–2 ligation product, eliminating the involvement of the enzymatic reverse transcription, copper catalyst, and ligase enzyme; (2) the introduction of ligase chain reaction (LCR) amplification can ensure high specificity and the capability of discriminating even one base mutation; (3) the integration of the QD–oligonucleotides–Cy5 nanosensor with single-molecule detection endows this assay with high sensitivity; (4) the DNA probes 1–2 ligation product can prevent the Exo I and Exo III-catalyzed digestion, endowing this assay with good specificity. This nanosensor can sensitively detect miRNA-155 with a detection limit of 3.87 × 10⁻¹⁷ M, and it can differentiate even a single-base mismatch. Moreover, this nanosensor can be applied for the measurement of miRNA-155 in HeLa cells and MCF-7 cells at the single-cell level. Furthermore, this nanosensor can distinguish the expression levels of miRNA-155 in tissues of healthy persons and nonsmall cell lung cancer (NSCLC) patients. Importantly, this nanosensor can provide a versatile platform for sensitive detection of various nucleic acid sequences by simply changing the corresponding DNA probes.Experimental section
Chemicals and materials
All the high-performance liquid chromatography (HPLC)-purified oligonucleotides (Table 1) were synthesized by Sangon Biotechnology Co. Ltd (Shanghai, China) except for miRNA-155. MiRNA-155 was synthesized by TaKaRa Bio. Inc. (Dalian, China). Exonuclease I (Exo I), 10× Exo I reaction buffer (670 mM glycine–KOH, 67 mM MgCl2, 100 mM 2-mercaptoethanol (β-ME), pH 9.5), exonuclease III (Exo III), 10× NEBuffer 1 (100 mM Bis-Tris–propane–HCl, 100 mM MgCl2, 10 mM DTT, pH 7) and RNase inhibitor were purchased from New England Biolabs (Ipswich, MA, USA). Magnesium chloride (MgCl2) and ammonium sulfate ((NH4)2SO4) were obtained from Sigma-Aldrich Company (St. Louis, MO, USA). Tris–HCl was purchased from Invitrogen Corporation (Carlsbad, CA, USA). The streptavidin-coated 605 nm-emitting quantum dots (QD) were purchased from Thermo Fisher Scientific (Massachusetts, USA). Diethylpyrocarbonate (DEPC)-treated water (RNase free) was purchased from Beyotime Biotechnology Co. Ltd (Shanghai, China). Phosphate buffer (PBS) and SYBR Gold were purchased from Life Technologies (Carlsbad, CA, USA). The human cervical carcinoma cell line (HeLa cells), human hepatocyte cell line (HL-7702 cells), and human breast adenocarcinoma cell line (MCF-7 cells) were purchased from the Cell Bank of Chinese Academy of Sciences (Shanghai, China). The tissue samples of nonsmall cell lung cancer (NSCLC) patients and healthy persons were obtained from the Affiliated Hospital of Guangdong Medical University (Zhenjiang, Guangdong, China), and the experiments were approved by the ethics committee of the Affiliated Hospital of Guangdong Medical University.Cycling click chemistry-mediated tricyclic LCR amplification
The cycling click chemistry-mediated tricyclic LCR amplification was performed in 20 μL of reaction system containing 2 μL of PBS (0.1 M NaCl, pH 7.4), 0.5 μL of RNase inhibitor, 400 nM DNA probe 1, 400 nM DNA probe 2, 400 nM DNA probe 3, 400 nM DNA probe 4 and a certain amount of target miRNA-155. The reaction was carried out with 50 thermal cycles at 85 °C for 30 s and 25 °C for 150 s.Exo I and Exo III treatment
After tricyclic LCR, 36 U of Exo I, 36 U of Exo III, 2 μL of 10× Exo I reaction buffer and 2 μL of 10× NEBuffer I were added into 10 μL of reaction mixture with a final volume of 20 μL to digest the excess DNA probes 1, 3, and 4, and the probes 3–4 ligation product. The digestion reaction was carried out at 37 °C for 40 min, followed by termination at 80 °C for 20 min.Hybridization reaction
The hybridization reaction was carried out in a solution containing 100 mM Tris–HCl (pH = 8.0), 10 mM (NH4)2SO4, 3 mM MgCl2, 100 nM Cy5-labeled reporter probes, 100 nM biotinylated capture probes, and 10 μL of probes 1–2 ligation product after Exo I and Exo III treatment at room temperature for 20 min to obtain the sandwich hybrids (the molar ratio of Cy5-labeled reporter probes to biotinylated capture probes was kept at 1:1). Subsequently, streptavidin-coated QDs were added to the solution with a final concentration of 2.78 nM, followed by rotation for 10 min at room temperature to form the QD–oligonucleotide–Cy5 nanostructures.
Gel electrophoresis analysis
After the tricyclic LCR amplification reaction, the products were analyzed by 12% nondenaturing polyacrylamide gel electrophoresis (PAGE) in 1× TBE buffer (9 mM boric acid, 0.2 mM EDTA, 9 mM Tris–HCl, pH 7.9) at a 110 V constant voltage for 55 min at room temperature. SYBR gold was used as the fluorescent indicator, and the gels were stained with 1× SYBR gold and visualized using a ChemiDoc MP Imaging System (Hercules, California, USA).Fluorescence measurements
The fluorescence spectra were obtained using an F-7000 fluorescence spectrometer (Hitachi, Japan) at an excitation wavelength of 488 nm, and the emission spectra were scanned from 550 to 750 nm. The emission intensities at 605 nm (for the QDs) and 670 nm (for the Cy5) were used for data analysis.Quantification of miRNA-155 extracted from cells and tissues
MCF-7 cells, HL-7702 cells and HeLa cells were cultured in Dulbecco's modified Eagle's medium containing 10% fetal bovine serum (FBS, Invitrogen, USA) at 37 °C under 5% CO2. The miRNA-155s in the cells was extracted by using the SanPrep Column microRNA Extraction Kit (Sangon Biotech, Shanghai). Next, the miRNeasy FFPE kit (Qiagen, Germany) was used to extract total RNA from ten human lung tissues of NSCLC patients and healthy persons. The concentration of total RNA was determined by using a Nanodrop 2000C Spectrophotometer (Thermo Scientific). Quantitative polymerase chain reaction (qPCR) was performed to quantify miRNA using the Mir-X™ miRNA qRT-PCR SYBR Kit (TaKaRa, Dalian, China) in a BIO-RAD CFX Connect TM Real-Time System (Hercules, CA, USA).Detection of miRNA-155 in the spiked fetal bovine serum
To investigate the feasibility of the proposed method for real sample analysis, 10% fetal bovine serum (FBS) was spiked with 20 μL of a mixture containing different concentrations of miRNA-155, 400 nM DNA probe 1, 400 nM DNA probe 2, 400 nM DNA probe 3, 400 nM DNA probe 4, 0.5 μL of RNase inhibitor, and 2 μL of PBS (pH = 7.4). The reaction was carried out with 50 thermal cycles at 85 °C for 30 s and 25 °C for 150 s. The measurements follow the procedure described above. The concentration of miRNA-155 was calculated according to the fitting equation (inset of Fig. 3). The recovery ratio (R1) is calculated based on eqn (3).| R1 (%) = (Cn/C0) × 100% | (3) |
Single-molecule detection and data analysis
For TIRF imaging, 10 μL of samples was directly pipetted onto the coverslips. A sapphire 488 nm laser (50 mW, Coherent, USA) was used to excite the QDs. The photons from the QD and Cy5 were collected by a 100× objective (Olympus, Japan) and imaged with an exposure time of 100 ms by an Andor Ixon DU897 EMCCD. A region of interest (600 × 600 pixels) of the images was selected for Cy5 molecule counting by using image J software.Author contributions
Zi-yue Wang: conceptualization, methodology, investigation, writing – original draft preparation; Dong-ling Li: methodology, investigation; Xiaorui Tian: methodology, investigation; Chun-yang Zhang: conceptualization, funding acquisition, writing – review and editing.Conflicts of interest
There are no conflicts to declare.Acknowledgements
This work was supported by the National Natural Science Foundation of China (Grant no. 21735003) and the Award for Team Leader Program of Taishan Scholars of Shandong Province, China.Notes and references
- O. Slaby, M. Svoboda, J. Michalek and R. Vyzula, Mol. Cancer, 2009, 8, 102 CrossRef PubMed.
- J. Hu, T. Sun, H. Wang, Z. Chen, S. Wang, L. Yuan, T. Liu, H.-R. Li, P. Wang, Y. Feng, Q. Wang, R. E. McLendon, A. H. Friedman, S. T. Keir, D. D. Bigner, J. Rathmell, X.-d. Fu, Q.-J. Li, H. Wang and X.-F. Wang, Cancer Cell, 2016, 29, 49–60 CrossRef CAS PubMed.
- J. Liu, Y. Wen, H. He, H.-Y. Chen and Z. Liu, Chem. Sci., 2018, 9, 7241–7246 RSC.
- G. K. Joshi, S. Deitz-McElyea, T. Liyanage, K. Lawrence, S. Mali, R. Sardar and M. Korc, ACS Nano, 2015, 9, 11075–11089 CrossRef CAS PubMed.
- C.-J. Wang, C.-C. Zhu, J. Xu, M. Wang, W.-Y. Zhao, Q. Liu, G. Zhao and Z.-Z. Zhang, Mol. Cancer, 2019, 18, 1–12 CrossRef PubMed.
- S. Lin and R. I. Gregory, Nat. Rev. Cancer, 2015, 15, 321–333 CrossRef CAS PubMed.
- R. C. Friedman, K. K.-H. Farh, C. B. Burge and D. P. Bartel, Genome Res., 2009, 19, 92–105 CrossRef CAS PubMed.
- C. B. Ji and X. R. Guo, Nat. Rev. Endocrinol., 2019, 15, 731–743 CrossRef CAS PubMed.
- S. S. Hebert and B. De Strooper, Trends Neurosci., 2009, 32, 199–206 CrossRef CAS PubMed.
- T. Thum, C. Gross, J. Fiedler, T. Fischer, S. Kissler, M. Bussen, P. Galuppo, S. Just, W. Rottbauer, S. Frantz, M. Castoldi, J. Soutschek, V. Koteliansky, A. Rosenwald, M. A. Basson, J. D. Licht, J. T. R. Pena, S. H. Rouhanifard, M. U. Muckenthaler, T. Tuschl, G. R. Martin, J. Bauersachs and S. Engelhardt, Nature, 2008, 456, 980–984 CrossRef CAS PubMed.
- C. Zhang, Y. Zhao, X. Xu, R. Xu, H. Li, X. Teng, Y. Du, Y. Miao, H.-c. Lin and D. Han, Nat. Nanotechnol., 2020, 15, 709–715 CrossRef CAS PubMed.
- X. Qiu, J. Xu, J. Guo, A. Yahia-Ammar, N.-I. Kapetanakis, I. Duroux-Richard, J. J. Unterluggauer, N. Golob-Schwarzl, C. Regeard, C. Uzan, S. Gouy, M. DuBow, J. Haybaeck, F. Apparailly, P. Busson and N. Hildebrandt, Chem. Sci., 2018, 9, 8046–8055 RSC.
- T. Zhou, R. Huang, M. Huang, J. Shen, Y. Shan and D. Xing, Adv. Sci., 2020, 7, 1903661 CrossRef CAS PubMed.
- R. Garzon, G. A. Calin and C. M. Croce, Annu. Rev. Med., 2009, 60, 167–179 CrossRef CAS PubMed.
- L. Xian, H. Ge, F. Xu, N. Xu, J. Fan, K. Shao and X. Peng, Chem. Sci., 2019, 10, 7111–7118 RSC.
- C. Shi, Q. Liu, C. P. Ma and W. W. Zhong, Anal. Chem., 2014, 86, 336–339 CrossRef CAS PubMed.
- J. Li, S. Tan, R. Kooger, C. Zhang and Y. Zhang, Chem. Soc. Rev., 2014, 43, 506–517 RSC.
- C. C. Pritchard, H. H. Cheng and M. Tewari, Nat. Rev. Genet., 2012, 13, 358–369 CrossRef CAS PubMed.
- P. Mestdagh, N. Hartmann, L. Baeriswyl, D. Andreasen, N. Bernard, C. Chen, D. Cheo, P. D'Andrade, M. DeMayo, L. Dennis, S. Derveaux, Y. Feng, S. Fulmer-Smentek, B. Gerstmayer, J. Gouffon, C. Grimley, E. Lader, K. Y. Lee, S. Luo, P. Mouritzen, A. Narayanan, S. Patel, S. Peiffer, S. Rüberg, G. Schroth, D. Schuster, J. M. Shaffer, E. J. Shelton, S. Silveria, U. Ulmanella, V. Veeramachaneni, F. Staedtler, T. Peters, T. Guettouche, L. Wong and J. Vandesompele, Nat. Methods, 2014, 11, 809–815 CrossRef CAS PubMed.
- É. Várallyay, J. Burgyán and Z. Havelda, Nat. Protoc., 2008, 3, 190–196 CrossRef PubMed.
- S. Goda and N. Minton, Nucleic Acids Res., 1995, 23, 3357–3358 CrossRef CAS PubMed.
- E. M. Kroh, R. K. Parkin, P. S. Mitchell and M. Tewari, Methods, 2010, 50, 298–301 CrossRef CAS PubMed.
- J. Hu, M.-h. Liu and C.-y. Zhang, Chem. Sci., 2018, 9, 4258–4267 RSC.
- P. Zhang, J. Zhang, C. Wang, C. Liu, H. Wang and Z. Li, Anal. Chem., 2014, 86, 1076–1082 CrossRef CAS PubMed.
- P. Zhang, J. Zhang, C. Wang, C. Liu, H. Wang and Z. Li, Anal. Chem., 2014, 86, 1076–1082 CrossRef CAS PubMed.
- Y. Qi, L. Qiu, W. Fan, C. Liu and Z. Li, Analyst, 2017, 142, 2967–2973 RSC.
- X. Xu, W. L. Daniel, W. Wei and C. A. Mirkin, Small, 2010, 6, 623–626 CrossRef CAS PubMed.
- B. Dervaux and F. E. Du Prez, Chem. Sci., 2012, 3, 959–966 RSC.
- E. Kim and H. Koo, Chem. Sci., 2019, 10, 7835–7851 RSC.
- M. F. Kuehnel, C. D. Sahm, G. Neri, J. R. Lee, K. L. Orchard, A. J. Cowan and E. Reisner, Chem. Sci., 2018, 9, 2501–2509 RSC.
- C.-c. Li, W.-x. Liu, J. Hu and C.-y. Zhang, Chem. Sci., 2019, 10, 8675–8684 RSC.
- Z. Su, H. Shen, H. Wang, J. Wang, J. Li, G. U. Nienhaus, L. Shang and G. Wei, Adv. Funct. Mater., 2015, 25, 5472–5478 CrossRef CAS.
- L. Jing, S. V. Kershaw, Y. Li, X. Huang, Y. Li, A. L. Rogach and M. Gao, Chem. Rev., 2016, 116, 10623–10730 CrossRef CAS PubMed.
- C.-c. Li, Y. Li, Y. Zhang and C.-y. Zhang, TrAC, Trends Anal. Chem., 2020, 122, 115753 CrossRef CAS.
- C.-c. Li, H.-y. Chen, J. Hu and C.-y. Zhang, Chem. Sci., 2020, 11, 5724–5734 RSC.
- J. Hu, M.-h. Liu and C.-y. Zhang, ACS Nano, 2019, 13, 7191–7201 CrossRef CAS PubMed.
- S. Mattiske, R. J. Suetani, P. M. Neilsen and D. F. Callen, Cancer Epidemiol., Biomarkers Prev., 2012, 21, 1236–1243 CrossRef CAS PubMed.
- T. Hu, L. Zhang, W. Wen, X. Zhang and S. Wang, Biosens. Bioelectron., 2016, 77, 451–456 CrossRef CAS PubMed.
- Y.-S. Borghei, M. Hosseini, M. R. Ganjali and S. Hosseinkhani, Sens. Actuators, B, 2017, 248, 133–139 CrossRef CAS.
- R. Huang, Y. Liao, X. Zhou, Y. Fu and D. Xing, Sens. Actuators, B, 2017, 247, 505–513 CrossRef CAS.
- P. Fu, S. Xing, M. Xu, Y. Zhao and C. Zhao, Sens. Actuators, B, 2020, 305, 127545 CrossRef CAS.
- D. Zeng, Z. Wang, Z. Meng, P. Wang, L. San, W. Wang, A. Aldalbahi, L. Li, J. Shen and X. Mi, ACS Appl. Mater. Interfaces, 2017, 9, 24118–24125 CrossRef CAS PubMed.
- F. Ma, S. Jiang and C. Zhang, Biosens. Bioelectron., 2020, 157, 112177 CrossRef CAS PubMed.
Footnotes |
| † Electronic supplementary information (ESI) available. See DOI: 10.1039/d1sc01865e |
| ‡ These authors contributed equally. |
| This journal is © The Royal Society of Chemistry 2021 |