 Open Access Article
Creative Commons Attribution 3.0 Unported Licence
Phosphorus Kβ X-ray emission spectroscopy detects non-covalent interactions of phosphate biomolecules in situ†
Zachary
Mathe‡
 ,
Olivia
McCubbin Stepanic‡
,
Sergey
Peredkov
and
Serena
DeBeer
,
Olivia
McCubbin Stepanic‡
,
Sergey
Peredkov
and
Serena
DeBeer
 *
*
Max Planck Institute for Chemical Energy Conversion, Stiftstr. 34-36, D-45470 Mülheim an der Ruhr, Germany. E-mail: serena.debeer@cec.mpg.de
First published on 29th April 2021
Abstract
Phosphorus is ubiquitous in biochemistry, being found in the phosphate groups of nucleic acids and the energy-transferring system of adenine nucleotides (e.g. ATP). Kβ X-ray emission spectroscopy (XES) of phosphorus has been largely unexplored, with no previous applications to biomolecules. Here, the potential of P Kβ XES to study phosphate-containing biomolecules, including ATP and NADPH, is evaluated, as is the application of the technique to aqueous solution samples. P Kβ spectra offer a detailed picture of phosphate valence electronic structure, reporting on subtle non-covalent effects, such as hydrogen bonding and ionic interactions, that are key to enzymatic catalysis. Spectral features are interpreted using density functional theory (DFT) calculations, and potential applications to the study of biological energy conversion are highlighted.
Introduction
Phosphorus, biologically available in the form of phosphates (species containing the functional group [PVO4]3−), is required for almost all cellular metabolic processes, and nearly 1/3 of known protein structures interact with or contain some form of phosphate.1,2 Many central biomolecules, including deoxyribonucleic acid (DNA), ribonucleic acid (RNA), adenosine triphosphate (ATP) and nicotinamide adenine dinucleotide phosphate (NADP), are organophosphates.3 The energy transduction reaction of ATP to form ADP (adenosine diphosphate) and orthophosphate (any conjugate base of H3PO4; “Pi”) is utilized by a wide variety of proteins to drive otherwise endergonic reactions,4 including the reduction of N2,5 transportation of ions (Na+, K+, Ca2+) across membranes,6–8 and formation of NADP.9 NADP and NADPH participate in redox reactions in protein environments,10 and the mechanism of cisplatin, the original transition metal anticancer drug, involves the mediation of NADPH oxidase.11 Phosphates also influence protein folding via hydrogen bonds to the basic amino acids and chelates with arginine,12 and control conformational gating, such as in the ATP deactivation of ribonucleotide reductase.13 Enzyme-inhibiting organophosphates are also the main class of pesticides and nerve agents.14 Due to the wide biological importance of phosphates, it is of great interest to follow the chemical changes of phosphate-containing molecules in biological systems.Phosphate is optically silent in both the visible and ultra-violet regimes. Even in compounds such as NADP and NADPH, which can be differentiated through UV/vis,15 the presence of protein in the sample limits the use of this technique due to the large characteristic absorption at 280 nm for all proteins. Although the protonation of orthophosphates can be determined through IR, this technique is less useful for larger compounds such as proteins and is often impossible in aqueous environments, where similar stretches in water obscure relevant transitions.
As such, the majority of phosphorus studies in biological systems have been conducted with 31P nuclear magnetic resonance (NMR) spectroscopy, which has been widely applied as a diagnostic tool or for long-range structural characterization.5,16–24 Notably, because of the small natural linewidth of NMR, it is useful for the identification of multiple phosphorus species in mixtures. Additionally, 31P NMR spectroscopy has been used to investigate structure–activity relationships in organometallic complexes.16 There are, however, some drawbacks to NMR spectroscopy. In paramagnetic systems, line broadening and NMR shifts have limited the number of successful studies. Recent studies have utilized in situ paramagnetic NMR spectroscopy in characterization of catalysts through optimization of instrumentation.25,26 Larger proteins are less amenable to study with solution-state NMR because of strong life-time broadening that occurs with molecular tumbling, limiting the study of such proteins to solid state NMR with sedimented protein samples.27,28 Notably, 31P NMR inherently has a long relaxation time that is dependent on local environment,29 with relaxation times from 0.1 to over 10 seconds.30 This property limits the utility of 31P NMR spectroscopy in investigating reactivity or conformational changes which, in biochemical systems, typically occur on a scale of milliseconds or less.31 As such, there is a need for techniques capable of probing phosphorus sites on faster time scales and in diverse environments, especially in the presence of paramagnetic species and in solution.
X-ray absorption spectroscopy (XAS) is a well-established technique for local structural characterization of both transition metals and main group elements. Sulfur compounds, which often have similar structures to their phosphorus counterparts, give rise to rich features in the XANES region.32 X-ray absorption and scattering techniques have been applied to phosphates in both solid and solution phase, albeit with limited success. K-edge XAS of phosphorus suffers somewhat in the EXAFS region because of the generally weak oscillations associated with a low atomic number.33 XANES has been used more frequently: a fingerprinting library of various phosphates has been compiled at both the K edge34 and the L2,3 edge,35 and metal–ligand covalency has been studied in phosphine complexes.36,37 While XANES spectra of other phosphorus compounds have rich features, the XANES spectra of orthophosphates recorded by Persson et al. were described as nondifferentiable due to a lack of distinctive spectral features.38 Despite this conclusion, some phosphate salts with transition metal cations offer distinctive pre-edge features,39 hinting that P XAS may have more to offer and that probing the valence electronic structure at phosphate can report on the local environment.
In recent years, Kβ X-ray emission spectroscopy (XES) has become a more frequently used technique, with a focus on 3d transition metals.40–46 Some work has also been performed on 4d elements,47–49 and sulfur Kβ X-ray emission has been somewhat explored,50–54 including a study of the protonation state of aqueous sulfate,55 but very few Kβ XES studies of phosphorus have been reported.50,56–58 Phosphorus Kβ X-ray emission spectroscopy (XES) has great potential as a probe of phosphorus in both molecular and biological systems, promising rich electronic structural information and compatibility with diverse sample preparations that would augment existing techniques. Additionally, while P XAS suffers dramatically from self-absorption,59 XES samples are exceptionally easy to prepare and require no dilution. Compared to NMR studies, for which the full experiment can take hours,56 or XAS, where sample dilution results in longer collection times, XES of high phosphorus content (for example, Na4ATP is 5.8% phosphorus by weight) powder samples requires negligible time to collect (powdered sample collection of Na4ATP, as discussed below, took 8 minutes). To our knowledge, P Kβ XES has not been used to study biologically relevant organophosphate compounds or to examine phosphorus compounds in the solution phase. This is in part because of the technical challenges in accessing the energy range required for phosphorus Kβ XES. While there are limited beamlines amenable to P Kβ XES, the ability to perform these experiments using both laboratory and synchrotron instrumentation has been recently demonstrated and applied to simple phosphate salts.60 In combination with experimental XES results, density functional theory (DFT) calculations allow for a direct link between the phosphate local environment and the observed spectral features.
To investigate the potential applications of P Kβ XES in a biological setting, the molecules relevant to ATP hydrolysis and NADP redox reactions were studied in both the solid and solution phases. P Kβ spectra were found to be sensitive to subtle non-covalent effects and were correlated to DFT calculations to investigate the origins of spectral features and the influence of ionic interactions and hydrogen bonding. The potential of P Kβ XES for future applications in biochemistry is highlighted.
Experimental
Sample preparation
NaH2PO4, Na2HPO4, β-nicotinamide adenine dinucleotide phosphate disodium salt (NADP), β-nicotinamide adenine dinucleotide 2′-phosphate reduced tetrasodium salt hydrate (NADPH), 2-amino-2-(hydroxymethyl)-1,3-propanediol (Tris base), adenosine monophosphate (AMP), adenosine diphosphate (ADP), HCl and NaOH were purchased from Sigma Aldrich and used without further purification. Na2ATP × 3H2O (MP Biomedical) was used for solid samples and Na2ATP with 8% H2O (Sigma Aldrich) was used for solution samples. Solutions were prepared using ultrapure water (18.2 MΩ cm).All solid samples were prepared as fine powders in aluminum spacers with 5 μm polypropylene windows. Phosphate solutions were prepared from Na2HPO4, dissolved to 1.9 M and adjusted to a pH of 9.8 or 4.7, to obtain a single phosphate species (HPO42− or H2PO4−) in solution. NADPH and NADP were dissolved in a pH 8 tris(2-amino-2-(hydroxymethyl)-1,3-propandiol) buffer (Sigma Aldrich). ATP and ADP 30 mM solutions were prepared at a pH of 8 without additional buffer. The purity and stability of ATP and ADP solutions were verified by both 1H and 31P NMR spectroscopy.
Solutions were measured using a custom flow cell (see ESI Section 1†) machined from polyether ether ketone (PEEK) with an 8 μm Kapton window and a Viton gasket, together with a syringe, syringe driver and standard high-performance liquid chromatography fittings. Constant solution flow provided both dissipation of the significant heat load from the incident beam on the window and replacement of potentially beam-damaged sample with fresh sample. Additionally, the beam was constantly rastered across the window at a speed of 50 μm s−1 in the direction opposite of sample flow. The linear flow speed across the window at the point of measurement was approximately 200 μm s−1; doubling the speed did not result in any spectral changes, suggesting that beam damage at 200 μm s−1 is unlikely. Before collecting data on each sample, the system was thoroughly rinsed with 0.01 M HCl, 0.01 M NaOH, ultrapure water and the solution to be measured.
XES measurements
All P Kβ XES data were collected at ambient temperature at the PINK beamline at the BESSYII synchrotron.61 The incident beam provided by a cryogenically cooled U17 undulator tuned to 4 keV and monochromatized with a multilayer monochromator with a broad bandpass of E/ΔE ≈ 50. The incident beam had a high flux of 2 × 10¹³ photons s−1 and a spot size of 40 × 500 μm (V × H). Emission spectra were collected using a vacuum von Hamos spectrometer with a GreatEyes CCD detector. A Si(111) cylindrical crystal (2d = 6.271 Å) with radius of 250 mm was used as a dispersive element. The experimental geometry allowed collection of the emitted photons at a Bragg angle of 69.3–66.7°, corresponding to an energy window of 2110–2150 eV at a CCD resolution of ∼0.036 eV/pixel. The analyzer resolution was estimated to be 0.26 eV (see ESI Section 2†). While the present experiments were performed with the sample chamber under vacuum, with trivial modifications, the sample chamber could be instead filled with 1 atm helium to allow measurement of vacuum-incompatible samples at a cost of ∼2% signal intensity (see ESI Section 1†).Energy calibration of the spectrometer was performed by fitting the spectrum of a NaH2PO4 standard with four Voigt peaks, then applying a linear transformation to match literature values of 2139.5, 2137.9, 2135.3, and 2123.4 eV.58 NADP and NADPH were characterized using UV/vis spectroscopy before and after beam exposure, and no evidence of beam-induced damage was observed.
XES data processing
All spectra were normalized with respect to the incident flux and measurement time and linearly interpolated onto a uniform 0.05 eV grid. A blank spectrum of ultrapure water was subtracted from solution samples, then all spectra were baseline-corrected with a line fitted to the regions [2111.35, 2113.35] and [2146.90, 2148.90] and a very mild Whittaker-Eilers smoothing was applied (λ = 4).62,63 Unless otherwise noted, spectra are presented normalized to a total area of 1000. All data processing was accomplished using in-house python code.XES calculations
The ORCA 4.2.0 electronic structure program package from Neese and coworkers was used to perform all calculations.64 Cartesian coordinates for all compounds were built with Avogadro,65 then geometry optimized using a BP86 functional66 with a def2-TZVP basis set67 and def2/J auxiliary basis set.67 Solvation effects were accounted for using the CPCM water model and a van der Waals Gaussian surface in initial calculations. KDIIS68 and SOSCF69 were used for improved convergence. XES calculations were performed using an established one-electron ground state DFT protocol, including an absolute energy shift of 69 eV to align with experiment.40 Quantitative analysis of ORCA output files was aided by MOAnalyzer.70Spectra were calculated from DFT transitions using a Voigt function with a Lorentzian Γ = 0.47 eV and a Gaussian FWHM = 1.55 eV (σ = 0.66 eV). While the experimental broadening of the spectrometer was estimated to be significantly smaller (FWHM = 0.61 eV; σ = 0.26 eV), this value of σ was chosen to approximate the spectral contributions of any multielectron transitions (such as shake or radiative Auger transitions71–74), site heterogeneity and other effects not accounted for in the DFT calculations. See Section 1 of the ESI† for further discussion.
Results and analysis
Theory of P Kβ XES
To understand Kβ XES of third row main group elements, it is useful to compare with the better-known Kβ lines of first row transition metals. The approximately atomic Kβ mainline (3p → 1 s) of 3d transition metals results in two peaks, Kβ1,3 and Kβ′, which report on spin state and metal–ligand covalency. To higher energy, the weaker Kβ2,5 and Kβ′′ peaks make up the valence-to-core (VtC) XES region and serve as a probe of the filled valence molecular orbitals (MOs), which provide information on ligand identity, electronic structure and protonation state.75–77 VtC transitions derive from MOs of primarily ligand ns/np character (Fig. 1, left), with transition intensity resulting from a small amount of metal p character mixed into the ligand orbitals. Contributions from the filled 3d orbitals may also be observed, provided there is sufficient metal p character in these MOs.78–80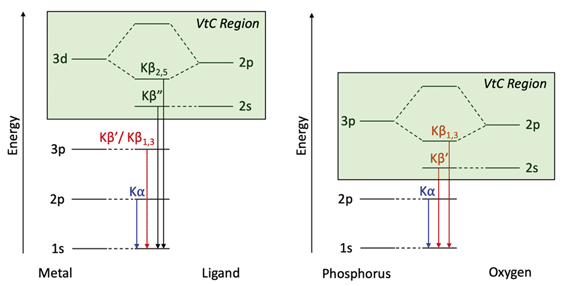 | ||
| Fig. 1 Energy level diagrams for 3d transition metal and ligand binding (left) and for phosphorus and oxygen (right) with the VtC region highlighted in green for both. | ||
Third-row main group elements differ from first-row transition metals in that their valence orbitals, those most capable of mixing with ligand orbitals, are 3p rather than 3d. Thus, phosphorus Kβ mainline transitions are not approximately atomic, but rather reflect the valence bonding environment analogous to transition metal VtC transitions while being more strongly dipole-allowed. Comparative energy level diagrams in Fig. 1 illustrate these transitions as they correspond to the various regions of the X-ray emission spectrum.
In P Kβ XES, spectral intensity from a given transition is due to the dipole allowedness of said transition. For a transition to be dipole-allowed, the integral of the product of the dipole operator with the initial and final states must be nonzero:
| 〈final|dipole|initial〉 ≠ 0 |
Or, in a one-electron approximation, the integral of the product of the dipole operator with the initial and final orbitals must be nonzero:
| 〈1s|dipole|valence〉 ≠ 0 |
Symmetry can be used to determine when this integral may be nonzero, and thus when the corresponding transition may have spectral intensity. The 1s orbital (|1s〉) transforms as the totally symmetric representation because it is approximately spherical:
| Γ(1s) = Γ(tot-symm) |
Thus, in order for the (one-electron) dipole integral to be nonzero, the direct product of the irreducible representations of the dipole operator and valence orbital must contain the totally symmetric representation:
| Γ(dipole) ⊗ Γ(valence) ⊃ Γ(tot-symm) |
This equation is true if and only if the dipole operator and the valence orbital transform as the same irreducible representation, giving the following general requirement for allowed P Kβ transitions:
| Γ(dipole) = Γ(valence) |
This requirement is independent of the point group of the species under consideration. It should be noted that this requirement is a necessary but not sufficient condition for a transition to have nontrivial intensity. A transition may be symmetry-allowed yet have vanishing intensity due to e.g. low orbital overlap.
Within the orthophosphate series, PO43−, HPO42− and H2PO4−, the approximate symmetry decreases with protonation, from Td to C3v to C2v, respectively. Within Td symmetry, the dipole operator transforms as t2, and thus the valence orbital must also transform as t2 for the transition to be dipole-allowed. As the symmetry is lowered by protonation, t2-symmetric functions (orbitals and operators) transform instead as e and a1, then a1, b1 and b2 (Fig. 2). The total number of allowed transitions increases with symmetry reduction because more orbitals transform as the same representation as a dipole operator component.
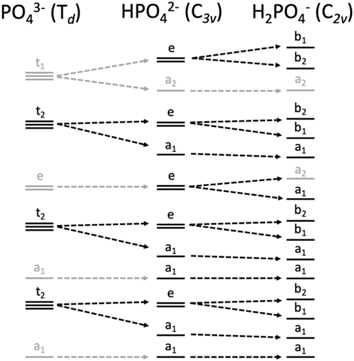 | ||
| Fig. 2 Correlation diagram of orbital symmetries in the Td, C3v and C2v point groups, with those matching the symmetry of the dipole operator of each point group in black and others in gray. | ||
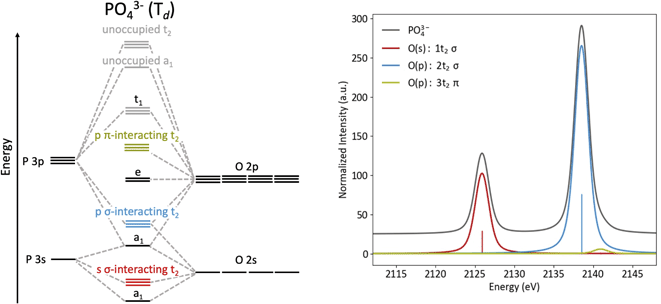
The origins of the MOs of PO43− are represented by the molecular orbital diagram shown in Fig. 3. Here, the three sets of t2 orbitals can be correlated to three peaks in the calculated Kβ spectrum. The colored molecular orbitals shown in Fig. 3 (left) correspond to the similarly colored peaks in the spectrum on the right. As previously reported by Petric and coworkers (and as calculated in Fig. 3, right), the Kβ spectrum of PO43− has two main peaks that correspond to orbitals with O(2s) and O(2p) character, as well as a small shoulder to high energy that corresponds to orbitals with O(2p) character. The lowest energy peak (red) at 2126 eV arises from t2 molecular orbitals with significant O(2s) character. The most intense peak (blue, 2138.5 eV) and weak shoulder towards higher energy (green, 2141 eV) both originate from t2 molecular orbitals with primarily O(2p) character. The difference in intensity for these peaks can be explained by the orbital overlaps. The high-intensity blue peak is dominated by σ-interactions of the P(3p) and O(2p) orbitals, while the low intensity green shoulder is due to π-interacting O(2p) orbitals.
Protonation to HPO42−, with the subsequent decrease in symmetry and change in orbitals that transform as the same representation as the dipole operator (left to right, Fig. 2), results in a spectra notably different from PO43−, with the most pronounced change being the presence of a new peak at 2135 eV (Fig. 4). This peak corresponds to the a1 orbital that contains O(2p) character from the protonated oxygen. The peak at 2138.5 eV has contributions from one a1 and two e orbitals, which are close enough in energy to appear as a single peak. The spectral change from PO43− to HPO42− is mimicked at lower energy, where a small shoulder at 2124 eV is present, due to the a1 orbital containing O(2s) character from the protonated oxygen.
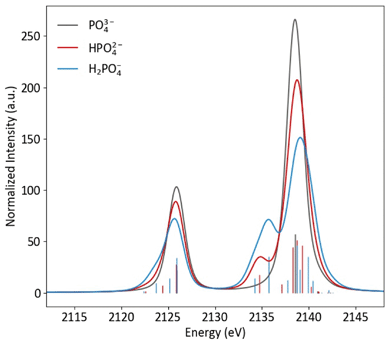 | ||
| Fig. 4 Calculated Kβ spectra of PO43−, HPO43− and H2PO43− with individual transitions shown as sticks. | ||
As is shown in Fig. 2, all orbital degeneracy is lost upon protonation to H2PO4−. This results in a somewhat broader peak at 2138.5 eV. With two protonated oxygens, the peak at 2135 eV increases dramatically, as is mimicked at lower energy with the small shoulder at 2123 eV. An overestimation of the MO splitting due to oxygen protonation in the DFT calculations has been observed previously in studies of Ca and Mn VtC XES.41,77 As such, it is likely that the peak broadening that occurs in calculated spectra will be somewhat less apparent in experimental spectra.
XES of phosphate in solution
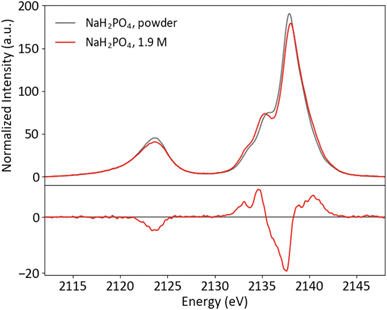
Though P Kβ XES of phosphate salts has been discussed in previous publications,57,58 phosphate biochemistry occurs in solution and XES of concentrated solid samples is of limited practical use for biochemical applications. To further XES as a means to study biological phosphates, solution samples of the orthophosphates HPO42− and H2PO4− were prepared. The pH was adjusted to 4.7 and 9.8 for H2PO42− and HPO42−, respectively, resulting in solutions with 99% homogeneity of protonation state. Both solutions were made with a concentration safely below the maximum solubility (1.9 M for H2PO42− and 0.2 M for HPO42−). Solid and solution P Kβ spectra of NaH2PO4 and Na2HPO4 are presented in Fig. 5 and ESI Section 3,† respectively, with differences (solution–powder) to highlight effects of the phase. Between the two species, the major difference occurs in the Kβ mainline region from 2133 to 2145 eV, with the second protonation resulting in additional spectral features and higher intensity around 2135 eV.A comparison of the solid and solution spectra of NaH2PO4 illustrates that P Kβ XES is sensitive to non-covalent interactions, such as hydrogen bonding and intermolecular electrostatic effects, beyond the orthophosphate molecule. While the changes are subtle, it is clear that the shoulder at ∼2136 eV becomes more pronounced in the solution case. Here it is of interest to first discuss what is known about the solid and solution structures of NaH2PO4, in order to understand the origins of the observed spectral differences and motivate a brief computational study.
Detailed structural information is available for H2PO4−, most notably from a neutron diffraction crystal structure of NaH2PO4 and from various spectroscopic and computational studies in solution. The NaH2PO4 crystal structure contains two unique H2PO4− sites in the asymmetric unit that are, on average, acceptors in 6Na+ and 2HO–PO3H interactions and donors in 2O–PO3H2 interactions, with an average intermolecular O–O distance of 2.56 Å.81 In solution, the hydration structure of H2PO4− is not precisely known; in general, it is difficult to establish agreement in hydration metrics across different techniques for such ions (see Eiberweiser et al. 2015 for further discussion).82–86 There is, however, substantial experimental and computational agreement that H2PO4− is strongly hydrated, with a first solvation sphere containing at least enough water molecules to saturate the hydrogen bonding sites in a static Lewis picture (9 hydrogen bond acceptances and 2 donations). The average intermolecular O–O distance is longer than that in the crystal, calculated at 2.77 and 2.79 Å from large-angle X-ray scattering and infrared spectroscopic data, respectively.82,83 The fastest hydration dynamics at orthophosphate occur on a timescale >10−12 s, much slower than the P(1s) core hole lifetime of 10−15 s; thus P XES reflects a sum across solution species, analogous to the slow-exchange regime in NMR.84,86,87
Overall, H2PO4− has a similar number of non-covalent interactions in both environments, with 6 Na+ interactions and 4 short hydrogen bonds in the solid and ∼11 hydrogen bonds that are ∼0.2 Å longer in the solution. Compared to the largely electrostatic nature of Na+ interactions, hydrogen bonding is a complex phenomenon with contributions from electrostatic, covalent (charge-transfer) and dispersion (intermolecular electron correlation) interactions that can alter the electronic structure of the acceptor moiety.88–91
The differing effects of the two coordination environments on the H2PO4− Kβ1,3 region were explored briefly in a series of single-point DFT calculations on continuum-solvated optimized dimer structures (Fig. 6). One might guess that the increased width of the solution Kβ1,3 region simply implies a stronger orbital splitting, analogous to that observed upon symmetry reduction (vide supra). However, the calculations suggest that the smoother shoulder in the solid spectrum is a result of stabilization of an orbital of primarily O(2p) character due to the proximal Na+. Despite the electrostatic, non-bonding nature of the interaction and the near-equivalence of the plotted MOs, the transition probability for this orbital is increased by 77% in the presence of Na+. In dimers with either water or another H2PO4−, the spectrum is most affected when the probed H2PO4− is the acceptor of the hydrogen bond, as expected. In these spectra, a new covalent hydrogen bonding orbital (that lacks a clear correlate in the monomer) contributes significant shoulder intensity. The spectra do not depend significantly on whether the hydrogen bonding partner is water or orthophosphate. It is clear that, in real systems, DFT is a powerful tool for understanding P Kβ spectra. A more thorough DFT study of these effects, employing the full crystal structure and explicit-solvent molecular mechanics, is underway in our group.
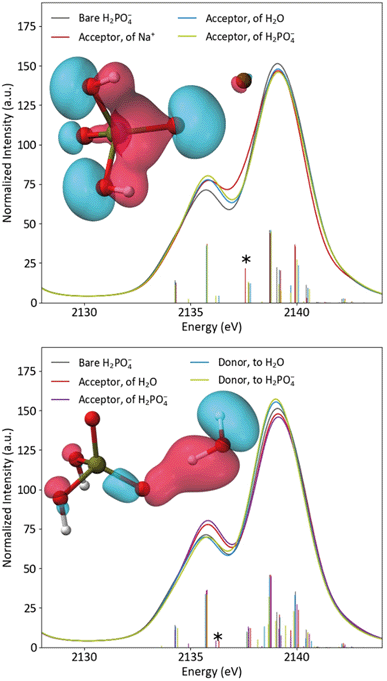 | ||
| Fig. 6 Calculated spectra of bare H2PO4− compared to acceptor dimers (top) and hydrogen bonding dimers (bottom), with inset plots of the starred transitions' orbitals. | ||
Adenine nucleotides
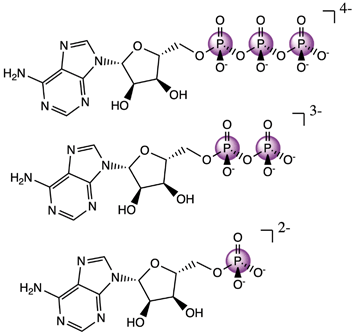
Having an understanding of the MO structure of Pi, we now move to more complex phosphate-containing biomolecules. The changes in the P Kβ XES with phosphate bound to another phosphorus, as occurs within ATP and ADP, have not, to our knowledge, previously been reported. As such, it is useful to analyze the adenine nucleotide series (AXP, where X= mono- (M), di- (D) or tri- (T)), the molecular models of which are shown in Fig. 7. The experimental spectra of these three complexes are shown in Fig. 8 together with calculations. As found with the orthophosphate series, Kβ′ peaks at 2123 eV do not vary strongly between species. The peaks in the Kβ1,3 region, derived from orbitals with O(p) character, decrease in intensity at 2132 eV and increase in intensity 2138 eV with a decreasing number of phosphates. The calculations match well overall with experiment, and the corresponding trends are clear in the difference spectra. Calculations confirm that P Kβ spectra of these compounds report on the phosphate local environment in particular, with the ribonucleotide having a negligible influence (see ESI Section 4†). The differences between ADP and ATP in particular are rather small, but the change in intensity at 2130 eV and the broadening of the peak at 2139 eV for ATP allow for distinction between low-noise spectra.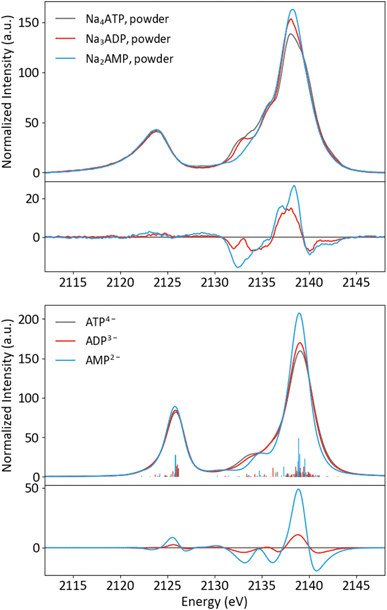 | ||
| Fig. 8 Experimental (top) and calculated (bottom) spectra of ATP, ADP and AMP salts, with differences (AXP–ATP). | ||
Solution phase spectra of ATP and ADP at 30 mM are shown in Fig. 9. As with the powder samples, the spectra of ATP and ADP are distinguishable but not grossly different. However, it is important to consider the biologically relevant reaction that occurs: ATP → ADP + Pi. As XES is an element-selective probe, the orthophosphate would also contribute to the overall spectra. As such, the most relevant spectral comparison is between ATP and ADP + Pi, for which the differences become more apparent. In order to correctly approximate this comparison, the pH of the environment needs to be considered. A mixture of species (13% H2PO4− and 87% HPO42−) is present at pH 8, so the weighted average of two single-species spectra was used to create a pH 8 Pi spectrum. The weighted 1 : 2 pH 8 Pi : ADP spectrum shown in Fig. 9 properly accounts for the change that would occur to the P XES spectra upon ATP hydrolysis. An increase in peak intensity at 2138 eV and a decrease in the shoulder features between 2130 and 2135 eV are clearly visible in the difference spectrum versus ATP. The ATP spectrum also appears somewhat broader than that of its mixed spectrum counterpart.
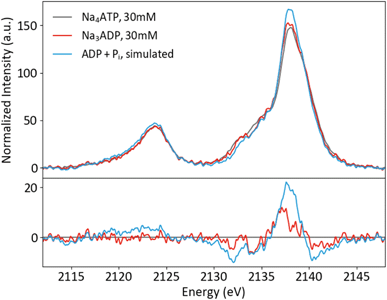 | ||
| Fig. 9 P Kβ spectra of ATP and ADP in solution, plus a simulated spectrum of the reaction product ADP + Pi, with differences (x-ATP). | ||
Adenine nucleotide speciation in solution is complex and dependent on the concentration, counterions and pH, and the conditions here (30 mM and pH 8) were chosen to minimize the distribution of species while maintaining a practical signal intensity for commissioning-type experiments. With increased concentration and in the presence of Mg2+ (which forms chelate complexes with polyphosphate groups), adenine nucleotides form stacked multimers.92 On the basis of known dissociation constants, our solutions were dominated by monomers of ATP4− (90%), MgATP2− (80%), ADP3− (90%) and AMP2− (85%), with the remainders dimerized. MgATP2− exists in two conformational classes, an open form (∼80%) in which Mg2+ is ligated only by the phosphate groups and water, and a closed form (∼20%) additionally including adenine ligation.92,93 Na+ does not bind significantly to ATP4− in solution. In almost all biochemical reactions in which they participate, adenine nucleotides are found in the form of metal ion complexes, typically with Mg2+.92
To investigate the sensitivity of P Kβ XES to cation coordination, spectra of Na4ATP and Mg2ATP were recorded from powders and solutions (Fig. 10). Parallel differences are visible in both phases: with Mg2+, the Kβ1,3 peak is sharper, has a less prominent first shoulder at 2135 eV and is shifted to lower energy overall, with peak maxima shifted by 0.2 eV in the powder and by 0.1 eV in solution. The similarity of these changes, made clear in the difference spectra, suggests that the influence of Mg2+ on the polyphosphate electronic structure is conserved in both phases. Calculations using free and Mg2+-bound structures of ATP with and without Mg2+ suggest the dication's influence on the triphosphate conformation and interactions with phosphate orbitals both influence the P Kβ spectra (see ESI Section 5†).
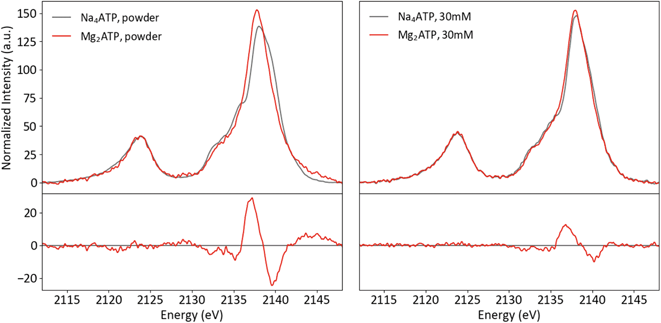 | ||
| Fig. 10 Powder (left) and solution (right) P Kβ spectra of Na4ATP and Mg2ATP, with differences (Mg2ATP–Na4ATP). | ||
NADP+ and NADPH
NADP+/NADPH is an important biological redox system, with NADPH providing the reducing equivalents for many metabolic reactions. The reduction from NADP to NADPH does not occur at one of the phosphates; rather, a proton and two electrons are added the nicotinamide, removing its aromaticity and formal charge as is depicted in Fig. 11. These distal differences will not influence the phosphorus Kβ spectrum directly through the covalent bonding structure; any spectral differences are due to concomitant conformational changes at the phosphates or intra-/intermolecular interactions with the phosphates. We also note that the NADP+ powder is once protonated on one of the phosphates, while NADPH was purchased in its quad-anionic form. | ||
| Fig. 11 Schematic reaction diagram of NADP+ and NADPH, with redox-relevant group circled in red and participating nitrogen shown in blue. | ||
Powder and solution spectra of NADP+ and NADPH are presented in Fig. 12, paired to accentuate trends in redox states (top row) and phases (bottom row). The two species differ strongly in the Kβ1,3 region, with intensity shifted from the shoulder at 2135 eV to the mainline upon reduction. This change is very similar in both phases, which indicates it is not a result of the powder protonation state. Rather, it appears that the redox state of the nicotinamide influences specific phosphate interactions in a manner that is consistent across phases.
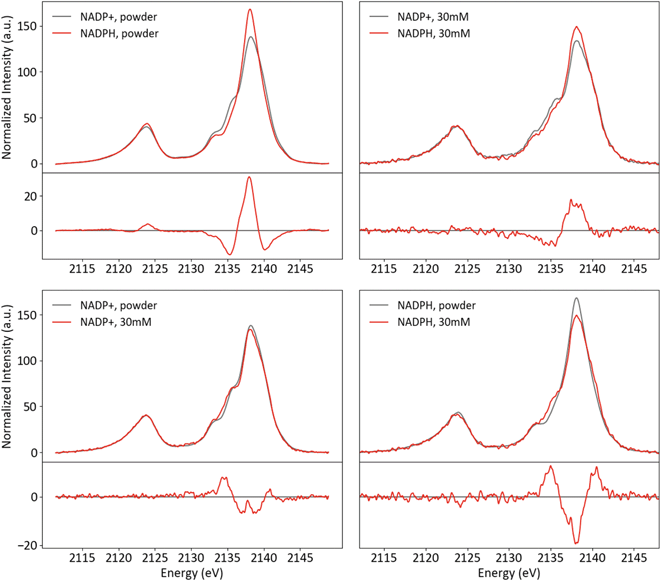 | ||
| Fig. 12 Powder and solution spectra of NADP+ and NADPH paired by phase (top) and redox state (bottom), with differences (red-black). | ||
For both species, the shoulder at 2135 eV is more pronounced in solution, while the intensity shift from the mainline (2138 eV) to the high-energy shoulder (2140 eV) is much stronger for NADPH than NADP. The former conserved change, similar to that observed for NaH2PO4 (vide supra), likely results from increased hydrogen bonding and reduced ionic interactions in solution. The latter change may be related to the difference between species that is conserved across phases.
To our knowledge, there is not sufficient published structural information about NADP+/NADPH in solid or solution phases to determine the intra- or intermolecular interactions responsible for the observed changes. DFT geometry optimizations of both species typically converged to structures with a hydrogen bond donation from the nicotinamide to the phosphate with which it shares a ribose (see ESI Section 6†). Since reduction changes the aromaticity and formal charge of the nicotinamide (and hence its hydrogen bonding properties), this intramolecular interaction is a reasonable candidate for the mediator between nicotinamide redox state and phosphate electronic structure. In particular, a hydrogen bond that is present in both phases only in NADP+ could explain the observations: the higher intensity shoulder at 2135 eV in NADP+ could be due to a strong hydrogen bond that persists in both phases, while the lack of such a bond could explain the stronger phase effect at 2038–2040 eV in NADPH. Experimental structural data or a more in-depth computational study are needed to test the above hypotheses or facilitate further speculation.
Discussion and conclusions
In this study, we have presented the first solution-phase Kβ XES of phosphate biomolecules, demonstrating the feasibility of the technique as well as its impressive sensitivity to non-covalent interactions of broad interest in biochemistry.X-ray spectroscopy of lighter elements (Z ≲ 22) presents practical challenges, including beam attenuation, sample damage and 1s core-hole fluorescence yield that are unfavorable compared to those of heavier elements. The present experiments benefitted from two redeeming factors: the very high incident flux of the PINK beamline and the high dipole allowedness of P 3p → 1s transitions compared to that of transition metal VtC transitions.94 For reader calibration, the solution spectrum of 30 mM Na4ATP presented above required 63 minutes of beam exposure time in 156 minutes of clock time, while the corresponding powder spectrum took 8 minutes to collect. We note, too, that all data presented here were from unoptimized experiments conducted during the commissioning of the PINK beamline; with our next-generation sample cell, the clock time could be reduced to approximately the exposure time and the sensitivity improved. Compared to P XAS, sample preparation for P XES is simple and adaptable. With its rich electronic structural information content and rapid solid-state measurement times, P XES will complement the speciation capability provided by the narrower linewidths of 31P NMR.
In the orthophosphate series, we used molecular symmetry to obtain a basic understanding of P Kβ X-ray emission. Spectra of H2PO4− revealed that Kβ1,3 features (and hence phosphate valence MOs) are sensitive to the ionic and hydrogen bonding interactions present in solid NaH2PO4 and its solution. Prior structural data and DFT calculations allowed further assignment of the transitions and emphasized the necessity of a quantum chemical approach to understanding such interactions. Though simple single-point DFT calculations are illuminating, biochemical applications of P Kβ XES would benefit from a complimentary computational approach that samples a large conformational space, such as ab initio molecular dynamics or hybrid quantum mechanics/molecular mechanics.84,95
Solution P Kβ XES of adenine nucleotides and the NADP+/NADPH redox system further demonstrated the ability of the technique to probe reactions and non-covalent interactions in a biochemical context. Monitoring the hydrolysis of ATP to ADP and Pi in solution is clearly plausible. Moreover, sensitivity to the conformational and electronic structural consequences of Mg2+ binding to ATP and even distal changes like the reduction of NADP to NADPH offers great promise for future studies. Both phosphate-transferring systems and the many enzymatic reactions that rely on phosphate cofactors could be targeted. The specific utility of XES, including time resolution and the potential for multi-modal or two-color experiments is also noteworthy. Beyond biochemistry, in situ P Kβ XES could be of particular interest for homogeneous catalysis research: nucleophilic phosphine catalysts are increasingly used to prepare pharmaceuticals, natural products and materials, and phosphorus-based ligands are perhaps the most important class of spectator ligands in transition metal catalysis.96–99 Interest in the use of phosphorus in battery electrodes and other advanced materials is also growing.100–105 Overall, we believe P Kβ XES could find broad use and impact in fields relevant to chemical energy conversion.
Author contributions
ZM, OMS and SD conceptualized the project. ZM, OMS and SP developed the methodology and conducted the investigations. ZM and SP curated data and worked on software components, and ZM performed the formal analysis. ZM and OMS validated experiments and visualized data. SD served as the project supervisor. OMS wrote the original draft, and all authors reviewed and edited the manuscript.Conflicts of interest
The authors have no conflicts of interest to declare.Acknowledgements
The authors acknowledge the Max Planck Society for funding and HZB for providing synchrotron radiation beamtime. The authors thank Olaf Ruediger for providing expertise and equipment for the solution measurements.References
- R. J. P. Williams, in Novartis Foundation Symposia, ed. R. Porter and D. W. Fitzsimons, John Wiley & Sons, Ltd., Chichester, UK, 2008, pp. 95–116 Search PubMed.
- S. A. Kholodar, C. L. Allen, A. M. Gulick and A. S. Murkin, The Role of Phosphate in a Multistep Enzymatic Reaction: Reactions of the Substrate and Intermediate in Pieces, J. Am. Chem. Soc., 2015, 9, 2748–2756 CrossRef PubMed.
- H.-W. Xue, X. Chen and Y. Mei, Function and regulation of phospholipid signalling in plants, Biochem. J., 2009, 421, 145–156 CrossRef CAS PubMed.
- T. Elston, H. Wang and G. Oster, Energy transduction in ATP synthase, Nature, 1998, 391, 510–513 CrossRef CAS PubMed.
- R. W. Miller, R. R. Eady, C. Gormal, S. A. Fairhurst and B. E. Smith, Nucleotide binding by the nitrogenase Fe protein: a 31P NMR study of ADP and ATP interactions with the Fe protein of Klebsiella pneumoniae, Biochem. Eng. J., 1998, 334, 601–607 CrossRef CAS PubMed.
- T. Romeis, Calcium-dependent protein kinases play an essential role in a plant defence response, EMBO J., 2001, 20, 5556–5567 CrossRef CAS PubMed.
- J. Weng, Y. Cao, N. Moss and M. Zhou, Modulation of Voltage-dependent Shaker Family Potassium Channels by an Aldo-Keto Reductase, J. Biol. Chem., 2006, 281, 15194–15200 CrossRef CAS PubMed.
- T. Urao, K. Yamaguchi-Shinozaki and K. Shinozaki, Two-component systems in plant signal transduction, Trends Plant Sci., 2000, 5, 67–74 CrossRef CAS PubMed.
- S. Kawai and K. Murata, Structure and Function of NAD Kinase and NADP Phosphatase: Key Enzymes That Regulate the Intracellular Balance of NAD(H) and NADP(H), Biosci., Biotechnol., Biochem., 2008, 72, 919–930 CrossRef CAS PubMed.
- N. Pollak, C. Dölle and M. Ziegler, The power to reduce: pyridine nucleotides – small molecules with a multitude of functions, Biochem. J., 2007, 402, 205–218 CrossRef CAS PubMed.
- I. Giacomini, E. Ragazzi, G. Pasut and M. Montopoli, The Pentose Phosphate Pathway and Its Involvement in Cisplatin Resistance, Int. J. Mol. Sci., 2020, 21, 937 CrossRef CAS PubMed.
- R. R. Copley and G. J. Barton, A Structural Analysis of Phosphate and Pulphate Binding Sites in Proteins, J. Mol. Biol., 1994, 242, 321–329 CAS.
- J. Wang, G. J. S. Lohman and J. Stubbe, Mechanism of Inactivation of Human Ribonucleotide Reductase with p53R2 by Gemcitabine 5′-Diphosphate, Biochemistry, 2009, 48, 11612–11621 CrossRef CAS PubMed.
- Organophosphates Chemistry, Fate, and Effects, ed. J. E. Chambers and P. E. Levi, Elsevier, 1992 Search PubMed.
- J. De Ruyck, M. Famerée, J. Wouters, E. A. Perpète, J. Preat and D. Jacquemin, Towards the understanding of the absorption spectra of NAD(P)H/NAD(P)+ as a common indicator of dehydrogenase enzymatic activity, Chem. Phys. Lett., 2007, 450, 119–122 CrossRef CAS.
- O. Back, M. Henry-Ellinger, C. D. Martin, D. Martin and G. Bertrand, 31P NMR Chemical Shifts of Carbene-Phosphinidene Adducts as an Indicator of the π-Accepting Properties of Carbenes, Angew. Chem., Int. Ed., 2013, 52, 2939–2943 CrossRef PubMed.
- D. G. Gorenstein, Conformation and Dynamics of DNA and Protein-DNA Complexes by 31P NMR, Chem. Rev., 1994, 94, 1315–1338 CrossRef CAS.
- P. Wang, R. M. Izatt, J. L. Oscarson and S. E. Gillespie, 1H NMR Study of Protonation and Mg(II) Coordination of AMP, ADP, and ATP at 25, 50, and 70 °C, J. Phys. Chem., 1996, 100, 9556–9560 CrossRef CAS.
- K. Klatt, G. Stephan, G. Peters and F. Tuczek, Spectroscopic Characterization of Molybdenum Dinitrogen Complexes Containing a Combination of Di- and Triphosphine Coligands: 31P NMR Analysis of Five-Spin Systems, Inorg. Chem., 2008, 47, 6541–6550 CrossRef CAS PubMed.
- D. Gudat, W. Hoffbauer, E. Niecke, W. W. Schoeller, U. Fleischer and W. Kutzelnigg, Phosphorus-31 Solid-State NMR Study of Iminophosphines: Influence of Electronic Structure and Configuration of the Double Bond on Phosphorus Shielding, J. Am. Chem. Soc., 1994, 116, 7325–7331 CrossRef CAS.
- J. M. Griffin, A. C. Forse, W.-Y. Tsai, P.-L. Taberna, P. Simon and C. P. Grey, In situ NMR and electrochemical quartz crystal microbalance techniques reveal the structure of the electrical double layer in supercapacitors, Nat. Mater., 2015, 14, 812–819 CrossRef CAS PubMed.
- M. Baldus, B. H. Meier, R. R. Ernst, A. P. M. Kentgens, H. Meyer zu Altenschildesche and R. Nesper, Structure Investigation on Anhydrous Disodium Hydrogen Phosphate Using Solid-State NMR and X-ray Techniques, J. Am. Chem. Soc., 1995, 117, 5141–5147 CrossRef CAS.
- J. Kim, D. S. Middlemiss, N. A. Chernova, B. Y. X. Zhu, C. Masquelier and C. P. Grey, Linking Local Environments and Hyperfine Shifts: A Combined Experimental and Theoretical 31P and 7Li Solid-State NMR Study of Paramagnetic Fe(III) Phosphates, J. Am. Chem. Soc., 2010, 132, 16825–16840 CrossRef CAS PubMed.
- O. Pecher, J. Carretero-González, K. J. Griffith and C. P. Grey, Materials' Methods: NMR in Battery Research, Chem. Mater., 2017, 29, 213–242 CrossRef CAS.
- O. Pecher, P. M. Bayley, H. Liu, Z. Liu, N. M. Trease and C. P. Grey, Automatic Tuning Matching Cycler (ATMC) in situ NMR spectroscopy as a novel approach for real-time investigations of Li- and Na-ion batteries, J. Magn. Reson., 2016, 265, 200–209 CrossRef CAS PubMed.
- O. Pecher, J. Carretero-González, K. J. Griffith and C. P. Grey, Materials' Methods: NMR in Battery Research, Chem. Mater., 2017, 29, 213–242 CrossRef CAS.
- T. Wiegand, A solid-state NMR tool box for the investigation of ATP-fueled protein engines, Prog. Nucl. Magn. Reson. Spectrosc., 2020, 117, 1–32 CrossRef CAS PubMed.
- A. G. Tzakos, C. R. R. Grace, P. J. Lukavsky and R. Riek, NMR Techniques For Very Large Proteins and RNAS in Solution, Annu. Rev. Biophys. Biomol. Struct., 2006, 35, 319–342 CrossRef CAS PubMed.
- S. M. Cohen and C. T. Burt, 31P nuclear magnetic relaxation studies of phosphocreatine in intact muscle: determination of intracellular free magnesium, Proc. Natl. Acad. Sci. U. S. A., 1977, 74, 4271–4275 CrossRef CAS PubMed.
- W. Bogner, M. Chmelik, A. I. Schmid, E. Moser, S. Trattnig and S. Gruber, Assessment of 31 P relaxation times in the human calf muscle: a comparison between 3 T and 7 T in vivo, Magn. Reson. Med., 2009, 62, 574–582 CrossRef CAS PubMed.
- G. Schreiber, G. Haran and H.-X. Zhou, Fundamental Aspects of Protein–Protein Association Kinetics, Chem. Rev., 2009, 109, 839–860 CrossRef CAS PubMed.
- G. S. Henderson, F. M. F. de Groot and B. J. A. Moulton, X-ray Absorption Near-Edge Structure (XANES) Spectroscopy, Rev. Mineral. Geochem., 2014, 78, 75–138 CrossRef CAS.
- J. Kruse, M. Abraham, W. Amelung, C. Baum, R. Bol, O. Kühn, H. Lewandowski, J. Niederberger, Y. Oelmann, C. Rüger, J. Santner, M. Siebers, N. Siebers, M. Spohn, J. Vestergren, A. Vogts and P. Leinweber, Innovative methods in soil phosphorus research: a review, J. Plant Nutr. Soil Sci., 2015, 178, 43–88 CrossRef CAS PubMed.
- Developments in Soil Science, ed. B. Singh and M. Gräfe, Elsevier, 2010, vol. 34 Search PubMed.
- J. Kruse, P. Leinweber, K.-U. Eckhardt, F. Godlinski, Y. Hu and L. Zuin, Phosphorus L2,3 -edge XANES: overview of reference compounds, J. Synchrotron Radiat., 2009, 16, 247–259 CrossRef CAS PubMed.
- C. M. Donahue, S. P. McCollom, C. M. Forrest, A. V. Blake, B. J. Bellott, J. M. Keith and S. R. Daly, Impact of Coordination Geometry, Bite Angle, and Trans Influence on Metal–Ligand Covalency in Phenyl-Substituted Phosphine Complexes of Ni and Pd, Inorg. Chem., 2015, 54, 5646–5659 CrossRef CAS PubMed.
- K. Lee, A. V. Blake, C. M. Donahue, K. D. Spielvogel, B. J. Bellott and S. R. Daly, Quantifying the Interdependence of Metal–Ligand Covalency and Bond Distance Using Ligand K-edge XAS, Angew. Chem., Int. Ed., 2019, 58, 12451–12455 CrossRef CAS PubMed.
- I. Persson, W. Klysubun and D. Lundberg, A K-edge P XANES study of phosphorus compounds in solution, J. Mol. Struct., 2019, 1179, 608–611 CrossRef CAS.
- R. Franke and J. Hormes, The P K-near edge absorption spectra of phosphates, Phys. B, 1995, 216, 85–95 CrossRef CAS.
- N. Lee, T. Petrenko, U. Bergmann, F. Neese and S. DeBeer, Probing Valence Orbital Composition with Iron Kβ X-ray Emission Spectroscopy, J. Am. Chem. Soc., 2010, 132, 9715–9727 CrossRef CAS PubMed.
- Z. Mathe, D. A. Pantazis, H. B. Lee, R. Gnewkow, B. E. Van Kuiken, T. Agapie and S. DeBeer, Calcium Valence-to-Core X-ray Emission Spectroscopy: A Sensitive Probe of Oxo Protonation in Structural Models of the Oxygen-Evolving Complex, Inorg. Chem., 2019, 58, 16292–16301 CrossRef CAS PubMed.
- J. A. Rees, A. Wandzilak, D. Maganas, N. I. C. Wurster, S. Hugenbruch, J. K. Kowalska, C. J. Pollock, F. A. Lima, K. D. Finkelstein and S. DeBeer, Experimental and theoretical correlations between vanadium K-edge X-ray absorption and K $$\varvec{\beta} $$ β emission spectra, JBIC, J. Biol. Inorg. Chem., 2016, 21, 793–805 CrossRef CAS PubMed.
- M. A. Beckwith, M. Roemelt, M.-N. Collomb, C. DuBoc, T.-C. Weng, U. Bergmann, P. Glatzel, F. Neese and S. DeBeer, Manganese Kβ X-ray Emission Spectroscopy As a Probe of Metal–Ligand Interactions, Inorg. Chem., 2011, 50, 8397–8409 CrossRef CAS PubMed.
- G. E. Cutsail, N. L. Gagnon, A. D. Spaeth, W. B. Tolman and S. DeBeer, Valence-to-Core X-ray Emission Spectroscopy as a Probe of O–O Bond Activation in Cu2O2 Complexes, Angew. Chem., Int. Ed., 2019, 58, 9114–9119 CrossRef CAS PubMed.
- Y. Pushkar, X. Long, P. Glatzel, G. W. Brudvig, G. C. Dismukes, T. J. Collins, V. K. Yachandra, J. Yano and U. Bergmann, Direct Detection of Oxygen Ligation to the Mn4Ca Cluster of Photosystem II by X-ray Emission Spectroscopy, Angew. Chem., Int. Ed., 2010, 49, 800–803 CrossRef CAS PubMed.
- K. M. Lancaster, M. Roemelt, P. Ettenhuber, Y. Hu, M. W. Ribbe, F. Neese, U. Bergmann and S. DeBeer, X-ray Emission Spectroscopy Evidences a Central Carbon in the Nitrogenase Iron–Molybdenum Cofactor, Science, 2011, 334, 974–977 CrossRef CAS PubMed.
- B. Ravel, A. J. Kropf, D. Yang, M. Wang, M. Topsakal, D. Lu, M. C. Stennett and N. C. Hyatt, Nonresonant valence-to-core X-ray emission spectroscopy of niobium, Phys. Rev. B: Condens. Matter Mater. Phys., 2018, 97, 125139 CrossRef CAS PubMed.
- R. G. Castillo, J. T. Henthorn, J. McGale, D. Maganas and S. DeBeer, Kβ X-Ray Emission Spectroscopic Study of a Second-Row Transition Metal (Mo) and Its Application to Nitrogenase-Related Model Complexes, Angew. Chem., Int. Ed., 2020, 59, 12965–12975 CrossRef CAS PubMed.
- J. Hoszowska and J.-C. Dousse, Enhanced X-ray emission from the valence states to the 1s and 2s levels in metallic Mo and several Mo compounds, J. Phys. B: At., Mol. Opt. Phys., 1996, 29, 1641–1653 CrossRef CAS.
- M. Petric, R. Bohinc, K. Bučar, S. H. Nowak, M. Žitnik and M. Kavčič, Electronic Structure of Third-Row Elements in Different Local Symmetries Studied by Valence-to-Core X-ray Emission Spectroscopy, Inorg. Chem., 2016, 55, 5328–5336 CrossRef CAS PubMed.
- W. M. Holden, E. P. Jahrman, N. Govind and G. T. Seidler, Probing Sulfur Chemical and Electronic Structure with Experimental Observation and Quantitative Theoretical Prediction of Kα and Valence-to-Core Kβ X-ray Emission Spectroscopy, J. Phys. Chem. A, 2020, 124, 5415–5434 CrossRef CAS PubMed.
- M. Qureshi, S. H. Nowak, L. I. Vogt, J. J. H. Cotelesage, N. V. Dolgova, S. Sharifi, T. Kroll, D. Nordlund, R. Alonso-Mori, T.-C. Weng, I. J. Pickering, G. N. George and D. Sokaras, Sulfur Kβ X-ray emission spectroscopy: comparison with sulfur K-edge X-ray absorption spectroscopy for speciation of organosulfur compounds, Phys. Chem. Chem. Phys., 2021, 23, 4500–4508 RSC.
- B. A. Averill, T. Herskovitz, R. H. Holm and J. A. Ibers, Synthetic analogs of the active sites of iron-sulfur proteins. II. Synthesis and structure of the tetra[mercapto-.mu.3-sulfido-iron] clusters, [Fe4S4(SR)4]2−, J. Am. Chem. Soc., 1973, 95, 3523–3534 CrossRef CAS PubMed.
- C. Sugiura, Y. Gohshi and I. Suzuki, Sulfur K β X-ray emission spectra and electronic structures of some metal sulfides, Phys. Rev. B: Solid State, 1974, 10, 338–343 CrossRef CAS.
- J. Niskanen, C. J. Sahle, K. O. Ruotsalainen, H. Müller, M. Kavčič, M. Žitnik, K. Bučar, M. Petric, M. Hakala and S. Huotari, Sulphur Kβ emission spectra reveal protonation states of aqueous sulfuric acid, Sci. Rep., 2016, 6, 21012 CrossRef CAS PubMed.
- J. L. Stein, W. M. Holden, A. Venkatesh, M. E. Mundy, A. J. Rossini, G. T. Seidler and B. M. Cossairt, Probing Surface Defects of InP Quantum Dots Using Phosphorus Kα and Kβ X-ray Emission Spectroscopy, Chem. Mater., 2018, 30, 6377–6388 CrossRef CAS.
- M. Petric and M. Kavčič, Chemical speciation via X-ray emission spectroscopy in the tender X-ray range, J. Anal. At. Spectrom., 2016, 31, 450–457 RSC.
- M. Petric, R. Bohinc, K. Bučar, M. Žitnik, J. Szlachetko and M. Kavčič, Chemical State Analysis of Phosphorus Performed by X-ray Emission Spectroscopy, Anal. Chem., 2015, 87, 5632–5639 CrossRef CAS PubMed.
- I. J. Pickering, G. N. George, E. Y. Yu, D. C. Brune, C. Tuschak, J. Overmann, J. T. Beatty and R. C. Prince, Analysis of Sulfur Biochemistry of Sulfur Bacteria Using X-ray Absorption Spectroscopy, Biochemistry, 2001, 40, 8138–8145 CrossRef CAS PubMed.
- M. Petric and M. Kavčič, Chemical speciation via X-ray emission spectroscopy in the tender X-ray range, J. Anal. At. Spectrom., 2016, 31, 450–457 RSC.
- N. Levin, S. Peredkov, T. Weyhermüller, O. Rüdiger, N. B. Pereira, D. Grötzsch, A. Kalinko and S. DeBeer, Ruthenium 4d-to-2p X-ray Emission Spectroscopy: A Simultaneous Probe of the Metal and the Bound Ligands, Inorg. Chem., 2020, 59, 8272–8283 CrossRef CAS PubMed.
- P. H. C. Eilers, A Perfect Smoother, Anal. Chem., 2003, 75, 3631–3636 CrossRef CAS PubMed.
- J. Midelet, A. H. El-Sagheer, T. Brown, A. G. Kanaras, A. Débarre and M. H. V. Werts, Spectroscopic and Hydrodynamic Characterisation of DNA-Linked Gold Nanoparticle Dimers in Solution using Two-Photon Photoluminescence, ChemPhysChem, 2018, 19, 827–836 CrossRef CAS PubMed.
- F. Neese, The ORCA program system, Wiley Interdiscip. Rev.: Comput. Mol. Sci., 2012, 2, 73–78 CAS.
- M. D. Hanwell, D. E. Curtis, D. C. Lonie, T. Vandermeersch, E. Zurek and G. R. Hutchison, Avogadro: an advanced semantic chemical editor, visualization, and analysis platform, J. Cheminf., 2012, 4, 17 CAS.
- A. D. Becke, Density-functional exchange-energy approximation with correct asymptotic behavior, Phys. Rev. A, 1988, 38, 3098–3100 CrossRef CAS PubMed.
- F. Weigend and R. Ahlrichs, Balanced basis sets of split valence, triple zeta valence and quadruple zeta valence quality for H to Rn: Design and assessment of accuracy, Phys. Chem. Chem. Phys., 2005, 7, 3297 RSC.
- C. Kollmar, The role of energy denominators in self-consistent field (SCF) calculations for open shell systems, J. Chem. Phys., 1996, 105, 10 CrossRef.
- F. Neese, Approximate second-order SCF convergence for spin unrestricted wavefunctions, Chem. Phys. Lett., 2000, 325, 93–98 CrossRef CAS.
- M. U. Delgado-Jaime and S. DeBeer, Expedited Analysis of DFT Outputs: Introducing MOAnalyzer, J. Comput. Chem., 2012, 2180–2185 CrossRef CAS PubMed.
- Y. Ito, T. Tochio, M. Yamashita, S. Fukushima, A. M. Vlaicu, Ł. Syrocki, K. Słabkowska, E. Weder, M. Polasik, K. Sawicka, P. Indelicato, J. P. Marques, J. M. Sampaio, M. Guerra, J. P. Santos and F. Parente, Structure of high-resolution Kβ1,3 X-ray emission spectra for the elements from Ca to Ge, Phys. Rev. A, 2018, 97, 1–10 Search PubMed.
- P. Glatzel and U. Bergmann, High resolution 1s core hole X-ray spectroscopy in 3d transition metal complexes - electronic and structural information, Coord. Chem. Rev., 2005, 249, 65–95 CrossRef CAS.
- H. Enkisch, C. Sternemann, M. Paulus, M. Volmer and W. Schülke, 3d spectator hole satellites of the Cu Kβ1,3 and Kβ2,5 emission spectrum, Phys. Rev. A, 2004, 70, 022508 CrossRef.
- T. Mukoyama and K. Taniguchi, Atomic excitation as the result of inner-shell vacancy production, Phys. Rev. A, 1987, 36, 693–698 CrossRef CAS PubMed.
- U. Bergmann, C. R. Horne, T. J. Collins, J. M. Workman and S. P. Cramer, Chemical dependence of interatomic X-ray transition energies and intensities – a study of Mn Kβ′′ and Kβ2,5 spectra, Chem. Phys. Lett., 1999, 302, 119–124 CrossRef CAS.
- C. J. Pollock, K. Grubel, P. L. Holland and S. DeBeer, Experimentally quantifying small-molecule bond activation using valence-to-core X-ray emission spectroscopy, J. Am. Chem. Soc., 2013, 135, 11803–11808 CrossRef CAS PubMed.
- B. Lassalle-Kaiser, T. T. Boron, V. Krewald, J. Kern, M. A. Beckwith, M. U. Delgado-Jaime, H. Schroeder, R. Alonso-Mori, D. Nordlund, T. C. Weng, D. Sokaras, F. Neese, U. Bergmann, V. K. Yachandra, S. DeBeer, V. L. Pecoraro and J. Yano, Experimental and computational X-ray emission spectroscopy as a direct probe of protonation states in oxo-bridged MnIV dimers relevant to redox-active metalloproteins, Inorg. Chem., 2013, 52, 12915–12922 CrossRef CAS PubMed.
- M. U. Delgado-Jaime, S. DeBeer and M. Bauer, Valence-to-Core X-Ray Emission Spectroscopy of Iron-Carbonyl Complexes: Implications for the Examination of Catalytic Intermediates, Chem.–Eur. J., 2013, 19, 15888–15897 CrossRef CAS PubMed.
- V. Martin-Diaconescu, K. N. Chacón, M. U. Delgado-Jaime, D. Sokaras, T. C. Weng, S. DeBeer and N. J. Blackburn, Kβ Valence to Core X-ray Emission Studies of Cu(I) Binding Proteins with Mixed Methionine - Histidine Coordination. Relevance to the Reactivity of the M- and H-sites of Peptidylglycine Monooxygenase, Inorg. Chem., 2016, 55, 3431–3439 CrossRef CAS PubMed.
- O. McCubbin Stepanic, J. Ward, J. E. Penner-Hahn, A. Deb, U. Bergmann and S. DeBeer, Probing a Silent Metal: A Combined X-ray Absorption and Emission Spectroscopic Study of Biologically Relevant Zinc Complexes, Inorg. Chem., 2020, 59, 13551–13560 CrossRef PubMed.
- R. N. P. Choudhary, R. J. Nelmes and K. D. Rouse, A room-temperature neutron-diffraction study of NaH2PO4, Chem. Phys. Lett., 1981, 78, 102–105 CrossRef CAS.
- I. Persson, M. Trublet and W. Klysubun, Structure Determination of Phosphoric Acid and Phosphate Ions in Aqueous Solution Using EXAFS Spectroscopy and Large Angle X-ray Scattering, J. Phys. Chem. A, 2018, 122, 7413–7420 CrossRef CAS PubMed.
- M. Śmiechowski, E. Gojło and J. Stangret, Systematic Study of Hydration Patterns of Phosphoric(V) Acid and Its Mono-, Di-, and Tripotassium Salts in Aqueous Solution, J. Phys. Chem. B, 2009, 113, 7650–7661 CrossRef PubMed.
- S. Borah, Hydration Properties of HnPO4n−3 (n = 0–3) From Ab Initio Molecular Dynamics Simulations, J. Phys. Chem. B, 2020, 124, 5454–5464 CrossRef CAS PubMed.
- Y. Marcus, Effect of Ions on the Structure of Water: Structure Making and Breaking, Chem. Rev., 2009, 109, 1346–1370 CrossRef CAS PubMed.
- A. Eiberweiser, A. Nazet, G. Hefter and R. Buchner, Ion Hydration and Association in Aqueous Potassium Phosphate Solutions, J. Phys. Chem. B, 2015, 119, 5270–5281 CrossRef CAS PubMed.
- J. L. Campbell and T. Papp, Widths of the Atomic K–N7 Levels, At. Data Nucl. Data Tables, 2001, 77, 1–56 CrossRef CAS.
- E. Arunan, G. R. Desiraju, R. A. Klein, J. Sadlej, S. Scheiner, I. Alkorta, D. C. Clary, R. H. Crabtree, J. J. Dannenberg, P. Hobza, H. G. Kjaergaard, A. C. Legon, B. Mennucci and D. J. Nesbitt, Definition of the hydrogen bond (IUPAC Recommendations 2011), Pure Appl. Chem., 2011, 83, 1637–1641 CAS.
- A. Shahi and E. Arunan, Hydrogen bonding, halogen bonding and lithium bonding: an atoms in molecules and natural bond orbital perspective towards conservation of total bond order, inter- and intra-molecular bonding, Phys. Chem. Chem. Phys., 2014, 16, 22935–22952 RSC.
- Hydrogen Bonding—New Insights, ed. S. J. Grabowski, Springer, Netherlands, 2006 Search PubMed.
- A. Altun, F. Neese and G. Bistoni, Effect of Electron Correlation on Intermolecular Interactions: A Pair Natural Orbitals Coupled Cluster Based Local Energy Decomposition Study, J. Chem. Theory Comput., 2019, 15, 215–228 CrossRef CAS PubMed.
- H. Sigel and R. Griesser, Nucleoside 5′-triphosphates: Self-association, acid–base, and metal ion-binding properties in solution, Chem. Soc. Rev., 2005, 34, 875–900 RSC.
- H. Sigel, E. M. Bianchi, N. A. Corfù, Y. Kinjo, R. Tribolet and R. B. Martin, Stabilities and Isomeric Equilibria in Solutions of Monomeric Metal-Ion Complexes of Guanosine 5′-Triphosphate (GTP4−) and Inosine 5′-Triphosphate (ITP4−) in Comparison with Those of Adenosine 5′-Triphosphate (ATP4−), Chem.–Eur. J., 2001, 7, 3729–3737 CrossRef CAS.
- A. C. Thompson, X-ray Data Booklet, Lawrence Berkeley National Laboratory, Berkeley, 3rd edn, 2009 Search PubMed.
- C. M. Sterling and R. Bjornsson, Multistep Explicit Solvation Protocol for Calculation of Redox Potentials, J. Chem. Theory Comput., 2019, 15, 52–67 CrossRef CAS PubMed.
- M. L. Clarke and J. J. R. Frew, in Organometallic Chemistry, ed. I. J. S. Fairlamb and J. M. Lynam, Royal Society of Chemistry, Cambridge, 2009, vol. 35, pp. 19–46 Search PubMed.
- H. Guo, Y. C. Fan, Z. Sun, Y. Wu and O. Kwon, Phosphine Organocatalysis, Chem. Rev., 2018, 118, 10049–10293 CrossRef CAS PubMed.
- L.-W. Ye, J. Zhou and Y. Tang, Phosphine-triggered synthesis of functionalized cyclic compounds, Chem. Soc. Rev., 2008, 37, 1140–1152 RSC.
- P. W. N. M. van Leeuwen, in Organophosphorus Chemistry: From Molecules to Applications, John Wiley & Sons, Ltd, 2019, pp. 1–58 Search PubMed.
- X. Ling, H. Wang, S. Huang, F. Xia and M. S. Dresselhaus, The renaissance of black phosphorus, Proc. Natl. Acad. Sci. U. S. A., 2015, 112, 4523–4530 CrossRef CAS PubMed.
- H. Jin, S. Xin, C. Chuang, W. Li, H. Wang, J. Zhu, H. Xie, T. Zhang, Y. Wan, Z. Qi, W. Yan, Y.-R. Lu, T.-S. Chan, X. Wu, J. B. Goodenough, H. Ji and X. Duan, Black phosphorus composites with engineered interfaces for high-rate high-capacity lithium storage, Science, 2020, 370, 192–197 CrossRef CAS PubMed.
- C.-M. Park and H.-J. Sohn, Black Phosphorus and its Composite for Lithium Rechargeable Batteries, Adv. Mater., 2007, 19, 2465–2468 CrossRef CAS.
- Y. Liu, Q. Liu, C. Jian, D. Cui, M. Chen, Z. Li, T. Li, T. Nilges, K. He, Z. Jia and C. Zhou, Red-phosphorus-impregnated carbon nanofibers for sodium-ion batteries and liquefaction of red phosphorus, Nat. Commun., 2020, 11, 2520 CrossRef CAS PubMed.
- V. L. Deringer, M. A. Caro and G. Csányi, A general-purpose machine-learning force field for bulk and nanostructured phosphorus, Nat. Commun., 2020, 11, 5461 CrossRef CAS PubMed.
- S. Kim, G. Myeong, W. Shin, H. Lim, B. Kim, T. Jin, S. Chang, K. Watanabe, T. Taniguchi and S. Cho, Thickness-controlled black phosphorus tunnel field-effect transistor for low-power switches, Nat. Nanotechnol., 2020, 15, 203–206 CrossRef CAS PubMed.
Footnotes |
| † Electronic supplementary information (ESI) available. See DOI: 10.1039/d1sc01266e |
| ‡ These authors contributed equally. |
| This journal is © The Royal Society of Chemistry 2021 |

