 Open Access Article
Quantitative interrogation of protein co-aggregation using multi-color fluorogenic protein aggregation sensors†
Yulong
Bai
ab,
Wang
Wan
*a,
Yanan
Huang
a,
Wenhan
Jin
a,
Haochen
Lyu
a,
Qiuxuan
Xia
ab,
Xuepeng
Dong
c,
Zhenming
Gao
c and
Yu
Liu
 *a
*a
aCAS Key Laboratory of Separation Science for Analytical Chemistry, Dalian Institute of Chemical Physics, Chinese Academy of Sciences, 457 Zhongshan Road, Dalian 116023, China. E-mail: liuyu@dicp.ac.cn; wanwang@dicp.ac.cn
bUniversity of Chinese Academy of Sciences, Beijing 100049, China
cThe Second Hospital of Dalian Medical University, 467 Zhongshan Road, Dalian, 116044, China
First published on 20th May 2021
Abstract
Co-aggregation of multiple pathogenic proteins is common in neurodegenerative diseases but deconvolution of such biochemical process is challenging. Herein, we developed a dual-color fluorogenic thermal shift assay to simultaneously report on the aggregation of two different proteins and quantitatively study their thermodynamic stability during co-aggregation. Expansion of spectral coverage was first achieved by developing multi-color fluorogenic protein aggregation sensors. Orthogonal detection was enabled by conjugating sensors of minimal fluorescence crosstalk to two different proteins via sortase-tag technology. Using this assay, we quantified shifts in melting temperatures in a heterozygous model protein system, revealing that the thermodynamic stability of wild-type proteins was significantly compromised by the mutant ones but not vice versa. We also examined how small molecule ligands selectively and differentially interfere with such interplay. Finally, we demonstrated these sensors are suited to visualize how different proteins exert influence on each other upon their co-aggregation in live cells.
Introduction
Nascent polypeptides fold into defined structures to acquire their biological functions.1 Though the folding processes of most proteins are naturally evolved to be energetically favourable, the thermodynamic and kinetic stabilities of a protein are frequently compromised by cellular stresses, genetic mutations, and exogenous chemical modifications.2 Decreased protein stability leads to its misfolding, aggregation, and degradation. Numerous human diseases have been associated with aberrant protein aggregation, including Alzheimer's disease, Parkinson's disease, amyotrophic lateral sclerosis, and familiar amyloidosis.3–5 Multiple lines of biological and pathological evidence have confirmed the co-aggregation behaviours of different pathogenic proteins, such as amyloid β and Tau in Alzheimer's disease.6–9 Depicting the co-aggregation process is essential to delineate the disease mechanism and identify authentic drug target. However, it has always been a technical challenge to monitor different proteins' aggregation during the co-aggregation process.Much light has been shed on developing sensors and analytical methods to study protein aggregation both in vitro and in vivo.10,11 Fluorescence based methods have been widely explored due to their general applicability, flexibility, and robustness. Organic environment-sensitive dyes, including solvatochromic fluorophores,12,13 fluorescent molecular rotors,14–16 and aggregation induced emission (AIEgen) probes,17–19 can sense the micro-environmental changes upon protein aggregation. These sensors are exemplified by Thioflavin T,20 carbazoles,21 polythiophenes,22 and BODIPY.23 In particular, AIEgens developed by Tang,17,18 Zhu,19 Hong24,25et al. report on amyloid aggregates or unfolded proteins. Materials based reagents, like luminescent polymers, nanoparticles, or quantum dots, broadened the chemical space for amyloid sensors.26 Meade,27 Mirica28 and Marti29et al. filled in the gap of organic sensors and inorganic materials by using organometallic complexes to probe amyloid proteins. To further resolve the misfolded and aggregated ensembles, single molecule fluorescence based assay was developed by Deniz et al. to directly detect conformational subpopulations and their dynamics.30–32 In addition, mass spectrometry based methods developed by Englander33–36 and Robinson37–40 provided mechanistic insights at residual resolution.
However, most of the protein aggregation detection methods abovementioned are limited to single protein investigation and hardly resolve the co-aggregation process of different proteins. Towards this end, series of conventional bioanalytical methods have been exploited to capture snapshots of this process, such as co-immunoprecipitation, chromatography, and differential centrifugation. Biosensors enabled cell imaging techniques (fluorescence resonance energy transfer (FRET) or fluorescence correlation spectroscopy (FCS)) extended the study into cellular mileu.41,42 Towards intact and quantitative interrogation of protein co-aggregation process, Radford et al. pioneered in developing advanced mass spectrometry methods and provided unprecedented resolution in detecting the interplay of co-aggregation kinetics.6
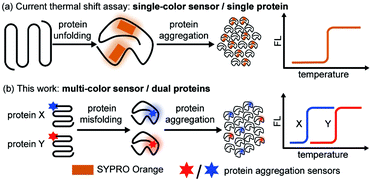
While most of the previous works focused on aggregation kinetics, we aimed to quantitatively study the interplay of the thermodynamic stability between different proteins during their co-aggregation process. Thermal shift assay is widely utilized in the pharmaceutical industry to evaluate protein thermodynamic stability and its change upon ligand binding due to its facile fluorescence readout, quantitative result, and high throughput nature.43–46 In particular, cellular thermal shift assay combined with proteomics has demonstrated its power in cellular drug-target engagement studies.47,48 However, current assay relies on a solvatochromic fluorophore SYPRO® orange49–51 or a fluorescent molecular rotor PROTEOSTAT®52–54 that reports on protein unfolding and aggregation (Fig. 1a), thus only suitable for single-protein analysis.
Herein, we created a dual-color thermal shift assay (TSA) that orthogonally and quantitatively monitors two different proteins' co-aggregation process (Fig. 1b). Petersson et al. exemplified bioorthogonal conjugation of a sensor to the protein target allowed for selective detection of protein conformational changes.55–57 Zhang et al. introduced chemical tag strategy to the field, enabling visualization of aggregation process of a specific protein-of-interest in live cells.58–62 Inspired by these seminal works, through sortase mediated site specific bio-conjugation, we first demonstrated four environment-sensitive fluorophores with spectral coverage from 500 nm to 620 nm can serve as protein aggregation sensors. Two of these sensors (CCVJ and Mero) exhibited minimal fluorescence crosstalk and detected the co-aggregation of two different proteins. Unlike other aggregation sensors only reporting on the late-stage species, our sensors detected early misfolded soluble oligomers. In contrast to the single-color thermal shift assay, our method revealed how mutant proteins of destabilized thermodynamic stability compromise the wild type ones during the co-aggregation process in a heterozygous system but not vice versa. Small molecule ligands exerted differential and selective influences on different proteins during their co-aggregation. Finally, we extended our study to the cellular milieu to detect protein co-aggregation in live cells.
Results and discussion
Environment-sensitive fluorophores serve as protein aggregation sensor
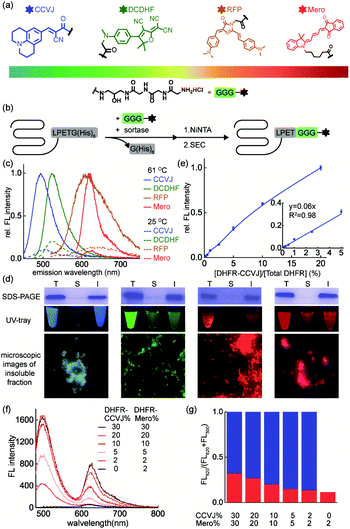
The key to simultaneously monitor the aggregation of different proteins using our proposed multi-color thermal shift assay (Fig. 1b) is the orthogonal fluorescence signal readouts with minimal crosstalk. Such crosstalk usually arises from fluorescence resonance energy transfer (FRET) due to spectral overlaps and spatial proximity after aggregation. To minimize the FRET effect, we first expanded the spectral coverage of fluorogenic sensors to detect protein aggregation. Protein phase separation that involves protein unfolding, misfolding, and aggregation often accompanies with changes in the polarity and viscosity of local micro-environment.25 Thus, fluorophores of polarity or viscosity sensitivity are potential candidates as protein aggregation sensors. Four environment-sensitive fluorophores were selected based on their environment-sensitive fluorogenicity reported in literatures (Fig. 2a), including CCVJ63 (Fig. S1,† a fluorescent molecular rotor sensitive to viscosity), DCDHF64,65 (Fig. S2,† a fluorescent molecular rotor sensitive to viscosity), RFP59,66,67 (Fig. S3,† a fluorescent molecular rotor sensitive to viscosity), and Mero68–70 (Fig. S4,† both a solvatochromic dye that is sensitive to polarity and a rotor that is sensitive to viscosity).Via sortase enzyme mediated site-specific bioconjugation71–74 to the model protein dihydrofolate reductase (DHFR, Fig. 2b, S5 experimental details and S6 mass spectrometry for labeling efficiency†), we demonstrated all four fluorophores can report on protein aggregation with satisfactory fluorescence enhancement upon protein aggregation (Fig. 2c, CCVJ 10.9-fold, DCDHF 4.9-fold, RFP 7.8-fold, Mero 11.6-fold fluorescence enhancement). Biochemical fractionation and fluorescence imaging experiments showed that the insoluble aggregated proteins were fluorescent (Fig. 2d). Detection limits and linear range measurements demonstrated that our method is quantitative and sensitive using labeled proteins from 0.0625% to 2% in substoichiometry (Fig. 2e and S7†).
We next evaluated whether combining fluorophore-labeled DHFR proteins will lead to FRET signal upon aggregation. Spectral analyses in solvent systems ruled out CCVJ–DCDHF and CCVJ–RFP pairs due to the significant spectral overlaps (Fig. S8†). Though Mero partially overlaps with the tail of CCVJ emission spectrum, it exhibited minimal FRET effect with CCVJ, especially when Mero-labeled DHFR was in substoichiometry (Fig. 2f, g). Thus, CCVJ and Mero can serve as an orthogonal sensor pair to monitor dual-protein co-aggregation process. Together we showed that environment-sensitive fluorophores of expanded spectral coverage enabled multi-color detection of different proteins' aggregation with minimal fluorescence cross-talk.
The fluorescence arises from misfolded oligomers
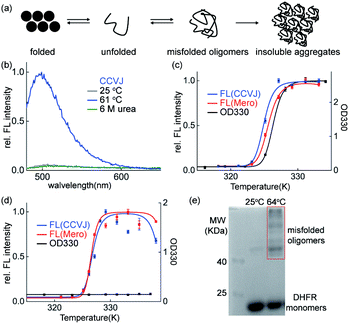
Though the insoluble protein aggregates retained the fluorescence (Fig. 2d), the fluorescence of these sensors may arise from the early aggregation precursors: unfolded proteins or misfolded soluble oligomers (Fig. 3a). We next performed series of biochemical and biophysical experiments to dissect the origin of their fluorescence in detecting protein aggregation.First, urea mediated unfolding of the DHFR-CCVJ and DHFR-Mero conjugates resulted in no fluorescence (Fig. 3b and S9†), showing that the fluorescence is not caused by unfolded proteins. Second, we used turbidity assay measured by UV-Vis spectroscopy (OD330 nm) to detect the presence of insoluble DHFR aggregates induced by heating the samples at indicated temperatures. The fluorescence signals of both CCVJ and Mero occurred at lower temperatures than the OD330 signal measuring the formation of insoluble DHFR proteins (Fig. 3c). This result suggested that the fluorescence of CCVJ and Mero may arise earlier than the formation of insoluble aggregates. Further, we found that DHFR formed no insoluble aggregates at pH 7.40 upon heating (Fig. 3d, black curve) while fluorescence was turned on (Fig. 3f, red and blue curves). In addition, we sequestered misfolded soluble oligomers of DHFR under this condition using chemical crosslinking experiment (Fig. 3e). In particular, the fluorescence intensity from misfolded oligomers was comparable to that in aggregated DHFR (Fig. S10†). Collectively, we confirmed that both CCVJ and Mero fluorescence were initially triggered by the formation of misfolded soluble oligomers and retained in insoluble aggregates. Unlike other amyloid sensors that reports on late-stage aggregated species, our sensors developed herein detected early misfolded soluble oligomers.
Dual-color thermal shift assay to quantify the interplay of thermodynamic stability during protein co-aggregation
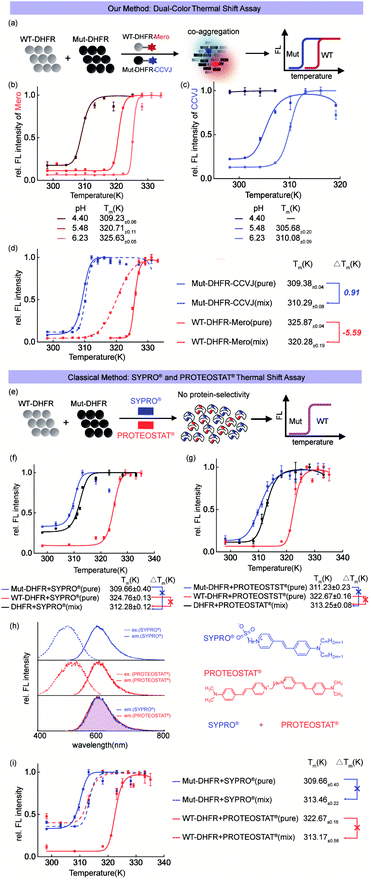
Before using CCVJ and Mero in the dual-color mode (Fig. 4a), we first tested whether they can report on protein aggregation and quantitatively measure the melting temperature (Tm) in the single-color mode. Using DHFR protein as a model system, we quantified the melting temperatures (Tm)51 of wild-type (WT, Fig. 4b) DHFR and mutant (Mut, M42T:H114R, Fig. 4c)75 DHFR protein at different pHs. We observed compromised thermodynamic stability of DHFR caused by point mutations (Tm = 325 K for WT-DHFR and 310 K for Mut-DHFR) and increased acidity of the buffer. Importantly, swapping CCVJ and Mero for bio-conjugation yielded similar melting temperatures in all cases, demonstrating the robustness of this assay in quantitative analysis (Fig. S11 and S12†).Heterozygous mixture of both wild-type and mutant proteins widely exists in nature especially in numerous hereditary human diseases. In this regard, we combined CCVJ and Mero into a dual-color thermal shift assay to investigate how WT-DHFR and Mut-DHFR mutually influence each other during their co-aggregation process. Our dual-color thermal shift assay allowed us to simultaneously monitor the misfolding and aggregation of both WT- and Mut-DHFR proteins (Fig. 4d) and quantify their Tm values that describe the thermodynamic stability. We observed exaggerated aggregation of WT-DHFR (Fig. 4d, red dash line) in the presence of aggregated Mut-DHFR (Fig. 4d, blue dash line), which can be possibly explained by the “seeding effect” of protein aggregation. Such interplay resulted in compromised thermodynamic stability of WT-DHFR (−5.59 K) and marginal rescue of Mut-DHFR stability (0.91 K). Control experiment demonstrated the fluorescence turn-on of Mut-DHFR-Mero requires both the self-aggregation of Mut-DHFR-Mero and the co-aggregation of surrounding unlabeled proteins (Fig. S13 and S14†).
To demonstrate the technical advantages of our assay, we included the commercial single-color thermal shift assay using SYPRO® orange dye and PROTEOSTAT® dye in parallel control experiments. Both dyes detect protein misfolding and aggregation by non-covalently binding to any aggregated proteins without protein selectivity (Fig. 4e). Such mechanism-of-action differs from our bioorthogonal covalent conjugation of sensor and thus prevents them from being used to resolve the thermodynamic profiles of different proteins. Both dyes provided a biased thermal shift curve in detecting protein co-aggregation of WT-DHFR and mut-DHFR (Fig. 4f and g, black curves). However, these commercial methods provided similar Tm values in the single pure protein mode as in our assay (Fig. 4dvs.f and g, solid red and blue curves), validating the robustness of our method. Moreover, the overlapped fluorescence spectra of both dyes (Fig. 4h) further impedes their applications in detecting protein co-aggregations due to the lack of signal orthogonality. Finally, combined addition of both dyes failed to resolve protein co-aggregation (Fig. 4i). These results clearly showed the advantages of our assay in comparison to the commercial single-color thermal shift assay.
The complexity of protein co-aggregation in transthyretin amyloidosis
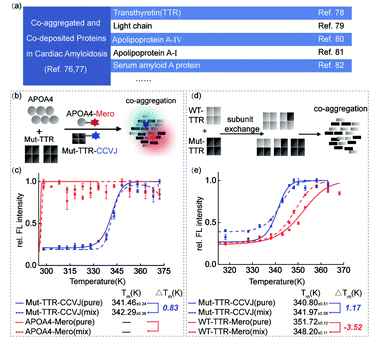
Transthyretin (TTR) is a homo-tetrameric protein in human blood plasma whose pathogenic mutations lead to hereditary amyloidosis, such as familiar polyneuropathy and senile cardiomyopathy. Intriguingly, multiple lines of clinical evidence have demonstrated the co-aggregation or co-deposition of pathogenic TTR amyloids and other amyloidogenic proteins, such as light chain, apolipoprotein A-IV, and serum amyloid A proteins (Fig. 5a).76–82 These pathological results lead to a biochemical question: what is the individual function of these co-aggregated proteins? To partially examine this question and demonstrate the application of our dual-color thermal shift assay in clinical scenarios, we selected transthyretin (TTR) and apolipoprotein A–IV (APOA4) as a pair of model proteins based on the clinical diagnosis results.83,84 We recombinantly prepared TTR and APOA4 proteins, characterized their structural features and labeled them with CCVJ and Mero fluorophores (Fig. S15†). We aimed to show how APOA4 protein influences the aggregation of TTR in a co-aggregation experiment (Fig. 5b). We found that the presence of aggregated APOA4 protein can slightly stabilized TTR mutant and inhibit its aggregation (Fig. 5c), suggesting its role as a pathological chaperone (Fig. S15e and S16†). This observation echoes the effect of apolipoprotein E in Alzheimer's disease widely reported in literature and may deserve further biochemical analysis.85–88Oligomeric proteins that involve subunit exchange between wild-type and mutant proteins in a heterozygous mixture pose further technical challenge to study the co-aggregation process and the interplay in the thermodynamic stability. In particular, patients carrying pathogenic TTR mutations are often heterozygous. Using TTR as a model system, we investigated how the thermodynamic stabilities of heterozygous mixture after subunit exchange fluctuated during heat induced co-aggregation (Fig. 5d and e). Similar with the monomeric DHFR scenario, WT-TTR was destabilized thermodynamically in the presence of Mut-TTR (−3.52 K) but Mut-TTR (L55P) was slightly rescued by WT-TTR (1.17 K) during co-aggregation. This observation deviates from the fact that TTR's kinetic stability can be significantly enhanced by subunit exchange with a stable mutant as TTR aggregation is kinetically controlled by the rate-limiting tetramer dissociation step. The TTR results highlighted the difference in protein thermodynamic and kinetic stability. To further study the impact of small molecule ligands on the thermodynamic stability during protein co-aggregation process, we utilized the recently FDA-approved kinetic stabilizer Tafamidis89 (Fig. S17†). We observed marginal thermodynamic stabilization effect by Tafamidis at substoichiometric concentration, and significant stabilization of both WT- and Mut-TTR at stoichiometric concentration. This observation can be explained by the fact that Tafamidis as a kinetic stabilizer controls the tetramer dissociation step and only takes secondary effect on the thermodynamic stability of monomeric TTR after dissociation. In this case, our results highlighted the significance of distinguishing whether the stabilizing effect of a ligand is driven by the kinetic or thermodynamic factors of the target proteins.
Overall, these results together demonstrated the assay developed herein can provide biochemical evidence to partially support and explain the complex clinical observations.
Dual-color thermal shift assay to evaluate drug stabilization effect on protein co-aggregation
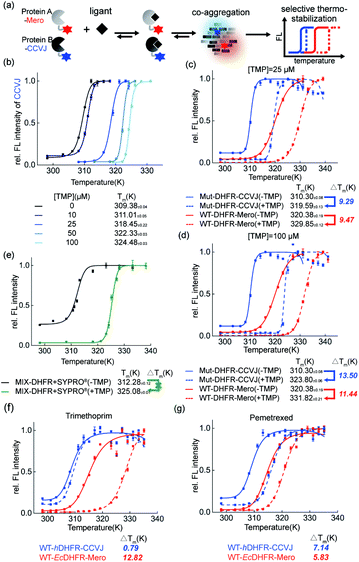
Thermal shift assay provides quantitative analysis of shifts in protein thermodynamic stability upon binding to ligands. In this work, we further evaluated how small molecule ligands interfere with protein co-aggregation process via our dual-color thermal shift assay (Fig. 6a).First, in the single-color mode, we demonstrated our assay is capable of quantifying the dose-dependent stabilization of DHFR by its known inhibitor trimethoprim (TMP, Fig. 6b). Second, we examined how TMP differentially stabilizes WT-DHFR and Mut-DHFR, namely the partition of ligands in this heterozygous model system. We observed that at substoichiometric concentration, TMP stabilized both WT- and Mut-DHFR to the similar extent (Fig. 6c, 9.47 K for WT, 9.29 K for Mut). However, when the ligand was in excess, TMP can stabilize Mut-DHFR to a larger extent than WT-DHFR (Fig. 6d, 13.50 K for Mut, 11.44 K for WT). However, in both scenarios, Mut-DHFR cannot be stabilized to the same stability as WT-DHFR when they were both stabilized by TMP. Again, such observation was not possible using the current single-color thermal shift assay by the SYPRO® orange dye (Fig. 6e). Finally, we evaluated how a ligand selectively engages into two homologous proteins from different organisms. Using human DHFR (hDHFR) and the abovementioned E. coli DHFR (EcDHFR) as a model system, we found that TMP as an antibiotic drug is extremely selective to EcDHFR (Fig. 6f), whereas pemetrexed as a chemotherapy reagent partitioned into hDHFR more than EcDHFR (Fig. 6g).
The interplay during protein co-aggregation in live cells
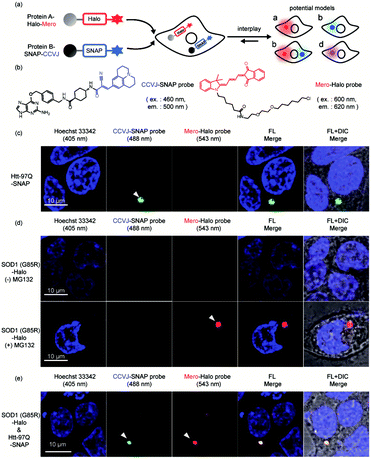
Finally, we extended our study into the complex cellular milieu to demonstrate these sensors are compatible with cellular applications. Sortase mediated protein ligation we used in this work is not compatible with cellular environment. Using the reported AggTag method, we approached to SNAP-Tag and Halo-Tag technologies for the bioorthogonal conjugation of CCVJ and Mero sensors towards two different POIs (Fig. 7a and b).57 We first demonstrated these two sensors can selectively detect single protein aggregation in live cells. In HEK293T cells transiently expressing Htt-97Q-SNAP whose aggregation leads to Huntington's disease,90,91 CCVJ-SNAP probe detected perinuclear puncta (Fig. 7c, 488 nm channel). In addition, proteasome inhibitor MG132 induced protein degradation attenuation resulted in the accumulation of SOD1 (G85R) -Halo aggregates in the cell,92 which was visualized by Mero-Halo probe (Fig. 7d, 543 nm channel). Interestingly, with sufficient degradation capacity, even mutant SOD1 can be degraded properly and did not accumulate in its aggregated state (Fig. 7d, upper panel). However, dual-color imaging experiment revealed that co-expression of Htt-97Q-SNAP together with SOD1 (G85R) -Halo proteins in HEK293T cells caused co-aggregation of both SOD1 (G85R) and Htt-97Q proteins in the perinuclear region of the cell (Fig. 7e). These results indicated that the aggregation of Htt-97Q may saturate the cellular degradation capacity and intoxicate the degradation of SOD1 (G85R) mutant, leading to the co-aggregation of both proteins. Different from the buffer environment, protein co-aggregation may influence each other by sharing the same protein quality control machineries and pathways. Together, these results demonstrated that the multi-color protein aggregation sensors developed here not only quantify changes in thermodynamic stability in buffer (Fig. 4 and 6) but also detect protein co-aggregation in live cells (Fig. 7).Conclusions
In summary, we have demonstrated how to repurpose environment-sensitive fluorophores to detect two proteins' aggregation via bioorthogonal labeling. Our dual-color thermal shift assay developed in this work allowed for orthogonal and quantitative study of protein co-aggregation process, which was impossible if using the commercial single-color thermal shift assay. Different from all previous kinetics studies, our work provided the first quantitative analysis on the thermodynamic interplay during protein co-aggregation. Future color enrichment of the sensor toolbox by developing novel protein aggregation sensors from solvatochromic fluorophores, fluorescent molecular rotors, and AIEgens may improve the detection multiplexity for more complex disease model systems, such as amyotrophic lateral sclerosis disease.93–95Data availability
Supplementary figures, experimental methods, and synthetic characterizations can be found in the supplementary information.Author contributions
Y. Liu and W. Wan conceptualized the project and edited the manuscript. Y. Bai performed the experiments, analyzed the data, and wrote the original draft. W. Jin, Y. Huang, H. Lyu, and Q. Xia provided experimental resources. X. Dong and Z. Gao helped with data analysis.Conflicts of interest
There are no conflicts to declare.Acknowledgements
This work was supported, in part, by funds from National Natural Science Foundation of China (21907091), the LiaoNing Revitalization Talents Program from the Liaoning province of China (XLYC1907048), China Postdoctoral Science Foundation Grant (2019M661138), Pfizer ASPIRE award for transthyretin amyloidosis basic research.Notes and references
- F. Chiti and C. M. Dobson, Annu. Rev. Biochem., 2017, 86, 27–68 CrossRef CAS PubMed.
- F. U. Hartl, Annu. Rev. Biochem., 2017, 86, 21–26 CrossRef CAS PubMed.
- W. E. Balch, R. I. Morimoto, A. Dillin and J. W. Kelly, Science, 2008, 319, 916–919 CrossRef CAS PubMed.
- C. A. De Carufel, N. Quittot, P. T. Nguyen and S. Bourgault, Angew. Chem., Int. Ed. Engl., 2015, 54, 14383–14387 CrossRef CAS PubMed.
- Y. S. Eisele, C. Monteiro, C. Fearns, S. E. Encalada, R. L. Wiseman, E. T. Powers and J. W. Kelly, Nat. Rev. Drug Discovery, 2015, 14, 759–780 CrossRef CAS PubMed.
- L. M. Young, L. H. Tu, D. P. Raleigh, A. E. Ashcroft and S. E. Radford, Chem. Sci., 2017, 8, 5030–5040 RSC.
- C. J. Sarell, P. G. Stockley and S. E. Radford, Prion, 2013, 7, 359–368 CrossRef CAS PubMed.
- C. J. Sarell, L. A. Woods, Y. C. Su, G. T. Debelouchina, A. E. Ashcroft, R. G. Griffin, P. G. Stockley and S. E. Radford, J. Biol. Chem., 2013, 288, 7327–7337 CrossRef CAS PubMed.
- L. M. Young, R. A. Mahood, J. C. Saunders, L. H. Tu, D. P. Raleigh, S. E. Radford and A. E. Ashcroft, Analyst, 2015, 14, 6990–6999 RSC.
- T. Doussineau, C. Mathevon, L. Altamura, C. Vendrely, P. Dugourd, V. Forge and R. Antoine, Angew. Chem., Int. Ed., 2016, 55, 2340–2344 CrossRef CAS PubMed.
- A. Aliyan, N. P. Cook and A. A. Marti, Chem. Rev., 2019, 119, 11819–11856 CrossRef CAS PubMed.
- G. S. Loving, M. Sainlos and B. Imperiali, Trends Biotechnol., 2010, 28, 73–83 CrossRef CAS PubMed.
- A. S. Klymchenko, Acc. Chem. Res., 2017, 50, 366–375 CrossRef CAS PubMed.
- M. Lindgren, K. Sorgjerd and P. Hammarstrom, Biophys. J., 2005, 88, 4200–4212 CrossRef CAS PubMed.
- L. H. Qin, J. Vastl and J. M. Gao, Mol. BioSyst., 2010, 6, 1791–1795 RSC.
- J. Sutharsan, M. Dakanali, C. C. Capule, M. A. Haidekker, J. Yang and E. A. Theodorakis, ChemMedChem, 2010, 5, 56–60 CrossRef CAS PubMed.
- Y. Hong, J. W. Lam and B. Z. Tang, Chem. Commun., 2009, 4332–4353, 10.1039/b904665h.
- Y. Hong, L. Meng, S. Chen, C. W. Leung, L. T. Da, M. Faisal, D. A. Silva, J. Liu, J. W. Lam, X. Huang and B. Z. Tang, J. Am. Chem. Soc., 2012, 134, 1680–1689 CrossRef CAS PubMed.
- W. Fu, C. Yan, Z. Guo, J. Zhang, H. Zhang, H. Tian and W. H. Zhu, J. Am. Chem. Soc., 2019, 141, 3171–3177 CrossRef CAS PubMed.
- C. Wu, Z. Wang, H. Lei, Y. Duan, M. T. Bowers and J. E. Shea, J. Mol. Biol., 2008, 384, 718–729 CrossRef CAS PubMed.
- W. G. Yang, Y. Wong, O. T. W. Ng, L. P. Bai, D. W. J. Kwong, Y. Ke, Z. H. Jiang, H. W. Li, K. K. L. Yung and M. S. Wong, Angew. Chem., Int. Ed., 2012, 51, 1804–1810 CrossRef PubMed.
- K. P. R. Nilsson, M. Lindgren and P. Hammarstrom, Methods Mol. Biol., 2018, 1779, 485–496 CrossRef CAS PubMed.
- J. Y. Kim, S. Sahu, Y. H. Yau, X. Wang, S. G. Shochat, P. H. Nielsen, M. S. Dueholm, D. E. Otzen, J. Lee, M. M. Delos Santos, J. K. Yam, N. Y. Kang, S. J. Park, H. Kwon, T. Seviour, L. Yang, M. Givskov and Y. T. Chang, J. Am. Chem. Soc., 2016, 138, 402–407 CrossRef CAS PubMed.
- M. Z. Chen, N. S. Moily, J. L. Bridgford, R. J. Wood, M. Radwan, T. A. Smith, Z. G. Song, B. Z. Tang, L. Tilley, X. H. Xu, G. E. Reid, M. A. Pouladi, Y. N. Hong and D. M. Hatters, Nat. Commun., 2017, 8, 474 CrossRef PubMed.
- T. C. Owyong, P. Subedi, J. Deng, E. Hinde, J. J. Paxman, J. M. White, W. Chen, B. Heras, W. W. H. Wong and Y. Hong, Angew. Chem., Int. Ed. Engl., 2020, 59, 10129–10135 CrossRef CAS PubMed.
- A. A. Shemetov, I. Nabiev and A. Sukhanova, ACS Nano, 2012, 6, 4585–4602 CrossRef CAS PubMed.
- A. Iscen, C. R. Brue, K. F. Roberts, J. Kim, G. C. Schatz and T. J. Meade, J. Am. Chem. Soc., 2019, 141, 16685–16695 CrossRef CAS PubMed.
- N. Bandara, A. K. Sharma, S. Krieger, J. W. Schultz, B. H. Han, B. E. Rogers and L. M. Mirica, J. Am. Chem. Soc., 2017, 139, 12550–12558 CrossRef CAS PubMed.
- B. Jiang, A. Aliyan, N. P. Cook, A. Augustine, G. Bhak, R. Maldonado, A. D. S. McWilliams, E. M. Flores, N. Mendez, M. Shahnawaz, F. J. Godoy, J. Montenegro, I. Moreno-Gonzalez and A. A. Marti, J. Am. Chem. Soc., 2019, 141, 15605–15610 CrossRef CAS PubMed.
- P. R. Banerjee and A. A. Deniz, Chem. Soc. Rev., 2014, 43, 1172–1188 RSC.
- P. R. Banerjee, D. M. Mitrea, R. W. Kriwacki and A. A. Deniz, Angew. Chem., Int. Ed. Engl., 2016, 55, 1675–1679 CrossRef CAS PubMed.
- A. C. Ferreon, C. R. Moran, J. C. Ferreon and A. A. Deniz, Angew. Chem., Int. Ed. Engl., 2010, 49, 3469–3472 CrossRef CAS.
- L. Mayne and S. W. Englander, Protein Sci., 2000, 9, 1873–1877 CrossRef CAS PubMed.
- M. M. Krishna and S. W. Englander, Protein Sci., 2007, 16, 449–464 CrossRef CAS PubMed.
- J. J. Skinner, W. K. Lim, S. Bedard, B. E. Black and S. W. Englander, Protein Sci., 2012, 21, 996–1005 CrossRef CAS PubMed.
- S. W. Englander and L. Mayne, Proc. Natl. Acad. Sci. U. S. A., 2014, 111, 15873–15880 CrossRef CAS PubMed.
- A. M. Last and C. V. Robinson, Curr. Opin. Chem. Biol., 1999, 3, 564–570 CrossRef CAS.
- J. A. Aquilina and C. V. Robinson, Biochem. J., 2003, 375, 323–328 CrossRef CAS PubMed.
- J. T. Hopper and C. V. Robinson, Angew. Chem., Int. Ed. Engl., 2014, 53, 14002–14015 CrossRef CAS PubMed.
- T. M. Allison, E. Reading, I. Liko, A. J. Baldwin, A. Laganowsky and C. V. Robinson, Nat. Commun., 2015, 6, 8551 CrossRef CAS PubMed.
- G. Nubling, B. Bader, J. Levin, J. Hildebrandt, H. Kretzschmar and A. Giese, Mol. Neurodegener., 2012, 7, 35 CrossRef PubMed.
- A. A. Rubel, T. A. Ryzhova, K. S. Antonets, Y. O. Chernoff and A. Galkin, Prion, 2013, 7, 469–476 CrossRef CAS PubMed.
- U. B. Ericsson, B. M. Hallberg, G. T. Detitta, N. Dekker and P. Nordlund, Anal. Biochem., 2006, 357, 289–298 CrossRef CAS PubMed.
- J. A. Irving, I. Haq, J. A. Dickens, S. V. Faull and D. A. Lomas, Biochem. J., 2014, 460, 103–115 CrossRef CAS PubMed.
- C. J. Layton and H. W. Hellinga, Protein Sci., 2011, 20, 1439–1450 CrossRef CAS PubMed.
- M. Vedadi, F. H. Niesen, A. Allali-Hassani, O. Y. Fedorov, P. J. Finerty Jr, G. A. Wasney, R. Yeung, C. Arrowsmith, L. J. Ball, H. Berglund, R. Hui, B. D. Marsden, P. Nordlund, M. Sundstrom, J. Weigelt and A. M. Edwards, Proc. Natl. Acad. Sci. U. S. A., 2006, 103, 15835–15840 CrossRef CAS PubMed.
- L. Dai, N. Prabhu, L. Y. Yu, S. Bacanu, A. D. Ramos and P. Nordlund, Annu. Rev. Biochem., 2019, 88, 383–408 CrossRef CAS PubMed.
- D. Martinez Molina, R. Jafari, M. Ignatushchenko, T. Seki, E. A. Larsson, C. Dan, L. Sreekumar, Y. Cao and P. Nordlund, Science, 2013, 341, 84–87 CrossRef PubMed.
- S. E. Giuliani, A. M. Frank and F. R. Collart, Biochemistry, 2008, 47, 13974–13984 CrossRef CAS PubMed.
- J. J. Lavinder, S. B. Hari, B. J. Sullivan and T. J. Magliery, J. Am. Chem. Soc., 2009, 131, 3794–3795 CrossRef CAS PubMed.
- M. C. Lo, A. Aulabaugh, G. Jin, R. Cowling, J. Bard, M. Malamas and G. Ellestad, Anal. Biochem., 2004, 332, 153–159 CrossRef CAS PubMed.
- J. O. Esteves-Villanueva, H. Trzeciakiewicz, D. A. Loeffler and S. Martic, Biochemistry, 2015, 54, 293–302 CrossRef CAS PubMed.
- D. Laor, D. Sade, S. Shaham-Niv, D. Zaguri, M. Gartner, V. Basavalingappa, A. Raveh, E. Pichinuk, H. Engei, K. Lwasaki, T. Yamamoto, H. Noothalapati and E. Gazit, Nat. Commun., 2019, 10, 62 CrossRef CAS PubMed.
- S. Navarro and S. Ventura, Biotechnol. J., 2014, 9, 1259–1266 CrossRef CAS PubMed.
- C. M. Haney, C. L. Cleveland, R. F. Wissner, L. Owei, J. Robustelli, M. J. Daniels, M. Canyurt, P. Rodriguez, H. Ischiropoulos, T. Baumgart and E. J. Petersson, Biochemistry, 2017, 56, 683–691 CrossRef CAS PubMed.
- J. V. Jun, C. M. Haney, R. J. Karpowicz, S. Giannakoulias, V. M. Y. Lee, E. J. Petersson and D. M. Chenoweth, J. Am. Chem. Soc., 2019, 141, 1893–1897 CrossRef CAS PubMed.
- C. M. Haney, R. F. Wissner, J. B. Warner, Y. J. Wang, J. J. Ferrie, J. C. Dustin, R. J. Karpowicz, V. M. Lee and E. J. Petersson, Org. Biomol. Chem., 2016, 14, 1584–1592 RSC.
- K. H. Jung, S. F. Kim, Y. Liu and X. Zhang, ChemBioChem, 2019, 20, 1078–1087 CrossRef CAS PubMed.
- Y. Liu, C. H. Wolstenholme, G. C. Carter, H. Liu, H. Hu, L. S. Grainger, K. Miao, M. Fares, C. A. Hoelzel, H. P. Yennawar, G. Ning, M. Du, L. Bai, X. Li and X. Zhang, J. Am. Chem. Soc., 2018, 140, 7381–7384 CrossRef CAS PubMed.
- C. H. Wolstenholme, H. Hu, S. Ye, B. E. Funk, D. Jain, C. H. Hsiung, G. Ning, Y. Liu, X. Li and X. Zhang, J. Am. Chem. Soc., 2020, 142, 17515–17523 CrossRef CAS PubMed.
- S. Ye, H. Zhang, J. Fei, C. H. Wolstenholme and X. Zhang, Angew. Chem., Int. Ed. Engl., 2020, 60, 1339–1346 CrossRef PubMed.
- Y. Liu, K. Miao, Y. H. Li, M. Fares, S. Y. Chen and X. Zhang, Biochemistry, 2018, 57, 4663–4674 CrossRef CAS PubMed.
- M. Fares, Y. Li, Y. Liu, K. Miao, Z. Gao, Y. Zhai and X. Zhang, Bioconjug. Chem., 2018, 29, 215–224 CrossRef CAS PubMed.
- H. L. D. Lee, S. J. Lord, S. Iwanaga, K. Zhan, H. X. Xie, J. C. Williams, H. Wang, G. R. Bowman, E. D. Goley, L. Shapiro, R. J. Twieg, J. H. Rao and W. E. Moerner, J. Am. Chem. Soc., 2010, 132, 15099–15101 CrossRef CAS PubMed.
- T. Suhina, B. Weber, C. E. Carpentier, K. Lorincz, P. Schall, D. Bonn and A. M. Brouwer, Angew. Chem., Int. Ed., 2015, 54, 3688–3691 CrossRef CAS PubMed.
- G. Feng, C. Luo, H. Yi, L. Yuan, B. Lin, X. Luo, X. Hu, H. Wang, C. Lei, Z. Nie and S. Yao, Nucleic Acids Res., 2017, 45, 10380–10392 CrossRef CAS PubMed.
- J. S. Paige, K. Y. Wu and S. R. Jaffrey, Science, 2011, 333, 642–646 CrossRef CAS PubMed.
- C. J. MacNevin, D. Gremyachinskiy, C. W. Hsu, L. Li, M. Rougie, T. T. Davis and K. M. Hahn, Bioconjug. Chem., 2013, 24, 215–223 CrossRef CAS PubMed.
- C. J. MacNevin, A. Toutchkine, D. J. Marston, C. W. Hsu, D. Tsygankov, L. Li, B. Liu, T. Qi, D. V. Nguyen and K. M. Hahn, J. Am. Chem. Soc., 2016, 138, 2571–2575 CrossRef CAS PubMed.
- C. J. MacNeyin, T. Watanabe, M. Weitzman, A. Gulyani, S. Fuehrer, N. K. Pinkin, X. Tian, F. Liu, J. Jin and K. M. Hahn, J. Am. Chem. Soc., 2019, 141, 7275–7282 CrossRef.
- C. P. Guimaraes, M. D. Witte, C. S. Theile, G. Bozkurt, L. Kundrat, A. E. M. Blom and H. L. Ploegh, Nat. Protoc., 2013, 8, 1787–1799 CrossRef PubMed.
- Y. M. Li, Y. T. Li, M. Pan, X. Q. Kong, Y. C. Huang, Z. Y. Hong and L. Liu, Angew. Chem., Int. Ed., 2014, 53, 2198–2202 CrossRef CAS PubMed.
- M. W. Popp and H. L. Ploegh, Angew. Chem., Int. Ed. Engl., 2011, 50, 5024–5032 CrossRef CAS PubMed.
- H. H. Wang, B. Altun, K. Nwe and A. Tsourkas, Angew. Chem., Int. Ed. Engl., 2017, 56, 5349–5352 CrossRef CAS PubMed.
- Y. Cho, X. Zhang, K. F. Pobre, Y. Liu, D. L. Powers, J. W. Kelly, L. M. Gierasch and E. T. Powers, Cell Rep., 2015, 11, 321–333 CrossRef CAS PubMed.
- P. Garcia-Pavia, C. Rapezzi, Y. Adler, M. Arad, C. Basso, A. Brucato, I. Burazor, A. L. P. Caforio, T. Damy, U. Eriksson, M. Fontana, J. D. Gillmore, E. Gonzalez-Lopez, M. Grogan, S. Heymans, M. Imazio, I. Kindermann, A. V. Kristen, M. S. Maurer, G. Merlini, A. Pantazis, S. Pankuweit, A. G. Rigopoulos and A. Linhart, Eur. Heart J., 2021, 42, 1554–1568 CrossRef PubMed.
- M. S. Maurer, P. Elliott, R. Comenzo, M. Semigran and C. Rapezzi, Circulation, 2017, 135, 1357–1377 CrossRef PubMed.
- F. L. Ruberg and J. L. Berk, Circulation, 2012, 126, 1286–1300 CrossRef PubMed.
- M. Grogan, A. Dispenzieri and M. A. Gertz, Heart, 2017, 103, 1065–1072 CrossRef CAS PubMed.
- L. Obici, M. Nuvolone and G. Merlini, Kidney Int., 2016, 90, 479–481 CrossRef PubMed.
- T. Joy, J. Wang, A. Hahn and R. A. Hegele, Clin. Biochem., 2003, 36, 641–645 CrossRef CAS.
- H. J. Lachmann, H. J. Goodman, J. A. Gilbertson, J. R. Gallimore, C. A. Sabin, J. D. Gillmore and P. N. Hawkins, N. Engl. J. Med., 2007, 356, 2361–2371 CrossRef CAS PubMed.
- J. Bergstrom, C. Murphy, M. Eulitz, D. T. Weiss, G. T. Westermark, A. Solomon and P. Westermark, Biochem. Biophys. Res. Commun., 2001, 285, 903–908 CrossRef CAS PubMed.
- J. Bergstrom, C. L. Murphy, D. T. Weiss, A. Solomon, K. Sletten, U. Hellman and P. Westermark, Lab. Invest., 2004, 84, 981–988 CrossRef PubMed.
- T. Wisniewski and B. Frangione, Neurosci. Lett., 1992, 135, 235–238 CrossRef CAS PubMed.
- J. C. Genereux, S. Qu, M. Zhou, L. M. Ryno, S. Wang, M. D. Shoulders, R. J. Kaufman, C. I. Lasmezas, J. W. Kelly and R. L. Wiseman, EMBO J., 2015, 34, 4–19 CrossRef CAS PubMed.
- K. C. Chen, S. Qu, S. Chowdhury, I. C. Noxon, J. D. Schonhoft, L. Plate, E. T. Powers, J. W. Kelly, G. C. Lander and R. L. Wiseman, EMBO J., 2017, 36, 2296–2309 CrossRef CAS PubMed.
- I. Gallotta, A. Sandhu, M. Peters, M. Haslbeck, R. Jung, S. Agilkaya, J. L. Blersch, C. Rodelsperger, W. Roseler, C. Huang, R. J. Sommer and D. C. David, Nature, 2020, 584, 410–414 CrossRef CAS PubMed.
- H. Razavi, S. K. Palaninathan, E. T. Powers, R. L. Wiseman, H. E. Purkey, N. N. Mohamedmohaideen, S. Deechongkit, K. P. Chiang, M. T. A. Dendle, J. C. Sacchettini and J. W. Kelly, Angew. Chem., Int. Ed., 2003, 42, 2758–2761 CrossRef CAS PubMed.
- S. Tomoshige, S. Nomura, K. Ohgane, Y. Hashimoto and M. Ishikawa, Angew. Chem., Int. Ed., 2017, 56, 11530–11533 CrossRef CAS PubMed.
- A. Ansaloni, Z. M. Wang, J. S. Jeong, F. S. Ruggeri, G. Dietler and H. A. Lashuel, Angew. Chem., Int. Ed. Engl., 2014, 53, 1928–1933 CrossRef CAS PubMed.
- L. I. Bruijn, M. W. Becher, M. K. Lee, K. L. Anderson, N. A. Jenkins, N. G. Copeland, S. S. Sisodia, J. D. Rothstein, D. R. Borchelt, D. L. Price and D. W. Cleveland, Neuron, 1997, 18, 327–338 CrossRef CAS.
- A. Loredo, J. Tang, L. S. Wang, K. L. Wu, Z. Peng and H. Xiao, Chem. Sci., 2020, 11, 4410–4415 RSC.
- J. Tang, M. A. Robichaux, K. L. Wu, J. Pei, N. T. Nguyen, Y. Zhou, T. G. Wensel and H. Xiao, J. Am. Chem. Soc., 2019, 141, 14699–14706 CrossRef CAS PubMed.
- J. Tang, L. S. Wang, A. Loredo, C. Cole and H. Xiao, Chem. Sci., 2020, 11, 6701–6708 RSC.
Footnote |
| † Electronic supplementary information (ESI) available: Supplemental figures, experimental method section, synthetic methods and schemes and NMR spectra. See DOI: 10.1039/d1sc01122g |
| This journal is © The Royal Society of Chemistry 2021 |

