
 Open Access Article
 This Open Access Article is licensed under a
 Creative Commons Attribution 3.0 Unported Licence
Reconciling structure prediction of alloyed, ultrathin nanowires with spectroscopy†
Scott C.
McGuire
a,
Amani M.
Ebrahim
 b,
Nathaniel
Hurley
a,
Lihua
Zhang
c,
Anatoly I.
Frenkel
*bd and
Stanislaus S.
Wong
*a
b,
Nathaniel
Hurley
a,
Lihua
Zhang
c,
Anatoly I.
Frenkel
*bd and
Stanislaus S.
Wong
*a
aDepartment of Chemistry, Stony Brook University, Stony Brook, New York 11794-3400, USA. E-mail: stanislaus.wong@stonybrook.edu
bDepartment of Materials Science and Chemical Engineering, Stony Brook University, Stony Brook, New York 11794-2275, USA. E-mail: anatoly.frenkel@stonybrook.edu
cCenter for Functional Nanomaterials, Brookhaven National Laboratory, Upton, New York 11973, USA
dChemistry Division, Brookhaven National Laboratory, Upton, New York 11973, USA
First published on 26th April 2021
Abstract
A number of complementary, synergistic advances are reported herein. First, we describe the ‘first-time’ synthesis of ultrathin Ru2Co1 nanowires (NWs) possessing average diameters of 2.3 ± 0.5 nm using a modified surfactant-mediated protocol. Second, we utilize a combination of quantitative EDS, EDS mapping (along with accompanying line-scan profiles), and EXAFS spectroscopy results to probe the local atomic structure of not only novel Ru2Co1 NWs but also ‘control’ samples of analogous ultrathin Ru1Pt1, Au1Ag1, Pd1Pt1, and Pd1Pt9 NWs. We demonstrate that ultrathin NWs possess an atomic-level geometry that is fundamentally dependent upon their intrinsic chemical composition. In the case of the PdPt NW series, EDS mapping data are consistent with the formation of a homogeneous alloy, a finding further corroborated by EXAFS analysis. By contrast, EXAFS analysis results for both Ru1Pt1 and Ru2Co1 imply the generation of homophilic structures in which there is a strong tendency for the clustering of ‘like’ atoms; associated EDS results for Ru1Pt1 convey the same conclusion, namely the production of a heterogeneous structure. Conversely, EDS mapping data for Ru2Co1 suggests a uniform distribution of both elements. In the singular case of Au1Ag1, EDS mapping results are suggestive of a homogeneous alloy, whereas EXAFS analysis pointed to Ag segregation at the surface and an Au-rich core, within the context of a core–shell structure. These cumulative outcomes indicate that only a combined consideration of both EDS and EXAFS results can provide for an accurate representation of the local atomic structure of ultrathin NW motifs.
1. Introduction
Recent literature has demonstrated how tunable parameters such as (i) size, (ii) morphology, (iii) chemical composition, and (iv) atomic structure can impact upon the performance of functional electrocatalysts.1–3 Specifically, nanoscale formulations of catalysts allow for a higher surface area-to-volume ratio and reduce the overall metal loading, which can thereby lower expected costs. Moreover, as compared with conventional zero-dimensional (0D) nanoparticles (NPs), anisotropic one-dimensional (1D) nanowires (NWs) are less susceptible to dissolution, Ostwald ripening, and aggregation, which promote enhanced stability and durability. Furthermore, NWs not only evince enhanced electron and mass transport but also enable the exposure of specific crystalline planes which can be beneficial for catalytic activity. In particular, ultrathin NWs represent an advantageous architectural target in that they are expected to maintain slightly contracted surfaces, which can weaken the interaction with surface passivating O2. Our previous studies4–13 in this area also suggest that ultrathin NWs are generally chemically homogeneous and structurally monodisperse, while maintaining fewer defect sites.As implied earlier, the chemical composition of the electrocatalysts also plays a key role in dictating performance. Whereas Pt is indeed the most active metal as a catalyst for a number of small-molecule reactions such as the methanol oxidation reaction (MOR), Pt is also relatively scarce and expensive. Significantly, Pt is prone to slow reaction kinetics due to its propensity to adsorb CO, which poisons the surface by limiting the available active sites. The CO tolerance of Pt-based catalysts can be improved upon by the introduction of additional metals to promote the formation of OH species on the surface, which can subsequently react with and oxidize the poisoning CO.14 In particular, theory and experiment have shown that Ru is highly effective in increasing CO tolerance and thereby improving reaction kinetics.15 In addition, the lattice mismatch between Pt and Ru introduces strain which can decrease the binding energy of the reaction intermediates, thereby further increasing CO tolerance.16 Similar types of behavior have been observed upon the alloying of Pt with non-noble metals, such as Cu, Fe, Sn, Pb or Zn.17–22 In the ESI,† we discuss in much greater detail the broader implications of morphology and chemical composition upon electrocatalytic activity.
Nevertheless, relatively little work has been performed on RuCo alloys, which have been reported to be useful in applications, such as but not limited to batteries23 and Fischer–Tropsch catalysts24,25 in addition to electrocatalysts for the hydrogen evolution reaction (HER),22,26–30 the hydrogen oxidation reaction (HOR),31 the oxygen reduction reaction (ORR),32,33 and the oxygen evolution reaction (OER).34 Results for RuCo alloys used as electrocatalysts have been especially promising, with the alloys frequently outperforming the Pt standards at lower overall costs. Specifically, a study which compared RuM (M = Co, Ni, Fe) catalysts for the HOR, HER, ORR, and OER reported that the RuM alloys achieved higher activities for HOR and HER versus both pure Ru and Pt standards.31 In addition, it was determined that the RuCo catalysts yielded the highest activity for HOR, HER, and OER, out of all of the RuM alloys tested.
Nonetheless, fewer studies have been carried out on the synthesis and characterization of RuCo alloys, possessing different morphologies. In effect, the majority of prior literature on RuCo has centered on 0D NPs with a smaller number of reports on the synthesis of discrete morphologies, such as 1D NW arrays35 and two-dimensional (2D) nanosheets.27 As such, herein, we have focused on developing a novel and potentially generalizable method for the production of ultrathin RuCo NWs. Our customized protocol employs oleylamine (OAm) and oleic acid (OAc) with the former in the role of a surfactant and reducing agent and the latter in the capacity of an additional surfactant, with which to collectively guide the growth of 1D nanostructures.
We have characterized the composition, crystallinity, morphology, and local atomic structure of our as synthesized Ru2Co1 NWs with a combination of various techniques, including X-ray diffraction (XRD), transmission electron microscopy (TEM), high resolution TEM (HRTEM), energy dispersive X-ray spectroscopy (EDS), and X-ray absorption spectroscopy (XAS). Significantly herein, we probe the structural results provided by EDS versus XAS, the latter of which arguably enables a more accurate determination of the local atomic structure through an analysis of the extended X-ray absorption fine structure (EXAFS) region.
The EXAFS signal incorporates information about coordination numbers, interatomic distances, and the nature of disorder within systems (due to both static and dynamic displacements of all atoms from their average positions).36 In particular, the EXAFS spectra yield information about the number, type of, and distance to the atoms surrounding the central, X-ray absorbing atom. As such, the coordination numbers (N) of atomic pairs within bimetallic alloyed NPs are often used to differentiate between different types of short-range order in these NPs, and/or ascertain the degree of compositional monodispersity within the sample. Indeed, EXAFS analysis can be used to confirm alloy formation and to distinguish between different alloying motifs (e.g., random or core–shell-like non-random).37,38 For instance, by analyzing N values associated with the bonds within Pd–Au NPs, it was concluded that Pd atoms predominantly resided on the surface of these NPs, whereas Au atoms primarily localized in the core.37 Nevertheless, one of the continuing challenges with respect to the precise, atomistic characterization of the nanocatalyst geometry, especially anisotropic, 1D NW motifs, is the relative difficulty in terms of ascertaining their nuanced geometric and compositional structure with precise and useful spatial resolution.36
What factors can complicate the analysis? First, it has been suggested39 that in a Pt–Ru alloy, if there are two populations of Pt–Ru bonds at an interface as an example, the strongly ordered and strongly disordered ones, the EXAFS signal will be dominated by the relatively ordered pairs (i.e., ones with smaller disorder parameters), whereas the second population of bonds, the strongly disordered ones, will give a much weaker contribution to EXAFS. Second, even the relationship between the alloying tendency and chemical composition within nanomaterials can be complex. For example, density functional theory (DFT) calculations have shown that Pd evinces a strong surface segregation preference when acting as an atom impurity within a Fe host, whereas a Fe impurity atom within a Pd host shows a greater propensity for strong anti-segregation.40 Third, the synthetic protocol makes a difference. With commercial Pd–Pt bimetallic NPs, EXAFS results were consistent with a structure in which Pt atoms are enriched in the core and Pd atoms are localized in the shell, with a greater extent of Pd atomic dispersion in the NPs.41 By contrast, with PdPt catalysts dispersed in zeolites, XAS analysis suggested that Pd and Pt were present mainly as the corresponding oxide NPs and aggregates.42 Fourth, when the distribution of bonds is strongly asymmetric, emanating from factors such as but not limited to surface tension, which are particularly important in influencing the behavior of nanoparticles with characteristic sizes of less than ca. 5 nm, the results of conventional EXAFS fitting exhibited significant artifacts, such as an under-estimation of the coordination number and bond length disorder.43–45 Fifth, the precise morphology itself is relevant. For example, the average N value of Pt within so-called ‘excavated’ nanoframes (that had been subjected to an extra processing step) was found to be higher than that of their hollow nanoframe counterparts.46
All of these different parameters were clearly significant in interpreting a study47 of the structural evolution of mesostructured PtRu NPs generated within a lyotropic liquid-crystalline template. The X-ray absorption near edge structure (XANES) data at the Ru L2,3– and Pt L3– edges highlighted predominantly metallic states of Ru and Pt within the PtRu NPs upon electroreduction. Nevertheless, a more rapid reduction of Pt precursors coupled with a release of Ru atoms from Ru precursors in two steps upon electroreduction resulted in aggregation into PtRu NPs, consisting of a Pt-rich core, a Ru-rich shell, and a greater extent of Ru segregation.
Therefore, our novel contribution to the literature herein has been to apply EXAFS to investigate the structure and dispersion of elements within bimetallic ultrathin Ru2Co1 NWs. Moreover, as comparative systems, we have also synthesized and characterized not only various other bimetallic alloyed NWs with distinctive compositions of Ru1Pt1, Au1Ag1, Pd1Pt1, and Pd1Pt9 but also monometallic Ru, Pt, Pd, and Au NWs as controls. All of these samples serve as a means of simultaneously systematically and quantitatively comparing and contrasting the structures, determined by EXAFS analysis, with which to achieve insights into local atomic structure, versus data obtained using more frequently utilized techniques such as standard EDS. An important motivation for our current project has been in correlating TEM EDS mapping with EXAFS analysis to analyze and compare the findings of each measurement mode.
What makes our work even more impactful is that there are only a few reports exploring either the ‘short range order parameter’36,48 or a conceptually analogous method developed by Huang et al. with which to investigate and quantitatively assess the structure of nanoscale morphologies, such as nanoframes,46,49 nanorods,50 and nanochains51 at the atomic level using EXAFS. In this study, to probe the implications and applicability of these prior theoretical studies, we have analyzed the structures of our range of bimetallic ultrathin NWs using the short range order parameter, which is essentially a structure-dependent function of N. We have also highlighted the limits of applicability of this parameter; specifically, while effective as a useful indicator of either positive or negative tendency to clustering of ‘like’ atoms, it is fundamentally limited to the analysis of relatively homogeneous alloys only.
Our combined results indicate that the Ru-based NWs (i.e., Ru2Co1 and Ru1Pt1) both form as homophilic structures in which there is a strong tendency for clustering of ‘like’ atoms. By comparison, the Au1Ag1 NWs likely are synthesized as a core–shell motif, incorporating an Au-rich core with an Ag-rich shell. By contrast, the Pd1Pt9 NWs are generated as a homogeneous alloy structure, whereas the Pd1Pt1 are produced as an alloy structure with a slight tendency towards the clustering of ‘like’ atoms. Therefore, to highlight the key points of novelty, we not only report herein for the first time on the synthesis of uniform, ultrathin Ru2Co1 NWs but also for the first time, apply quantitative EXAFS analysis techniques towards the investigation of the local atomic structure within various ultrathin bimetallic NW systems.
2. Results and discussion
Synthesis and characterization
As initial work, experiments had been performed for producing pure Ru, wherein solely oleylamine (OAm) was employed in the individual roles of reaction medium, surfactant, and reducing agent, simultaneously. This procedure resulted in the formation of Ru NPs with average diameters of 3.7 ± 0.5 nm, as shown in Fig. S1A.† Upon the addition of oleic acid (OAc) as an extra surfactant, we isolated ultrathin NWs with average measured diameters of 2.6 ± 0.5 nm, as shown in Fig. S1B.† As such, herein, OAm acts as both a reducing agent and a surfactant, whereas OAc behaves as a supplementary surfactant agent. In terms of a specific chemical role in the reaction, it has been previously proposed that both OAm and OAc can behave as capping ligands to effectively guide and enable the formation of NWs through a process of oriented attachment.60–63
This procedure was successful in synthesizing Ru and RuCo NWs (referred to herein as Ru–S and Ru2Co1, respectively, which more accurately designate the synthetic protocol used and nominal concentrations associated with these materials) with average diameters of 2.6 ± 0.5 and 2.3 ± 0.5 nm, respectively, as determined by TEM (Fig. S2A and B†). Moreover, the d-spacings of the Ru–S and Ru2Co1 NWs were both measured to be 0.21 nm, as derived from the associated HRTEM images (Fig. 1A and B); these lattice parameter readings could be assigned to the (101) plane of hcp Ru.64
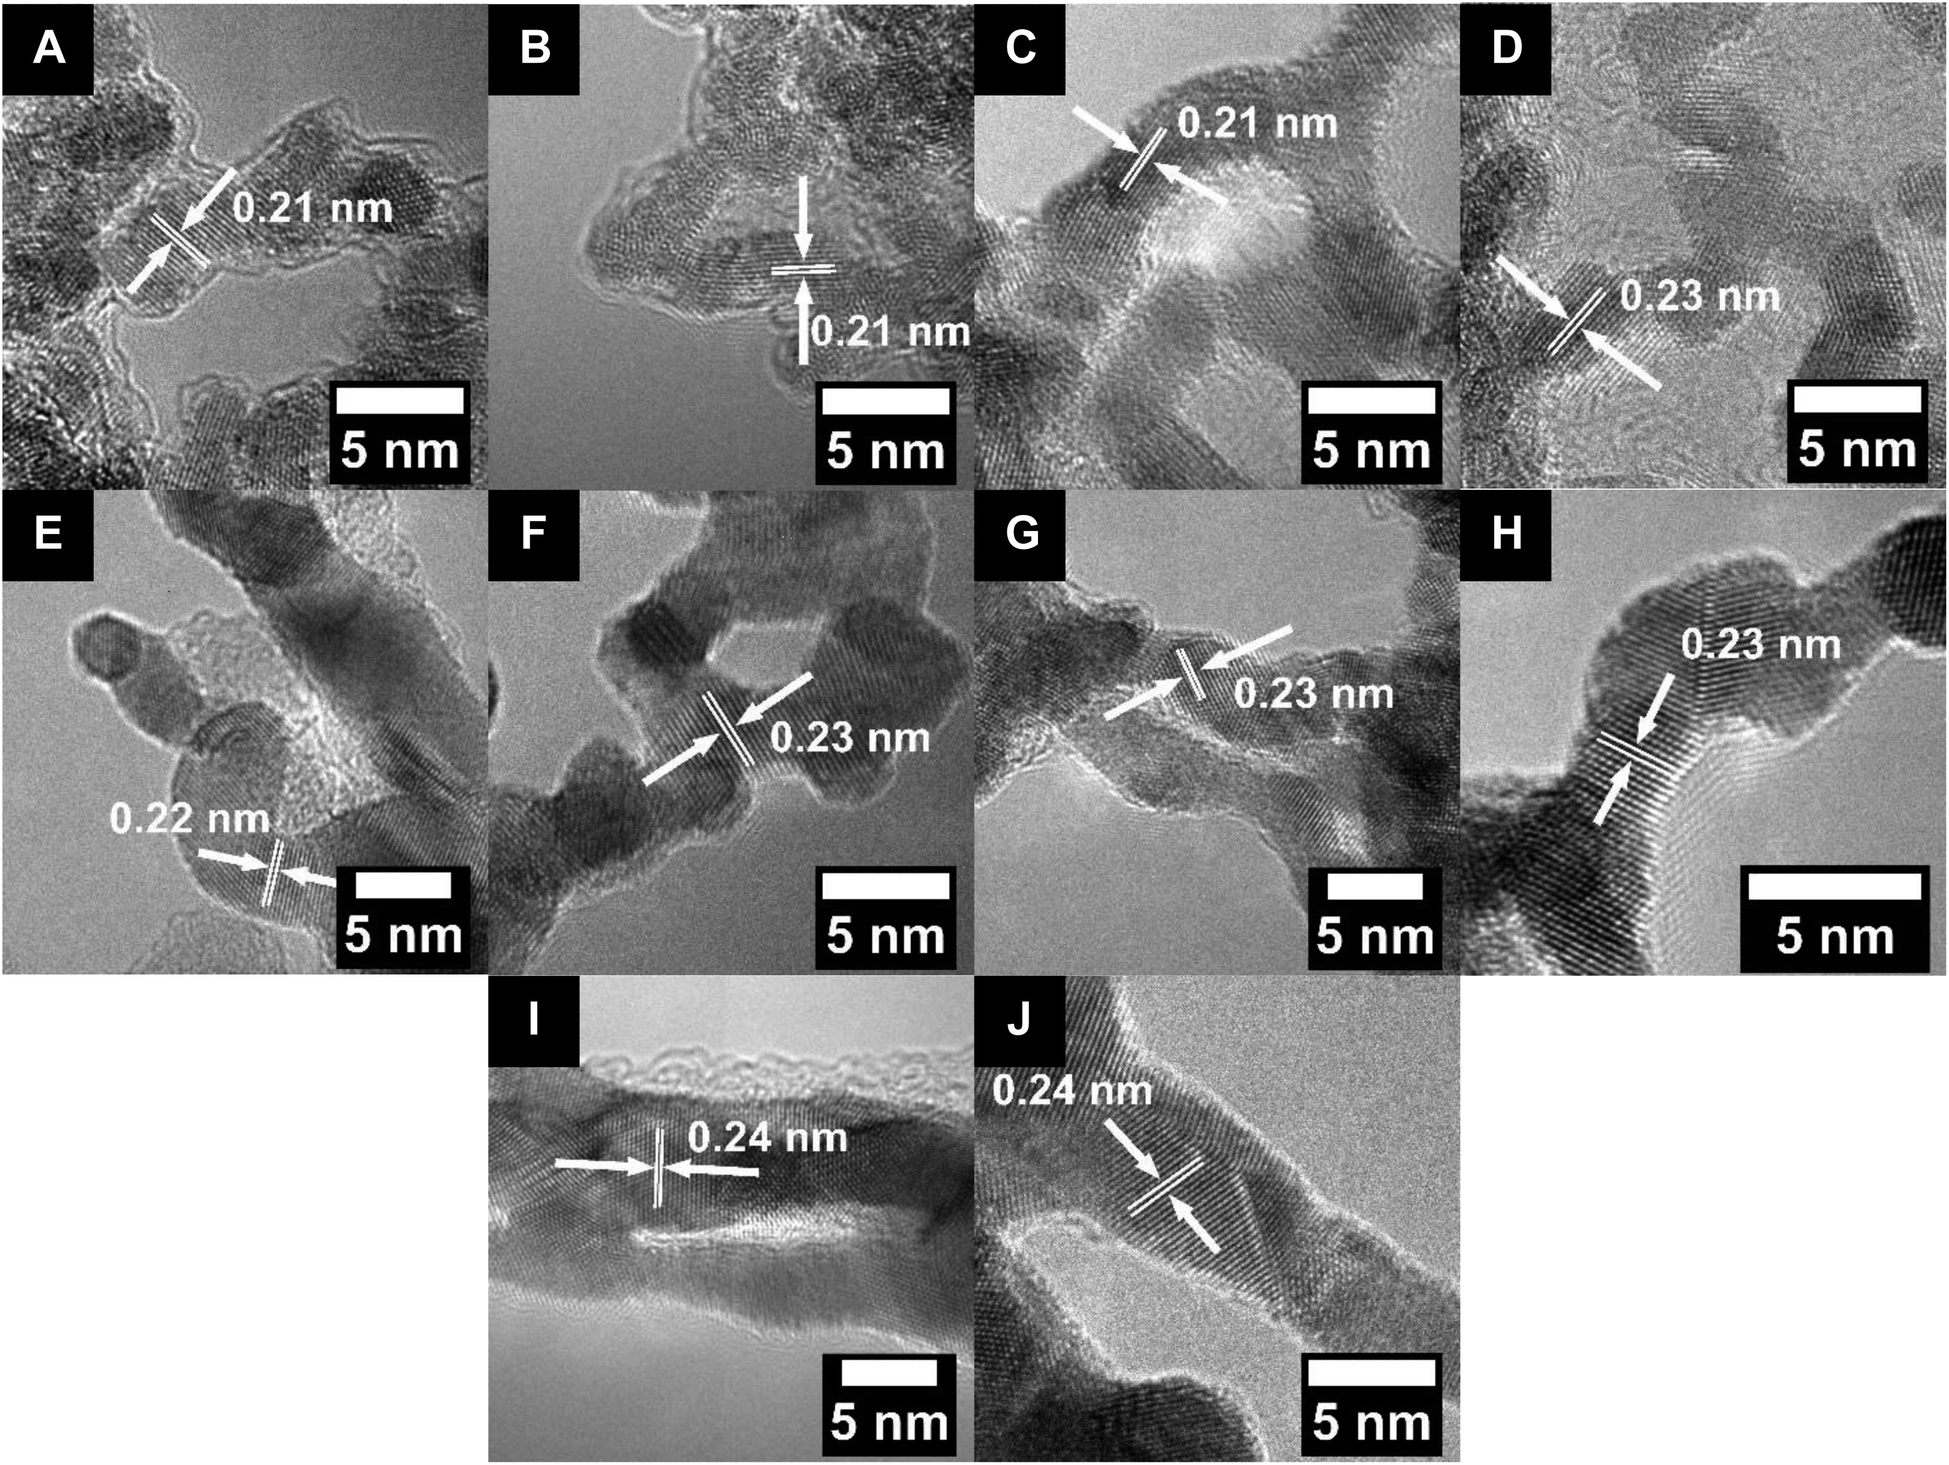 | ||
| Fig. 1 HRTEM images with the measured d-spacing values for (A) Ru–S, (B) Ru2Co1, (C) Ru–H, (D) Ru1Pt1, (E) Pd, (F) Pt, (G) Pd1Pt1, (H) Pd1Pt9, (I) Au, and (J) Au1Ag1 NWs, respectively. | ||
The chemical composition and crystallinity of the as-prepared NWs were further characterized by XRD (Fig. S3A†); both systems exhibit XRD patterns associated with hcp Ru. Hence, the lack of any apparent impurity peaks was suggestive of the acceptable purity of our samples. In terms of the actual isolated stoichiometry, it is worth noting that with the Ru2Co1 NWs, whereas an initial precursor Ru![[thin space (1/6-em)]](https://www.rsc.org/images/entities/char_2009.gif) :Co molar feed ratio of 2:1 was used for their generation, EDS measurements implied that the definitive amount of elemental incorporation was different. Specifically, as-prepared samples integrated a measured Ru:Co content in the molar ratio of 82:18, with elemental mapping (Fig. 2B and C) data indicating that Ru and Co appear to be evenly and uniformly distributed throughout the NWs. Moreover, the associated EDS line-scan profile (Fig. S4A†) further supports the idea of a relatively homogeneous distribution of these elements within the NWs. For experiments wherein the amount of Co precursor was increased to a Ru:Co molar ratio of 1:2 and beyond, the resulting XRD patterns were indicative of the formation of cobalt carbide (Fig. S5†). This finding suggested that the maximum amount of Co that could be incorporated within the NWs to enable viable alloy formation was ∼20%.
:Co molar feed ratio of 2:1 was used for their generation, EDS measurements implied that the definitive amount of elemental incorporation was different. Specifically, as-prepared samples integrated a measured Ru:Co content in the molar ratio of 82:18, with elemental mapping (Fig. 2B and C) data indicating that Ru and Co appear to be evenly and uniformly distributed throughout the NWs. Moreover, the associated EDS line-scan profile (Fig. S4A†) further supports the idea of a relatively homogeneous distribution of these elements within the NWs. For experiments wherein the amount of Co precursor was increased to a Ru:Co molar ratio of 1:2 and beyond, the resulting XRD patterns were indicative of the formation of cobalt carbide (Fig. S5†). This finding suggested that the maximum amount of Co that could be incorporated within the NWs to enable viable alloy formation was ∼20%.
 | ||
| Fig. 2 (A, D, G, J and M) HAADF-STEM images and (B, C, E, F, H, I, K, L, N and O) the corresponding EDS mapping data associated with (A–C) Ru2Co1, (D–F) Ru1Pt1, (G–I) Pd1Pt1, (J–L) Pd1Pt9, and (M–O) Au1Ag1 NWs, respectively. | ||
As ‘controls’, RuPt and Ru ultrathin NWs (denoted herein as Ru1Pt1 and Ru–H, respectively, to more precisely reflect the nominal concentrations associated with and synthetic protocol used in their generation) were produced using a previously reported hydrothermal synthesis method,57,58 so that we could compare these samples with the NWs synthesized by our in-house protocol. In this prior procedure, RuCl3 and H2PtCl6 were reacted with polyvinylpyrrolidone (PVP), sodium dodecyl sulfate (SDS), and NaBr in water under hydrothermal conditions. Whereas PVP behaved as a mild reducing agent and surfactant, the role of SDS was that of an additional surfactant, while NaBr functioned as a structure-directing agent. As such, the ultrathin NWs grew within as-formed soft templates, mediated by the presence of SDS and PVP. The as-generated Ru1Pt1 and Ru–H NWs yielded average diameters of 3.0 ± 0.3 and 3.4 ± 0.4 nm, respectively, as can be observed in Fig. S2C and D.† The d-spacing values, measured from the HRTEM images in Fig. 1C and D, were determined to be 0.21 and 0.23 nm, which are within experimental error for what would be expected for hcp Ru and fcc Ru1Pt1, respectively.52,57
XRD patterns of the Ru1Pt1 and Ru–H NWs shown in Fig. S3A† are indicative of the formation of the expected fcc and hcp structure for Ru1Pt1 and Ru–H, respectively. In addition, in accordance with Vegard's law, the shift to higher values of 2θ in the XRD pattern for Ru1Pt1, as compared with the Pt reference standard, is consistent with alloy production, namely the incorporation of Ru within the underlying fcc Pt lattice. Moreover, whereas equimolar amounts of the two metal precursors with a Ru:Pt ratio of about 1:1 were used to generate the Ru1Pt1 NWs, the actual chemical composition of our Ru1Pt1 sample was ascertained using quantitative EDS, which was consistent with a Ru:Pt ratio of 26:74. Elemental mapping results, shown in Fig. 2E and F, indicate that while there is some spatial overlap between the Ru and Pt signals, it is imperfect and that there is likely some degree of elemental segregation, in accordance with the idea of a heterogeneous alloy formation in this case. In fact, the corresponding EDS line-scan profile (Fig. S4B†) of Ru1Pt1 NWs, characterized by the lack of any spatial coincidence between Ru and Pt, corroborates the likelihood of the presence of a heterogeneous alloy, comprised of Pt-rich regions with low Ru content.
TEM images (Fig. S2E–H†) are consistent with the formation of ultrathin NWs with average diameters of 3.1 ± 0.4, 5.5 ± 1.1, 4.0 ± 1.0, and 3.0 ± 0.4 nm for Pt, Pd, Pd1Pt9, and Pd1Pt1 NWs, respectively. Moreover, the associated HRTEM images (Fig. 1E–H) highlight not only a d-spacing of 0.22 nm for the Pd NWs alone but also d-spacings of 0.23 nm that are consistent with the production of Pt, Pd1Pt1, and Pd1Pt9 NWs, respectively. XRD analysis of the PdPt samples confirms the expected fcc structure. In terms of isolated stoichiometries generated, a point which emphasizes the difficulty of precisely controlling ultrathin NW composition, the actual Pd:Pt ratios within the predicted Pd1Pt1 and Pd1Pt9 samples were measured to be 65:35 and 3:97 by quantitative EDS, respectively. The complementary elemental mapping data set indicates that there is an even and spatially uniform distribution of the elements, consistent with the formation of bimetallic alloys, as shown in Fig. 2H–L. Indeed, this finding is further confirmed by the EDS line scans for the PdPt NW data set (Fig. S4C and D†), especially Pd1Pt1, wherein, unlike what had been observed for the analogous Ru1Pt1 NWs, we noted a spatial overlap of the elements, implying a relatively homogeneous distribution of Pt with Pd.
:1 molar precursor ratio of Au to Ag, quantitative EDS measurements of these Au1Ag1 NWs elucidated an actual Au:Ag ratio of 72:28. Nevertheless, complementary EDS mapping data in Fig. 2N and O also suggested that a homogeneous bimetallic alloy had in fact formed. This assertion is substantiated by the associated EDS line-scan profile (Fig. S4E†).
EXAFS analysis
There are a number of interesting structural possibilities associated with alloy generation. These include (i) the formation of a homogeneous alloy structure, (ii) a homophilic structure, and (iii) a core–shell configuration. Within a (i) homogeneous alloy structure, a given (A- or B-) atom type maintains the same number of neighbors, on average, thereby indicating a homogeneous, uniform distribution of atoms of different types within the alloy. (ii) A homophilic structure gives rise to clustering of ‘like’ atoms, wherein there are A- or B-rich regions, but there is still mixing of the two different atom types. In a (iii) core–shell structure, one atom type segregates at the surface, whereas the other is localized within the center core. Surface atoms possess fewer nearest neighbors, thereby reducing their average coordination number, as measured by EXAFS.49,65 The coordination numbers obtained from the EXAFS analysis for a given bimetallic system can be used, along with the known concentrations of the constituent metals, in order to determine which of the aforementioned structural configurations actually formed experimentally.
One methodology for enabling the determination of the local structure within a bimetallic structure involves the use of Cowley's short range order parameter, α,48,66–68 which can be used to assess the homogeneity of a given bimetallic system. It is expressed, as follows (eqn (1)):
 | (1) |
 | (2) |
It should be noted that the same ratio, as shown in the right side of eqn (1), was also used in the analogous procedure reported by Hwang and co-workers. Not surprisingly, the conclusions that are presented here on the basis of the α parameter are identical to what one would have obtained using the conceptually identical methodology described by Huang et al.69
Using 2D alloys as an illustration,48 if αAB = −1, then there exists perfect long-range order, wherein atoms of type A maintain equivalent surroundings by the opposite atoms only. If −1 < αAB ≤ 0, then the atoms of type A are preferentially surrounded by atoms of type B and vice versa, suggestive of a negative tendency towards the clustering of ‘like’ atoms. If αAB = 0, then a random alloy is formed, meaning that for either atom type, the probabilities for the neighboring atoms to consist of either A- or B-type atoms are partitioned, according to their relative concentrations in the alloy. If 0 < αAB ≤ 1, then there is a positive tendency for the clustering of ‘like’ atoms. In the specific case of αAB = 1, a completely segregated structure is predicted, implying that there is no mixing between the two atom types (NAB = 0). It should be noted that in all of the above cases, values for αAB and αBA should be precisely equal to each other under the condition that NA = NB, a result that follows from eqn (1) and (2). Therefore, prior to determining the α parameter, one should first investigate the relationship between the total coordination numbers NA and NB of the two different elements.
If NA and NB are equal, then no element has a preference to surface (or core) segregation. However, if NA is greater than NB, then the A atoms are more likely to be located in the core, whereas the B atoms are likely to segregate to the surface. If one were to calculate the αAB for this case, then the values for αAB and αBA would not be identical to each other, indicative of a scenario in which there is not good mixing between the two atom types. In other words, when the distribution of different atomic types is not homogeneous, wherein the degree of homogeneity can be verified by comparing the NA and NB values, as discussed above, the α parameter cannot be dependably used to quantify the short range order (degree of mixing) of the elements.
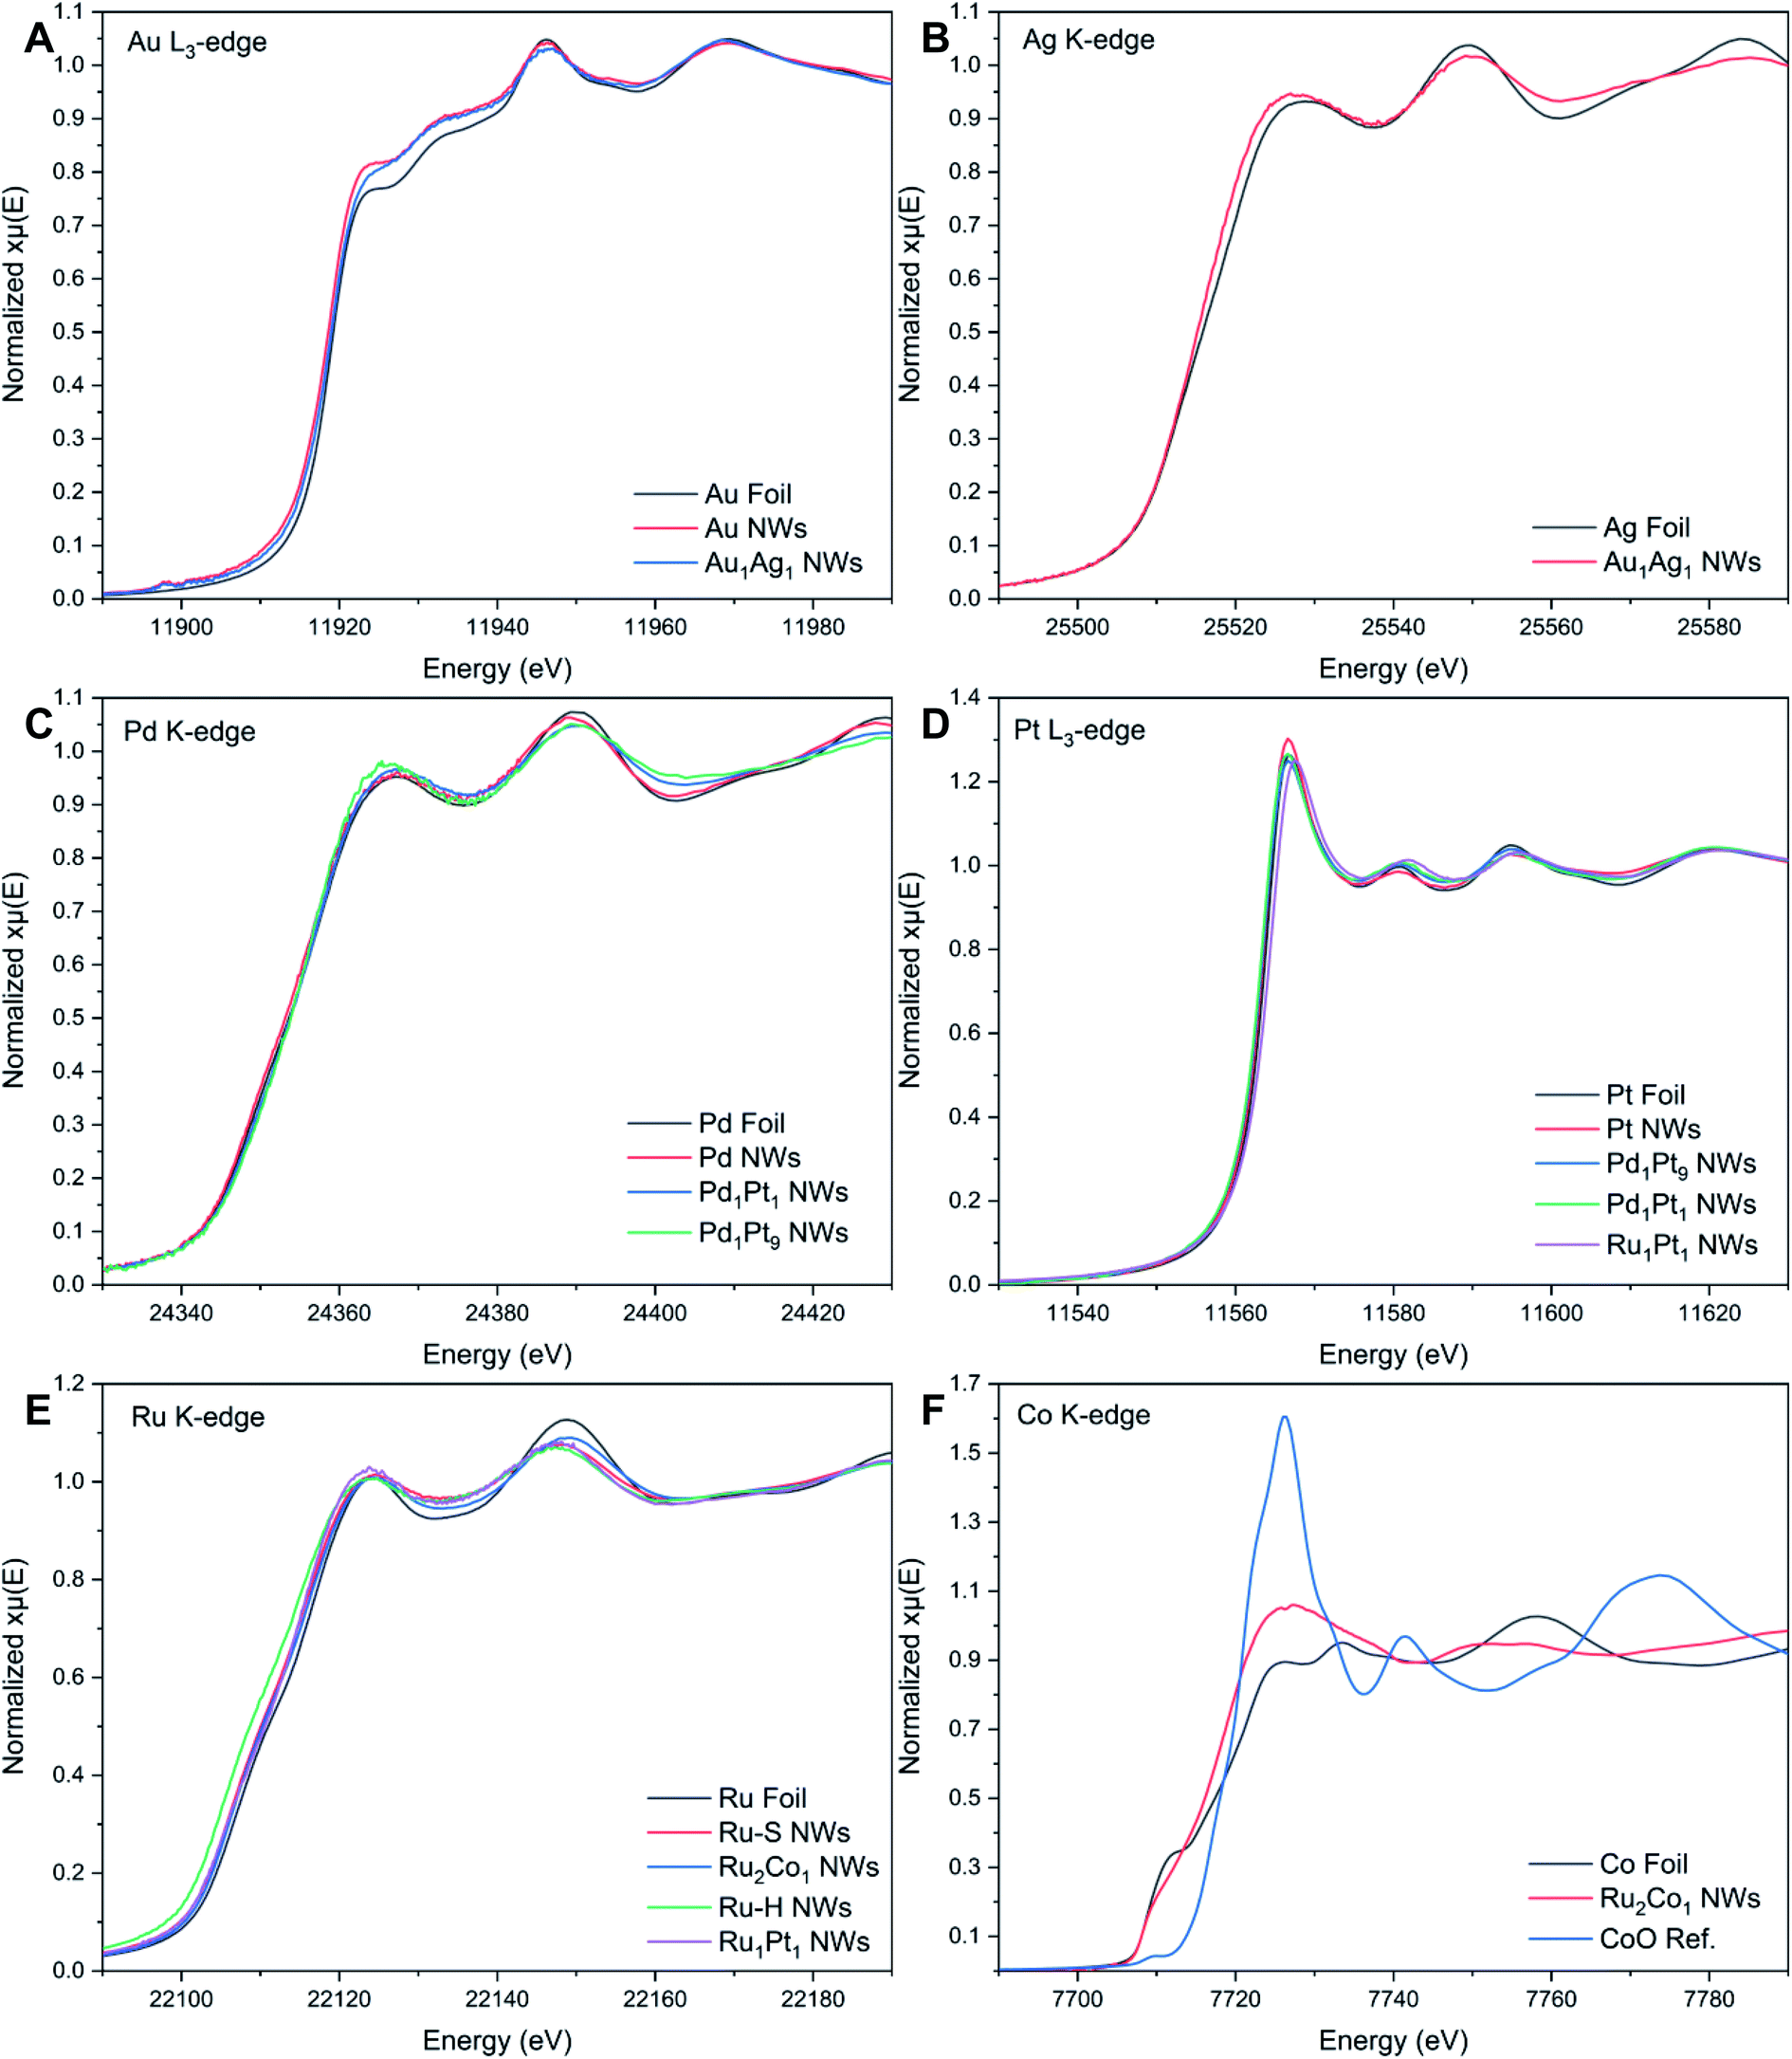 | ||
| Fig. 3 XANES spectra associated with the (A) Au L3-edge, (B) Ag K-edge, (C) Pd K-edge, (D) Pt L3-edge, (E) Ru K-edge, and (F) Co K-edge, respectively. | ||
The Au L3-edge absorption edge for Au1Ag1 is shifted to higher energies as compared with that of the monometallic Au NWs, thereby indicating that Au likely donates electrons to Ag (Fig. 3A). The similarity of features at the Au and Ag edges within the alloy NWs by comparison with their respective foils (Fig. 3A and B) signifies that both constituent components of the nanowire alloy likely exist in the metallic state. In addition, the absorption features for the Pd, Pt, Pd1Pt1, and Pd1Pt9 NWs at both the Pd K- and Pt L3-edges (Fig. 3C and D) are consistent with the metallic characteristics of all of the elements.
By comparison, XANES spectra collected at the Ru K- and Pt L3-edges for Ru1Pt1, Ru–H, and Ru–S NWs also point to the metallic state of all of these materials. For Ru2Co1, the spectrum at the Ru K-edge (Fig. 3E) closely resembles that of the Ru–S NWs, again suggesting that Ru exists in its metallic state. However, the XANES spectrum at the Co K-edge (Fig. 3F) for the Ru2Co1 NWs differs from the corresponding spectrum of either the Co foil or even a CoO reference, denoting unusual behavior with respect to the other elements we have analyzed. In fact, the XANES spectrum for our Ru2Co1 NWs is much more similar to that which has been previously reported for Co-substituted Ru nanosheets possessing a similar composition.27 It is unlikely that the NWs exist within an oxidized state, since the absorption onset is close to that observed for the Co foil. Indeed, the broadening of features and the concomitant decrease in the magnitude of such features at higher energies, thereby resulting in the spectral differences observed, can likely be collectively attributed to a high degree of disorder in the local atomic structure, especially as compared with the corresponding metallic foil.70,71 In order to further investigate the local atomic structure of our various systems, we have analyzed their EXAFS spectra (Fig. 4 and 5).
 | ||
| Fig. 4 Fourier transforms of k2χ(k) spectra associated with the (A) Au L3-edge, (B) Ag K-edge, (C) Pd K-edge, (D) Pt L3-edge, (E) Ru K-edge, and (F) Co K-edge, respectively. | ||
 | ||
| Fig. 5 k 2-Weighted EXAFS data for the (A) Au L3-edge, (B) Ag K-edge, (C) Pd K-edge, (D) Pt L3-edge, (E) Ru K-edge, and (F) Co K-edge, respectively. | ||
While it is well known that Au and Ag satisfy the Hume-Rothery rules and thus are expected to form completely miscible alloys in the solid phase at the bulk scale,72 this is not what we have observed herein with our bimetallic system. Specifically, by comparing the NAu and NAg values for Au1Ag1, wherein NAu (10.3) is notably larger than that of NAg (8.8), while taking into account of the experimental error bars, it is proposed that there is segregation of the two elements within the NWs. In this picture, Au tends to be confined to the center, whereas Ag segregates at the external surface. Indeed, since these results indicate that there is segregation of Au and Ag within the NWs, the calculation of the short-range order α parameters cannot be reliably used to characterize the short-range order of the samples. In fact, calculating αAu–Ag and αAg–Au yields dissimilar values of 0.26 and 0.14, respectively. This finding is fully consistent with the conclusion of elemental segregation, discussed earlier, which had been made on the basis of a comparison of the corresponding NAu and NAg values. However, it should be noted that the EXAFS analysis does not imply either full, complete elemental segregation or the creation of a perfectly generated core–shell configuration. At most, we can postulate the formation of a motif, comprised of an Ag-enriched ‘shell’ coupled with an Au-enriched ‘core’. A similar observation regarding the possibility of some degree of elemental mixing (i.e. partial alloying), occurring within the context of a core–shell bimetallic NP system consisting of Au and Ag, has been previously reported.73 By contrast, the EDS mapping and associated EDS line-scan results, shown in Fig. 2M–O and S4E,† collectively suggest the presence of a reasonably even distribution of the constituent elements, with no clear evidence for core–shell formation. As such, this apparent discrepancy between EXAFS and EDS findings in accounting for elemental distribution highlights issues with reconciling the localized composition within ultrathin NWs with data ‘averaged’ across the entire sample.
It has been reported that segregation within nanostructures can be caused by factors, related to surface energy, size, strain effects, and charge transfer between atoms.74,75 There are likely no strain effects, which lead to the apparent segregation within Au1Ag1, because the lattice constants for Ag and Au are very similar. Moreover, charge transfer between Au and Ag would favor mixing between the two elements, a scenario which would have reduced the tendency of Ag to selectively segregate at the surface. In effect, the XANES spectrum for the Au absorption edge (Fig. 3A) suggests that there is in fact charge transfer occurring between Au and Ag, which therefore ought to promote mixing.
As such, we hypothesize that there must be another factor that accounts for the observed segregation. One such parameter is the greater surface energy of Au versus that of Ag, a variable which is conducive to the surface segregation of Ag.76 In addition, it has been reported that the reaction temperature can have a significant influence upon the segregation of Au and Ag, wherein the surface enrichment of Ag tends to be favored at lower temperatures.77,78 As such, the evident formation of Au–Ag core–shell motifs herein is likely promoted by our synthetic protocol, because our ultrathin NWs were generated at relatively reduced temperatures of ∼0 °C.
The α values for both PdPt samples are presented in Table 1. For both Pd1Pt1 and Pd1Pt9, the values for αPt–Pd and αPd–Pt are approximately equal to each other, as expected, but not identical. In fact, α = 0.07 for Pd1Pt9; because this number is close to 0, it would be associated with the generation of a random alloy. With Pd1Pt1, the slightly larger values for αPt–Pd (0.25) and αPd–Pt (0.27) are indicative of a slight tendency towards clustering. However, conversely, these positive values may be caused by compositional polydispersity, a consequence of which is that a random, homogeneous alloy may be mistaken for a heterogeneous system.48 These findings suggest that it is not necessarily possible to conclusively differentiate between either intra-particle or inter-particle segregation using EXAFS alone.
| Sample | AuAg NWs | ||||||
|---|---|---|---|---|---|---|---|
| x Ag/xAu | N Au vs. N Ag | α Au–Ag | α Ag–Au | ||||
| EDSb | EXAFSc | EDSd | EXAFSe | EDSd | EXAFSe | ||
| a Calculated using eqn (1). If −1 ≤ α ≤ 0 then there is a tendency for alloying, whereas if 0 < α ≤ 1 then there is a tendency for clustering of ‘like’ atoms. It should be noted that if a computed value were to fall outside of this range, then it is likely that the underlying data used do not accurately reflect the nature of the entirety of the sample. b Determined on the basis of quantitative EDS measurements. c Calculated using eqn (2). d Calculated with eqn (1) using the concentrations which had been determined with quantitative EDS measurements. e Calculated using eqn (1) with the concentrations derived from both EXAFS analysis and eqn (2). | |||||||
| Au1Ag1 | 0.4 | 0.6(2) | 10.3(1.3) > 8.8(1.0) | n/a | n/a | n/a | n/a |
Nonetheless, the case for proposing that our PdPt NWs exhibited a broad compositional distribution is supported by the difference in chemical compositions, as measured by quantitative EDS and EXAFS, with the data summarized in Table 1. For example, Pd1Pt1 NWs were measured to have a xPd/xPt value of 1.8 by quantitative EDS analysis, which is much larger than the corresponding value of 0.7, as determined by EXAFS. We would expect the measurement determined by EXAFS to be a better representative of the ensemble average of the entire sample, whereas EDS is a superior indicator of local behavior associated with a smaller region within the sample. To further reinforce this idea, we compared the α parameters, calculated by using the chemical compositions determined by EXAFS and EDS, respectively, as shown in Table 1.
As previously mentioned, the values for αPt–Pd and αPd–Pt, as determined by using the EXAFS composition, are approximately equal to each other for both PdPt NW samples. However, this is not the case for αPt–Pd and αPd–Pt calculated using the analogous EDS data, thereby hinting at the presence of significant segregation. Moreover, the value for αPt–Pd associated with Pd1Pt9, as determined by EDS data, was found to be approximately −2, which is not a physically meaningful quantity. Hence, a logical inference would be that the EDS results, collected on a small, localized region, do not accurately convey the compositional picture and associated nuances of the entire area of the overall sample.
Specifically, we should emphasize that the values calculated for xPd/xPt, as derived from EXAFS, namely 0.7 for Pd1Pt1 and 0.10 for Pd1Pt9, are much closer to their nominal, expected compositions. By contrast, the analogous compositional figures, calculated using the chemical composition determined by EDS, are 1.8 for Pd1Pt1 and 0.03 for Pd1Pt9. This apparent discrepancy between the data emanating from these two compositional analysis techniques suggests that there is likely a broader, more polydisperse distribution of chemical compositions within the NWs themselves, which can thereby impact the ostensible calculated α values. These results highlight the apparent shortcomings of exclusively relying upon EDS data, collected from a small region of the sample, as an accurate means for providing definitive conclusions about the overall sample composition. Nonetheless, in this case, the notion of visualizing our as-prepared PdPt NWs as homogeneous alloys is corroborated by the combination of data from our EXAFS analysis coupled with EDS mapping measurements.
Both the αRu–Pt (0.75) and αPt–Ru (0.77) values, obtained from the EXAFS results, are largely positive, which indicates that there is a tendency for clustering of ‘like’ atoms; this finding corresponds well with the elemental mapping data, shown in Fig. 2. Moreover, the EDS-derived values of αRu–Pt (0.81) and αPt–Ru (0.61), while still largely positive, also suggest an inclination towards some degree of aggregation of ‘like’ atoms. Nevertheless, as with the PdPt NWs, it should be noted that there may be a broad compositional distribution, as indicated by the difference in the apparent chemical compositions extrapolated from EDS and EXAFS data, respectively. By analogy to what was observed with the PdPt samples, the compositions determined by EXAFS for xPt/xRu of 1.2 is closer to the nominal composition than what was determined by EDS (xPt/xRu of 2.8). Nonetheless, as mentioned previously, the α values herein are close to 1. Coupled with the elemental mapping and associated EDS line-scan data, overall, some heterogeneity is likely present; one manifestation would be the spatial aggregation of ‘like’ atoms within Ru1Pt1.
Table S4 and Fig. S8† reveal the EXAFS fitting results for both Ru–S and Ru2Co1 NWs. In parallel with the results associated with the other NW systems, the FT-EXAFS signal (Fig. 4E and F) does not show the presence of any oxidative species, thereby implying that the individual metals exist within their metallic state. The decrease in RRu–Ru and concomitant increase in RCo–Ru as compared with Ru NWs and reference foils collectively signify that there is some degree of alloying between the two elements. The comparable values of NRu and NCo within Ru2Co1 suggests that there is no surface segregation. Hence, we used the short-range order parameter to investigate the distribution of elements, as shown in Table 1.
By analogy to what had been observed for Ru1Pt1, the α values are largely positive, which would imply that there is some degree of agglomeration of ‘like’ atoms. However, unlike what had been observed for PdPt and Ru1Pt1, the chemical compositions derived from the quantitative EDS and EXAFS measurements are in agreement with one another. Both data sets advocate for a high degree of heterogeneity within these Ru2Co1 NWs. Interestingly, the sum of elemental mapping and EDS line-scan results, shown in Fig. 3 and S4A,† respectively, reveals the opposite scenario, namely a relatively even and uniform distribution of Ru and Co, which is clearly different from what had been found for Ru1Pt1.
As we have seen, with Ru1Pt1, the presence of heterogeneity was consistent with the findings of both EDS and EXAFS analyses. Hence, the key difference between Ru1Pt1 and Ru2Co1 can likely be ascribed to their divergent chemical compositions. Specifically, the area occupied by Co clusters within Ru2Co1 is likely to be smaller in size by comparison with analogous Pt clusters within Ru1Pt1, because of the lower concentration of Co in the former. Overall, these results would signify that whereas EDS mapping can be used to detect heterogeneity within bimetallic alloys possessing nearly equal concentrations of the two constituent elements, as observed with Ru1Pt1, it is less effective at detecting heterogeneity within comparable alloys, characterized by a relatively lower concentration of one of the component metals. Hence, as with the PdPt NW series, we show that for the Ru-based systems, the intrinsic advantage of EDS mapping in providing detailed chemical compositional information about a spatially localized area can actually be detrimental to achieving accurate and meaningful insights into the compositional traits of the entire sample, for which it is therefore necessary to acquire complementary EXAFS data.
3. Context and conclusions
In this work, we have reported on a unique, facile, and readily generalizable synthesis of ultrathin Ru2Co1 NWs, possessing average diameters of 2.3 ± 0.5 nm, obtained through the mediation of the simultaneous use of both OAm and OAc as surfactants with which to guide the growth of the NWs. Furthermore, we have investigated the local atomic structure of these novel Ru2Co1 NWs, in conjunction with analogous ultrathin Ru1Pt1, Au1Ag1, Pd1Pt1, and Pd1Pt9 NWs which were generated as ‘controls’. Specifically, we have calculated structure-dependent α parameters for each sample as a means of characterizing the distribution of elements throughout the alloyed nanowires. In so doing, we have determined that both Ru-based NWs maintain a strong tendency for clustering of ‘like’ atoms, as indicated by their largely positive α parameters. By contrast, the α parameter calculated for Pd1Pt9 is close to 0, suggesting that a random alloy likely formed, whereas the corresponding value calculated for Pd1Pt1 is slightly positive, implying a small degree of aggregation of ‘like’ atoms. With Au1Ag1 NWs, the EXAFS results are consistent with the creation of a core–shell structure, consisting of an Au-rich core and an Ag-rich shell; indeed, NAu is significantly larger than NAg, and equivalently, αAu–Ag and αAg–Au are sufficiently dissimilar, such that either of these data corroborate the presence of segregation.A key motivation for our study is that we have been fundamentally interested in the question of the interplay between quantitative EDS, EDS mapping (with associated line scans), and EXAFS in yielding valuable and reliable structural insights into the formation of ultrathin NWs. We have found that basing conclusions using either TEM-based EDS or EXAFS in and of itself is insufficient, because each compositionally distinctive NW system is unique.
For example, the spatially localized EDS mapping of both PdPt samples, regardless of stoichiometric composition, was consistent with the formation of a homogeneous PdPt alloy, a picture which was further backed up by EXAFS analysis. By contrast, the results for our as-prepared Au1Ag1, Ru1Pt1, and Ru2Co1 NWs suggest inherent limitations, due to apparent sensitivity issues, associated with relying on EDS mapping alone for establishing the presence of surface segregation or heterogeneity within bimetallic systems. In the case of Au1Ag1, localized, spatially confined elemental mapping was not sufficient in determining if there was any surface segregation, the evidence of which was actually provided by EXAFS analysis. Elemental mapping can indicate heterogeneity and yield results which agree with those from EXAFS analysis in bimetallic samples possessing equal concentrations of both elements, as observed in the case of Ru1Pt1 NWs. However, the use of EDS mapping alone is inadequate in assessing the heterogeneity within a bimetallic alloy incorporating a low concentration of either one of the elements involved, as noted in the example of Ru2Co1 NWs, for which EXAFS analysis coupled with quantitative EDS implied the presence of a significant degree of clustering of ‘like’ atoms.
Moreover, we have observed that relative to TEM-based EDS, EXAFS is more accurate and effective in determining the chemical composition of a whole sample. These findings were especially evident when analyzing not only Ru1Pt1 but also our series of compositionally distinctive PdPt NWs. In these examples, EXAFS analysis yielded measured values for the chemical composition, that were closer to the nominal composition expected for these material systems based on the precursor quantities used in their syntheses. As a salient demonstration, with Pd1Pt9, calculating αPt–Pd using the composition measured by EDS generated a largely negative value of approximately −2, which means nothing because it has no physical basis in reality. Similarly, for both Pd1Pt1 and Ru1Pt1, the EDS-derived αAB and αBA parameters were significantly different from one another; by contrast, the analogous values determined from EXAFS results were more consistent with each other, did not imply any significant elemental segregation, and likely reflected the composition of the sample taken in its entirety. This apparent discrepancy between EDS and EXAFS is likely due to the fact that EDS samples a relatively small region, whereas EXAFS with its higher flux of irradiation enables a more accurate, ‘averaged’ assessment over a larger sample area.
Hence, overall, it is clear that only a systematic comparison and favorable convergence of EDS and EXAFS results can provide for a true and valid representation of the chemical and structural nuances associated with various bimetallic ultrathin NW systems. Specifically, to overcome limitations in interpretation, there is a need to reconcile the localized EDS information with the ensemble averaged picture provided by EXAFS of the distribution of atoms within a bimetallic system. Moreover, while the quantitative EXAFS models themselves that we studied herein tend to be mutually consistent in their overall conclusions, they still need to be improved upon and optimized in order to properly acquire a thorough and accurate understanding of local atomic structure, especially for predicting and correlating electrocatalytic performance within relatively complex systems, such as ultrathin bimetallic NW alloys.
4. Experimental section
Materials
All chemicals were used without further purification. These included ethanol (denatured, BeanTown Chemical), gold chloride (AuCl3, Au 64.4% min, Alfa Aesar), silver nitrate (AgNO3, 99.9%, J.T. Baker Chemical Company), Triton X-114 (reagent grade, VWR), hexadecyltrimethylammonium bromide (CTAB, ≥98%, Sigma Aldrich), chloroform (99.8+%, Alfa Aesar), sodium tetrachloropalladate (Na2PdCl4, 99.9%, Alfa Aesar), sodium borohydride (NaBH4, 99.99%, Sigma Aldrich), potassium borohydride (KBH4, 98%, Alfa Aesar), polyvinylpyrrolidone (PVP, MW: 40k, Alfa Aesar), sodium dodecyl sulfate (SDS, Biotechnology Grade, VWR), sodium bromide (NaBr, 99.4%, J.T. Baker Chemical Co.), dihydrogen hexachloroplatinate(IV) hydrate (H2PtCl6, 99.9%, Alfa Aesar), ruthenium chloride (RuCl3 99.9%, BeanTown Chemical), cobalt acetate tetrahydrate (Co(OOCCH3)2, 98%, Alfa Aesar), oleic acid (OAc, 90%, Alfa Aesar), and oleylamine (OAm, 70%, Sigma Aldrich).Synthesis protocols
The bimetallic NW series, prepared with nominal compositions of Pd1Pt1 and Pd1Pt9, were also synthesized using the identical methodology, but with the use of rationally chosen precursor molar ratios so as to generate the desired products with the projected stoichiometries. Specifically, for the synthesis of Pd1Pt1, aqueous solutions of H2PtCl6 (2.5 mL, 20 mM) and Na2PdCl4 (2.5 mL, 20 mM) were used. Similarly, in the corresponding synthesis of Pd1Pt9, aqueous solutions of H2PtCl6 (4.5 mL, 20 mM) and Na2PdCl4 (0.5 mL, 20 mM) were used.
:1, a 47 mL ice cold aqueous solution, containing 0.05 mmol AuCl3, 0.05 mmol AgNO3, and 25 mg Triton X-114 surfactant, was prepared within a 100 mL round bottom flask. The solution was stirred vigorously to which 3 mL of an ice-cold aqueous 0.1 M KBH4 reducing solution was rapidly injected. After 10 s, another 25 mg of Triton X-114 was added in. The solution was allowed to stir for 1 min, while kept at 0 °C. The NWs were collected by centrifugation and were washed three times with ethanol. The same procedure was utilized for the synthesis of monometallic Au NWs, wherein a total amount of 0.1 mmol AuCl3 was used as the sole metal-based precursor.
First, a total of 0.25 mmol of metal precursors was added to 7.5 mL of OAm and 7.5 mL of OAc. RuCl3 and Co(OOCCH3)2 were used as the metal precursors with a Ru:Co molar ratio of 2:1; as such, this alloy is referred to herein as Ru2Co1 so as to reflect the predicted nominal composition. The solution was kept under argon gas, heated to 350 °C, and allowed to react for 1 h. The reaction was subsequently allowed to cool to room temperature and washed with mixtures of hexane, methanol, and ethanol, for several times. This identical procedure is utilized for the synthesis of Ru NWs by using 0.25 mmol of RuCl3 as the only metal precursor. Herein, the Ru NWs generated by this solution-based protocol are denoted as Ru–S NWs.
:Pt ratio of about 1:1; hence, these NWs are described as Ru1Pt1 to indicate their anticipated chemical make-up. The solution was then transferred to a 20 mL Teflon lined autoclave and heated at 210 °C for 24 h. NWs were collected by centrifugation and washed with water and ethanol for several times. This same protocol was also used to generate monometallic Ru NWs by using the Ru precursor alone during the reaction process. Therefore, the Ru NWs synthesized using this hydrothermal procedure are referred to as Ru–H NWs.
Structural characterization methods
919 eV), Ag K-edge (25514 eV), Pt L3-edge (11564 eV), Pd K-edge (24350 eV), Ru K-edge (22117 eV), and Co K-edge (7709 eV). Reference spectra for the corresponding metal foils were taken during each measurement to be used for energy calibration and data alignment. Data were processed and analyzed using the Athena and Artemis software packages.59 The Athena software was used to assign the photoelectron energy origin, E0, and to perform edge-step normalization and background subtraction of the measured X-ray absorption coefficient data. The background-subtracted and edge step-normalized absorption coefficient data were then transformed to k space. The k2-weighted data were subjected to Fourier transform (FT) to r-space, and EXAFS fitting was performed in r-space using Artemis.
Fitting was first performed on the EXAFS data of elemental metal foils, wherein the coordination number (N) of the first shell was set to be equal to 12, which is the expected value for all of the metals used herein. The passive electron reduction factors (S02) were varied in the fit. For the bimetallic systems, multiple-edge analysis was done to fit the signals, measured from each of the alloying constituent component's absorption edge, simultaneously. Data for the monometallic samples were simulated using FEFF calculations performed using fcc structures for Pd, Pt, Ag, Au, and the hcp structure for Ru and Co. In order to calculate FEFF theory for the heterometallic samples incorporating elements A and B, the atoms of the type B were put into a first nearest neighbor position within the coordinate list with respect to the atoms of the type A. The S02 parameters for the NWs were fixed to be equal to those obtained for the bulk foils.
For the bimetallic NWs, the fittings were performed for both edges concurrently, and the following constraints were applied.36 The heterometallic bond lengths were set to be equal (RA–B = RB–A) along with the mean squared bond length disorders (σA–B2 = σB–A2), whereas the homometallic bond lengths (i.e., RA–A and RB–B) and mean squared bond length disorders (i.e., σA–A2 and σB–B2) were varied independently. The coordination numbers were also modified independently for all samples, except for the Au1Ag1 NWs. For this latter sample, due to the relatively strong correlation of fitting parameters contributing to the amplitude of the EXAFS oscillations, the total coordination number for Au (NAu = NAu–Au + NAu–Ag) was set to be equal to 10.3, which was the coordination number calculated for the Au NWs.
Author contributions
Conceptualization: S. S. W. and A. I. F. Formal analysis and data curation: S. C. M., A. M. E., N. H., L. Z., A. I. F., and S. S. W. Investigation, methodology, and validation: S. C. M., A. M. E., N. H., and L. Z. Project administration and supervision: S. S. W and A. I. F. Writing – original draft: S. C. M. and S. S. W. Writing – review & editing: S. C. M., A. M. E., N. H., L. Z., A. I. F., and S. S. W.Conflicts of interest
There are no conflicts of interest to declare.Acknowledgements
The synthesis protocols and associated structural characterization reported herein are based on work performed in SSW's laboratory, supported by the U.S. National Science Foundation under Grant No. CHE-1807640. Certain characterization experiments (i.e., TEM, HRTEM, EDS, and SEM) for this manuscript were performed in part at the Center for Functional Nanomaterials, located at Brookhaven National Laboratory, which is supported by the U.S. Department of Energy under Contract No. DE-SC0012704. Nathaniel Hurley acknowledges financial support from a Joint Photon Sciences Institute (JPSI) graduate student fellowship for experiments performed at Brookhaven National Laboratory. The collaborative studies were also supported in part by a seed grant from the Stony Brook University Office of the Vice President for Research. XAS analysis by AIF was supported as part of the Integrated Mesoscale Architectures for Sustainable Catalysis (IMASC), an Energy Frontier Research Center funded by the U.S. Department of Energy, Office of Science, Basic Energy Sciences under Award DE-SC0012573. This research used resources of the QAS beamline (7-BM) of the National Synchrotron Light Source II, a U.S. DOE Office of Science Facility at Brookhaven National Laboratory under Contract No. DE-SC0012704. QAS beamline operations were supported in part by the Synchrotron Catalysis Consortium (U.S. DOE, Office of Basic Energy Sciences, Grant No. DE-SC0012335).References
- M. E. Scofield, H. Liu and S. S. Wong, Chem. Soc. Rev., 2015, 44, 5836–5860 RSC
.
- L. Li, S. Tan, K. L. Salvatore and S. S. Wong, Chem.–Eur. J., 2019, 25, 7779–7797 CrossRef CAS PubMed
- L. Li and S. S. Wong, ACS Omega, 2018, 3, 3294–3313 CrossRef CAS PubMed
- H. Liu, C. Koenigsmann, R. R. Adzic and S. S. Wong, ACS Catal., 2014, 4, 2544–2555 CrossRef CAS
- H. Liu, R. R. Adzic and S. S. Wong, ACS Appl. Mater. Interfaces, 2015, 7, 26145–26157 CrossRef CAS PubMed
- C. Koenigsmann, A. C. Santulli, K. Gong, M. B. Vukmirovic, W.-p. Zhou, E. Sutter, S. S. Wong and R. R. Adzic, J. Am. Chem. Soc., 2011, 133, 9783–9795 CrossRef CAS PubMed
- C. Koenigsmann, M. E. Scofield, H. Liu and S. S. Wong, J. Phys. Chem. Lett., 2012, 3, 3385–3398 CrossRef CAS
- C. Koenigsmann, D. B. Semple, E. Sutter, S. E. Tobierre and S. S. Wong, ACS Appl. Mater. Interfaces, 2013, 5, 5518–5530 CrossRef CAS PubMed
- C. Koenigsmann, E. Sutter, R. R. Adzic and S. S. Wong, J. Phys. Chem. C, 2012, 116, 15297–15306 CrossRef CAS
- C. Koenigsmann, E. Sutter, T. A. Chiesa, R. R. Adzic and S. S. Wong, Nano Lett., 2012, 12, 2013–2020 CrossRef CAS PubMed
- C. Koenigsmann and S. S. Wong, Energy Environ. Sci., 2011, 4, 1161–1176 RSC
- C. Koenigsmann and S. S. Wong, ACS Catal., 2013, 3, 2031–2040 CrossRef CAS
- C. Koenigsmann, W.-p. Zhou, R. R. Adzic, E. Sutter and S. S. Wong, Nano Lett., 2010, 10, 2806–2811 CrossRef CAS PubMed
- L. Huang, X. Zhang, Q. Wang, Y. Han, Y. Fang and S. Dong, J. Am. Chem. Soc., 2018, 140, 1142–1147 CrossRef CAS PubMed
- Y. Hu, A. Zhu, Q. Zhang and Q. Liu, Int. J. Hydrogen Energy, 2016, 41, 11359–11368 CrossRef CAS
- S. Lu, K. Eid, D. Ge, J. Guo, L. Wang, H. Wang and H. Gu, Nanoscale, 2017, 9, 1033–1039 RSC
- G. Fu, X. Yan, Z. Cui, D. Sun, L. Xu, Y. Tang, J. B. Goodenough and J.-M. Lee, Chem. Sci., 2016, 7, 5414–5420 RSC
- L. Huang, Y. Han, X. Zhang, Y. Fang and S. Dong, Nanoscale, 2017, 9, 201–207 RSC
- H.-H. Li, Q.-Q. Fu, L. Xu, S.-Y. Ma, Y.-R. Zheng, X.-J. Liu and S.-H. Yu, Energy Environ. Sci., 2017, 10, 1751–1756 RSC
- L. Li, H. Liu, C. Qin, Z. Liang, A. Scida, S. Yue, X. Tong, R. R. Adzic and S. S. Wong, ACS Appl. Nano Mater., 2018, 1, 1104–1115 CrossRef CAS
- J. Pei, J. Mao, X. Liang, Z. Zhuang, C. Chen, Q. Peng, D. Wang and Y. Li, ACS Sustainable Chem. Eng., 2018, 6, 77–81 CrossRef CAS
- Y. Zhang, F. Gao, T. Song, C. Wang, C. Chen and Y. Du, Nanoscale, 2019, 11, 15561–15566 RSC
- Y. Jin, F. Chen and J. Wang, ACS Sustainable Chem. Eng., 2020, 8, 2783–2792 CrossRef CAS
- F. Bertella, C. W. Lopes, A. C. Foucher, G. Agostini, P. Concepcion, E. A. Stach and A. Martinez, ACS Catal., 2020, 10, 6042–6057 CrossRef CAS
- C. Pirola, M. Scavini, F. Galli, S. Vitali, A. Comazzi, F. Manenti and P. Ghigna, Fuel, 2014, 132, 62–70 CrossRef CAS
- W. Li, Y. Zhao, Y. Liu, M. Sun, G. I. N. Waterhouse, B. Huang, K. Zhang, T. Zhang and S. Lu, Angew. Chem., Int. Ed., 2021, 60, 3290–3298 CrossRef CAS PubMed
- J. Mao, C.-T. He, J. Pei, W. Chen, D. He, Y. He, Z. Zhuang, C. Chen, Q. Peng, D. Wang and Y. Li, Nat. Commun., 2018, 9, 1–8 CrossRef PubMed
- X. Niu, Q. Tang, B. He and P. Yang, Electrochim. Acta, 2016, 208, 180–187 CrossRef CAS
- Z. Wei, Y. Liu, Z. Peng, H. Song, Z. Liu, B. Liu, B. Li, B. Yang and S. Lu, ACS Sustainable Chem. Eng., 2019, 7, 7014–7023 CrossRef CAS
- F. Zhang, Y. Zhu, Y. Chen, Y. Lu, Q. Lin, L. Zhang, S. Tao, X. Zhang and H. Wang, J. Mater. Chem. A, 2020, 8, 12810–12820 RSC
- H. Wang, Y. Yang, F. J. Di Salvo and H. D. Abruna, ACS Catal., 2020, 10, 4608–4616 CrossRef CAS
- D. Gao, H. Li and X. Cheng, ECS Trans., 2015, 66, 57–68 CrossRef CAS
- G. Li, K. Zheng, W. Li, Y. He and C. Xu, ACS Appl. Mater. Interfaces, 2020, 12, 51437–51447 CrossRef CAS PubMed
- T. Feng, G. Yu, S. Tao, S. Zhu, R. Ku, R. Zhang, Q. Zeng, M. Yang, Y. Chen, W. Chen, W. Chen and B. Yang, J. Mater. Chem. A, 2020, 8, 9638–9645 RSC
- I. Dobosz, D. Kutyla, M. Kac, G. Wloch and P. Zabinski, Mater. Sci. Eng., B, 2020, 262, 114795 CrossRef CAS
- A. I. Frenkel, Chem. Soc. Rev., 2012, 41, 8163–8178 RSC
- M. R. Knecht, M. G. Weir, A. I. Frenkel and R. M. Crooks, Chem. Mater., 2008, 20, 1019–1028 CrossRef CAS
- N. A. Merrill, E. M. McKee, K. C. Merino, L. F. Drummy, S. Lee, B. Reinhart, Y. Ren, A. I. Frenkel, R. R. Naik, N. M. Bedford and M. R. Knecht, ACS Nano, 2015, 9, 11968–11979 CrossRef CAS PubMed
- S. Alayoglu, P. Zavalij, B. Eichhorn, Q. Wang, A. I. Frenkel and P. Chupas, ACS Nano, 2009, 3, 3127–3137 CrossRef CAS PubMed
- J. Sun, A. M. Karim, H. Zhang, L. Kovarik, X. S. Li, A. J. Hensley, J.-S. McEwen and Y. Wang, J. Catal., 2013, 306, 47–57 CrossRef CAS
- B.-J. Hwang, L. S. Sarma, J.-M. Chen, C.-H. Chen, S.-C. Shih, G.-R. Wang, D.-G. Liu, J.-F. Lee and M.-T. Tang, J. Am. Chem. Soc., 2005, 127, 11140–11145 CrossRef CAS PubMed
- T. S. Nguyen, P. McKeever, M. Arredondo-Arechavala, Y.-C. Wang, T. J. A. Slater, S. J. Haigh, A. M. Beale and J. M. Thompson, Catal. Sci. Technol., 2020, 10, 1408–1421 RSC
- A. Yevick and A. I. Frenkel, Phys. Rev. B: Condens. Matter Mater. Phys., 2010, 81, 115451 CrossRef
- Z. Duan, Y. Li, J. Timoshenko, S. T. Chill, R. M. Anderson, D. F. Yancey, A. I. Frenkel, R. M. Crooks and G. Henkelman, Catal. Sci. Technol., 2016, 6, 6879–6885 RSC
- J. Timoshenko, Z. Duan, G. Henkelman, R. M. Crooks and A. I. Frenkel, Annu. Rev. Anal. Chem., 2019, 12, 501–522 CrossRef CAS PubMed
- N. Becknell, Y. Son, D. Kim, D. Li, Y. Yu, Z. Niu, T. Lei, B. T. Sneed, K. L. More, N. M. Markovic, V. R. Stamenkovic and P. Yang, J. Am. Chem. Soc., 2017, 139, 11678–11681 CrossRef CAS PubMed
- S.-A. Chen, Y.-C. Liang, K.-T. Lu, C.-W. Pao, J.-F. Lee, T.-L. Lin and J.-M. Chen, Phys. Chem. Chem. Phys., 2014, 16, 3939–3945 RSC
- A. I. Frenkel, Q. Wang, S. I. Sanchez, M. W. Small and R. G. Nuzzo, J. Chem. Phys., 2013, 138, 064202 CrossRef PubMed
- N. Becknell, Y. Kang, C. Chen, J. Resasco, N. Kornienko, J. Guo, N. M. Markovic, G. A. Somorjai, V. R. Stamenkovic and P. Yang, J. Am. Chem. Soc., 2015, 137, 15817–15824 CrossRef CAS PubMed
- J. E. S. van der Hoeven, T. A. J. Welling, T. A. G. Silva, J. E. van den Reijen, C. La Fontaine, X. Carrier, C. Louis, A. van Blaaderen and P. E. de Jongh, ACS Nano, 2018, 12, 8467–8476 CrossRef CAS PubMed
- W.-F. Huang, Q. Zhang, D.-F. Zhang, J. Zhou, C. Si, L. Guo, W.-S. Chu and Z.-Y. Wu, J. Phys. Chem. C, 2013, 117, 6872–6879 CrossRef CAS
- M. E. Scofield, Y. Zhou, S. Yue, L. Wang, D. Su, X. Tong, M. B. Vukmirovic, R. R. Adzic and S. S. Wong, ACS Catal., 2016, 6, 3895–3908 CrossRef CAS
- S. Yang, F. Hong, L. Wang, S. Guo, X. Song, B. Ding and Z. Yang, J. Phys. Chem. C, 2010, 114, 203–207 CrossRef CAS
- R. Liu, J.-f. Liu and G.-b. Jiang, Chem. Commun., 2010, 46, 7010–7012 RSC
- F. Ye, H. Liu, J. Yang, H. Cao and J. Yang, Dalton Trans., 2013, 42, 12309–12316 RSC
- Y. Yu, W. Yang, X. Sun, W. Zhu, X. Z. Li, D. J. Sellmyer and S. Sun, Nano Lett., 2014, 14, 2778–2782 CrossRef CAS PubMed
- W. Zhao, D. Huang, Q. Yuan and X. Wang, Nano Res., 2016, 9, 3066–3074 CrossRef CAS
- W. Zhao, B. Ni, Q. Yuan, Y. Wang, Q. Zhang and X. Wang, Langmuir, 2017, 33, 8070–8075 CrossRef CAS PubMed
- B. Ravel and M. Newville, J. Synchrotron Radiat., 2005, 12, 537–541 CrossRef CAS PubMed
- A. Halder and N. Ravishankar, Adv. Mater., 2007, 19, 1854–1858 CrossRef CAS
- S. Mourdikoudis and L. M. Liz-Marzan, Chem. Mater., 2013, 25, 1465–1476 CrossRef CAS
- Z. Peng, H. You and H. Yang, ACS Nano, 2010, 4, 1501–1510 CrossRef CAS PubMed
- N. Poudyal, G. S. Chaubey, V. Nandwana, C.-b. Rong, K. Yano and J. P. Liu, Nanotechnology, 2008, 19, 355601 CrossRef PubMed
- A.-X. Yin, W.-C. Liu, J. Ke, W. Zhu, J. Gu, Y.-W. Zhang and C.-H. Yan, J. Am. Chem. Soc., 2012, 134, 20479–20489 CrossRef CAS PubMed
- A. I. Frenkel, C. W. Hills and R. G. Nuzzo, J. Phys. Chem. B, 2001, 105, 12689–12703 CrossRef CAS
- J. M. Cowley, Phys. Rev., 1965, 138, 1384–1389 CrossRef CAS
- R. L. Lawrence, M. O. Olagunju, Y. Liu, K. Mahalingham, J. M. Slocik, R. R. Naik, A. I. Frenkel and M. R. Knecht, Cat. Sci. Technol., 2021, 11, 2386–2395 RSC
- A. I. Frenkel, V. S. Machavariani, A. Rubshtein, Y. Rosenberg, A. Voronel and E. A. Stern, Phys. Rev. B: Condens. Matter Mater. Phys., 2000, 62, 9364–9371 CrossRef CAS
- B.-J. Hwang, L. S. Sarma, J.-M. Chen, C.-H. Chen, S.-C. Shih, G.-R. Wang, D.-G. Liu, J.-F. Lee and M.-T. Tang, J. Am. Chem. Soc., 2005, 127, 11140–11145 CrossRef CAS PubMed
- G. Cheng, J. D. Carter and T. Guo, Chem. Phys. Lett., 2004, 400, 122–127 CrossRef CAS
- K.-W. Wang, Z. Yu, A. Hu, Y.-Y. Hsu, T.-L. Chen, C.-Y. Lin, C.-W. Hu, Y.-T. Yang and T.-Y. Chen, RSC Adv., 2017, 7, 55110–55120 RSC
- W. Hume-Rothery, G. W. Mabbott and K. M. C. Evans, Philos. Trans. R. Soc., A, 1934, 233, 1–97 CAS
- I. J. Godfrey, A. J. Dent, I. P. Parkin, S. Maenosono and G. Sankar, J. Phys. Chem. C, 2017, 121, 1957–1963 CrossRef CAS
- V. M. Samsonov, A. G. Bembel, A. Y. Kartoshkin, S. A. Vasilyev and I. V. Talyzin, J. Therm. Anal. Calorim., 2018, 133, 1207–1217 CrossRef CAS
- R. Ferrando, J. Jellinek and R. L. Johnston, Chem. Rev., 2008, 108, 845–910 CrossRef CAS PubMed
- Z. Y. Li, J. P. Wilcoxon, F. Yin, Y. Chen, R. E. Palmer and R. L. Johnston, Faraday Discuss., 2008, 138, 363–373 RSC
- L. Deng, W. Hu, H. Deng, S. Xiao and J. Tang, J. Phys. Chem. C, 2011, 115, 11355–11363 CrossRef CAS
- X. He, S.-E. Zhang, F. Cheng and Z.-X. Chen, Chem. Commun., 2018, 54, 638–641 RSC
Footnote |
| † Electronic supplementary information (ESI) available. See DOI: 10.1039/d1sc00627d |
| This journal is © The Royal Society of Chemistry 2021 |