
 Open Access Article
 This Open Access Article is licensed under a Creative Commons Attribution-Non Commercial 3.0 Unported Licence
Mass spectrometry-based chemical mapping and profiling toward molecular understanding of diseases in precision medicine
Yechen
Hu†
a,
Zhongcheng
Wang†
a,
Liang
Liu
ac,
Jianhua
Zhu
a,
Dongxue
Zhang
a,
Mengying
Xu
a,
Yuanyuan
Zhang
a,
Feifei
Xu
a and
Yun
Chen
 *ab
*ab
aSchool of Pharmacy, Nanjing Medical University, Nanjing, 211166, China. E-mail: ychen@njmu.edu.cn
bState Key Laboratory of Reproductive Medicine, Key Laboratory of Cardiovascular & Cerebrovascular Medicine, Nanjing, 210029, China
cDepartment of Pharmacy, Zhongnan Hospital of Wuhan University, Wuhan, 430071, China
First published on 25th May 2021
Abstract
Precision medicine has been strongly promoted in recent years. It is used in clinical management for classifying diseases at the molecular level and for selecting the most appropriate drugs or treatments to maximize efficacy and minimize adverse effects. In precision medicine, an in-depth molecular understanding of diseases is of great importance. Therefore, in the last few years, much attention has been given to translating data generated at the molecular level into clinically relevant information. However, current developments in this field lack orderly implementation. For example, high-quality chemical research is not well integrated into clinical practice, especially in the early phase, leading to a lack of understanding in the clinic of the chemistry underlying diseases. In recent years, mass spectrometry (MS) has enabled significant innovations and advances in chemical research. As reported, this technique has shown promise in chemical mapping and profiling for answering “what”, “where”, “how many” and “whose” chemicals underlie the clinical phenotypes, which are assessed by biochemical profiling, MS imaging, molecular targeting and probing, biomarker grading disease classification, etc. These features can potentially enhance the precision of disease diagnosis, monitoring and treatment and thus further transform medicine. For instance, comprehensive MS-based biochemical profiling of ovarian tumors was performed, and the results revealed a number of molecular insights into the pathways and processes that drive ovarian cancer biology and the ways that these pathways are altered in correspondence with clinical phenotypes. Another study demonstrated that quantitative biomarker mapping can be predictive of responses to immunotherapy and of survival in the supposedly homogeneous group of breast cancer patients, allowing for stratification of patients. In this context, our article attempts to provide an overview of MS-based chemical mapping and profiling, and a perspective on their clinical utility to improve the molecular understanding of diseases for advancing precision medicine.
1. General introduction of molecular understanding of diseases in precision medicine
Precision medicine has been strongly promoted in recent years.1 It refers to the precise diagnosis, monitoring, and treatment of disease. It is used in clinical management to classify diseases at the molecular level and select the most appropriate drugs or treatments to maximize their efficacy and minimize adverse effects.2 Although there have been major advances in this field, the benefits conferred by precision medicine are currently insufficient in terms of their applications and outcomes for a few possible reasons. One reason may involve the lack of orderly implementation of recent developments in this field.3 Indeed, multiple layers of data can be obtained for any individual. However, the confluence of physical, biological, and chemical sciences is setting the stage for precision medicine. In recent decades, the practice of describing and defining diseases has been hyper-focused on physical signs and symptoms, which is the first and most basic layer of precision medicine. Then, the convergence of biology and technology was captured. Whole-genome DNA sequencing and a variety of omics technologies can be used to define aspects of each individual's biology. Unfortunately, chemical research, which is the foundation of life sciences, is often neglected in this layered framework. An essential reason for this negligence is that high-quality chemical research is not well integrated into clinical practice, especially in the early phase, leading to a lack of comprehensive understanding of the chemistry underlying disease.4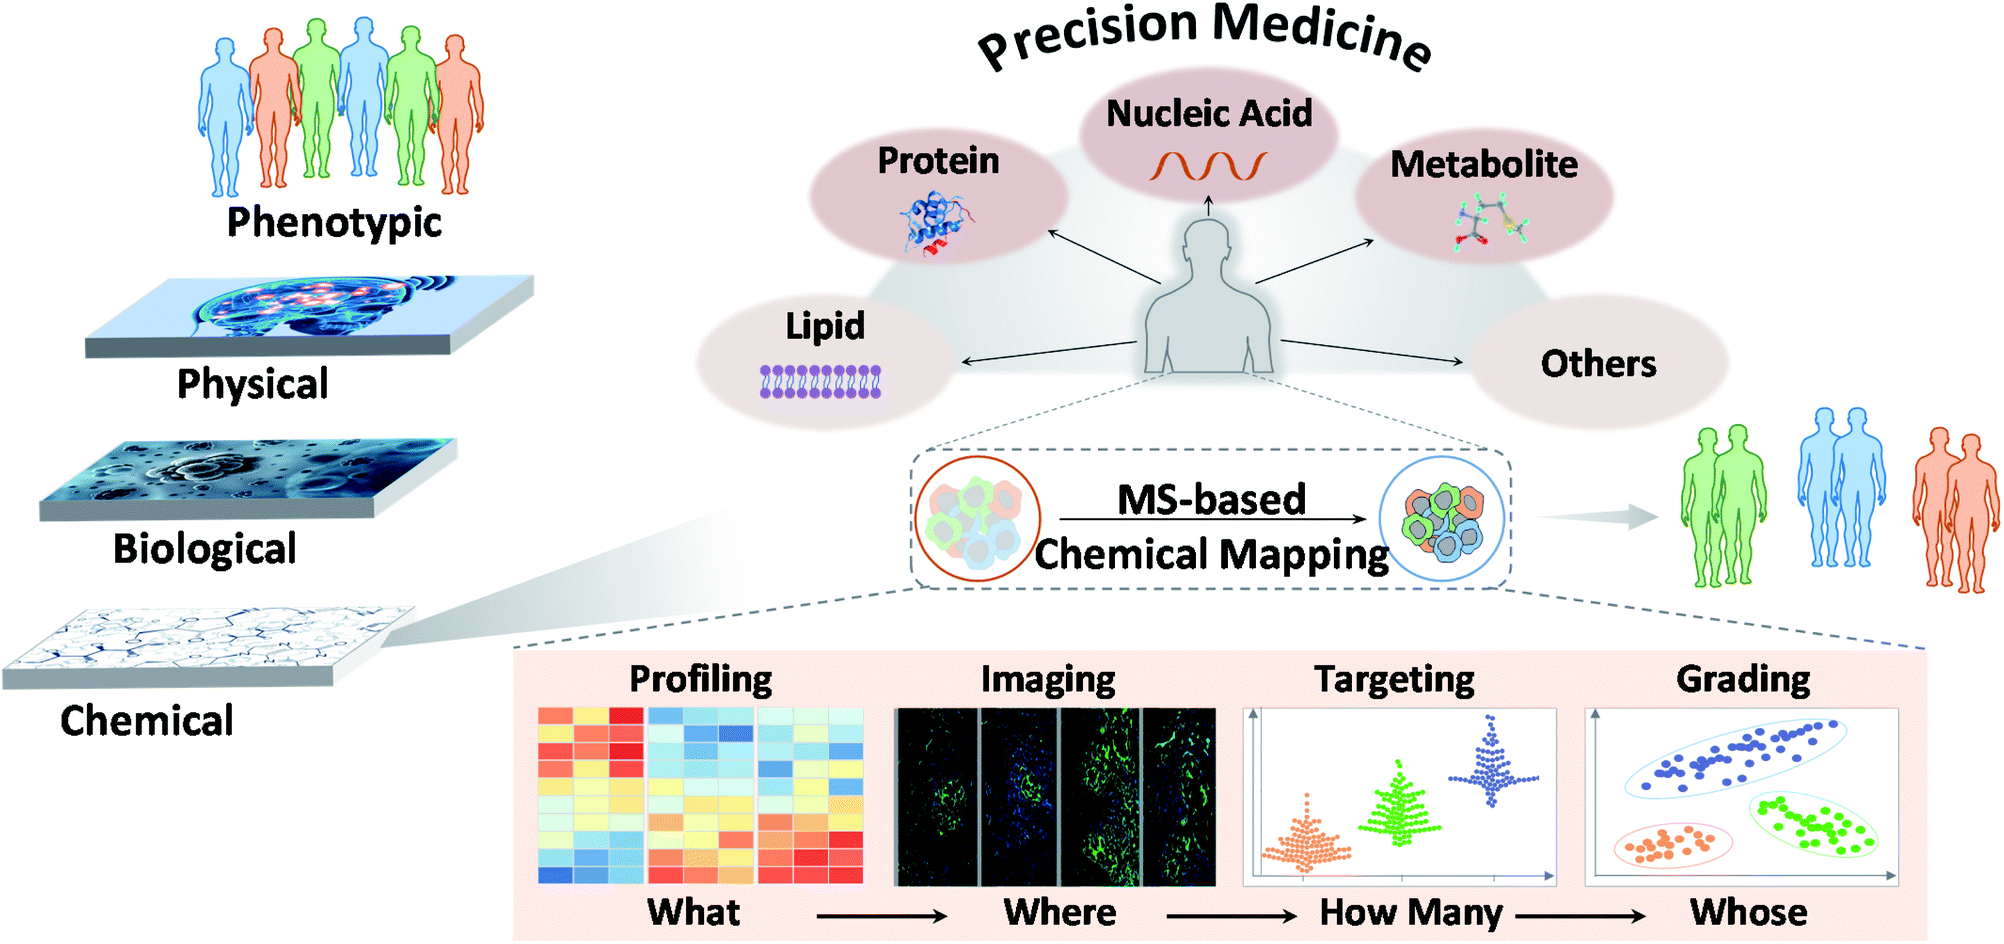 | ||
| Fig. 1 MS-based chemical mapping and profiling in precision medicine. | ||
These different layers of precision medicine highlight the involvement of many diverse scientific disciplines that must be taken into account. In the chemistry layer, novel chemical technologies are rapidly progressing, and they are believed to satisfy many aims of precision medicine. However, researchers are still working on ways to apply them to improve the molecular understanding of illness.
2. Mass spectrometry and chemical mapping/profiling
In recent years, MS has led to great innovations and advances in chemical research.5 MS has shown potential for use in analyzing various chemical molecules because of its high sensitivity, high selectivity, and wide dynamic range. Its resolution can reach 1 ppm, and its detection limit can be in the fmol range. In this context, chemicals refer to small molecules, peptides, proteins, and other biomolecules constituting life. Different MS modalities can be adapted to identify chemicals of interest. This variety stems from rapid technological developments focusing primarily on ion sources and mass analyzers. Commonly used ion sources include electrospray ionization (ESI), atmospheric chemical ionization (APCI), matrix-assisted laser desorption/ionization (MALDI), inductively coupled plasma (ICP), desorption electrospray ionization (DESI), ion mobility (IM) and liquid extraction surface analysis (LESA), and mass analyzers include quadrupoles, time-of-flight (TOF), orbitraps, and ion traps. Each MS type has specific characteristics and adaptations. As reported, MS techniques show promise for chemical mapping, for example, in biochemical profiling, MS imaging, molecular targeting and probing, and biomarker grading and disease classification.6 These features may answer “what”, “where”, “how many” and “whose” chemicals underlie clinical phenotypes and thus possibly enhance the precision of disease diagnosis, monitoring, treatment and further transform medicine (Fig. 1).73. Mass spectrometry-based chemical mapping and profiling approaches
3.1. Comprehensive biochemical profiling – “what”
Biochemical profiling is used to monitor a variety of the chemical molecules of interest and screen for changes in the relative, rather than absolute, levels of these chemicals.8 Traditionally, it relies mainly on evolutionary “-omics” techniques, which are used to study various biological systems comprehensively (e.g., cells, serum, tissues, and microorganisms).9,10 The era of precision medicine initially benefited from widespread genetic testing and the integration of genomic data with this type of information. However, the fate of precision medicine involves more than peering at genomics data, which necessitates the inclusion of other chemical variables. MS-based biochemical profiling primarily focuses on a comprehensive understanding of how changes in protein and metabolite levels affect complex signaling pathways and regulatory networks, referred to as MS-based proteomics and metabolomics.From the viewpoint of chemists, more emphasis is placed on the methodology for effectively obtaining the chemical profiles of these molecules.
In recent clinical studies, metabolites and proteins were first extracted from biological samples. Metabolite molecules can be directly imported into MS instruments for analysis (Fig. 2). Proteins can also be directly analyzed by MS (a top-down proteomics approach),11 but they are analyzed more frequently after enzymatic digestion into peptides (a bottom-up proteomics approach) due to the difficulties associated with ionization and fragmentation of intact proteins using the top-down strategy (Fig. 2).12 Relative quantitation is performed by label-free or isobaric labeling approaches. Following data acquisition by MS, computational algorithms are used to analyze the resulting ion spectra for target molecule detection and quantification. To date, no other method can provide direct information about the molecular weights of a series of analytes simultaneously present in a complex sample. In an MS analysis, thousands of identified molecules are very highly condensed, with concentrations reaching up to six orders of magnitude.
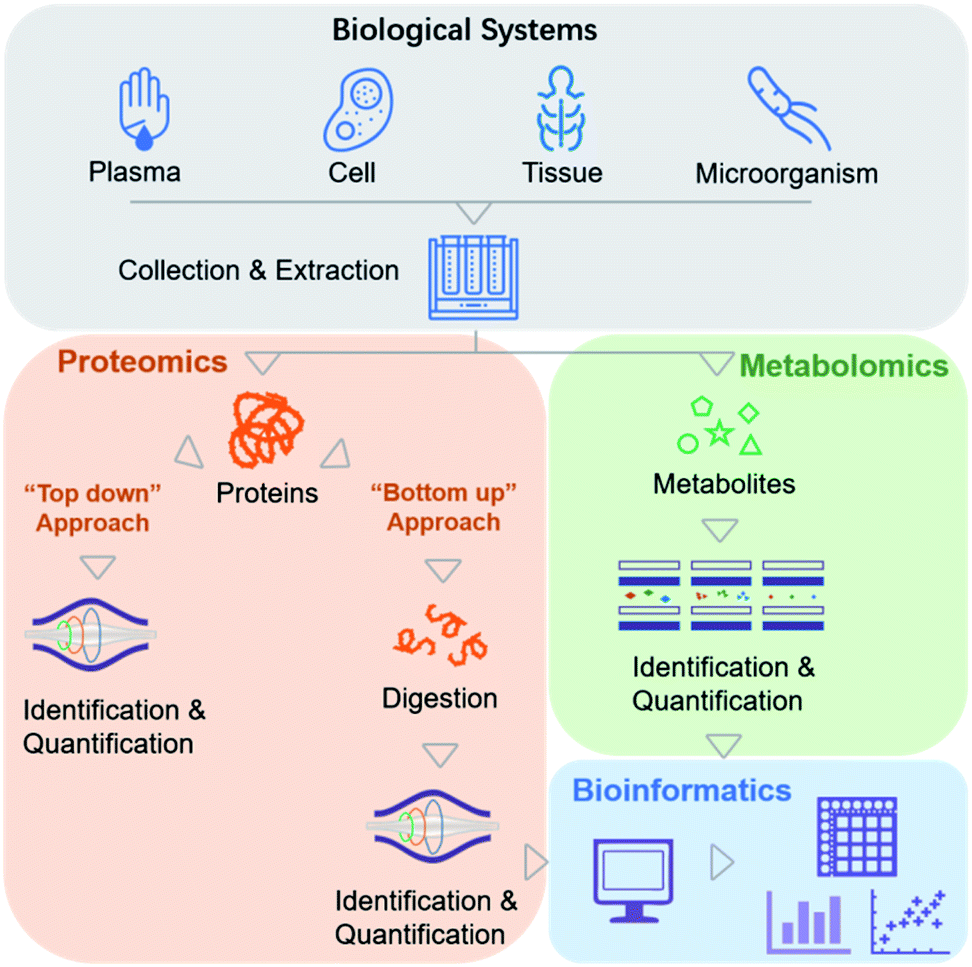 | ||
| Fig. 2 Current workflow of MS-based proteomics and metabolomics. | ||
These MS-based biochemical profiling methods have been widely used in the identification or quantification of important chemicals related to the occurrence and development of various diseases. For example, to identify the characteristics of COVID-19 patient serum, Guo et al. used stable isotope-labeled proteomics strategy TMTpro (16plex) and ultra-performance liquid chromatography/tandem MS (UPLC-MS/MS) untargeted metabolomics approaches.13 A total of 894 proteins and 941 metabolites (including 36 drugs and their metabolites) were identified and quantified, of which 93 proteins showed differential expression in the sera of patients with severe COVID-19, and 204 metabolites in the COVID-19 patient sera correlated with disease severity. This study may provide possible options for identifying potential blood biomarkers for future severity evaluation.13
Moreover, in a study of ovarian cancer, isobaric tags for relative and absolute quantitation (iTRAQ) performed in conjunction with offline high-pH reverse-phase liquid chromatography (RPLC) fractionation and online RPLC-MS/MS were applied to provide broad coverage for protein identification and quantification. Altogether, 9600 proteins were identified with high confidence, and 3586 were quantified. The dynamic range of these proteins covered more than four orders of magnitude, ranging from low-level transcription factors to abundant structural proteins.14 This study provides a detailed analysis of the molecular components and underlying mechanisms associated with ovarian cancer, as well as views on how the somatic genome drives the cancer proteome and the association between protein levels and clinical outcomes in high-grade serous ovarian cancer (HGSC).14
In another example, to highlight the heterogeneity in early-stage hepatocellular carcinoma, He et al. used label-free quantitative proteomics and identified 9252 proteins (9142 gene products) from 101 tumor and 98 non-tumor samples.15 These authors found that inhibiting the expression of sterol O-acyltransferase 1 (SOAT1) can effectively inhibit the proliferation and migration of hepatocellular carcinoma cells, which might help improve the five-year overall survival rate for patients with this cancer, which is currently only 50–70%.15
To elucidate the proteomic characteristics and further understand the biochemical reasons for the low 5 year survival rate of lung adenocarcinoma (LUAD) in Chinese people, the most common histological subtype of non-small cell lung cancer (NSCLC), Xu et al. conducted a comprehensive proteomics analysis of 103 Chinese patients with LUAD.16 In this study, 8252 proteins in 49 paired samples were identified. By combining the proteome with transcriptome and whole-exome sequencing data, their integrative analysis revealed many key cancer-associated characteristics, such as tumor-related protein variants, distinct proteomics features, and clinical outcomes for patients at an early stage or with EGFR and/or TP53 mutations, which enables a comprehensive understanding of LUAD and provides opportunities for precise diagnosis and treatment.16 Recently, extracellular vehicles (EVs), especially exosomes, have gained increasing attention because they contain various biomarkers (e.g., proteins, lipids and metabolites) and provide a source of relatively low-invasive/non-invasive specimens (e.g., serum and urine).17 MS provides a powerful tool for characterization of these molecules in EVs. For example, Hiltbrunner et al. found a couple of proteins overexpressed in bladder urine exosomes including TPP1, TMPRSS2, FOLR1, RALB and RAB35, while SLC4A1 with a lower expression.18
Protein posttranslational modifications (PTMs) are highly involved in critical biological processes. Changes in their levels are always related to diseases. Because of their low natural abundance, the comprehensive discovery and identification of various PTMs in complex biological samples continues to pose challenges for MS-based proteomics technologies.19,20 Zhang et al. combined a peptide immunoaffinity enrichment strategy and MS to identify lysine acetylation (Kac) in the microbiome and successfully characterized 52 host and 136 microbial protein Kac sites that were differentially abundant in patients with Crohn's disease (CD) versus controls. This microbiome-wide acetylome approach clarified that aberrant Kac protein changes in the microbiome might be related to CD development.21 By using titanium dioxide (TiO2) for the efficient enrichment of phosphopeptides, He et al. used MS to analyze and quantitate the phosphoproteomic changes in a HBx-transgenic mouse model of hepatocellular carcinoma (HCC), leading to the profiling of 22![[thin space (1/6-em)]](https://www.rsc.org/images/entities/char_2009.gif) 539 phosphorylation sites in 5431 proteins, and revealing elevated kinase activities of Src family kinases (SFKs), protein kinase C (PKCs), mitogen-activated protein kinases (MAPKs), and Rho-associated kinases (e.g., ROCK2) in HCC.22 By identifying the main kinases in various tumor tissues and the corresponding para-tissues, kinase activity can be targeted and extended to personalized medicine, and appropriate drug combinations can be used to benefit individual patients.22 Among all types of phosphorylation, the dysregulation of tyrosine phosphorylation (pTyr), which is naturally less abundant (1.8% of total phosphorylation sites), is usually related to human health and disease.23,24 To analyze pTyr in depth, a series of MS studies have been carried out by Ye's group, including differentiation of pTyr and other phosphorylations using polyethylenimine-g-phenylguanidine (PEI-PG)-modified nanochannels,25 development of a Src homology 2 (SH2)-domain-derived pTyr superbinder as the affinity reagent to systematic identify pTyr peptides from nine human cell lines,26 and elucidation of the biological function of EphB4 receptor tyrosine kinase by integrated transcriptome and pTyr proteome analyses followed by biochemical confirmation.27 The latter work provides new insights into the signaling networks dictating therapeutic response to lapatinib as well as a rationale for co-targeting EphB4 in HER2-positive breast cancer.27
539 phosphorylation sites in 5431 proteins, and revealing elevated kinase activities of Src family kinases (SFKs), protein kinase C (PKCs), mitogen-activated protein kinases (MAPKs), and Rho-associated kinases (e.g., ROCK2) in HCC.22 By identifying the main kinases in various tumor tissues and the corresponding para-tissues, kinase activity can be targeted and extended to personalized medicine, and appropriate drug combinations can be used to benefit individual patients.22 Among all types of phosphorylation, the dysregulation of tyrosine phosphorylation (pTyr), which is naturally less abundant (1.8% of total phosphorylation sites), is usually related to human health and disease.23,24 To analyze pTyr in depth, a series of MS studies have been carried out by Ye's group, including differentiation of pTyr and other phosphorylations using polyethylenimine-g-phenylguanidine (PEI-PG)-modified nanochannels,25 development of a Src homology 2 (SH2)-domain-derived pTyr superbinder as the affinity reagent to systematic identify pTyr peptides from nine human cell lines,26 and elucidation of the biological function of EphB4 receptor tyrosine kinase by integrated transcriptome and pTyr proteome analyses followed by biochemical confirmation.27 The latter work provides new insights into the signaling networks dictating therapeutic response to lapatinib as well as a rationale for co-targeting EphB4 in HER2-positive breast cancer.27
As another biochemical profiling application, MS-based metabolomics techniques have been previously used in attempts to identify individuals with Parkinson's disease (PD). Stewart F. et al. accurately identified and quantified 71 metabolites in the brain and 182 in serum and demonstrated changes in the brain and serum biochemistry of mice that developed progressive brain synucleinopathy.28 Furthermore, Scotty et al. compared the concentrations of 282 LC/MS-quantified plasma metabolites between people with PD and unaffected controls (UC) with and without the LRRK2 mutation, revealing a cluster of 5 analytes such as caffeine, paraxanthine, and theophylline, showing the greatest differences as correlations of coffee consumption and neuroprotectants. These molecules may be markers of resistance to developing PD.29
Overall, MS-based biochemical profiling has paved the way for the discovery and preliminary analysis of large-scale biomarker chemical molecules that provide clinically relevant information. To validate the biomarker value, further imaging and quantification work to detect their distribution and level clearly are needed.
3.2. Mass spectrometry imaging – “where”
Another clinical application of MS is imaging techniques targeting the spatial allocation and quantitative information of chemicals in a sample prepared in a way that conserves their in situ distribution.30 This multi-perspective view from the whole body to the subcellular level can guide our understanding of the characteristics of various chemical molecules and provide an effective approach to track the progression of disease and the effectiveness of treatment (Fig. 3).31 Traditional imaging technologies normally use magnetic (magnetic resonance imaging (MRI)), radioisotope (positron emission tomography (PET), and autoradiography), or optically active imaging probes (fluorescence imaging and immunohistochemistry (IHC)) to locate target molecules.32 However, there is general consensus on the major issues with these technologies, such as the damage to the body caused by radioisotopes, lack of MRI sensitivity, and the instability of enzymes used in IHC and immunofluorescence. Furthermore, discerning the precise origin of molecular signals is not effortless, and some substances with similar structures or properties are difficult to distinguish. Mass spectrometry imaging (MSI), also called imaging mass spectrometry (IMS), integrates the analytical performance of MS with the micro-information obtained by visualizing chemical distributions in samples of interest.33 It offers high spatial resolution, high quality resolution, and a wide quality detection range. It allows for the detection of many molecules, from the range of small molecules, such as lipids and metabolites, to biomolecules, such as peptides and proteins, simultaneously on a single platform.34 Moreover, the same sample can be subsequently subjected to histological examination.35 | ||
| Fig. 3 Workflow of MSI, including sample preparation, MS acquisition, data processing and final visualization. | ||
To date, numerous biological and clinical MSI applications have been reported. Among the MSI techniques based on different ion sources, MALDI has been the most popular. In a typical MALDI analysis, a sample is mixed with a matrix and co-crystallizes after the solvent is removed. Subsequently, under laser irradiation, the matrix receives a large amount of energy, which induces desorption and ionization of the molecules in the sample. Then, a characteristic mass spectrum for each molecule is produced. Each laser spot is represented as a pixel, identified by its (x, y) coordinates. Finally, an image of the composition and the relative abundance and distribution of the target molecule in the sample is obtained by reconstructing the image using professional image processing software, in which the laser spots are shown as pixels in a figure.36 In terms of data processing, sufficient memory is required to store the massive amounts of data. The processing time and central processing unit (CPU) use must also be taken into consideration. Sometimes, matrix-free methods were employed for imaging inorganic materials.37 Nie's group innovatively proposed a laser desorption/ionization (LDI)-MSI approach to detect carbon nanotubes, graphene oxide and carbon nanodots in mice using the carbon cluster ‘fingerprint’ signals,38 and the application was further extended to view in situ doxorubicin release from nanocarriers like polyethylene glycol (PEG)–MoS2.39 They achieved label-free simultaneous imaging of nanomaterials and released drugs. Another commonly used MSI technique is secondary ion MS (SIMS).40,41 In SIMS, the samples are bombarded with a beam of energized primary ions to induce the desorption of target molecules, which are usually analyzed using a quadrupole or TOF mass analyzer. SIMS is a relatively difficult ionization method to perform and usually can detect only target molecules with a low mass range (limited to a few thousand Daltons).42 However, supported by the small diameter of the ion beam, the lateral and depth resolution can be as low as 37 nm and 1 nm, making it capable of detection at the single-cell level.43 MSI applications are described in detail below.
MALDI-MSI also demonstrates additional advantages for lipid analysis. Its sensitivity and specificity are useful in distinguishing the extensive structural diversity observed in lipid groups and following biological changes. Using this approach, a cancer-specific phosphatidylcholine (PC) (16:0/16:1) distribution was examined. The results suggested that PC (16:0/16:1) has great potential to diagnose colorectal cancer.46 Additionally, MALDI-MSI was performed to distinguish severe and mild renal ischemia successfully through the differential expression of lipid degradation products within 2 h, but a histopathological examination could not. Lysolipids were found to be elevated dramatically in severe ischemia, including lysocardiolipins (m/z 1185.8), lysophosphatidylcholines (m/z 496.3), and lysophosphatidylinositol (m/z 619.3). This study demonstrated the potential of using MSI to discriminate different degrees of renal ischemic injury in the clinic.47 Notably, several research groups endeavored to push forward the technique of MALDI-MSI during the past decade, whereas its application is still largely limited to its resolution.48 In most studies, MALDI-MSI is not capable of imaging molecules with resolution at the subcellular and organelle level, yet this level of resolution has been proven valuable in clinical diagnosis.49
For metabolism, a protocol was published in 2016 about metabolite MSI in FFPE tissue by MALDI-Fourier transform ion cyclotron resonance (FT-ICR)-MS, which detected approximately 1500 substances in the range of m/z 50–1000 in tissue samples.50 Recently, a research group established a sensitive MALDI-MSI method to visualize the spatially resolved reprogramming of carnitine metabolism in breast cancer. A classification model was constructed based on 17 carnitine profiles, such as L-carnitine and short-chain acylcarnitines, and it identified breast cancer accurately, achieving an overall consistency of ∼95%.51 A team also performed in situ imaging of metabolite profiles focusing on metabolites from the central carbon metabolism pathway and found an independent prognostic factor (deoxy sugar acids with sulfate esters at m/z 256.9975) for esophageal adenocarcinoma (EAC) patient survival.52 In addition, metabolite detection with TOF-SIMS in a study on the heterogeneity of glioblastoma (GBM) showed increased levels of glutamine (m/z 84.04) and decreased levels of monoacylglyceride C18:1 (m/z 339.29), which led to clearance of the edge of the tumor. Cluster analysis based on 50 peaks revealed that the samples could be divided into three groups (i.e., normal brain samples, primary tumors, and recurrent tumors after therapy).53
314 and 11355 (two histone H4 variants) predicted poor survival for LMS patients.81 Additionally, in a MSI experiment of metastatic melanoma, 12 proteins, such as histone H2B (m/z 13778) and ubiquitin (m/z 8451), and 3 protein signals, including those at m/z 12275 (cytochrome C), m/z 16791 (calmodulin), and m/z 17922, were found to be related to survival and recurrence, respectively, and were used to distinguish patients with different survival and recurrence rates, which is of great significance for choosing individualized treatment strategies.82
Most interestingly, MSI has also contributed to the study of tumor heterogeneity. Proteomic patterns demonstrated that the molecules at m/z 3445 (alpha-defensin 1), m/z 4156, m/z 8416, m/z 11368 (acetylated histone H4), and m/z 14021 (histone H2A) can be used to distinguish tumor subpopulations in the clinic. In addition to inter-sample variations, intra-sample heterogeneity (i.e., within an individual tumor sample) in patients with intestinal-type gastric cancer is higher than that in patients with primary breast cancer.83
These examples all involve the detection of intact target molecules. In situ tryptic digestion is another method that can circumvent the inefficient fragmentation of large proteins in the gas phase.84 This bottom-up method also allows both accurate mass and spatial information to be used to relate imaging data for protein identification. Experimentally, a robotic sprayer is normally used to apply a homogenous coating of enzyme across tissue sections. In an anaplastic glioma research, a set of grade III glioma samples was analyzed using this method with MALDI-MSI, and a cluster analysis yielded 3 main distinct patient subgroups (mainly related to neoplasia, glioma with inflammation, and neurogenesis) based on more than 2500 proteins.85 Recently, 9 protein-related genes, such as SOX11 (m/z 1321.635) and MUC4 (m/z 2057.934), as potential prognostic markers, were discovered in triple-negative breast cancer after tryptic digestion.86 However, the stability and efficiency of the trypsin and the movement of the peptides after digestion are still challenges to overcome in bottom-up assays. Recently, mass-tagged probes have been increasingly employed for in situ analysis. The detection capability of MSI becomes particularly attractive by probe conjugation to heavy metals, for example, lanthanide tags. Lanthanide-tagged mass probes are commonly developed by labeling antibodies with lanthanide isotopes. Two related technologies based on lanthanide-tagged mass probes, termed as imaging mass cytometry (IMC) and multiplexed ion beam imaging (MIBI) have been widely used for tumor microenvironment (TME) investigation.87 In detail, IMC, an approach that combines mass cytometry with immunocytochemistry (ICC) and IHC techniques, was employed to simultaneously quantify the expression of 37 protein markers.88 MIBI, a method relying on SIMS, could achieve simultaneous detection of multiple proteins up to 100.89 On the other hand, peptide-tagged mass probes were designed and prepared for in situ labeling and detection of HER2 in cells and tissue samples.90,91 Laser cleavable probes were developed for co-localization imaging of four types of glycans (i.e., mannose, Galβ group, N-acetylglucosamine and sialic acids, Neu5Aca2-6Gal(NAc)-R) in breast cancerous and paracancerous tissues.92 These successful innovations demonstrate the appeal and promise of MSI in the near future. There are other MSI techniques that are rarely applied in real-world clinical studies. We summarize them and their major features in Table 1. Currently, MSI cannot take the place of the commonly used techniques such as IHC and MRI, even though it has great clinical application prospects. Some issues such as complex and long-time sample processing, high degree of specialization and expensive equipment really limit its clinical uses. In addition, other challenges such as laborious data management and analysis, lack of reproducibility and standard operating procedures are also barriers for MSI to be a routine clinical technique.93 Therefore, there is still a need for tremendous effort to translate MSI from basic research to clinical application.
| Ion source | Ionization type | Samples | m/z range (Da) | Spatial resolution (μm) | Analytical targets | References |
|---|---|---|---|---|---|---|
| a Annotation: MALDI: Matrix Assisted Laser Desorption/Ionization; AP-MALDI: Atmospheric Pressure-MALDI; SIMS: Secondary Ion Mass Spectroscopy; DESI: Desorption Electrospray Ionization; LA-ESI: Laser Ablation Electrospray Ionization; LA-ICP: Laser Ablation Inductively Coupled Plasma; NIMS: Nanostructure-Initiator Mass Spectrometry; AFAI: Air Flow-Assisted Ionization; LESA: Liquid Extraction Surface Analysis; IM: Ion Mobility Spectrometry. M: metabolite; L: lipid; E: element; D: drug; Pep: peptide; Pro: protein; SCI: single cell imaging; SM: small molecules. b It is a high-throughput ion separation technology based on the size, shape, and charge of molecular ions within an electric field, which can be coupled with MS. | ||||||
| MALDI | Endogenous, soft | Solid, liquid | >100000 |
5–200 | M, L, Pep, Pro and others | 55 and 56 |
| AP-MALDI | Exogenous, soft | Solid, liquid | >100000 |
1–50 | M, L, Pep, Pro and others | 57–59 |
| SIMS | Endogenous, hard | Solid, liquid | 1–5000 | 0.037–0.5 | E, L, SCI, other SM | 60–63 |
| DESI | Exogenous, soft | Solid, liquid | 100–500 | 1–500 | L, D, M, Pep, other SM | 64–66 |
| LA-ESI | Exogenous, soft | Liquid | >60000 |
100–500 | L, M, Pro | 67 and 68 |
| LA-ICP | Exogenous, hard | Solid, liquid | 50–500 | 1–10 | E | 69 and 70 |
| NIMS | Soft | Solid, liquid | 100–5000 | 0.15–50 | D, M, Pep, Pro | 71 and 72 |
| AFAI | Exogenous | Solid | 100–1000 | 300 | SM, whole-body molecular imaging | 73 and 74 |
| LESA | Soft | Solid | 100–2000 | 1000 | D, Pep, L, other SM | 75–77 |
| IMb | Soft/hard | Solid, liquid | 100–2000 | 20–200 | L, M, D, Pep, Pro | 78–80 |
 | ||
| Fig. 4 Schematic representation of MS-targeted analysis of chemicals using protein as an example. | ||
Finally, the above innovative studies mainly focus on single-omics or a class of chemical molecules such as neurotransmitters, lipids, metabolites and proteins. While it is usually difficult to understand diseases comprehensively at a single-omics layer, integrated MSI studies across multi-omics layers may be more attractive in future.94 However, sample preparation and data processing are also thought to be the factors hindering the application of MSI in multi-omics imaging. Improvement of hardware and software performance and simplification of sample preparation could be a solution.48
3.3. Specific molecular targeting and probing – “how many”
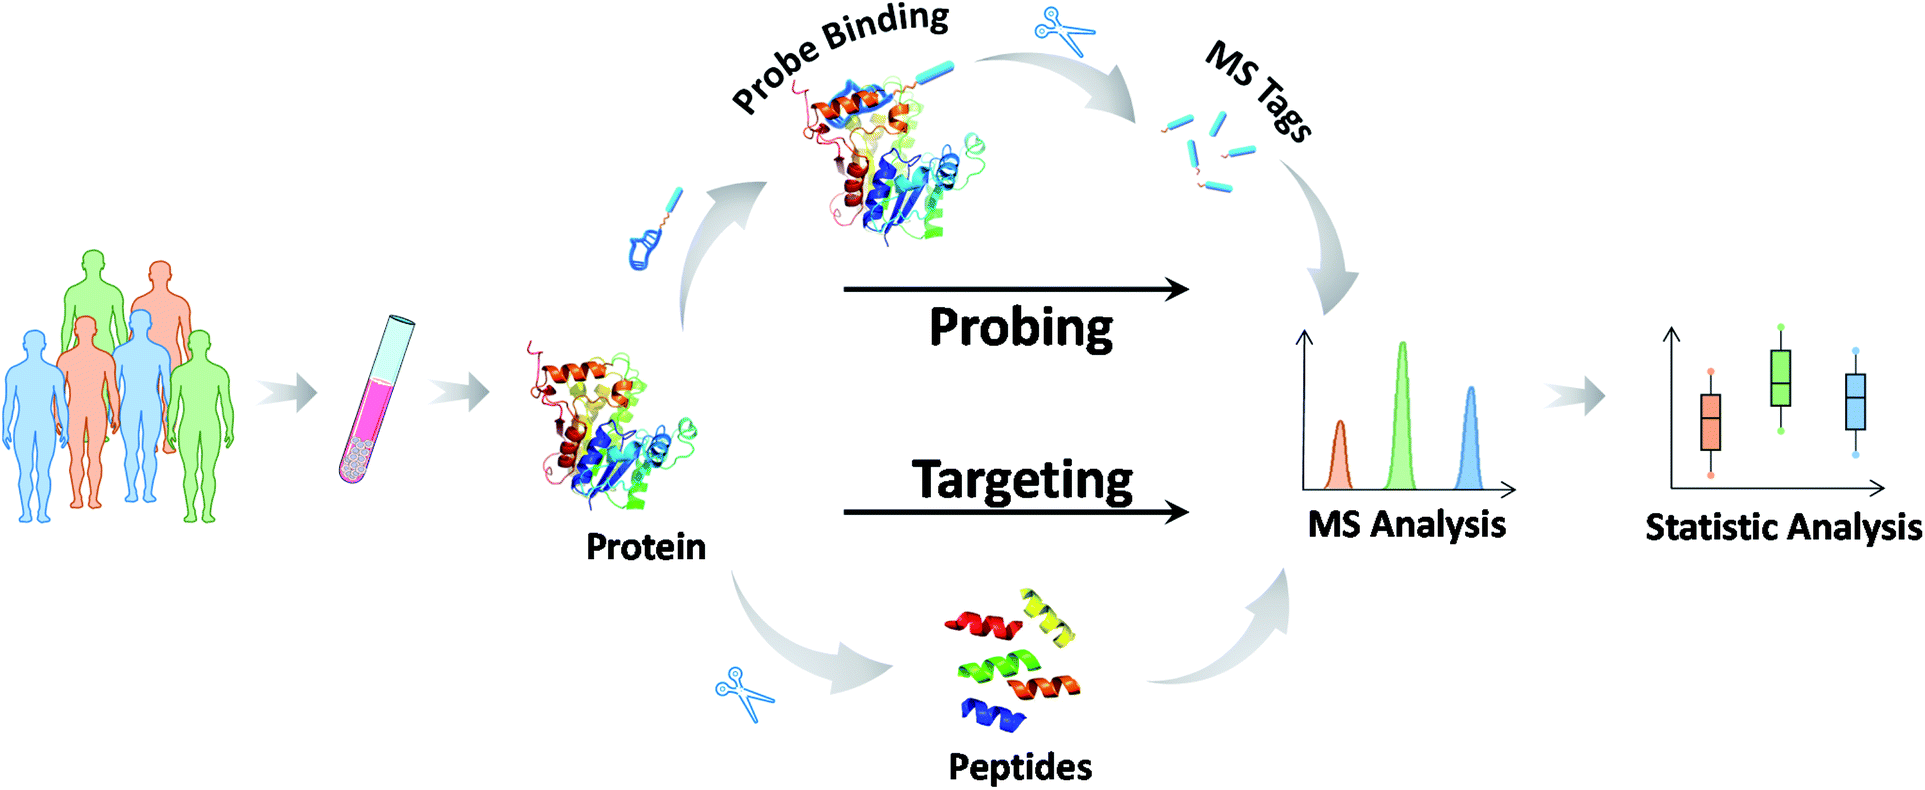
Most biochemical profiling and mapping assays typically show high coefficients of variation because of their non-targeted nature and are thus not suitable for routine clinical assays. Reducing the uncertainty and enhancing the accuracy of the information on targeted chemical molecules is at the forefront of precision medicine.95 Data reliability and consistency are the bases for resolving higher-layer clinical challenges. MS-based targeted analysis can provide quantitative and solid information with regard to validated analysis protocols for defined chemicals.96 The most common approach, termed selective reaction monitoring or multiple reaction monitoring (SRM/MRM), employs the isolation and fragmentation of target chemicals and the quantification of their specific fragments upon the addition of internal standards. These chemical molecules can be detected within the fmol concentration range in complex biological specimens, and abnormal values can be identified in a short time. Therefore, it comes as no surprise that MS-based targeted analysis has great potential for use in biomarker grading and disease classification. For example, amino acids, acylcarnitines, organic acids in newborns and vitamin D (VD) groups in children have been routinely tested in clinical practice.97 These assays and their applications are described in detail in the next section.Here, we focus on the MS methodology that has been recently developed for targeted analysis. In the past few years, targeted proteomics has increasingly become a powerful tool in protein-like marker analysis.98 In principle, a protein of interest is specifically detected at the surrogate peptide level. The general protocol involves six steps: (1) sample pretreatment and protein extraction, (2) protein enzymatic digestion, (3) selection of suitable surrogate peptides as quantitative substitutes for the target protein, (4) chemically synthesizing internal standard peptides with heavy stable isotopes, (5) approach development and verification, and finally (6) detection of surrogate peptides using SRM/MRM.99 The measurements of the surrogate peptide levels represent those of the target protein. To date, much work has been applied to protein and PTM quantification using this approach, such as quantification of the p53 family proteins,100 serum transferrin receptor (TfR),101 and histone methylation species.102 This MS-based approach bridges the gap between the preliminary discovery of protein markers and their clinical validation (Fig. 4).
The detection of serum thyroglobulin was one of the earliest applications of targeted proteomics assays in clinical practice. Serum thyroglobulin levels are a significant cancer biomarker for monitoring patients who receive treatment for differentiated thyroid carcinoma.103 The limit of detection (LOQ) can be as low as 0.15 ng mL−1. Furthermore, four MS-based assays conducted in four different centers showed better inter-assay agreement than four different automated immunoassays at the same center, demonstrating the consistency of these targeted proteomics assays. In addition to its application in thyroglobulin measures, MS-based targeted assays are increasingly used in the clinic.
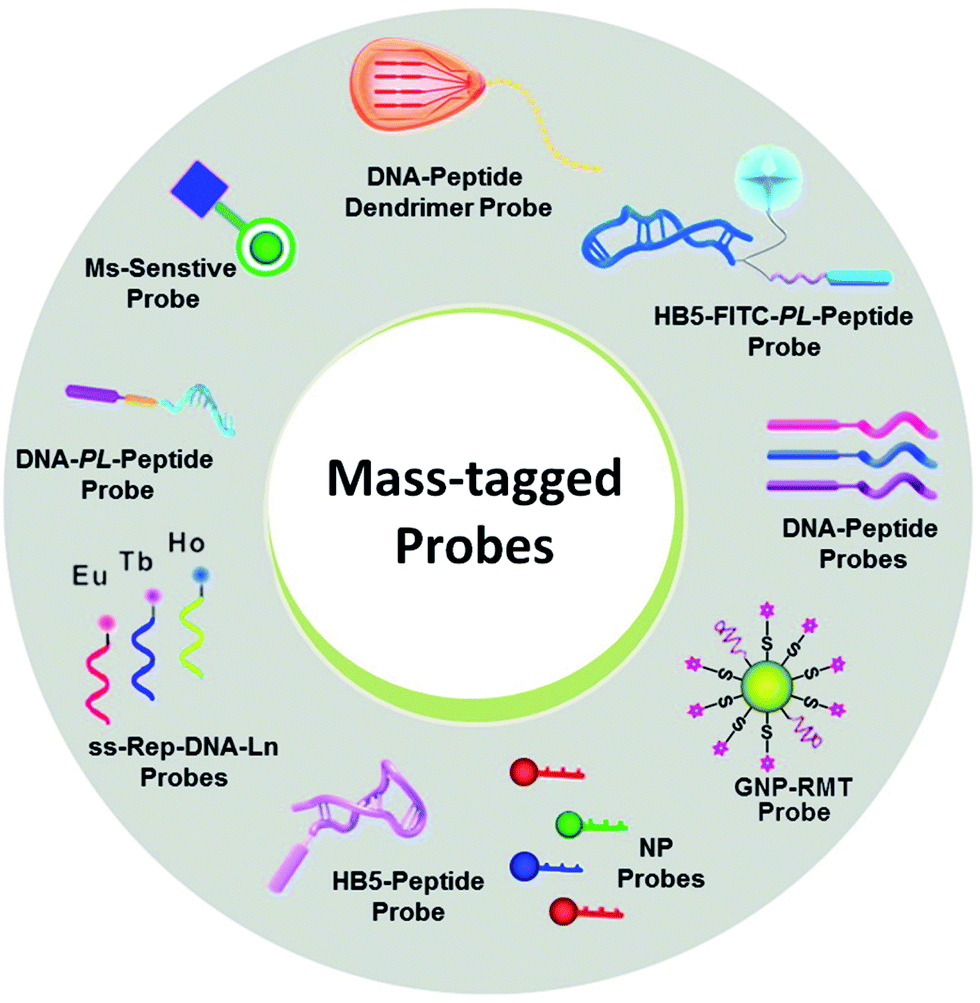 | ||
| Fig. 5 Various mass-tagged probes in MS-based targeted analysis. NP: nanoparticle; GNP-RMT: gold nanoparticle-rhodamine-based mass tags. | ||
Notably, even in the presence of direct MS-based targeted analysis, the clinical evaluation of potential markers and even the clinical utility of approved markers are still tempered by the uncertainty stemming from the inherent nature of the target molecules. In this context, the use of mass-tagged probes that can selectively tag and facilitate the subsequent conversion of target information into quantitative MS responses has gained increasing interest (Fig. 5).104 Mass-tagged probes are small-molecule reagents (e.g., heavy metals, organic molecules, and peptides) that usually have higher MS sensitivity and are easy to manipulate. In general, there are three steps in molecular probing studies: (1) design and preparation of the mass-tagged probes, (2) addition of the probes to samples and binding of the probes to targets, and (3) release of the mass tag and quantification by MS.
For example, membrane proteins are very difficult to quantify directly due to their amphiphilic nature.105 Mass-tagged probes can be used not only for mapping, but also for quantification. The only necessary trick is the use of mass-conjugated aptamers for target recognition. Aptamers are artificial single-stranded DNA/RNA sequences or peptides that can fold into distinct secondary and tertiary structures to make them suitable for binding to certain targets with extremely high binding affinity and high specificity.106 Aptamers have been increasingly involved in mass-tagged probe design. Using peptide–aptamer probes, HER2 levels in BT474, SK-BR-3, MCF-7, and MDA-MB-231 cells were correlatively quantified as (10.1 ± 2.63) × 105 per cell, (9.43 ± 1.89) × 105 per cell, (0.56 ± 0.17) × 105 per cell, and (0.53 ± 0.09) × 105 per cell, respectively.91
Targeting molecules with trace amounts in biological samples is another challenge because their mass response is lower than the LOQ for MS detection. The combination of targets, probes, or signal amplification methods, such as enzymes, dendrimers, and nanoparticles, with effective target recognition can significantly increase the assay sensitivity. Liu et al. designed an ultrasensitive detection assay for low-abundance protein thrombin and EpCAM using a mass tag on gold nanoparticles for signal amplification in addition to aptamer capture.107 The detection limit of this assay reached 100 aM. In another study, Chen et al. used a peptide dendrimer to create a target signal amplification strategy. The signal intensity was ∼10-fold greater than that without signal amplification.108
In particular, some molecules, such as nucleic acids, are hard to be directly detected by MS due to their complicated and unresolved mass spectra. Nucleic acids consist of only four nucleotides, which means that the risk of producing similar mass spectra from different sequences may be potentially greater than that of proteins containing 20 amino acids.109 Although a couple of new techniques, such as MassARRAY System using MALDI-TOF MS, can analyze DNA within a mass range of approximately 4500–9000 Da and with a resolution of 16 Da, they are still at an early stage of development.110 Comparatively, mass-tagged probes have advanced the application of MS in this field. Bang et al. created a multiplex DNA detection assay based on ICP-MS using lanthanide-labeled probes.111 With this use of heavy metals, the detection capability of ICP-MS has become particularly attractive. The advantage of the lanthanide tag is that it is not prone to nonspecific binding and is rare in biological samples. Moreover, it is also small, stable, and heat-resistant, making its application convenient.112 The method detection limits were determined to be 28 amol for HIV, 48 amol for HAV, and 19 amol for HBV.111 Another type of probe used for nucleic acid detection is a DNA–peptide probe containing a tagged reporter peptide. A tryptic cleavage site for peptide release and a DNA sequence complementary to the target miRNA were designed for miRNA detection. Thus, miR-21 was evaluated as (4.56 ± 1.99) × 108 copies per mg in normal tissue and (1.09 ± 0.41) × 109 copies per mg in tumor tissue.112 Furthermore, this strategy using a multiplex DNA–peptide probe was applied to profile the levels of five different miRNAs (i.e., miR-21, miR-let7a, miR-200c, miR-125a, and miR-15b).113 The choice of the peptide is critical for these probes. There are several empirical principles related to the choice of peptides with high responses: (1) the peptide length between 6 and 16 amino acids, (2) no cysteine or methionine residues, (3) no single nucleotide polymorphism or PTMs, (4) no proline residue at the C-terminus with lysine or arginine residues, (5) no continuous sequence of lysine or arginine residues (RR, KK, RK, nor KR), and (6) no transmembrane region for membrane proteins.114 Most importantly, the combination of these probes and an amplification strategy allows DNA detection within a sensitivity range appropriate for biologically relevant studies. Therefore, it may be possible to include more nucleic acid markers in clinical practice guidelines and recommendations in the future.
Although these assays have demonstrated great potential in precision medicine, only a few assays have been translated to date. MS-based clinical assays are still a small portion of currently approved assays, as mentioned below. Continued MS technological and methodological advances for chemical molecules are necessary to sustain this clinical growth.
| IHC | FISH | MS | |
|---|---|---|---|
| a Annotation: A: advantages; D: disadvantages. | |||
| Definition | An antibody-based, semi-quantitative method. Slides are incubated with an antibody directed against target protein, and the protein is finally made visible with a chromogen (e.g., diaminobenzidine, DAB) resulting in membrane staining | The nucleic acid probes labelled directly or indirectly with fluorescein were hybridized with the nucleic acid sequences in the samples to be tested according to the principle of base complementary pairing. Use of the labeled probe to calculate the HER2 gene copy number within the nuclei of tumor cells | A powerful spectrum of charged atoms, molecules and molecular fragments in order of their m/z. It can make matter particles form into ions and separate them, and then analyze after the detection of intensity |
| A/D | A: 1. Easy to perform and store | A: 1. More accurate, reliable, sensitive and reproducible than IHC | A: 1. Different types of biomolecules can be measured, including lipids, protein etc. |
| 2. Relatively cheap and less time consuming | 2. The concordance rate among observers is higher than that of IHC | 2. Modification states and molecular complex can be qualitatively and quantitatively detected | |
| 3. The protein level can be evaluated in the context of tissue morphology using a microscope | D: 1. More time-consuming and more expensive compared with IHC | 3. High mass accuracy and resolution, high sensitivity, selectivity, multiplexing capability, versatility, and high concentration ranges | |
| D: 1. Several factors may affect the quality of this assay, such as choice of antibody, tissue fixation, etc. | 2. Interpretation of FISH assays needs well-trained personnel | D: poor at subcellular localization or spatial resolution of protein expression | |
| 2. Susceptible to considerable inter-observer variability to substantial discrepancies in result interpretation | |||
| Scoring criteria | 0: no staining is observed or membrane staining that is incomplete and is faint/barely perceptible and within ≤10% of tumor cells | FISH (dual probe) (2018) | Quasi-targeted proteomics approach using an aptamer–peptide probe and RPLC-MS/MS |
| 1+: incomplete membrane staining that is faint/barely perceptible and within >10% of tumor cells | Positive: 1. HER2/CEP17 ratio ≥2.0 and average HER2 copy number ≥4.0 | 0: 7.33 ± 3.41 nmol m−2 | |
| 2+: weak to moderate complete membrane staining observed in >10% of tumor cells | 2. HER2/CEP17 ratio ≥2.0 and average HER2 copy number <4.0, IHC 3+ | 1+: 15.8 ± 4.42 nmol m−2 | |
| 3+: circumferential membrane staining that is complete, intense, and within >10% of tumor cells | 3. HER2/CEP17 ratio <2.0 and average HER2 copy number ≥6.0, IHC 2+, 3+ | 2+/FISH-negative: 18.4 ± 7.21 nmol m−2 | |
| 4. HER2/CEP17 ratio <2.0 and average HER2 copy number ≥4.0 and <6.0, IHC 3+ | 2+/FISH-equivocal: 32.2 ± 1.18 nmol m−2 | ||
| Negative: 1. HER2/CEP17 ratio <2.0 and average HER2 copy number <4.0 | 2+/FISH-positive: 48.2 ± 4.25 nmol m−2 | ||
| 2. HER2/CEP17 ratio ≥2.0 and average HER2 copy number <4.0, IHC 0, 1+, 2+ | HER2 3+: 45.4 ± 11.2 nmol m−2 | ||
| 3. HER2/CEP17 ratio <2.0 and average HER2 copy number ≥6.0, IHC 0, 1+ | |||
| 4. HER2/CEP17 ratio <2.0 and average HER2 copy number ≥4.0 and <6.0, IHC 0, 1+, 2+ | |||
3.4. Sensitive biomarker grading and disease classification – “whose”
As the milestones of MS-based chemical mapping pipelines, biomarker grading and disease classification come closest to meeting the rationale-based goals of precision medicine. Unfortunately, the number of MS assays translated into routine clinical practice is much lower than that of other techniques, as described above. The major reason is that the road from hypothesis to technology dissemination in the form of clinical measurement procedures is predictably long. Using the serum thyroglobulin assay as an example,115 more than 10 years passed between the first proof-of-principle experiments and the most recent version of the assay. Currently, many MS-based assays are on the road to clinical use. We describe both the clinical availability and potential applications of these assays in this section.In recent decades, as a revolutionary technology, newborn screening by MS has been increasingly used and added to public health policies, which has encouraged more newborn screening studies for early treatment.116 Clinical MS testing, including the measurement of amino acids, fatty acid oxidation levels, and organic acids for screening more than 30 inherited conditions, is relatively mature. Hundreds of metabolite molecules have been identified in blood spots and urine. Additionally, the acquisition of these samples is cost-effective, more secure and friendlier to infants. For example, mucopolysaccharide is a type of multisystem disease caused by a lysosomal storage disorder that can lead to death in severe cases. Some enzymes, especially α-L-iduronidase,117 are quantified in the blood by MS, and then, the screen-positive samples are confirmed by gene sequencing. This method, together with gene sequencing technology, has been used in newborn screening at numerous institutions and has benefited patients in recent years.118
In addition to the chemicals analyzed in newborn screening, MS detection is the most commonly used method for VD assays due to the similar structures and characteristics of VD analogs. It is well known that VD deficiency causes not only rickets, but also autoimmune, cardio-cerebrovascular, and reproduction-related diseases. Among all VD metabolic compounds, 25-OH-D3 is the most reliable indicator of VD deficiency because of its long half-life and stability in circulation.119 Patients with VD deficiency detected by MS normally maintain serum 25-OH-D3 values less than 20 ng mL−1.120,121 In another study, CYP24A1 was shown to be a key enzyme regulating the conversion of 25-OH-D3 into the VD3 metabolite 24,25-(OH)2D3.122 In CYP24A1-mutant idiopathic infantile hypercalcemia (IIH) serum, 24,25-(OH)2D3 is lower than 1.25 nmol L−1, which is only approximately one-fifth of that of normal individuals.123
For some markers, the MS-based approach has shown better performance in disease grading and has begun to override the traditional boundaries of disease classifications. A typical example is HER2 (Table 2). IHC combined with fluorescence in situ hybridization (FISH) is the most commonly used method of grading tumors in clinical practice, as recommended by the American Society of Clinical Oncology (ASCO) and College of American Pathologists (CAP) guidelines in recent years. Comparatively, MS quantification provides more accurate results of HER2 and more reliable prognostic information (Table 3). Paolo Nuciforo's team quantified HER2 protein levels in FFPE tissue samples and suggested that patients with an HER2 threshold of 740 amol μg−1 can benefit from monoclonal antibody treatment in breast cancer.124 Chen's laboratory developed an aptamer–peptide probe for MS assay, and matched pairs of breast tissue samples were subjected to analysis. The level of HER2 in the tissue was quantified accurately: the concentration of HER2 0 was 7.33 ± 3.41 nmol m−2, the concentration of HER2 1+ was 15.8 ± 4.42 nmol m−2, the concentration of HER2 2+/FISH-negative was 18.4 ± 7.21 nmol m−2, the concentration of HER2 2+/FISH-equivocal was 32.2 ± 1.18 nmol m−2, the concentration of HER2 2+/FISH-positive was 48.2 ± 4.25 nmol m−2, and the concentration of HER2 3+ was 45.4 ± 11.2 nmol m−2. The reference HER2 interval was calculated from 3.52 (90% CI, 1.31–5.74) nmol m−2 to 19.9 (90% CI, 17.7–22.2) nmol m−2. The samples with values exceeding this range were considered positive.91 Clinical HER2 testing in a more accurate manner may be achieved in the near future. False positives can be reduced, and treatment selection can be thus more precise.
| Guideline | Disease | Biomarker | MS | Title | Release date | Web |
|---|---|---|---|---|---|---|
| a Annotation: FDA: Food and Drug Administration; AMP: Association for Molecular Pathology; ESCMID: European Society of Clinical Microbiology and Infectious Diseases; CDC: Centers for Disease Control and Prevention; NACB: National Academy of Clinical Biochemistry; ACMG: American College of Medical Genetics and Genomics; ASHG: American Society of Human Genetics; CAP: College of American Pathologists; NIST: The National Institute of Standards and Technology; TES: The Endocrine Society; ASCO: American Society of Clinical Oncology. | ||||||
| FDA | COVID-19 | SARS-CoV-2 | MALDI-MS | Emergency use authorization (EUA) summary SARS-COV-2 mass array test | 2020 | https://www.fda.gov/media/142548/download |
| FDA | Serious infections in hospitalized patients (e.g., bloodstream infections) | Candida auris (C. auris) | MALDI-MS | FDA authorizes new use of test, first to identify the emerging pathogen Candida auris | 2018 | https://www.fda.gov/news-events/press-announcements/fda-authorizes-new-use-test-first-identify-emerging-pathogen-candida-auris |
| AMP | Invasive fungal infections | Filamentous fungi and mycobacteria | MALDI-MS | Emerging and future applications of matrix-assisted laser desorption ionization time-of-flight (MALDI-TOF) mass spectrometry in the clinical microbiology laboratory: a report of the association for molecular pathology | 2016 | https://www.sciencedirect.com/science/article/pii/S1525157816301441?via%3Dihub |
| ESCMID | Bloodstream infection (BSI) | Bacteria, fungi, parasites, and viruses | MALDI-MS | Bloodstream infections – standard and progress in pathogen diagnostics | 2020 | https://www.sciencedirect.com/science/article/abs/pii/S1198743X19306160?via%3Dihub |
| ESCMID | Bloodstream infection (BSI) | Pathogen | MALDI-MS | Microbiological diagnostics of bloodstream infections in Europe – an ESGBIES survey | 2019 | https://pubmed.ncbi.nlm.nih.gov/30980927/ |
| CDC | E. meningoseptica | Elizabethkingia | MALDI-MS | Determination of Elizabethkingia diversity by MALDI-TOF mass spectrometry and whole-genome sequencing | 2017 | https://wwwnc.cdc.gov/eid/article/23/2/16-1321-f1 |
| CDC | Corynebacterium pseudodiphtheriticum infection in children with cystic fibrosis (CF) | C. pseudodiphtheriticum strains | MALDI-MS | Outbreak of Corynebacterium pseudodiphtheriticum infection in cystic fibrosis patients, France | 2010 | https://wwwnc.cdc.gov/eid/article/16/8/10-0193_article |
| CDC | Amino acid disorders (e.g., PKU, maple syrup urine disease, and homocystinuria), fatty acid oxidation disorders (e.g., medium-chain acyl-CoA dehydrogenase [MCAD] deficiency) and other organic acid disorders | Amino acids, fatty acids, and organic acids | MALDI-MS | Using tandem mass spectrometry for metabolic disease screening among newborns | 2001 | https://www.cdc.gov/mmwr/preview/mmwrhtml/rr5003a1.htm |
| NACB | Multiple inborn errors of metabolism | Amino acid, acylcarnitine, organic acid | MALDI-MS | National academy of clinical biochemistry laboratory medicine practice guidelines: follow-up testing for metabolic disease identified by expanded newborn screening using tandem mass spectrometry; executive summary | 2009 | https://academic.oup.com/clinchem/article/55/9/1615/5629176 |
| CDC | Phenylketonuria, 3-methylcrotonyl-CoA carboxylase deficiency, medium-chain acyl-CoA dehydrogenase deficiency, etc. | Metabolites | MALDI-MS | Impact of expanded newborn screening – United States, 2006 | 2008 | https://www.cdc.gov/mmwr/preview/mmwrhtml/mm5737a2.htm |
| ACMG | Inborn errors of metabolism | Organic acids | GC-MS | Laboratory analysis of organic acids, 2018 update: a technical standard of the American College of Medical Genetics and Genomics (ACMG) | 2018 | https://www.nature.com/articles/gim201845 |
| ACMG/ASHG | Amino acidemias, organic acidemias, fatty acid oxidation disorders | Amino acids, fatty acids, and organic acids | MALDI-MS | Tandem mass spectrometry in newborn screening: American College of Medical Genetics/American Society of Human Genetics Test and Technology Transfer Committee Working Group | 2000 | https://www.nature.com/articles/gim2000261 |
| CAP | Second-order or follow-up test, especially in patients with renal disease | 1,25-Dihydroxy vitamin D | LC-MS/MS | Educational discussion: bone markers and vitamins | 2016 | https://documents.cap.org/documents/2016-b-bone-markers-vitamins.pdf |
| NIST | Vitamin D deficiency or insufficiency | 25(OH)D | LC-MS/MS | Development of a standard reference material for vitamin D in serum | 2008 | https://academic.oup.com/ajcn/article/88/2/511S/4650005 |
| TES | Artery disease, stroke, and breast cancer | Estradiol (E2) | LC-MS/MS, GC-MS | Challenges to the measurement of estradiol: an endocrine society position statement | 2013 | https://www.ncbi.nlm.nih.gov/pmc/articles/PMC3615207/ |
| CAP | Assessing the success of aromatase inhibitor therapy in women with breast cancer | Testosterone and estradiol | LC-MS/MS | 2019-A accuracy based testosterone and estradiol | 2019 | https://documents.cap.org/documents/2019-A-Accuracy-Based-Testosterone-and-Estradiol.pdf |
| CAP | Kidney disease | Urine albumin, total protein, and creatinine | LC-MS/MS | Urine albumin, total protein, and creatinine | 2018 | https://documents.cap.org/documents/2018-urine-a.pdf |
| ASCO | Breast oncogenesis | Human epidermal growth factor receptor type 2 (HER2) | LC-MS/MS | Selected reaction monitoring mass spectrometry (SRM-MS) evaluation of HER2 equivocal breast cancer | 2019 | https://meetinglibrary.asco.org/record/176269/abstract |
| ASCO | Early-stage lung cancer | MCM4 | LC-MS/MS | MCM4 as a prognostic biomarker of early-stage lung cancer | 2020 | https://meetinglibrary.asco.org/record/187716/abstract |
| ASCO | Non-small cell lung carcinoma (NSCLC) | PD-1/PD-L1 | LC-MS/MS | Liquid chromatography coupled to multiple reaction monitoring (LC-MRM) for quantification of PD-L1 and PD1-signaling proteins in non-small cell lung carcinoma (NSCLC) | 2020 | https://meetinglibrary.asco.org/record/187536/abstract |
| ASCO | Pancreatic ductal adenocarcinoma (PDAC) | Glycosylation markers | LC-MS/MS | Serum glycoproteomic-based liquid biopsy for the detection of pancreatic ductal adenocarcinoma | 2020 | https://meetinglibrary.asco.org/record/182272/abstract |
| ASCO | Pancreatic cancer | Alpha-1-acid glycoprotein 1 (AGP1) | LC-MS/MS | Alpha-1-acid glycoprotein 1 (AGP1) as a novel biomarker for pancreatic cancer | 2019 | https://meetinglibrary.asco.org/record/174117/abstract |
Another study demonstrated that biomarker fingerprints can be predictive of responses to immunotherapy and survival in the supposedly homogeneous group of breast cancer patients and allows for the stratification of patients.125 Proteins that contribute the most to the proteotype-based classification, including INPP4B, CDK1, and ERBB2, are associated with the estrogen receptor (ER) status, HER2 status, and tumor grade status. It was confirmed that the classification of breast cancer subtypes at the protein level can lead to more accurate patient stratification than the “conventional subtypes”.
In addition to these clinically approved markers, there are many MS-based chemical molecules generated in clinical studies waiting for clinical translation. A very important link between clinicians and researchers is required to shorten the experimental cycle of these potential biomarkers and to subject them to hospital laboratory testing. Frataxin in platelets was suggested for the diagnosis of the rare disease Friedreich's ataxia (FA).126 This assay, which is based on a two-dimensional nano-UPLC, can sensitively and specifically differentiate between control groups and FA patients. The frataxin level in platelets from the control groups was 9.4 ± 2.6 pg μg−1 protein, whereas the level in the platelets from FA patients was 74.5% lower than that of the controls at 2.4 ± 0.6 pg μg−1.
The diagnostic performance of both amyloid-β and Tau, which are indicative of AD, was evaluated.127,128 Tau in the cerebrospinal fluid (CSF) of patients was significantly greater than that in healthy controls (mean of the control = 17 pmol L−1, and AD = 29 pmol L−1). Plasma amyloid-β biomarkers obtained by immunoprecipitation coupled with MS have been assayed. The cutoff value of CSF Aβ1–42 was 544 ng L−1, which is below the abnormal Aβ1–42 level. Another potential marker for AD diagnosis is plasma lipoproteome. Li et al. measured 120 tryptic peptides from 79 plasma lipoproteins by a MS-based targeted analysis. After a proof-of concept case–control study of AD patients and controls, much more differentially expressed tryptic peptides were found in plasma lipoproteins than in immunodepleted plasma, suggesting that plasma lipoproteome may be more suitable for AD diagnosis.129 As indicated by a dual-probe MS approach, breast cancer patients with high MUC1-specific terminal Gal/GalNAc showed significantly increased metastatic potential and poorer prognosis than those with low expression. Specifically, the amount of MUC1-specific terminal Gal/GalNAc was quantified to be (0.96 ± 0.09) × 103 nmol m−2 in the normal tissue and (1.74 ± 0.16) × 103 nmol m−2 in the tumor tissue (p < 0.001).130
In clinical testing, the other widely applied MS technique is MALDI-TOF MS, which has completely changed the routine identification of bacteria, fungi, and viruses in clinical microbiology laboratories.131 This technique can provide unique signatures for each microorganism. The chief advantages of using MALDI-TOF technology indicates that it may potentially replace conventional microbe culture because it is reliable and much quicker (from several days to less than an hour).132 Specific standardized procedures have been established for microorganisms, and the relevant systems have received approval from official institutions and organizations, such as the US FDA. Moreover, ∼15000 prokaryotes and ∼70000 fungi have been documented in MALDI-TOF-MS databases.133 MS has greater application prospects in the detection of clinical microbial species in the clinic.
Though MS assays clearly produce more accurate results than other approaches, they still have disadvantages, such as costly instrumentation, resulting in low levels of use in past laboratory medicine. Currently, there is a great expansion in the use of MS in clinical laboratories. We expect that large-scale clinical trials will be established to determine the thresholds of various chemicals for detecting different levels or types of diseases.
3.5. Others
In a variety of chemical molecules, there is one type of molecule that we do not discuss in this review. In contrast to the chemicals we presented here, most drugs are exogenous. The spatial distribution and expression levels of these drugs and their metabolites in various tissues and organs of the body can provide powerful evidence for their pharmacokinetics, pharmacology, and toxicology. Specifically, MS-based drug analysis can provide the spatial distribution and expression levels of drugs and their metabolites in various tissues and organs of the body. This information can be used in the study of drug metabolism pharmacokinetics/pharmacodynamics, drug distribution, toxicology, doping control, pain management, workplace drug testing, etc.134 All these characteristics can also be resolved by MS-based chemical mapping and profiling methods, and we may describe them in detail elsewhere.4. Conclusion and perspectives
In precision medicine, integrating emerging research on the chemical makeup of diseases with clinical data on individual patients can drive the development of a more accurate classification of diseases and, ultimately, enhance diagnosis and treatment. However, there is a bumpy road between the mastery of chemical knowledge and its implementation in clinical practice. Previous studies have focused on higher-layer data while neglecting the basic chemical information underneath it. Fortunately, MS-based chemical mapping and profiling compensates for each bump in this road, from molecular profiling to disease grading. Although its involvement in precision medicine is far from satisfactory, MS-based chemical mapping/profiling strategies have demonstrated potential and promise in this field. The urgent need is convincing chemists to participate in this evolution. Considering the confluence of the relevant information from physical and biological layers, we believe the understanding of diseases will be achieved at the molecular level and that the gap between chemical research and clinical practice will be closed.Author contributions
YH and ZW contributed equally to this work. All of the authors participated in this review work. YC proposed and designed the review. YH, ZW, LL, JZ, DZ and JZ collected the literatures and prepared the draft. MX, YZ and FX designed and constructed the figures and tables. YC, YH, and ZW finally revised and proofed the review.Conflicts of interest
There are no conflicts to declare.Acknowledgements
National Natural Science Foundation of China (21722504, and 21675089), SEU-NJMU Cooperation Project (2242017K3DN12), SEU-NJMU-CPU Cooperation Project (2242019K3DNZ2), Primary Research & Development Plan of Jiangsu Province (BE2018725), and Science and Technology Development Fund of NJMU (NMUD2019009) are gratefully acknowledged.References
- J. Kimmelman and I. Tannock, Nat. Rev. Clin. Oncol., 2018, 15, 341–342 CrossRef PubMed.
- D. J. Hunter and D. L. Longo, N. Engl. J. Med., 2019, 380, 2472–2474 CrossRef PubMed.
- J. Kaur, B. Rahat, S. Thakur, J. Kaur, M. Verma and D. Barh, in Progress and Challenges in Precision Medicine, Academic Press, 2017, pp. 269–299 Search PubMed.
- G. M. Church, ACS Cent. Sci., 2015, 1, 11–13 CrossRef CAS PubMed.
- A. J. Ingram, C. L. Boeser and R. N. Zare, Chem. Sci., 2016, 7, 39–55 RSC.
- B. Zhang, J. R. Whiteaker, A. N. Hoofnagle, G. S. Baird, K. D. Rodland and A. G. Paulovich, Nat. Rev. Clin. Oncol., 2019, 16, 256–268 CrossRef PubMed.
- N. J. Clarke, Clin. Chem., 2016, 62, 70–76 CrossRef CAS PubMed.
- N. Glassbrook and J. Ryals, Curr. Opin. Plant Biol., 2001, 4, 186–190 CrossRef CAS PubMed.
- D. S. Wishart, C. Knox, A. C. Guo, R. Eisner, N. Young, B. Gautam, D. D. Hau, N. Psychogios, E. Dong, S. Bouatra, R. Mandal, I. Sinelnikov, J. G. Xia, L. Jia, J. A. Cruz, E. Lim, C. A. Sobsey, S. Shrivastava, P. Huang, P. Liu, L. Fang, J. Peng, R. Fradette, D. Cheng, D. Tzur, M. Clements, A. Lewis, A. De Souza, A. Zuniga, M. Dawe, Y. P. Xiong, D. Clive, R. Greiner, A. Nazyrova, R. Shaykhutdinov, L. Li, H. J. Vogel and I. Forsythe, Nucleic Acids Res., 2009, 37, D603–D610 CrossRef CAS PubMed.
- S. F. Graham, O. Turkoglu, P. Kumar, A. Yilmaz, T. C. Bjorndahl, B. Han, R. Mandal, D. S. Wishart and R. O. Bahado-Singh, J. Proteome Res., 2017, 16, 2587–2596 CrossRef CAS PubMed.
- M. Zhou, C. Lantz, K. A. Brown, Y. Ge, L. Paša-Tolić, J. A. Loo and F. Lermyte, Chem. Sci., 2020, 11, 12918–12936 RSC.
- Y. Cong, K. Motamedchaboki, S. A. Misal, Y. Liang, A. J. Guise, T. Truong, R. Huguet, E. D. Plowey, Y. Zhu, D. Lopez-Ferrer and R. T. Kelly, Chem. Sci., 2021, 12, 1001–1006 RSC.
- B. Shen, X. Yi, Y. Sun, X. Bi, J. Du, C. Zhang, S. Quan, F. Zhang, R. Sun, L. Qian, W. Ge, W. Liu, S. Liang, H. Chen, Y. Zhang, J. Li, J. Xu, Z. He, B. Chen, J. Wang, H. Yan, Y. Zheng, D. Wang, J. Zhu, Z. Kong, Z. Kang, X. Liang, X. Ding, G. Ruan, N. Xiang, X. Cai, H. Gao, L. Li, S. Li, Q. Xiao, T. Lu, Y. Zhu, H. Liu, H. Chen and T. Guo, Cell, 2020, 182, 59–72 CrossRef CAS PubMed.
- H. Zhang, T. Liu, Z. Zhang, S. H. Payne, B. Zhang, J. E. McDermott, J. Y. Zhou, V. A. Petyuk, L. Chen, D. Ray, S. Sun, F. Yang, L. Chen, J. Wang, P. Shah, S. W. Cha, P. Aiyetan, S. Woo, Y. Tian, M. A. Gritsenko, T. R. Clauss, C. Choi, M. E. Monroe, S. Thomas, S. Nie, C. Wu, R. J. Moore, K. H. Yu, D. L. Tabb, D. Fenyo, V. Bafna, Y. Wang, H. Rodriguez, E. S. Boja, T. Hiltke, R. C. Rivers, L. Sokoll, H. Zhu, I. M. Shih, L. Cope, A. Pandey, B. Zhang, M. P. Snyder, D. A. Levine, R. D. Smith, D. W. Chan, K. D. Rodland and C. Investigators, Cell, 2016, 166, 755–765 CrossRef CAS PubMed.
- Y. Jiang, A. Sun, Y. Zhao, W. Ying, H. Sun, X. Yang, B. Xing, W. Sun, L. Ren, B. Hu, C. Li, L. Zhang, G. Qin, M. Zhang, N. Chen, M. Zhang, Y. Huang, J. Zhou, Y. Zhao, M. Liu, X. Zhu, Y. Qiu, Y. Sun, C. Huang, M. Yan, M. Wang, W. Liu, F. Tian, H. Xu, J. Zhou, Z. Wu, T. Shi, W. Zhu, J. Qin, L. Xie, J. Fan, X. Qian, F. He and C. Chinese Human Proteome Project, Nature, 2019, 567, 257–261 CrossRef CAS PubMed.
- J. Y. Xu, C. Zhang, X. Wang, L. Zhai, Y. Ma, Y. Mao, K. Qian, C. Sun, Z. Liu, S. Jiang, M. Wang, L. Feng, L. Zhao, P. Liu, B. Wang, X. Zhao, H. Xie, X. Yang, L. Zhao, Y. Chang, J. Jia, X. Wang, Y. Zhang, Y. Wang, Y. Yang, Z. Wu, L. Yang, B. Liu, T. Zhao, S. Ren, A. Sun, Y. Zhao, W. Ying, F. Wang, G. Wang, Y. Zhang, S. Cheng, J. Qin, X. Qian, Y. Wang, J. Li, F. He, T. Xiao and M. Tan, Cell, 2020, 182, 245–261 CrossRef CAS PubMed.
- C. Simon, D. W. Greening, D. Bolumar, N. Balaguer, L. A. Salamonsen and F. Vilella, Endocr. Rev., 2018, 39, 292–332 CrossRef PubMed.
- S. Hiltbrunner, M. Mints, M. Eldh, R. Rosenblatt, B. Holmstrom, F. Alamdari, M. Johansson, R. E. Veerman, O. Winqvist, A. Sherif and S. Gabrielsson, Sci. Rep., 2020, 10, 5960 CrossRef CAS PubMed.
- J. V. Olsen and M. Mann, Mol. Cell. Proteomics, 2013, 12, 3444–3452 CrossRef CAS PubMed.
- Q. Li, M. R. Shortreed, C. D. Wenger, B. L. Frey, L. V. Schaffer, M. Scalf and L. M. Smith, J. Proteome Res., 2017, 16, 1383–1390 CrossRef CAS PubMed.
- X. Zhang, Z. Ning, J. Mayne, Y. Yang, S. A. Deeke, K. Walker, C. L. Farnsworth, M. P. Stokes, J. F. Couture, D. Mack, A. Stintzi and D. Figeys, Nat. Commun., 2020, 11, 4120 CrossRef CAS PubMed.
- L. Ren, C. Li, Y. Wang, Y. Teng, H. Sun, B. Xing, X. Yang, Y. Jiang and F. He, Mol. Cell. Proteomics, 2018, 17, 1067–1083 CrossRef CAS PubMed.
- W. A. Lim and T. Pawson, Cell, 2010, 142, 661–667 CrossRef CAS PubMed.
- N. K. Tonks, Nat. Rev. Mol. Cell Biol., 2006, 7, 833–846 CrossRef CAS PubMed.
- M. Li, Y. Xiong, W. Lu, X. Wang, Y. Liu, B. Na, H. Qin, M. Tang, H. Qin, M. Ye, X. Liang and G. Qing, J. Am. Chem. Soc., 2020, 142, 16324–16333 CrossRef CAS PubMed.
- Y. Bian, L. Li, M. Dong, X. Liu, T. Kaneko, K. Cheng, H. Liu, C. Voss, X. Cao, Y. Wang, D. Litchfield, M. Ye, S. S. C. Li and H. Zou, Nat. Chem. Biol., 2016, 12, 959–966 CrossRef CAS PubMed.
- J. Ding, Y. Yao, G. Huang, X. Wang, J. Yi, N. Zhang, C. Liu, K. Wang, Y. Zhang, M. Wang, P. Liu, M. Ye, M. Li and H. Cheng, Cancer Lett., 2020, 475, 53–64 CrossRef CAS PubMed.
- S. F. Graham, N. L. Rey, A. Yilmaz, P. Kumar, Z. Madaj, M. Maddens, R. O. Bahado-Singh, K. Becker, E. Schulz, L. K. Meyerdirk, J. A. Steiner, J. Ma and P. Brundin, J. Proteome Res., 2018, 17, 2460–2469 CrossRef CAS PubMed.
- G. F. Crotty, R. Maciuca, E. A. Macklin, J. Wang, M. Montalban, S. S. Davis, J. I. Alkabsh, R. Bakshi, X. Chen, A. Ascherio, G. Astarita, S. Huntwork-Rodriguez and M. A. Schwarzschild, Neurology, 2020, 95, e3428–e3437 CrossRef PubMed.
- A. Walch, S. Rauser, S. O. Deininger and H. Hofler, Histochem. Cell Biol., 2008, 130, 421–434 CrossRef CAS PubMed.
- K. Schwamborn and R. M. Caprioli, Nat. Rev. Cancer, 2010, 10, 639–646 CrossRef CAS PubMed.
- R. Ait-Belkacem, L. Sellami, C. Villard, E. DePauw, D. Calligaris and D. Lafitte, Trends Biotechnol., 2012, 30, 466–474 CrossRef CAS PubMed.
- L. A. McDonnell and R. M. A. Heeren, Mass Spectrom. Rev., 2007, 26, 606–643 CrossRef CAS PubMed.
- E. H. Seeley and R. M. Caprioli, Trends Biotechnol., 2011, 29, 136–143 CrossRef CAS PubMed.
- P. Chaurand, S. A. Schwartz, D. Billheimer, B. J. Xu, A. Crecelius and R. M. Caprioli, Anal. Chem., 2004, 76, 1145–1155 CrossRef CAS PubMed.
- P. Rafols, D. Vilalta, J. Brezmes, N. Canellas, E. Del Castillo, O. Yanes, N. Ramirez and X. Correig, Mass Spectrom. Rev., 2018, 37, 281–306 CrossRef CAS PubMed.
- D. S. Peterson, Mass Spectrom. Rev., 2007, 26, 19–34 CrossRef CAS PubMed.
- S. Chen, C. Xiong, H. Liu, Q. Wan, J. Hou, Q. He, A. Badu-Tawiah and Z. Nie, Nat. Nanotechnol., 2015, 10, 176–182 CrossRef CAS PubMed.
- J. Xue, H. Liu, S. Chen, C. Xiong, L. Zhan, J. Sun and Z. Nie, Sci. Adv., 2018, 4, eaat9039 CrossRef CAS PubMed.
- J. Lu, X. Hua and Y. T. Long, Analyst, 2017, 142, 691–699 RSC.
- H. W. Li, X. Hua and Y. T. Long, Anal. Bioanal. Chem., 2019, 411, 4025–4030 CrossRef CAS PubMed.
- H. Tian, L. J. Sparvero, A. A. Amoscato, A. Bloom, H. Bayir, V. E. Kagan and N. Winograd, Anal. Chem., 2017, 89, 4611–4619 CrossRef CAS PubMed.
- J. Malherbe, F. Penen, M. P. Isaure, J. Frank, G. Hause, D. Dobritzsch, E. Gontier, F. Horreard, F. Hillion and D. Schaumloffel, Anal. Chem., 2016, 88, 7130–7136 CrossRef CAS PubMed.
- M. Shariatgorji, A. Nilsson, E. Fridjonsdottir, T. Vallianatou, P. Kallback, L. Katan, J. Savmarker, I. Mantas, X. Zhang, E. Bezard, P. Svenningsson, L. R. Odell and P. E. Andren, Nat. Methods, 2019, 16, 1021–1028 CrossRef CAS PubMed.
- M. Shariatgorji, A. Nilsson, R. J. Goodwin, P. Kallback, N. Schintu, X. Zhang, A. R. Crossman, E. Bezard, P. Svenningsson and P. E. Andren, Neuron, 2014, 84, 697–707 CrossRef CAS PubMed.
- N. Kurabe, T. Hayasaka, M. Ogawa, N. Masaki, Y. Ide, M. Waki, T. Nakamura, K. Kurachi, T. Kahyo, K. Shinmura, Y. Midorikawa, Y. Sugiyama, M. Setou and H. Sugimura, Cancer Sci., 2013, 104, 1295–1302 CrossRef CAS PubMed.
- T. C. van Smaalen, S. R. Ellis, N. E. Mascini, T. P. Siegel, B. Cillero-Pastor, L. M. Hillen, L. W. E. van Heurn, C. J. Peutz-Kootstra and R. M. A. Heeren, Anal. Chem., 2019, 91, 3575–3581 CrossRef CAS PubMed.
- K. Scupakova, B. Balluff, C. Tressler, T. Adelaja, R. M. A. Heeren, K. Glunde and G. Ertaylan, Clin. Chem. Lab. Med., 2020, 58, 914–929 CrossRef CAS PubMed.
- P. Agui-Gonzalez, S. Jahne and N. T. N. Phan, J. Anal. At. Spectrom., 2019, 34, 1355–1368 RSC.
- A. Ly, A. Buck, B. Balluff, N. Sun, K. Gorzolka, A. Feuchtinger, K. P. Janssen, P. J. Kuppen, C. J. van de Velde, G. Weirich, F. Erlmeier, R. Langer, M. Aubele, H. Zitzelsberger, L. McDonnell, M. Aichler and A. Walch, Nat. Protoc., 2016, 11, 1428–1443 CrossRef PubMed.
- C. Sun, F. Wang, Y. Zhang, J. Yu and X. Wang, Theranostics, 2020, 10, 7070–7082 CrossRef CAS PubMed.
- A. Buck, A. Ly, B. Balluff, N. Sun, K. Gorzolka, A. Feuchtinger, K. P. Janssen, P. J. Kuppen, C. J. van de Velde, G. Weirich, F. Erlmeier, R. Langer, M. Aubele, H. Zitzelsberger, M. Aichler and A. Walch, J. Pathol., 2015, 237, 123–132 CrossRef CAS PubMed.
- S. K. Gularyan, A. A. Gulin, K. S. Anufrieva, V. O. Shender, M. I. Shakhparonov, S. Bastola, N. V. Antipova, T. F. Kovalenko, Y. P. Rubtsov, Y. A. Latyshev, A. A. Potapov and M. S. Pavlyukov, Mol. Cell. Proteomics, 2020, 19, 960–970 CrossRef PubMed.
- B. Balluff, M. Elsner, A. Kowarsch, S. Rauser, S. Meding, C. Schuhmacher, M. Feith, K. Herrmann, C. Rocken, R. M. Schmid, H. Hofler, A. Walch and M. P. Ebert, J. Proteome Res., 2010, 9, 6317–6322 CrossRef CAS PubMed.
- R. M. Caprioli, T. B. Farmer and J. Gile, Anal. Chem., 1997, 69, 4751–4760 CrossRef CAS PubMed.
- J. L. Norris and R. M. Caprioli, Chem. Rev., 2013, 113, 2309–2342 CrossRef CAS PubMed.
- V. V. Laiko, M. A. Baldwin and A. L. Burlingame, Anal. Chem., 2000, 72, 652–657 CrossRef CAS PubMed.
- M. Kompauer, S. Heiles and B. Spengler, Nat. Methods, 2017, 14, 90–96 CrossRef CAS PubMed.
- M. Kompauer, S. Heiles and B. Spengler, Nat. Methods, 2017, 14, 1156–1158 CrossRef CAS PubMed.
- J. Matsuo, S. Torii, K. Yamauchi, K. Wakamoto, M. Kusakari, S. Nakagawa, M. Fujii, T. Aoki and T. Seki, Appl. Phys. Express, 2014, 7, 056602 CrossRef CAS.
- T. B. Angerer, M. Dowlatshahi Pour, P. Malmberg and J. S. Fletcher, Anal. Chem., 2015, 87, 4305–4313 CrossRef CAS PubMed.
- M. K. Passarelli, A. Pirkl, R. Moellers, D. Grinfeld, F. Kollmer, R. Havelund, C. F. Newman, P. S. Marshall, H. Arlinghaus, M. R. Alexander, A. West, S. Horning, E. Niehuis, A. Makarov, C. T. Dollery and I. S. Gilmore, Nat. Methods, 2017, 14, 1175–1183 CrossRef CAS PubMed.
- H. Tian, L. J. Sparvero, P. Blenkinsopp, A. A. Amoscato, S. C. Watkins, H. Bayir, V. E. Kagan and N. Winograd, Angew. Chem., Int. Ed., 2019, 58, 3156–3161 CrossRef CAS PubMed.
- E. Claude, E. A. Jones and S. D. Pringle, Methods Mol. Biol., 2017, 1618, 65–75 CrossRef CAS PubMed.
- J. M. Wiseman, D. R. Ifa, Q. Song and R. G. Cooks, Angew. Chem., Int. Ed., 2006, 45, 7188–7192 CrossRef CAS PubMed.
- J. M. Wiseman, D. R. Ifa, Y. Zhu, C. B. Kissinger, N. E. Manicke, P. T. Kissinger and R. G. Cooks, Proc. Natl. Acad. Sci. U. S. A., 2008, 105, 18120–18125 CrossRef PubMed.
- P. Nemes and A. Vertes, Anal. Chem., 2007, 79, 8098–8106 CrossRef CAS PubMed.
- F. van Geenen, F. W. Claassen, M. C. R. Franssen, H. Zuilhof and M. W. F. Nielen, J. Am. Soc. Mass Spectrom., 2020, 31, 249–256 CrossRef CAS PubMed.
- B. Paul, D. J. Hare, D. P. Bishop, C. Paton, V. T. Nguyen, N. Cole, M. M. Niedwiecki, E. Andreozzi, A. Vais, J. L. Billings, L. Bray, A. I. Bush, G. McColl, B. R. Roberts, P. A. Adlard, D. I. Finkelstein, J. Hellstrom, J. M. Hergt, J. D. Woodhead and P. A. Doble, Chem. Sci., 2016, 7, 6576 RSC.
- J. S. Becker, M. Zoriy, A. Matusch, B. Wu, D. Salber, C. Palm and J. S. Becker, Mass Spectrom. Rev., 2010, 29, 156–175 CrossRef CAS PubMed.
- T. R. Northen, O. Yanes, M. T. Northen, D. Marrinucci, W. Uritboonthai, J. Apon, S. L. Golledge, A. Nordstrom and G. Siuzdak, Nature, 2007, 449, 1033–1036 CrossRef CAS PubMed.
- M. P. Greving, G. J. Patti and G. Siuzdak, Anal. Chem., 2011, 83, 2–7 CrossRef CAS PubMed.
- Z. Luo, J. He, Y. Chen, J. He, T. Gong, F. Tang, X. Wang, R. Zhang, L. Huang, L. Zhang, H. Lv, S. Ma, Z. Fu, X. Chen, S. Yu and Z. Abliz, Anal. Chem., 2013, 85, 2977–2982 CrossRef CAS PubMed.
- F. Tang, Y. Bi, J. He, T. Li, Z. Abliz and X. Wang, Rapid Commun. Mass Spectrom., 2015, 29, 1178–1184 CrossRef CAS PubMed.
- J. G. Swales, J. W. Tucker, M. J. Spreadborough, S. L. Iverson, M. R. Clench, P. J. Webborn and R. J. Goodwin, Anal. Chem., 2015, 87, 10146–10152 CrossRef CAS PubMed.
- J. Sarsby, N. J. Martin, P. F. Lalor, J. Bunch and H. J. Cooper, J. Am. Soc. Mass Spectrom., 2014, 25, 1953–1961 CrossRef CAS PubMed.
- Z. Hall, Y. Chu and J. L. Griffin, Anal. Chem., 2017, 89, 5161–5170 CrossRef CAS PubMed.
- M. Sans, C. L. Feider and L. S. Eberlin, Curr. Opin. Chem. Biol., 2018, 42, 138–146 CrossRef CAS PubMed.
- T. Fu, J. Oetjen, M. Chapelle, A. Verdu, M. Szesny, A. Chaumot, D. Degli-Esposti, O. Geffard, Y. Clement, A. Salvador and S. Ayciriex, J. Mass Spectrom., 2020, 55, e4531 CrossRef CAS PubMed.
- J. A. McLean, W. B. Ridenour and R. M. Caprioli, J. Mass Spectrom., 2007, 42, 1099–1105 CrossRef CAS PubMed.
- S. Lou, B. Balluff, M. A. de Graaff, A. H. Cleven, I. Briaire-de Bruijn, J. V. Bovee and L. A. McDonnell, Proteomics, 2016, 16, 1802–1813 CrossRef CAS PubMed.
- W. M. Hardesty, M. C. Kelley, D. Mi, R. L. Low and R. M. Caprioli, J. Proteomics, 2011, 74, 1002–1014 CrossRef CAS PubMed.
- B. Balluff, C. K. Frese, S. K. Maier, C. Schone, B. Kuster, M. Schmitt, M. Aubele, H. Hofler, A. M. Deelder, A. Heck Jr, P. C. Hogendoorn, J. Morreau, A. F. Maarten Altelaar, A. Walch and L. A. McDonnell, J. Pathol., 2015, 235, 3–13 CrossRef CAS PubMed.
- D. J. Ryan, J. M. Spraggins and R. M. Caprioli, Curr. Opin. Chem. Biol., 2019, 48, 64–72 CrossRef CAS PubMed.
- E. Le Rhun, M. Duhamel, M. Wisztorski, J. P. Gimeno, F. Zairi, F. Escande, N. Reyns, F. Kobeissy, C. A. Maurage, M. Salzet and I. Fournier, Biochim. Biophys. Acta, Proteins Proteomics, 2017, 1865, 875–890 CrossRef CAS PubMed.
- L. Phillips, A. J. Gill and R. C. Baxter, Front. Oncol., 2019, 9, 379 CrossRef PubMed.
- F. J. Hartmann and S. C. Bendall, Nat. Rev. Rheumatol., 2020, 16, 87–99 CrossRef PubMed.
- H. R. Ali, H. W. Jackson, V. R. T. Zanotelli, E. Danenberg, J. R. Fischer, H. Bardwell, E. Provenzano, H. R. Ali, M. Al Sa'd, S. Alon, S. Aparicio, G. Battistoni, S. Balasubramanian, R. Becker, B. Bodenmiller, E. S. Boyden, D. Bressan, A. Bruna, B. Marcel, C. Caldas, M. Callari, I. G. Cannell, H. Casbolt, N. Chornay, Y. Cui, A. Dariush, K. Dinh, A. Emenari, Y. Eyal-Lubling, J. Fan, E. Fisher, E. A. González-Solares, C. González-Fernández, D. Goodwin, W. Greenwood, F. Grimaldi, G. J. Hannon, O. Harris, S. Harris, C. Jauset, J. A. Joyce, E. D. Karagiannis, T. Kovačević, L. Kuett, R. Kunes, A. Küpcü Yoldaş, D. Lai, E. Laks, H. Lee, M. Lee, G. Lerda, Y. Li, A. McPherson, N. Millar, C. M. Mulvey, F. Nugent, C. H. O'Flanagan, M. Paez-Ribes, I. Pearsall, F. Qosaj, A. J. Roth, O. M. Rueda, T. Ruiz, K. Sawicka, L. A. Sepúlveda, S. P. Shah, A. Shea, A. Sinha, A. Smith, S. Tavaré, S. Tietscher, I. Vázquez-García, S. L. Vogl, N. A. Walton, A. T. Wassie, S. S. Watson, S. A. Wild, E. Williams, J. Windhager, C. Xia, P. Zheng, X. Zhuang, O. M. Rueda, S.-F. Chin, S. Aparicio, C. Caldas, B. Bodenmiller and C. I. G. C. Team, Nature Cancer, 2020, 1, 163–175 CrossRef.
- M. Angelo, S. C. Bendall, R. Finck, M. B. Hale, C. Hitzman, A. D. Borowsky, R. M. Levenson, J. B. Lowe, S. D. Liu, S. Zhao, Y. Natkunam and G. P. Nolan, Nat. Med., 2014, 20, 436–442 CrossRef CAS PubMed.
- L. Liu, Y. Q. Kuang, Z. C. Wang and Y. Chen, Chem. Sci., 2020, 11, 11298–11306 RSC.
- W. Zhou, F. Xu, D. Li and Y. Chen, Clin. Chem., 2018, 64, 526–535 CrossRef CAS PubMed.
- J. Han, X. Huang, H. Liu, J. Wang, C. Xiong and Z. Nie, Chem. Sci., 2019, 10, 10958–10962 RSC.
- P. M. Vaysse, R. M. A. Heeren, T. Porta and B. Balluff, Analyst, 2017, 142, 2690–2712 RSC.
- Y. Hasin, M. Seldin and A. Lusis, Genome Biol., 2017, 18, 83 CrossRef PubMed.
- Y. Song, T. Tian, Y. Shi, W. Liu, Y. Zou, T. Khajvand, S. Wang, Z. Zhu and C. Yang, Chem. Sci., 2017, 8, 1736–1751 RSC.
- V. Marx, Nat. Methods, 2013, 10, 19–22 CrossRef CAS PubMed.
- K. L. Lynch, Clin. Chem., 2016, 62, 24–29 CrossRef CAS PubMed.
- U. Kusebauch, D. S. Campbell, E. W. Deutsch, C. S. Chu, D. A. Spicer, M. Y. Brusniak, J. Slagel, Z. Sun, J. Stevens, B. Grimes, D. Shteynberg, M. R. Hoopmann, P. Blattmann, A. V. Ratushny, O. Rinner, P. Picotti, C. Carapito, C. Y. Huang, M. Kapousouz, H. Lam, T. Tran, E. Demir, J. D. Aitchison, C. Sander, L. Hood, R. Aebersold and R. L. Moritz, Cell, 2016, 166, 766–778 CrossRef CAS PubMed.
- Y. Chen and L. Liu, Methods Mol. Biol., 2019, 1871, 265 CrossRef CAS PubMed.
- W. Jiang, L. Liu and Y. Chen, Anal. Chem., 2018, 90, 3058–3066 CrossRef CAS PubMed.
- Y. Yu, J. Xu, Y. Liu and Y. Chen, J. Chromatogr. B: Anal. Technol. Biomed. Life Sci., 2012, 902, 10–15 CrossRef CAS PubMed.
- T. Zhang, W. Zhang, L. Liu and Y. Chen, Analyst, 2020, 145, 1376–1383 RSC.
- A. N. Hoofnagle, J. O. Becker, M. H. Wener and J. W. Heinecke, Clin. Chem., 2008, 54, 1796–1804 CrossRef CAS PubMed.
- H. Zhang, W. Yan and R. Aebersold, Curr. Opin. Chem. Biol., 2004, 8, 66–75 CrossRef CAS PubMed.
- C. C. Wu and J. R. Yates 3rd, Nat. Biotechnol., 2003, 21, 262–267 CrossRef CAS PubMed.
- T. Adachi and Y. Nakamura, Molecules, 2019, 24, 4229 CrossRef CAS PubMed.
- R. Du, L. Zhu, J. Gan, Y. Wang, L. Qiao and B. Liu, Anal. Chem., 2016, 88, 6767–6772 CrossRef CAS PubMed.
- L. Liu, Y. Kuang, H. Yang and Y. Chen, Anal. Chim. Acta, 2019, 1069, 73–81 CrossRef CAS PubMed.
- R. Matthiesen and F. Kirpekar, Nucleic Acids Res., 2009, 37, e48 CrossRef PubMed.
- J. A. Ellis and B. Ong, Methods Mol. Biol., 2017, 1492, 77–94 CrossRef CAS PubMed.
- T. C. de Bang and S. Husted, TrAC, Trends Anal. Chem., 2015, 72, 45–52 CrossRef CAS.
- F. Xu, T. Yang and Y. Chen, Anal. Chem., 2016, 88, 754–763 CrossRef CAS PubMed.
- F. Xu, W. Zhou, J. Cao, Q. Xu, D. Jiang and Y. Chen, Theranostics, 2017, 7, 2849–2862 CrossRef CAS PubMed.
- V. A. Fusaro, D. R. Mani, J. P. Mesirov and S. A. Carr, Nat. Biotechnol., 2009, 27, 190–198 CrossRef CAS PubMed.
- A. N. Hoofnagle and M. Y. Roth, J. Clin. Endocrinol. Metab., 2013, 98, 1343–1352 CrossRef CAS PubMed.
- D. J. Dietzen, P. Rinaldo, R. J. Whitley, W. J. Rhead, W. H. Hannon, U. C. Garg, S. F. Lo and M. J. Bennett, Clin. Chem., 2009, 55, 1615–1626 CrossRef CAS PubMed.
- J. L. Taylor, K. Clinard, C. M. Powell, C. Rehder, S. P. Young, D. Bali, S. E. Beckloff, L. M. Gehtland, A. R. Kemper, S. Lee, D. Millington, H. S. Patel, S. M. Shone, C. Woodell, S. J. Zimmerman, D. B. Bailey Jr and J. Muenzer, J. Pediatr., 2019, 211, 193–200 CrossRef PubMed.
- C. R. Scott, S. Elliott, X. Hong, J. Y. Huang, A. B. Kumar, F. Yi, N. Pendem, N. K. Chennamaneni and M. H. Gelb, J. Pediatr., 2020, 216, 204–207 CrossRef CAS PubMed.
- L. Couchman and C. F. Moniz, Ther. Adv. Musculoskeletal Dis., 2017, 9, 97–104 CrossRef CAS PubMed.
- J. E. Nelson, C. L. Roth, L. A. Wilson, K. P. Yates, B. Aouizerat, V. Morgan-Stevenson, E. Whalen, A. Hoofnagle, M. Mason, V. Gersuk, M. M. Yeh and K. V. Kowdley, Am. J. Gastroenterol., 2016, 111, 852–863 CrossRef CAS PubMed.
- Y. Shen, L. Pu, S. Si, X. Xin, M. Mo, B. Shao, J. Wu, M. Huang, S. Wang, X. Muyiduli, Z. Chen, W. Jiang and Y. Yu, Clin. Nutr., 2020, 39, 1432–1439 CrossRef CAS.
- S. Christakos, P. Dhawan, A. Verstuyf, L. Verlinden and G. Carmeliet, Physiol. Rev., 2016, 96, 365–408 CrossRef CAS PubMed.
- G. Jones and M. Kaufmann, J. Steroid Biochem. Mol. Biol., 2016, 164, 110–114 CrossRef CAS PubMed.
- P. Nuciforo, S. Thyparambil, C. Aura, A. Garrido-Castro, M. Vilaro, V. Peg, J. Jimenez, R. Vicario, F. Cecchi, W. Hoos, J. Burrows, T. Hembrough, J. C. Ferreres, J. Perez-Garcia, J. Arribas, J. Cortes and M. Scaltriti, Mol. Oncol., 2016, 10, 138–147 CrossRef CAS PubMed.
- P. Bouchal, O. T. Schubert, J. Faktor, L. Capkova, H. Imrichova, K. Zoufalova, V. Paralova, R. Hrstka, Y. Liu, H. A. Ebhardt, E. Budinska, R. Nenutil and R. Aebersold, Cell Rep., 2019, 28, 832–843 CrossRef CAS PubMed.
- L. Guo, Q. Wang, L. Weng, L. A. Hauser, C. J. Strawser, A. G. Rocha, A. Dancis, C. Mesaros, D. R. Lynch and I. A. Blair, Anal. Chem., 2018, 90, 2216–2223 CrossRef CAS PubMed.
- T. McAvoy, M. E. Lassman, D. S. Spellman, Z. Ke, B. J. Howell, O. Wong, L. Zhu, M. Tanen, A. Struyk and O. F. Laterza, Clin. Chem., 2014, 60, 683–689 CrossRef CAS PubMed.
- A. Nakamura, N. Kaneko, V. L. Villemagne, T. Kato, J. Doecke, V. Dore, C. Fowler, Q. X. Li, R. Martins, C. Rowe, T. Tomita, K. Matsuzaki, K. Ishii, K. Ishii, Y. Arahata, S. Iwamoto, K. Ito, K. Tanaka, C. L. Masters and K. Yanagisawa, Nature, 2018, 554, 249–254 CrossRef CAS PubMed.
- D. Li, F. Huang, Y. Zhao, P. W. Villata, T. J. Griffin, L. Zhang, L. Li and F. Yu, Clin. Proteomics, 2018, 15, 31 CrossRef PubMed.
- B. Sun, F. Xu, Y. Zhang, Y. Hu and Y. Chen, Anal. Chem., 2020, 92, 8340–8349 CrossRef CAS PubMed.
- Y. Zhu, L. Qiao, M. Prudent, A. Bondarenko, N. Gasilova, S. B. Moller, N. Lion, H. Pick, T. Gong, Z. Chen, P. Yang, L. T. Lovey and H. H. Girault, Chem. Sci., 2016, 7, 2987–2995 RSC.
- A. Croxatto, G. Prod'hom and G. Greub, FEMS Microbiol. Rev., 2012, 36, 380–407 CrossRef CAS PubMed.
- M. Welker, A. Van Belkum, V. Girard, J. P. Charrier and D. Pincus, Expert Rev. Proteomics, 2019, 16, 695–710 CrossRef CAS PubMed.
- B. Wen and M. Zhu, Drug Metab. Rev., 2015, 47, 71–87 CrossRef CAS PubMed.
Footnote |
| † These authors contributed equally to this work. |
| This journal is © The Royal Society of Chemistry 2021 |