
 Open Access Article
 This Open Access Article is licensed under a Creative Commons Attribution-Non Commercial 3.0 Unported Licence
Single cell imaging reveals cisplatin regulating interactions between transcription (co)factors and DNA†
Yu
Lin‡
 a,
Kui
Wu‡
b,
Feifei
Jia‡
a,
Ling
Chen
a,
Zhaoying
Wang
a,
Yanyan
Zhang
a,
Qun
Luo
ac,
Suyan
Liu
a,
Luyu
Qi
ac,
Nan
Li
cd,
Pu
Dong
e,
Fei
Gao
e,
Wei
Zheng
a,
Xiaohong
Fang
*cd,
Yao
Zhao
*a and
Fuyi
Wang
*acf
a,
Kui
Wu‡
b,
Feifei
Jia‡
a,
Ling
Chen
a,
Zhaoying
Wang
a,
Yanyan
Zhang
a,
Qun
Luo
ac,
Suyan
Liu
a,
Luyu
Qi
ac,
Nan
Li
cd,
Pu
Dong
e,
Fei
Gao
e,
Wei
Zheng
a,
Xiaohong
Fang
*cd,
Yao
Zhao
*a and
Fuyi
Wang
*acf
aBeijing National Laboratory for Molecular Sciences, CAS Research/Education Center for Excellence in Molecular Sciences, National Centre for Mass Spectrometry in Beijing, CAS Key Laboratory of Analytical Chemistry for Living Biosystems, Institute of Chemistry, Chinese Academy of Sciences, Beijing, 100190, People's Republic of China. E-mail: fuyi.wang@iccas.ac.cn; yaozhao@iccas.ac.cn
bKey Laboratory of Hubei Province for Coal Conversion and New Carbon Materials, School of Chemistry and Chemical Engineering, Wuhan University of Science and Technology, Wuhan, 430081, People's Republic of China
cUniversity of Chinese Academy of Sciences, Beijing, 100049, People's Republic of China
dBeijing National Laboratory for Molecular Sciences, CAS Research/Education Center for Excellence in Molecular Sciences, Key Laboratory of Molecular Nanostructures and Nanotechnology, Institute of Chemistry, Chinese Academy of Sciences, Beijing, 100190, P. R. China. E-mail: xfang@iccas.ac.cn
eChina Telecom Corporation Limited Beijing Research Institute, Beijing, 100035, People's Republic of China
fCollege of Traditional Chinese Medicine, Shandong University of Traditional Chinese Medicine, Jinan, 250355, People's Republic of China
First published on 25th February 2021
Abstract
Cisplatin is an extremely successful anticancer drug, and is commonly thought to target DNA. However, the way in which cisplatin-induced DNA lesions regulate interactions between transcription factors/cofactors and genomic DNA remains unclear. Herein, we developed a dual-modal microscopy imaging strategy to investigate, in situ, the formation of ternary binding complexes of the transcription cofactor HMGB1 and transcription factor Smad3 with cisplatin crosslinked DNA in single cells. We utilized confocal microscopy imaging to map EYFP-fused HMGB1 and fluorescent dye-stained DNA in single cells, followed by the visualization of cisplatin using high spatial resolution (200–350 nm) time of flight secondary ion mass spectrometry (ToF-SIMS) imaging of the same cells. The superposition of the fluorescence and the mass spectrometry (MS) signals indicate the formation of HMGB1-Pt-DNA ternary complexes in the cells. More significantly, for the first time, similar integrated imaging revealed that the cisplatin lesions at Smad-binding elements, for example GGC(GC)/(CG) and AGAC, disrupted the interactions of Smad3 with DNA, which was evidenced by the remarkable reduction in the expression of Smad-specific luciferase reporters subjected to cisplatin treatment. This finding suggests that Smad3 and its related signalling pathway are most likely involved in the intracellular response to cisplatin induced DNA damage.
Introduction
DNA damage is a significant concern in research on gene mutations and the mechanisms of molecular action of DNA targeting anticancer drugs such as cisplatin and doxorubicin. Cisplatin, a very successful anticancer drug used in the clinic, has been extensively explored for its mechanism of action. Although the interactions with proteins and other sulfur-containing cellular components have been implicated, to some extent, in the action of cisplatin,1 and mitochondrial DNA is also a potential target,2 it is widely accepted that cisplatin exerts its anticancer activity by binding to nuclear DNA.3 This drug mainly forms 1,2-intrastrand crosslinked adducts on the -GpG- (∼65%) or -ApG- (∼25%) sites of DNA and thus induces a series of variations on the conformation of DNA, such as bending and unwinding of the DNA duplex.4–6 It is worth mentioning that cisplatin can also cause interstrand crosslinking (5–10%), which is highly toxic7 and can only be repaired by the replication-dependent Fanconi anaemia pathway.8 Alterations in the conformation of DNA drastically influence the replication, transcription and reparation of the genome through diverse cellular signal transduction pathways.A variety of proteins, for example nucleotide excision repair (NER) proteins, mismatch repair (MMR) proteins and HMG-domain proteins, have been demonstrated to directly or indirectly interact with cisplatin damaged DNA.3,4 Among these, high mobility group box 1 (HMGB1), a highly conserved and abundant DNA binding protein9 and also a negative transcription cofactor,10 has been reported to selectively bind to 1,2-intrastrand cisplatin-crosslinked DNA.11 Thereafter, the recognition and interaction mechanisms between HMGB1 and cisplatin-damaged DNA, as well as their biological implications, have been studied intensively.3,4 However, these studies have mostly been performed in cell-free media, including recombinant chromosomes. Furthermore, the previous studies mainly focused on the functional proteins that recognize and interact with cisplatin damaged DNA, such as DNA polymerase, RNA polymerase and NER related proteins, but the role that transcription factors play in responding to cisplatin crosslinked DNA has received little attention to date.3,4 Using mass spectrometry analysis and confocal fluorescence microscopy imaging, Liu and co-workers demonstrated that a trans-platinum thiazole complex disrupted the interaction of the human transcription factor Sp1 with DNA by directly binding to the zinc-finger protein.12 However, whether and how the transcription factors would be affected by cisplatin remains an open question.
Smads family proteins are intracellular signal transducers that specifically activate or inhibit the transcription of target genes.13,14 On the basis of their structure and function they can be classified into three subfamilies, receptor-regulated proteins (R-Smads), common mediators (Co-Smad), and inhibitory proteins (I-Smads). As transcription factors, Smads are activated via phosphorylation by TGF-receptors, and form heteromeric complexes that bind to DNA via several DNA motifs, namely the Smad-binding elements (SBEs), for example, GGC(GC)/(CG) and AGAC motifs for Smad3 or the Smad3-Smad4 complex.13,14 As the 1,2-cisplatin crosslinking mostly occurs at the -GG- and -AG- sites of DNA, the authors were inspired to explore whether the cisplatin damage on DNA blocks the Smad complex binding to DNA at the SBEs, which also deserve investigation using in situ methods.
In situ visualization of the recognition and interaction between the proteins and DNA at single cell level is a significant challenge. The strategies currently used to investigate the interactions of proteins with DNA are mostly based on electrophoresis, for example the Comet assay, DNA footprinting, the electrophoretic mobility shift assay (EMSA), and so forth. Other strategies such as methylation interference and chromatin immunoprecipitation can also provide insights into the protein-DNA interactions and functional organization of the genome at almost base-pair resolution.15 However, these methods are generally applied for genomic DNA and the proteins extracted from cells. Given the complex cellular micro-environment around cisplatin damaged DNA, the studies conducted in cell-free media may not fully represent the recognition and interaction between the proteins and cisplatin-crosslinked DNA inside cells. To address this issue, we aimed to develop a novel dual-modal imaging strategy by combining confocal laser scanning microscopy (CLSM) and time of flight secondary ion mass spectrometry (ToF-SIMS) imaging, which we termed correlated optical and secondary ion mass spectrometric imaging (COSIMSi), to investigate the recognition and interactions of specific proteins in situ, in particular the transcription cofactor HMGB1 and transcription factor Smad3, with cisplatin damaged DNA in single cells.
SIMS, including NanoSIMS and ToF-SIMS, is a powerful surface analysis technique used in the field of elemental, isotopic, and molecular analysis. In recent years, the application of SIMS has been extended from the analysis of solid material samples such as semiconductors and planetary dust to biological samples, for example botanical, paleontological, microbiological and biomedical samples.16–18 However, direct in situ imaging of biological macromolecules, such as proteins and DNA in single cells is still a great challenge owing to weak, or even absent, signals for the corresponding molecular ions and/or informative fragment ions.19–21 To image proteins of interest and DNA in cells using SIMS, stable isotopic labelling of proteins and DNA has been proven to be an effective strategy.22,23 Genetically encoded proteins modified by chemical tags via bio-orthogonal/click reactions have also been reported to facilitate the single cell imaging of proteins using SIMS.24,25 Alternatively, CLSM and stimulated emission depletion (STED) nanoscopy imaging, in combination with immunofluorescence26 or fluorescence in situ hybridization (FISH) labelling,27 have been utilized to localize organelles. This is followed by imaging of the chemicals using SIMS, so as to determine the subcellular distribution of the target molecules, including small molecules and isotopic labelled biomacromolecules, and, more importantly, to build a connection between the two different indicators at a single cell level.22–27
In this work, proteins fused with a yellow/green fluorescence protein (YFP/GFP) and DAPI stained nuclear DNA were imaged using CLSM, and cisplatin was imaged using ToF-SIMS in single cells, successively, as depicted in Scheme 1. As the spatial resolution of the two imaging models is well matched (200–350 nm for both SIMS and CLSM), we can precisely align and merge the images from SIMS and CLSM imaging with the aid of a homemade addressable silicon wafer28 to determine if any protein-Pt-DNA ternary complexes are produced inside the cells. For the first time, the COSIMSi allowed us to observe the formation of the HMGB1-Pt-DNA ternary complex at the single cell level. More importantly, by applying the COSIMSi method, it was found that cisplatin damage on DNA prevented the transcription factor Smad3 from interacting with DNA, which could contribute to the anticancer activity of cisplatin via a disturbance of the TGF-β signalling. These studies demonstrated that the integration of ToF-SIMS imaging for metallodrugs and CLSM imaging for their biological targets provides valuable in situ information for a better understanding of the mechanism of action of drugs at the single cell level.
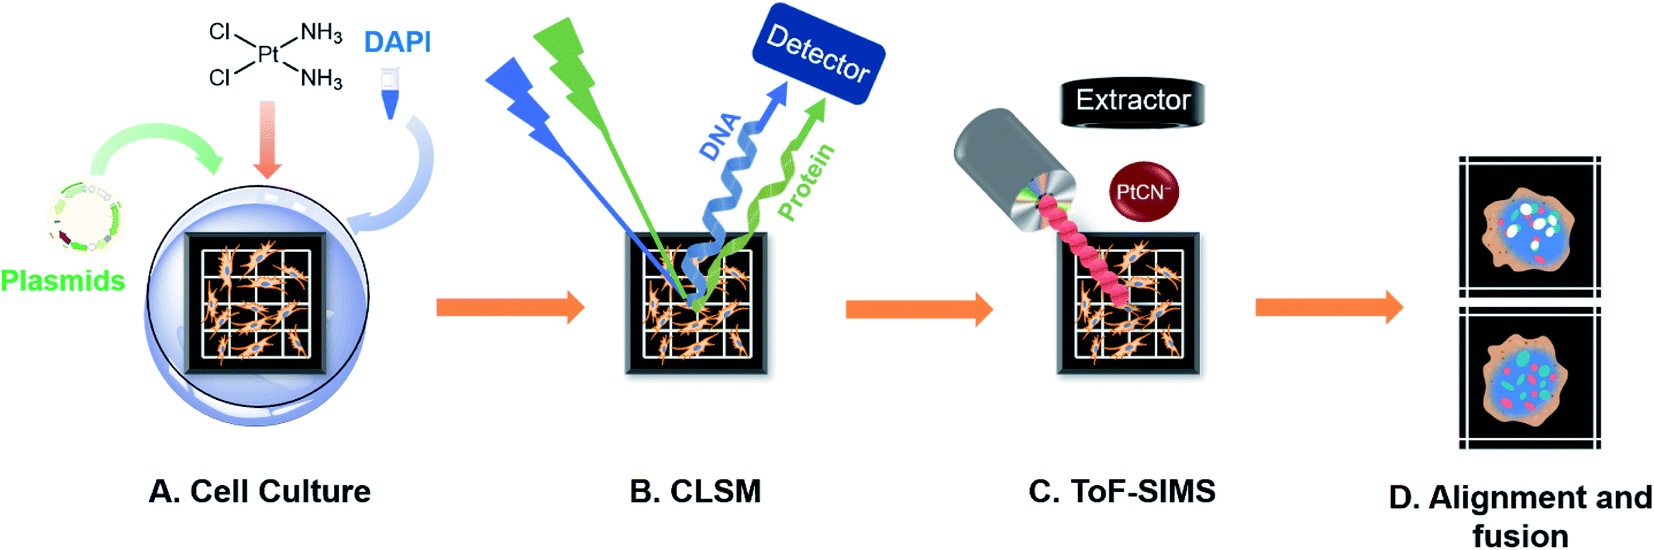 | ||
| Scheme 1 Workflow diagram for the correlated optical and secondary ion mass spectrometric imaging. (A) Cells were seeded on a homemade addressable silicon wafer in the bottom of a culturing dish and incubated overnight to allow cell attachment. The cells were transfected with the corresponding plasmids of the fluorescence protein fused HMGB1 or Smad3 for 24 h and then exposed to various concentrations of cisplatin, followed by staining of the nuclear DNA using DAPI. (B) The lyophilized cells on the silicon wafer were imaged using CLSM. (C) Using the addressable silicon wafer, the same cells were selected and imaged using ToF-SIMS to obtain an image of the cisplatin. (D) The alignment and fusion of the optical images and SIMS images. This drawing is not to scale. | ||
Results and discussion
Development of the COSIMSi method
Firstly, the ToF-SIMS method was optimized to visualize cisplatin in human cervical cancer (HeLa) cells (Fig. S1–S3 in the ESI†). Before performing the ToF-SIMS imaging, an argon gas cluster ion beam (GCIB) was employed to sputter the surface of the lyophilized cells in order to remove any potential contaminants, as well as membrane components. Subsequent analytical scans using the Bi3+ ion beam (BIB) were performed to acquire images of the ions of interest inside the cells. Typically, 5–15 cycles of GCIB sputtering scans were performed until the signal of PO3− by BIB, which arises from endogenous biomolecules such as phospholipids, phosphoproteins, and RNA/DNA, could clearly profile the morphology of the nuclei (Fig. 1F–G). It is notable that 5–15 cycles of GCIB sputtering significantly reduced the size of the lyophilized cells (Fig. S1 and S2, ESI†). In contrast, the analytical scans performed using BIB, even up to 1000 times, did not result in significant changes in the morphology of the lyophilized cells (Fig. S3, ESI†). The HeLa cells treated with 50 μM cisplatin were scanned using the high mass resolution mass spectrometry mode following 10 cycles of GCIB sputtering, the mass spectrum (Fig. S4, ESI†) shows that cisplatin was detected as a recombinant fragment ion, [PtCN]−, which appears to be the characteristic fragment that arises from the platinum complexes during ToF-SIMS analysis.29 The presence of three major isotopes, 194Pt, 195Pt and 196Pt, of platinum conferred the ion peak of [PtCN]− with a distinguishable isotopic pattern (Fig. S4, ESI†), which facilitates the recognition of the MS signal of the Pt-containing ions, and allows precise localization of cisplatin inside the cells using ToF-SIMS imaging via the characterized isotopic ions at m/z 220, 221 and 222 (Fig. 1H). It should be noted that for single cell imaging, platinum-containing species generally produce recombinant ions [PtCN]− and [PtC2N2]−, in negative ToF-SIMS analysis.29–31 Herein, only [PtCN]− was used to image the platinum-containing species throughout this work as it displayed the characteristic isotopic pattern and good signal-to-noise ratio, and its signal intensity was closely related to the concentration of cisplatin in cells (vide infra). It is worthy to point out that the ToF-SIMS image did not show the localization of cisplatin in the cytoplasm region32 as GCIB sputtering may have removed most of cytoplasm layer prior to SIMS imaging (Fig. S1–S3, ESI†). Given the interactions of cisplatin-damaged DNA with proteins takes place in the nuclear areas, the removal of the cell membrane and the top cytoplasm layer using GCIB sputtering does not influence the ToF-SIMS imaging of the nuclei, as evidenced by the full and clear outline of the nucleus obtained using the CNO−, PO3− and [PtCN]− ions (Fig. 1F–H).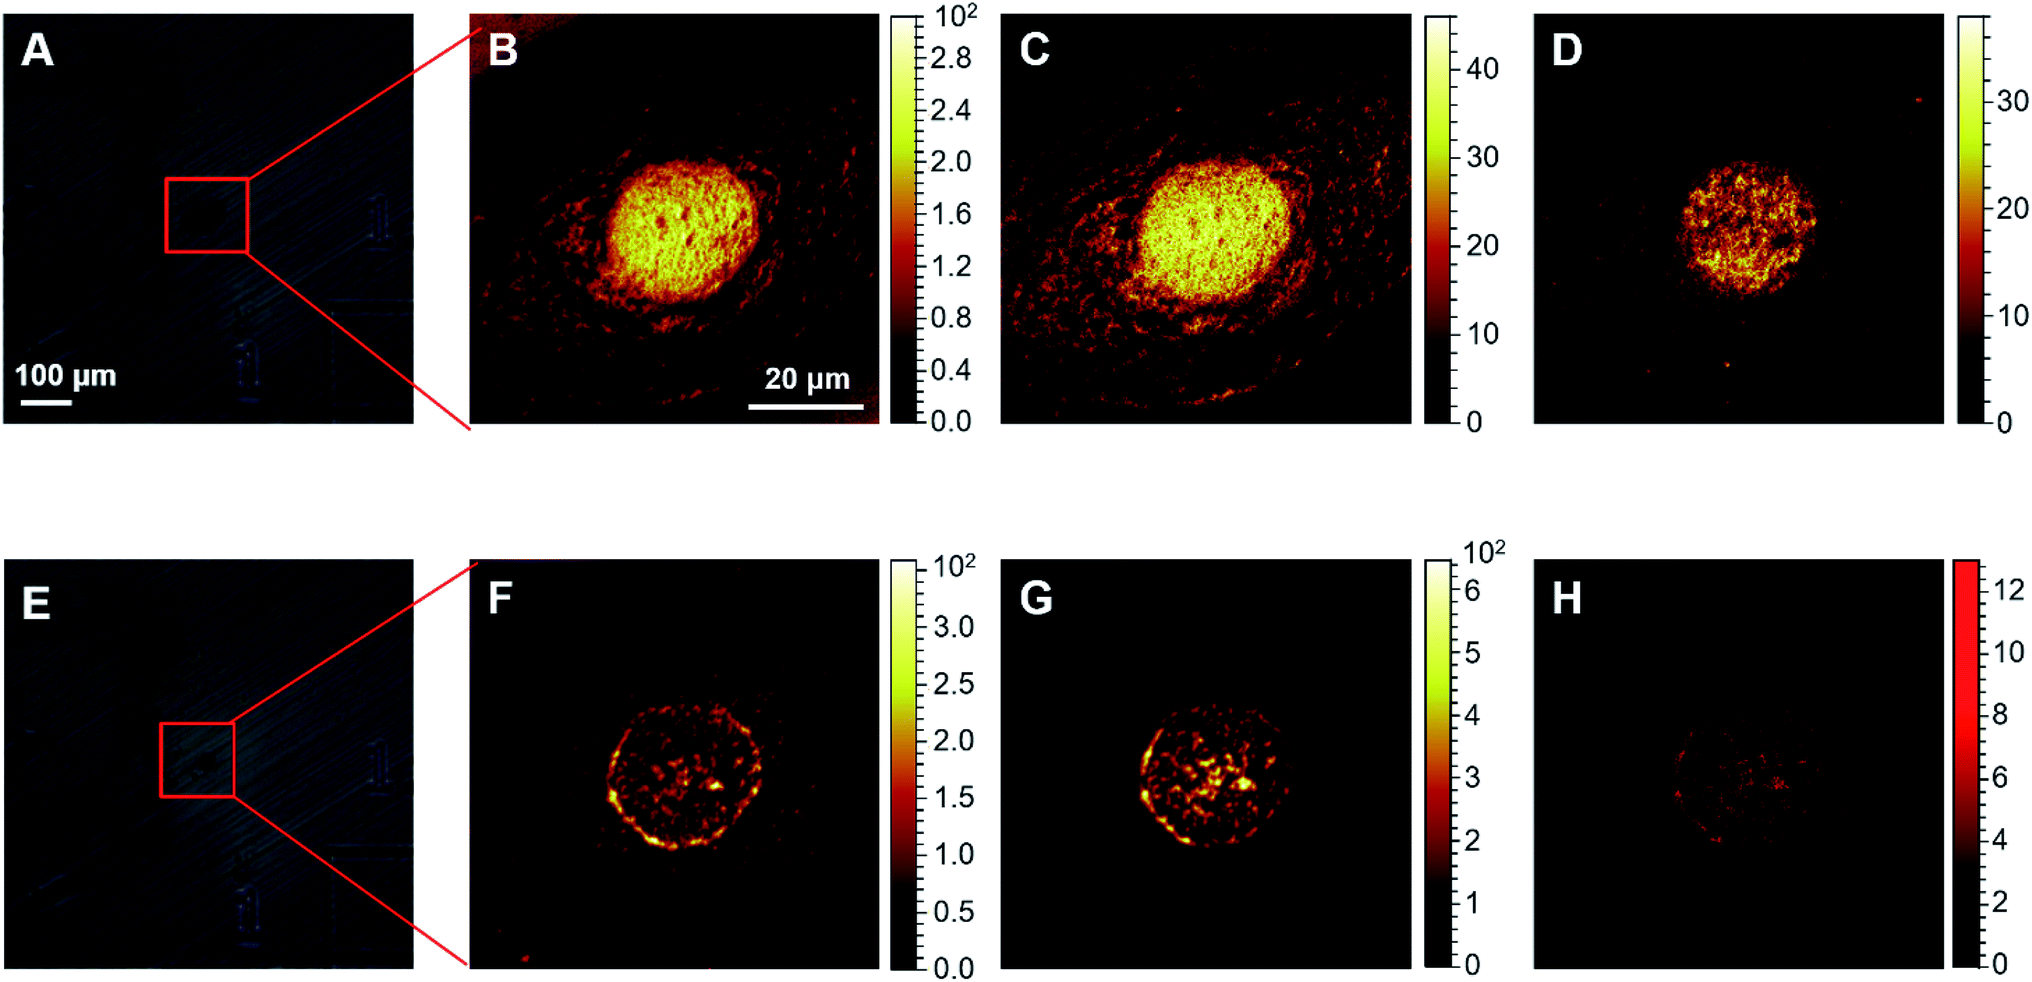 | ||
| Fig. 1 ToF-SIMS images of the HeLa cells. (A) and (E) optical views of a single cell: (A) before; and (E) after 10 cycles of GCIB sputtering. (B)–(D) ToF-SIMS images of: (B) total ions; (C) CNO−; and (D) PO3− of the intact cell shown in (A). (F)–(H) ToF-SIMS images of: (F) CNO−; (G) PO3−; and (H) cisplatin acquired as [PtCN]− ions of the sputtered cell shown in (E). The images were collected from HeLa cells treated with 50 μM cisplatin for 24 h. The images shown in (B)–(D) were obtained using 50 BIB scans, and images (F)–(H) were obtained using 3000 BIB scans. | ||
As mentioned earlier, neither NanoSIMS nor ToF-SIMS can be used to directly map native proteins inside cells owing to the lack of informative ions. Therefore, as an alternative, CLSM was used to visualize the proteins of interest inside the cells (Scheme 1B).33 Using HMGB1 as an example, an enhanced yellow fluorescent protein (EYFP) fused HMGB1 plasmid was constructed (Fig. S5, ESI†), and this was then transfected into the HeLa cells (Scheme 1A). The results of both the Western blot assay (Fig. S6, ESI†) and CLSM imaging (Fig. 2B) suggested the successful expression of the EYFP-HMGB1 fusion protein in the HeLa cells, in which the fused protein was shown to be located in both the cytoplasm and nucleus, as visualized using the non-specific DNA fluorescence dye DAPI in the absence of cisplatin (Fig. 2C).
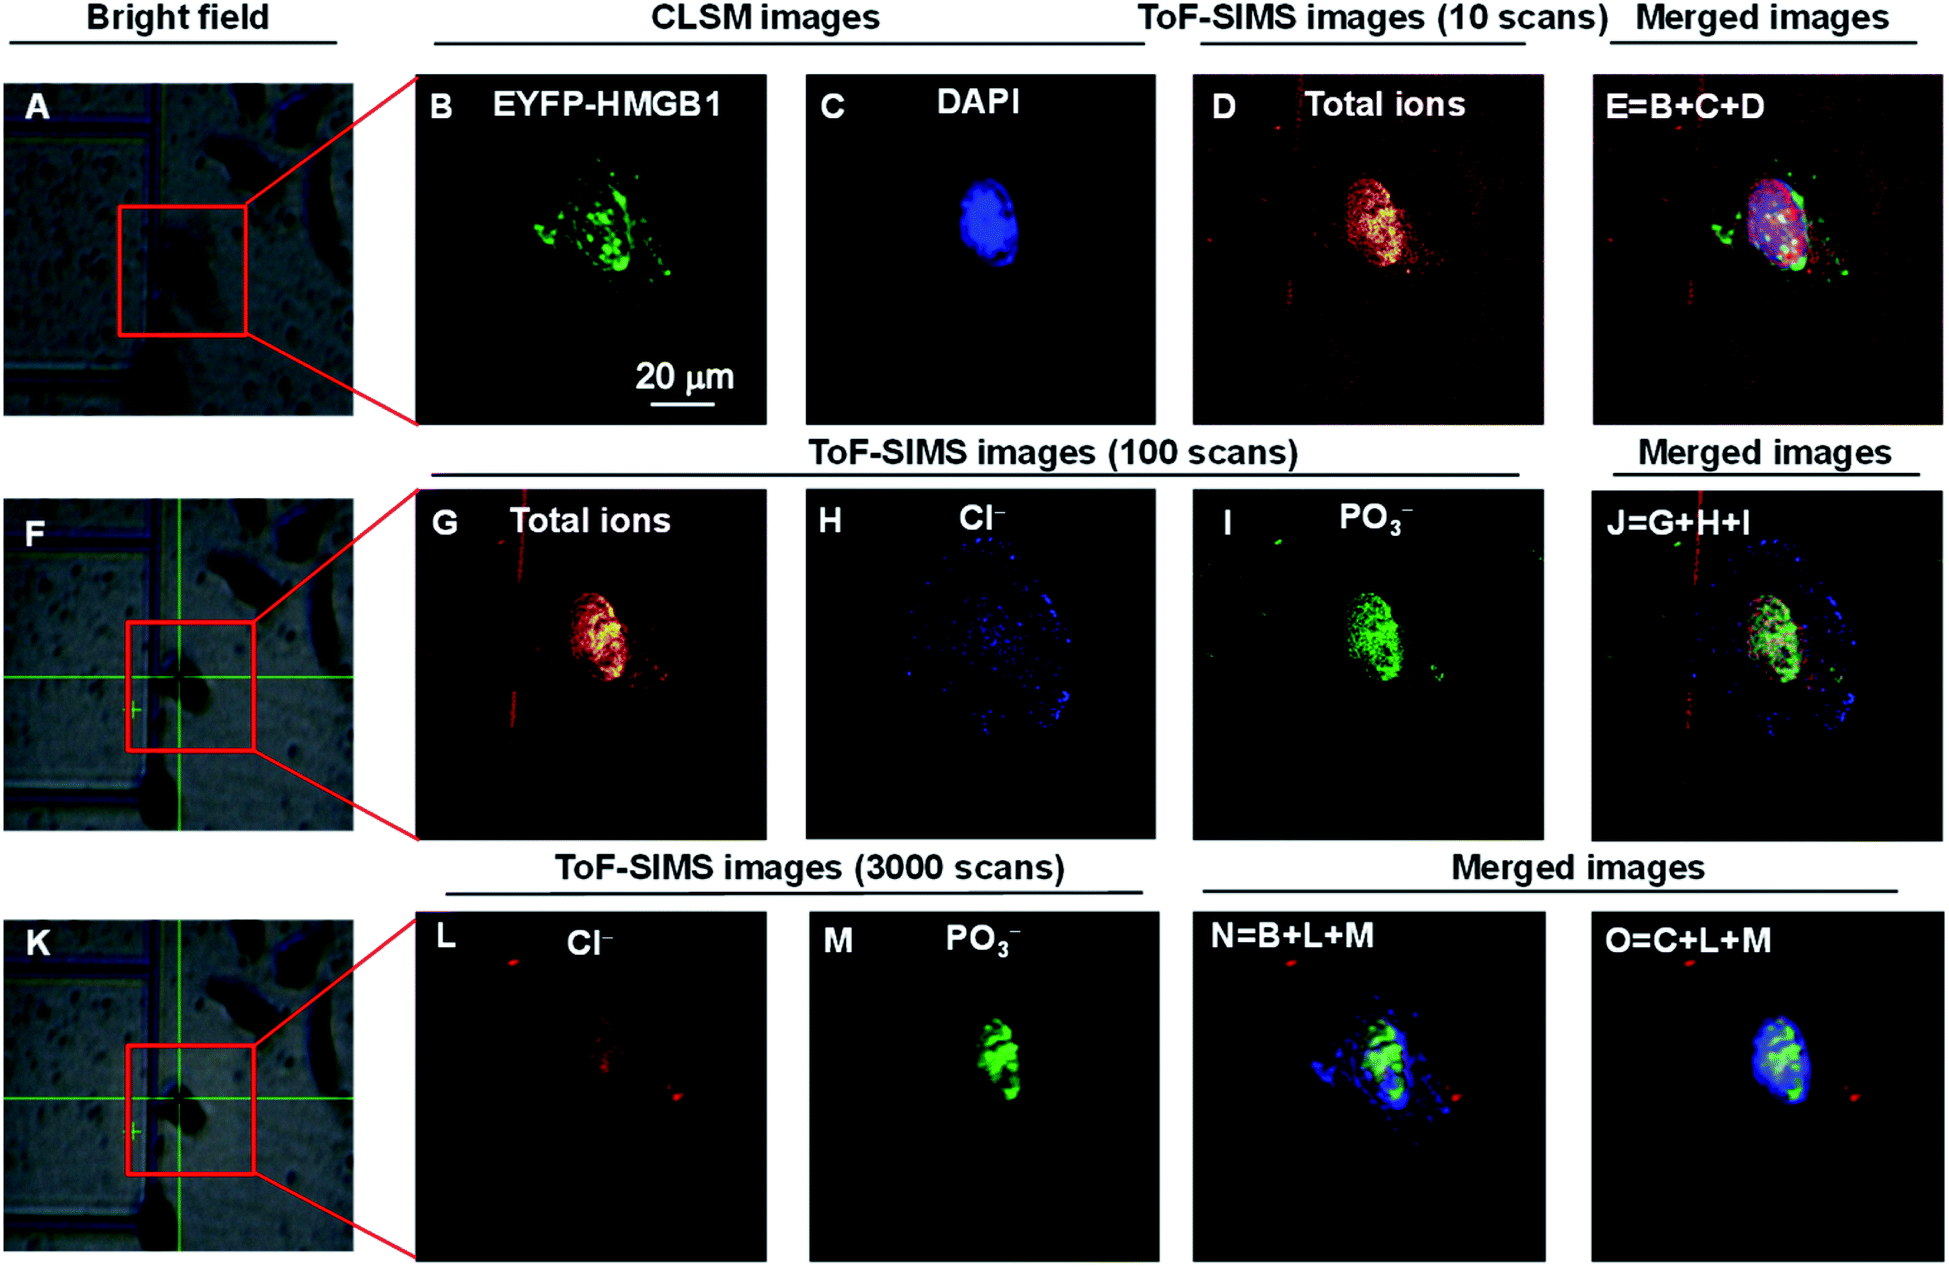 | ||
| Fig. 2 COSIMSi of lyophilized HeLa cells without treatment using cisplatin. (A), (F) and (K) Bright field images of a single cell framed in a red box: (A) before; (F) after 10 cycles of GCIB sputtering on (A); and (K) after 100 BIB scans on (F). (B) and (C) CLSM images of (B) EYFP-HMGB1 and (C) the DAPI stained nucleus. (D) ToF-SIMS image of the total ions using 10 BIB scans. (E) Merged image of the CLSM images of EYFP-HMGB1 (green), DAPI (blue) and ToF-SIMS image of the total ions (red). (G)–(I) ToF-SIMS images of: (G) total ions; (H) Cl−; and (I) PO3− using 100 BIB scans. (J) Merged image of the ToF-SIMS images of the total ions, Cl− and PO3−. (L) and (M) ToF-SIMS images of: (L) Cl−; and (M) PO3− using 3000 BIB scans. (N) and (O) Merged ToF-SIMS images of Cl− (red) and PO3− (green) and the CLSM image of EYFP-HMGB1 (blue) or DAPI (blue). The ToF-SIMS images of Cl− and PO3− were acquired at m/z 35 and 79, respectively. | ||
After performing CLSM imaging of the EYFP-HMGB1 expressing HeLa cells without cisplatin treatment (Fig. 2B and C), ToF-SIMS imaging was performed on the same HeLa cells. It is challenging to locate a micrometre region of interest on a silicon wafer within dimensions of 1 × 1 cm2 for successive optical and SIMS imaging. Wessels and co-workers achieved this by using the multiphoton laser beam at maximum energy to create a few location markers on the cell sample by deforming the LR white resin which was used to embed the cells.26 In this work, following our previous reports,28 the cells were cultured on a patterned silicon wafer with 200 × 200 μm squares (Fig. S1–S3, ESI†) so that one or a few specific cells could be easily located for successive CLSM and ToF-SIMS imaging. Culturing cells on a silicon wafer did not significantly change their viability and morphology, and this method is therefore suitable for single cell imaging using ToF-SIMS.28,34 After CLSM imaging on a lyophilized cell framed in the red box shown in Fig. 2A, the cell surface was scanned using BIB 10 times to obtain an image of the total ions (Fig. 2D). Thereafter, aided by the addressable silicon wafer the position and angle of the images obtained were precisely aligned using CLSM and SIMS imaging to produce fused images of the CLSM and SIMS imaging. As shown in Fig. 2E, the nuclear morphology of the cell mapped using SIMS imaging of the total ions is well matched with the CLSM images of EYFP-HMGB1 and DAPI. Furthermore, SIMS images of the cell were recorded which was sputtered with 10 cycles using GCIB (vide supra), and then the SIMS images of the total ions, Cl− and PO3− were obtained using 100 BIB scans (Fig. 2G–J). The fused images demonstrated that the Cl− and PO3− ions outlined the entire cell and nucleus, respectively. As the abundance of Cl− is higher in the cytoplasm than in the nuclei, and that of PO3−, which is mainly derived from the DNA and RNA backbone, is higher in the nucleus than in the cytoplasm, the relative signal intensity of the Cl− ion was stronger in the cytoplasm than in the nucleus, and that of the PO3− ion was stronger in the nucleus than in the cytoplasm (Fig. 2H and I). In comparison, when the residual cell was scanned using BIB 3000 times, the signals for both the Cl− and PO3− ions in the nucleus were significantly increased, resulting in the nucleus being well profiled, as with the CLSM images obtained using DAPI (Fig. 2L–O).
Owing to the high lateral resolution (50–100 nm) and mass resolution (>10![[thin space (1/6-em)]](https://www.rsc.org/images/entities/char_2009.gif) 000), NanoSIMS has often been used in previous studies involving the combined use of optical imaging.23–27,32,35 In order to perform NanoSIMS imaging, cells were typically embedded in resin and sliced into ultrathin films,24,26,32 which require heat treatment at 65 °C. This treatment probably disturbs the finely controlled cell architecture and interactions, in particular the non-covalent interactions between biological molecules, although NanoSIMS imaging provides an ultrahigh spatial resolution. Compared to NanoSIMS, ToF-SIMS can simultaneously detect all ions over a much wider m/z range, and generate molecule ions or large fragment ions providing further structural information to characterize the chemicals of interest.36 Moreover, our group recently demonstrated that ToF-SIMS imaging can achieve a 230–290 nm lateral resolution when it was used to directly map the distribution of drug candidates in lyophilized cells without the need to embed and section cells.28 The lateral resolution of ToF-SIMS and CLSM are well matched,28 making it unnecessary to sharpen the images obtained using a lower resolution imaging technique to merge with those obtained using a higher resolution imaging approach.37,38 Last but not least, ToF-SIMS is more affordable for research institutions, thus the COSIMSi method developed here could be more widely applied for exploring the interactions of drugs and their biological targets at the single cell level.
000), NanoSIMS has often been used in previous studies involving the combined use of optical imaging.23–27,32,35 In order to perform NanoSIMS imaging, cells were typically embedded in resin and sliced into ultrathin films,24,26,32 which require heat treatment at 65 °C. This treatment probably disturbs the finely controlled cell architecture and interactions, in particular the non-covalent interactions between biological molecules, although NanoSIMS imaging provides an ultrahigh spatial resolution. Compared to NanoSIMS, ToF-SIMS can simultaneously detect all ions over a much wider m/z range, and generate molecule ions or large fragment ions providing further structural information to characterize the chemicals of interest.36 Moreover, our group recently demonstrated that ToF-SIMS imaging can achieve a 230–290 nm lateral resolution when it was used to directly map the distribution of drug candidates in lyophilized cells without the need to embed and section cells.28 The lateral resolution of ToF-SIMS and CLSM are well matched,28 making it unnecessary to sharpen the images obtained using a lower resolution imaging technique to merge with those obtained using a higher resolution imaging approach.37,38 Last but not least, ToF-SIMS is more affordable for research institutions, thus the COSIMSi method developed here could be more widely applied for exploring the interactions of drugs and their biological targets at the single cell level.
Investigation of interactions between HMGB1 and cisplatin damaged DNA
To further verify the feasibility of the COSIMSi method and optimize the imaging conditions, the COSIMSi method described above was applied to investigate the formation of binding complex between HMGB1 and cisplatin damaged DNA in situ, which has been investigated and proven in a cell-free system previously.4 HeLa cells transfected with the pEYFP-HMGB1 plasmid were cultured on an addressable silicon wafer for 24 h, followed by incubation with fresh culture medium containing 50 μM cisplatin for another 24 h. The IC50 value of cisplatin against HeLa cells is 10–20 μM, which is usually determined with an incubation time of 48 h or longer with cisplatin.39 Thus, we observed that there were still sufficient living HeLa cells after 24 h of incubation with 50 μM cisplatin (Fig. 3IA). As shown in Fig. 3I, the CLSM images of DAPI clearly define the cell nuclei (Fig. 3IB), and the EFYP fused HMGB1 was found to be located mainly in the nuclear region (Fig. 3IC). This contributes to the specific binding of HMGB1 to cisplatin crosslinked DNA.11,40 In comparison, without cisplatin treatment, HMGB1 was demonstrated to be distributed throughout the entire HeLa cell (Fig. 2B). Meanwhile, the ToF-SIMS images also indicated that cisplatin is mainly located in the nuclear region (Fig. 3ID).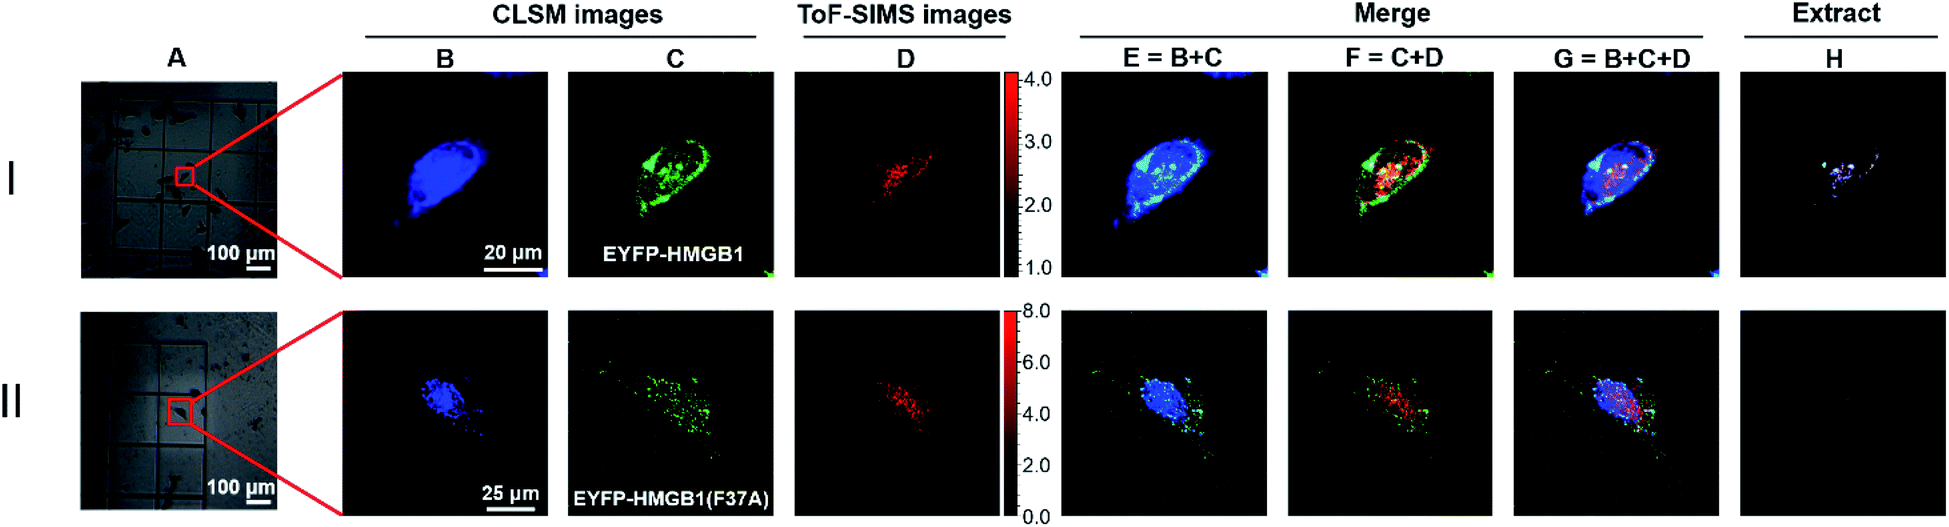 | ||
| Fig. 3 COSIMSi of HeLa cells transfected by: (I) the pEYFP-HMGB1(wt) plasmid; and (II) pEYFP-HMGB1(F37A) plasmid, and treated with 50 μM cisplatin. (A) Bright field images. (B) Fluorescence images of DAPI (λex = 405 nm; λem = 425–475 nm). (C) Fluorescence images of EYFP-HMGB1 or EYFP-HMGB1(F37A) (λex = 488 nm; λem = 500–600 nm). (D) ToF-SIMS image of [PtCN]− acquired at m/z 220, 221 and 222. (E) Merged fluorescent image of DAPI (blue) and EYFP-fused HMGB1 or EYFP-fused HMGB1(F37A) (green). (F) Merged image of EYFP-fused or EYFP-fused HMGB1(F37A) (green) and SIMS image of [PtCN]− (red). (G) Merged images of fluorescence images of DAPI, EYFP-fused HMGB1 or EYFP-fused HMGB(F37A) and SIMS image of [PtCN]−. (H) Extracted images from (G) to show a better contrast. | ||
The CLSM images of DAPI and EYFP-fused HMGB1 were then merged with the SIMS images of cisplatin obtained using the signal of [PtCN]−. The overlap (navy spots shown in Fig. 3IE) of the CLSM signals of DAPI and HMGB1 indicated the formation of the DNA-HMGB1 complex. The overlap of CLSM signal of HMGB1 and the SIMS signal of cisplatin showed the proximity of HMGB1 and cisplatin (yellow spots in Fig. 3IF). The overlap of the CLSM signals of DAPI and HMGB1 and the SIMS signal for cisplatin suggested that the HMGB1-Pt-DNA ternary binding complex was formed inside the cells (white spots shown in Fig. 3IG). A Java program, the code for which is provided in the ESI,† was developed to extract the overlapping signals of the CLSM signals of DAPI/HMGB1 with the SIMS signal for cisplatin. The intensity of the extracted signals represents the amount of the HMGB1-Pt-DNA ternary complex formed in the single cell.
A control experiment was performed to verify the interactions between the cisplatin damaged DNA and HMGB1 inside cells observed using COSIMSi. As the Phe37 residue on HMGB1 is crucial for the recognition of HMGB1 by the cisplatin damaged DNA,11,41 we introduced a site-specific mutation at Phe37 (F37A) of HMGB1 (Fig. S6, ESI†). The mutant protein was also fused with EYFP for CLSM imaging. With the F37A mutant, the binding of the protein to the Pt damaged DNA is presumed to be significantly weaker. Indeed, the COSIMSi results showed that unlike the wild type EYFP-HMGB1, the mutated EYFP-HMGB1(F37A) protein appeared to be distributed homogeneously inside the cell, instead of only within the nucleic area (Fig. 3IIC). Moreover, as expected, the fluorescence signals of EYFP-HMGB1(F37A) did not overlap with the SIMS signal of [PtCN]− (Fig. 3IIF–H), demonstrating that the F37A mutation on HMGB1 deprived it of its ability to bind to the cisplatin damaged DNA, which led the mutant HMGB1 to be distributed throughout the entire HeLa cell (Fig. 3IIC). This result, in combination with previous reports,11,41 supports that the overlapping signals of the fluorescence signals of EYFP-HMGB1 and DAPI with the SIMS signal of [PtCN]− represent the formation of the HMGB1-Pt-DNA complex in the cells.
For comparison, the immunostaining technique was applied to label HMGB1, and the developed COSIMSi method was used to map the interaction of HMGB1 with cisplatin damaged DNA in HMGB1 wild-type HeLa cells and HMGB1 overexpressed HeLa cells. As shown in Fig. S7,† the overlapping signals of HMGB1 to [PtCN]− significantly increased in intensity in the HMGB1 overexpressed HeLa cells (Fig. S7IIF†) in comparison with those in the HMGB1 wild-type HeLa cells (Fig. S7IF†). As the overlapping signals of [PtCN]− to DNA did not significantly change between these two types of cells, the extracted signals of HMGB1, DAPI and [PtCN]− demonstrated that more HMGB1-Pt-DNA complex was formed in the HMGB1 overexpressed HeLa cells than in the HMGB1 wild-type ones (Fig. S7IH and S7IIH†). This result is in good agreement with previous studies that reported overexpressed HMGB1 could prevent the cisplatin-damaged DNA from performing NER, favouring the formation of the HMGB1-Pt-DNA complex in breast cancer cells.42 These results also verified that the EYFP fusion did not affect the recognition and interaction between HMGB1 and the cisplatin crosslinked DNA.
Immunofluorescence imaging of proteins using antibodies is a classic strategy to visualize a protein of interest in single cells by CLSM. This method, however, requires complicated cell treatment, for example cell permeation and rigorous washing, which often leads to detachment of cells from the silicon wafer. The data obtained shows that EYFP fusion not only allowed high quality fluorescence imaging of HMGB1, but also simplified the experiments owing to the omission of immunostaining. Therefore, fused EYFP was used to label HMGB1 for the remaining experiments (Scheme 1A).
Experiments were also performed using different concentrations of cisplatin and different incubation times. Along with the increased cisplatin concentration and incubation time, the [PtCN]− signals in the ToF-SIMS images became stronger. Moreover, the overlapping spots in the merged images of DAPI, HMGB1 and [PtCN]− became denser, larger and brighter, as did the extracted signals (Fig. S8 and S9, ESI†). These results further verified the reliability of the COSIMSi approach.
During the last decade, a number of correlated optical and SIMS microscopy imaging methods have been developed and significant advances have been made in cell biology research, for example exploration of the procedure for benthic marine nitrogen fixation,27 the protein turnover in cells,24–26,35 stem cell division and metabolism,23 as well as the subcellular distribution/release of metal based anti-cancer complexes.28,32,43 In these cases, optical imaging has generally been used either to visualize the cellular distribution/turnover of the proteins of interest, or to image the organelles such as the nuclei23,43 and lysosomes32 to localize small or macro biological molecules in single cells. To the best of our knowledge, the present work is the first report of the investigation of the in situ interactions between proteins and DNA regulated by a drug in single cells.
Cisplatin disrupts the interactions of Smad3 and DNA
The Smad family proteins, for example Smad3, are important signal transducers for receptors of the transforming growth factor beta (TGF-β) superfamily. Smad3 belongs to the receptor-regulated Smads (R-Smads), and acts as a transcription factor to regulate the gene expression via the formation of a heteromeric complex with the “common partner” Smad4.44,45 More importantly, the Smad DNA binding elements, for example GGC(GC)/(CG) and AGAC, also cover the preferential binding sites of cisplatin, -GG- and -AG-. To explore the influence of the DNA damage induced by cisplatin on the recognition and interaction between the Smad proteins and DNA, the COSIMSi approach described above was applied to visualize the interactions of Smad3 with DNA in the presence/absence of cisplatin in HeLa cells. Herein, Smad3 was fused with EGFP and imaged using CLSM in a similar way to that used for EYFP-HMGB1. When cisplatin was not applied, Smad3 was found to be mainly distributed in the nuclei of the HeLa cancer cells, as revealed by the good overlap of the fluorescence signal of Smad3 with the DNA stained with DAPI (Fig. 4A), probably due to stimulation by the TGF-β present in the fetal bovine serum (FBS) in the culture media used (Fig. S10, ESI†). In contrast, after cisplatin treatment the distribution of Smad3 in the nuclei became uneven and assembled to form some large spots (Fig. 4B). The merged images revealed that the Smad3 mainly remained in the nuclear area, as imaged with DAPI, indicating that it still bound to certain nuclear DNA as a transcription factor directly or mediated by complexation with Smad4.14 However, Smad3 did not co-localize at all with the cisplatin mapped using the signal of [PtCN]− in the nucleus, which ruled out the possibility that cisplatin binds to the Smad3 protein, and also suggested that the Smad3/Smad4 complex cannot interact with the Pt damaged DNA. Interestingly, within the nuclear region, the spots with stronger signals for [PtCN]− are always correlated to a weaker signal of EGFP-Smad3 (Fig. 4B). This suggests that the cisplatin induced damage on DNA hampered the binding of the Smad3 to DNA, probably impacting the transcriptional function of Smad3 associated with the TGF-β-signaling.13,46,47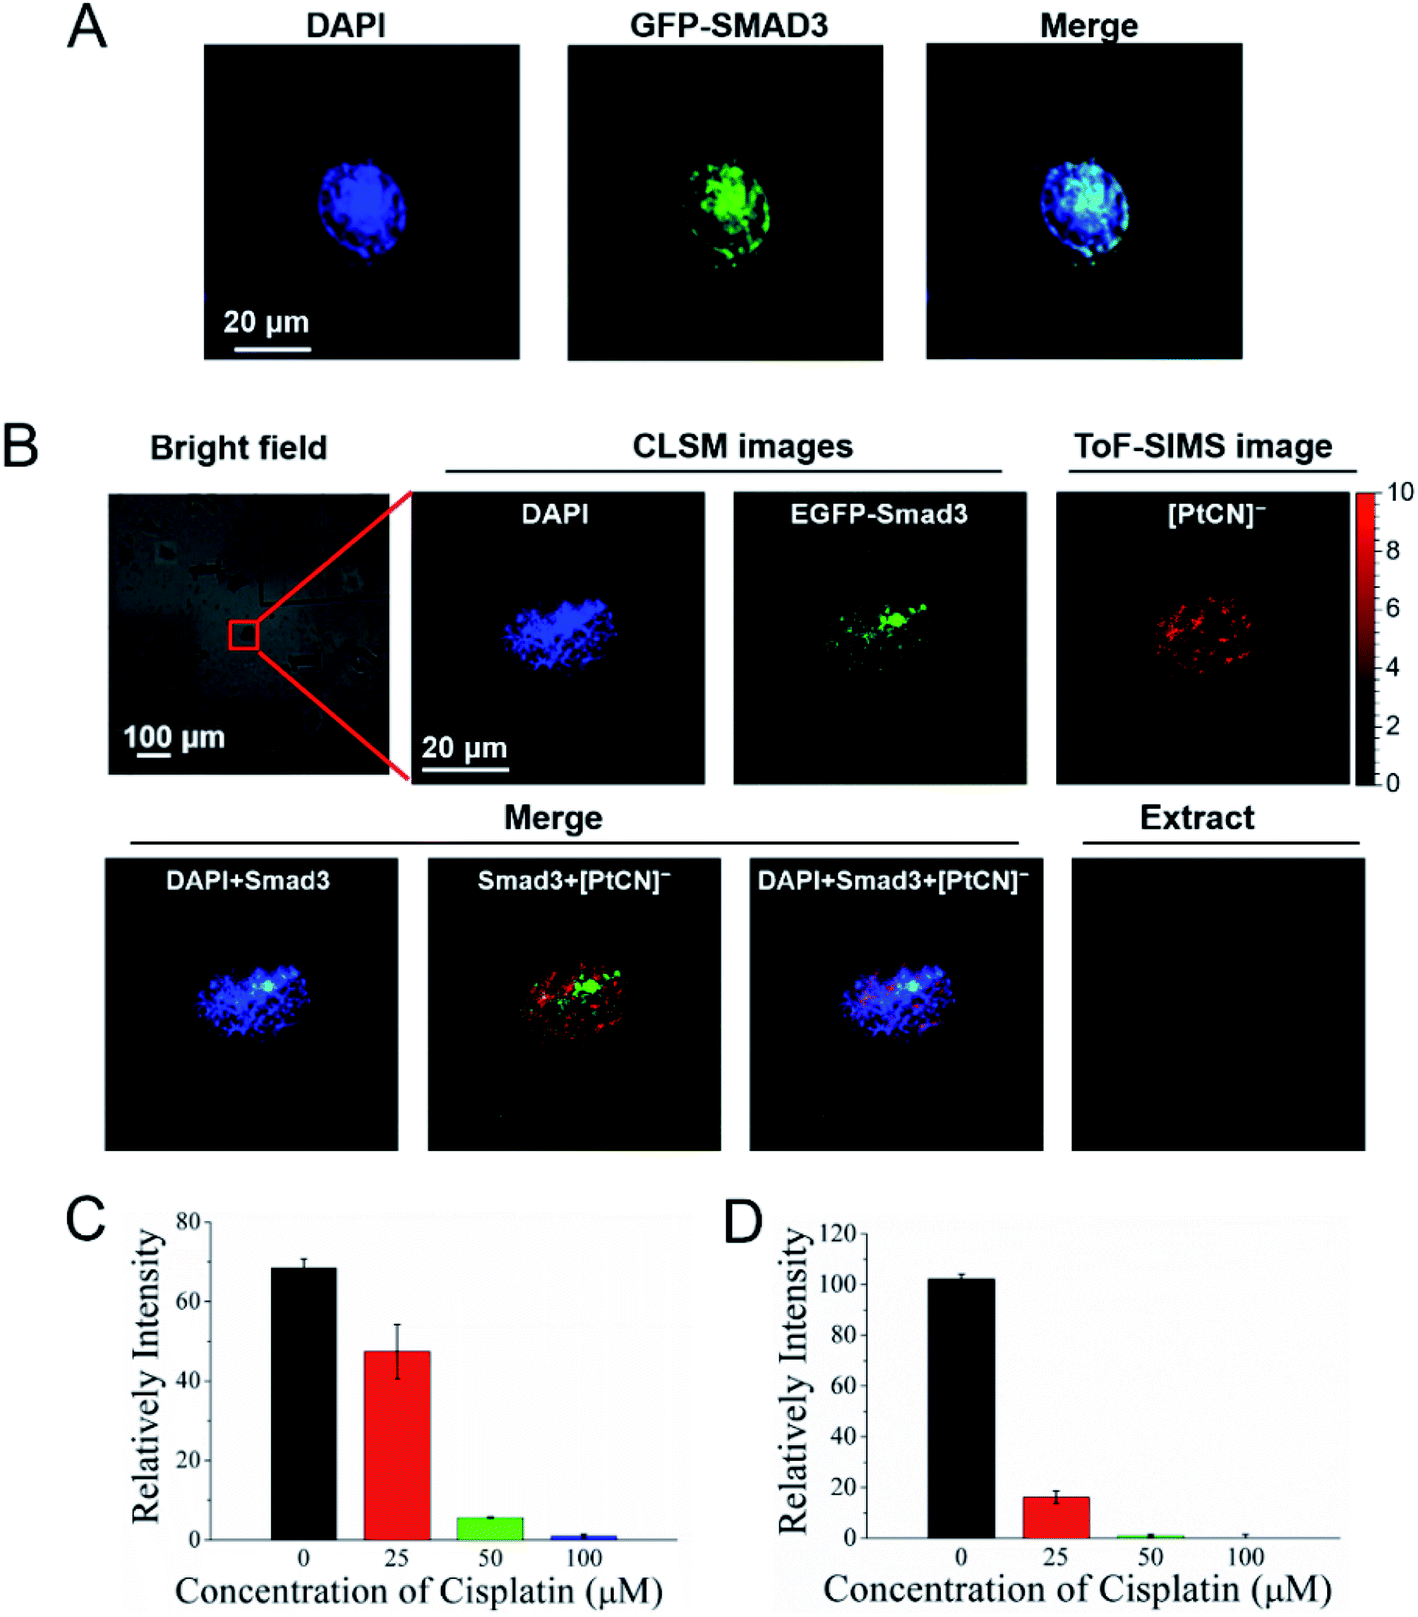 | ||
| Fig. 4 Cisplatin disrupts the interactions of Smad3 and DNA. (A) Fluorescence images of HeLa cells transfected with the EGFP-Smad3 plasmid. (B) COSIMS images of HeLa cells transfected with the EGFP-Smad3 plasmid and treated with 50 μM cisplatin. (C) SMAD transcription activity of the HeLa cells cultured with different concentration of cisplatin for 24 h. (D) SMAD transcription activity of the HeLa cells transfected with the exogenous Smad3 plasmid and cultured with different concentrations of cisplatin for 24 h. | ||
In order to verify whether cisplatin induced damage on DNA inhibits the interaction between Smad3 and DNA, the SMAD transcription activity of the HeLa cells was measured using the Dual Luciferase Assay.48 HeLa cells were transfected with the SMAD luciferase reporter plasmid and the internal control Renilla luciferase reporter plasmid, and cultured with an FBS-containing DMEM medium for 24 h. The cells were then treated with different concentrations of cisplatin for another 24 h. Thereafter, the luciferase activity was measured. As shown in Fig. 4C, the relative intensity of the illumination of the SMAD luciferase reporter decreased sharply with the increased concentration of cisplatin. After the cells were treated with 100 μM cisplatin for 24 h, the relative intensity of illumination was observed to be close to zero. Similar results were obtained when the HeLa cells were transfected with the exogenous Smad3 plasmid (Fig. 4D). Although the depressed expression of Smad3 directly by cisplatin cannot be ruled out based on the dual modal imaging data, the results obtained by luciferase assay on the Smad3 overexpressed HeLa cells strongly support that the cisplatin damaged DNA disrupts the interaction of Smad3 and DNA, disabling the transcription activity of Smad3.
Cisplatin induces cell apoptosis and kills cells by distorting the DNA conformation. Significant efforts have been made to decipher the direct interaction or response of the intracellular protein machineries, such as the DNA replication and RNA synthesis machinery, NER machinery, with/to the cisplatin damaged DNA.4 These studies provided invaluable information enabling a better understanding of how cisplatin induced DNA damage leads to cell death. As a non-specific DNA binding protein, HMGB1 was well established to preferentially binds to distorted DNA, especially intrastrand cisplatin-crosslinked DNA in vitro. In general, HMGB1 functions as a repressor in the absence of transcriptional activators, but as a coactivator in the presence of transcription activators.10 Previous studies have mainly focused on the influence of HMGB1 binding to cisplatin-crosslinked DNA on DNA repair and replication.49 However, these studies have ignored the effects of the binding of HMGB1 to cisplatin crosslinked DNA on the interactions of the transcription factors, such as the Smad proteins, with DNA, as well as on the downstream transcriptional processes.
The TGF-β signalling pathway regulates cell proliferation, differentiation, and apoptosis.13 Activation of the TGF-β receptor leads to phosphorylation of the transcription factors, for example Smad3, which then accumulates in the nucleus in association with Smad4. It is commonly considered that the CAGAC motif in genomic DNA is the main binding site, namely the Smad binding element (SBE), for Smad2/3/4.45 Recently, the 5-bp consensus sequence GGC(GC)|(CG), which is highly represented as clusters in genome-wide Smad-bound regions, has been reported to be the binding sites of the TGF-β-activated Smads complexes containing the “common partner” Smad4.14 It should be noted that both SBEs contain the preferential sites, either -AG- or -GG-, for cisplatin binding to DNA. Thus, it is not surprising that our COSIMSi approach revealed that cisplatin crosslinked DNA inhibited Smad3 binding towards DNA, and this was supported by the results of the dual luciferase assay. It is surprising that the potential impact of cisplatin crosslinked DNA on the interactions of Smads proteins with DNA has not been paid attention to. Of course, given the high affinity of HMGB1 binding to cisplatin crosslinked DNA, this inhibition may result from the crosslinking induced alteration on the DNA conformation, or from the competition of HMGB1 with the platinated SBEs. The interactions of the Smad transcription factors with DNA should be investigated further to determine which factor results in the most disturbance of the interactions. Moreover, Smad3 (and Smad2) mediates TGF-β signalling, which directs various responses in different cell types and plays a crucial role in normal cell growth and tissue homeostasis.13 Therefore, the inhibition of the interaction of Smad3 with DNA resulting from cisplatin damage on DNA may contribute to the anticancer activity of cisplatin. Regarding this, our study herein opens a new door to decipher further the molecular mechanism of action of this widely used anticancer drug. As there are many other transcription factors, of which the DNA binding elements contain -GG- and -AG-rich sequences, research on whether and how cisplatin induced lesions on DNA affect the efficacy of the transcriptional machinery could provide novel insights into better understanding of the mechanism of action of cisplatin.
Conclusions
In the present work we have developed a dual-modal optical and mass spectrometric microscopy imaging approach for in situ visualization of the recognition and interactions between proteins and cisplatin damaged DNA inside cells. This method takes advantage of CLSM imaging for the localization of specific proteins and ToF-SIMS imaging for the visualization of platinum-based drugs at the single cell level. Using the COSIMSi method, we inferred the formation of ternary complex consisting of HMGB1 and cisplatin damaged DNA in situ in single cells for the first time. More significantly, the application of the developed COSIMSi method enabled the discovery that cisplatin induced DNA damage prevents the transcription factor Smad3 from binding to SBEs on DNA, disabling the transcription activity of Smad3. This effect may contribute to the anticancer activity of cisplatin by disturbing the TGF-β signalling mediated by Smad proteins. These results warrant further investigation into the roles of Smad proteins and other transcription factors in the action of cisplatin and other genotoxic anticancer drugs.Experimental
Cell lines
The human cervical cancer cell line HeLa cells were obtained from the National Infrastructure of Cell Line Resource (Beijing, China), and maintained in DMEM (Dulbecco's modified Eagle's medium, Gibco) supplemented with 10% fetal bovine serum (FBS, Gibco) and 1% penicillin–streptomycin solution (Gibco). The cells were cultured at 310 K under 5% CO2 and collected using trypsin (Gibco).Plasmids construction
The codon optimized HMGB1 gene sequence obtained from Origene Ltd (Beijing, China) was amplified by PCR and then cloned to pCMV-N-Flag and pEYFP-C1 vector, to get the pCMV-N-Flag-HMGB1(wt) and pEYFP-HMGB1 plasmids, respectively. The corresponding HMGB1(F37A) site mutant plasmids was constructed by 18 cycles PCR with the primers, 5′-CACCCAGATGCTTCAGTCAACTTCTCAGAGGCTTCTAAGAAGTGCTCAGAGAGGTGGAAG-3′ (F37A-F) and 5′- CTTCCACCTCTCTGAGCACTTCTTAGAAGCCTCTGAGAAGTTGACTGAAGCATCTGGGTG-3′ (F37A-R) following the manufacture instructions of Fast Site-Directed Mutagenesis Kit (TianGen biotech), to get the pEYFP-HMGB1(F37A) plasmids. The EGFP-Smad3 plasmid was constructed as previously described.50 The pEYFP-C1 and pCMV-N-Flag vectors were kindly gifted from Prof. Yang Xiang, Nanchang University.Cell culture, staining and sample preparation
For correlated CLSM and ToF-SIMS imaging, HeLa cancer cells were seeded on a home-made addressable silicon wafer at a density of 1 × 10⁴ cells per cm2 in a cell culture dish with DMEM medium and incubated at 310 K under a humidified atmosphere containing 5% CO2 to incubate over-night for cell attachment. The addressable silicon wafers with 200 × 200 μm square matrices were home-made following the protocol described in our previous report.28 The cells were then transfected with 1 μg each plasmid described above by FuGENE® HD (Promega, Madison, WI, USA) following the manufacture instructions. After 24 h of transfection, 1 mM cisplatin stock solution was diluted with culture medium to requested concentrations and added into respective culture dish, then HeLa cells were incubated with cisplatin for 24 h unless otherwise stated. Cell samples for control were treated under the same conditions except the addition of drug and/or plasmid transfection. The cells were fixed with pure ethanol pre-cooled in a 253 K freezer for 20 min, and permeabilized using 0.1% PBST for 15 minutes at 277 K. Then the wild type and pCMV-N-Flag-HMGB1(wt) transfected HeLa cells were incubated with 1 mL horse serum for 1 h at 277 K followed by PBST washing 3 times (10 min each time), and then the cells were incubated with 1 mL diluted anti-HMGB1 primary antibody (mouse anti-human HMGB1 monoclonal primary anti-body, 1:10000 dilution, Abcam, ab77302) for 1 h in room temperature. After washed by PBST 3 times (10 min each time) in horizontal shaker, the FITC-labeled secondary anti-body (goat anti-mouse antibody, 1:500 dilution, Zhongshan jinqiao Ltd, ZF-0312) was added to the cell culture disk and incubated for 40 min at room temperature. Next, after removing the excess of secondary antibody and adding PBS for washing 3 times (10 min for each time), 5 μg mL−1 fluorescence dye DAPI (Invitrogen, USA) in PBS was added for 10 min incubation to stain nuclear DNA. The EYFP-HMGB1 expressing HeLa cells were not added the primary antibody and the secondary antibody, but stained by DAPI only. After that, the sample was thoroughly washed three times with PBS followed by three times washing with ammonium acetate (150 mM, pH = 7.4), then immersed into liquid N2 for quick freezing, and transferred intermediately into a lyophilizer (LGJ-12, Beijing Songyuan huaxing Technology Develop Co., Ltd) at 193 K to 208 K for freeze-drying overnight.
Confocal laser scanning microscopy (CLSM) imaging
The fluorescence imaging was performed on FV1000-IX81 confocal laser scanning microscopy through an IX81 inverted microscope with the 100× oil-immersion lens and 40× objective lens (Olympus, Tokyo, Japan). For nucleus dye DAPI, the excitation wavelength was 405 nm and emission wavelength 425–475 nm. For HMGB1 Ab-FITC, EYFP-HMGB1 protein and GFP-Smad3 protein, λex = 488 nm, λem = 500–600 nm. The images were collected and analyzed using the OLYMPUS FLUOVIEW software.Time of flight secondary ion mass spectrometry (ToF-SIMS) imaging
ToF-SIMS imaging was carried out with a ToF-SIMS 5 instrument (ION-ToF GmbH, Münster, Germany) equipped with a 30 keV liquid metal primary ion source. The high-lateral-resolution (ca. 200–300 nm) images of single cell were recorded using Bi3+ primary ion gun with an electron flood gun for charge neutralization. Imaging signal was collected with 256 × 256 pixels in negative mode after sputtering 5–15 cycles with 10 keV Ar-cluster ion beam to remove the cell membrane and other impurities on the cell surface. The sputter view was larger than the analytical scan view of which the size was the same as that of confocal imaging. Due to the difference among individual cell samples, the scan times of each sample varied from 1000 to 3000 to obtain high quality images. The mass images were collected and plotted with the Surface Lab software (version 6.4 ION-ToF GmbH). The mass were calibrated using the signals of C−, CH−, CH2−, C2−, C2H−. Region of interest were created for desired cells. The image of cisplatin was constructed by sum of signals of [194PtCN]−, [195PtCN]− and [196PtCN]− ions and the image of PO3− was used to profile the shape of cells. Shift correction was applied by the software for all the images.Western blotting
HeLa cancer cells were transfected using pCMV-N-Flag-HMGB1(wt), pEYFP-HMGB1, and pEYFP-HMGB1(F37A) plasmids, respectively, and cultured in cell culture dishes following the same procedure as described in the cell culture subsection. The cells were then harvested by centrifugation at 800g for 5 min, and the cell pellets were resuspended in RIPA lysis buffer (Thermo Scientific™, Cat No. 89900, USA) for protein extraction. Each protein extract was dissolved in a loading buffer (pH 6.8) containing 0.5 M Tris–HCl, 20% glycerol, 2% sodium dodecyl sulphate (SDS), bromophenol blue and 10 mM dithiothreitol. The protein samples were loaded and separated using 12% SDS-polyacrylamide gels, then transferred to nitrocellulose (NC) membranes (Millipore). The NC membranes were blocked with a solution of 5% (w/v) skimmed milk powder in PBST (0.1% (w/v) Tween 20 in PBS (pH 7.5)) for 0.5 h at room temperature, and then incubated with mouse anti-human HMGB1 monoclonal antibody (10000× dilution, Abcam, ab77302) or mouse anti-human β-actin monoclonal antibody (10000× dilution, Abcam, ab8226), respectively, for 1.5 h at room temperature or overnight at 277 K. Next, the membrane was washed using PBST three times (10 min each time) and incubated with goat anti mouse HRP-conjugated secondary antibody (1:500 dilution, ZDR-5307, Zhongshan jinqiao) for 40 min at room temperature. After washing with PBST three times (10 min each time), HRP substrates (Pierce™ ECL, Cat No. 32109) were added to the NC membrane prior to immediate detection using the Tanon 5200 Multi imaging system (Tanon Science & Technology Co., Ltd., Shanghai, China). The intensities of the bands were quantitated using Tanon Gel Imaging System 1D analysing software (version 4.2).
Image merging
The images obtained from CLSM and ToF-SIMS imaging were aligned and merged by Image J (version 1.51j8). The pixel of the fluorescence images was adjusted to 256 × 256 pixels. The image of PO3− acquired by ToF-SIMS was mirror transformed and accurately aligned to match the cell position and orientation mapped by CLSM. The images of [PtCN]− ions were then processed exactly as those for PO3− images. Once these images were processed separately, they could be merged in different color channels.Image extraction
To extract the merged signals of fluorescence images of proteins/DNA and SIMS images of cisplatin in the merged images, we developed a program to process the data further. Using Java language, we defined three sets of data from different images as (R, G, B) pixel channel values. The extracted pixels will display only if the corresponding (R, G, B) values are greater than a defined threshold. Otherwise, the pixels' values will be set to zero and leave the position black. By optimizing the threshold, we received satisfied extraction of the overlapped area in the merged images when the threshold was set to 50. The java code is provided in the ESI.†Dual luciferase assay
The SMAD transcription activity of HeLa cells were detected by dual luciferase Assay. HeLa cells were cultured in a 24-well plate and incubated at 310 K under a humidified atmosphere containing 5% CO2 to incubate over-night for cell attachment. The cells were washed with PBS, and then transfected with 0.5 μg SMAD luciferase reporter plasmid (Yeasen Biotech Co.Ltd, Shanghai, China) and 10 ng Renilla luciferase reporter plasmid (Yeasen Biotech Co.Ltd, Shanghai, China). The cells were divided into two groups. The first group of cells were used to detect whether FBS used in this work contained TGF-β, which stimulates the Smad proteins to enter the nucleus and induce expression of luciferase reporters. The cells were cultured in DMEM medium under serum-starved conditions for 0 h, 6 h, or 12 h, respectively. Then the culture media were replaced by fresh DMEM medium containing 10% FBS and the cells were incubated for further 30, 24 and 18 h, respectively. Then luciferase activity was measured using Dual Luciferase Assay (Promega, Madison, WI, USA). The other group of cells were used to evaluate the regulation of cisplatin to the interactions between Smad3 and DNA. The HeLa cells transfected with the dual luciferase reporter plasmids were cultured in normal DMEM medium containing 10% FBS for 24 h, and then transferred to culture medium with different concentration of cisplatin for another 24 h of incubation. Thereafter, the cells were washed with PBS and lysed in the well plate, detected SMAD transcription activity according to the instructions of Dual Luciferase Assay. The HeLa cells transfected with exogenous Smad3 plasmid were also detected by Dual Luciferase Assay to evaluate the SMAD transcription activity following the same procedure described above, except the cells were transfected with additional 0.3 μg Smad plasmid when transfected the dual luciferase reporter plasmids.Author contributions
F. W., Y. Zhao and X. F conceived and designed the project. F. W. supervised the project. Y. L., K. W., F. J., Q. L. and L. C. performed the CLSM experiments, K. W., F. J., Z. W., Y. Zhang and S. L. performed the ToF-SIMS experiments. Y. L., L. C. and L. Q. constructed EYFP-HMGB1 and performed the western blot experiments. N. L. constructed the EGFP-Smad3 plasmid. P. D. and F. G. edited the Java code. Y. L., K. W., F. J., F. W. and Y. Zhao analysed the data. Y. L., K. W., F. J., L. C., X. F., Y. Zhao and F. W. wrote and revised the manuscript.Conflicts of interest
The authors declare no competing interests.Acknowledgements
We thank Prof. Andrew Ewing at the Department of Chemistry and Molecular Biology, University of Gothenburg, Sweden, for stimulating discussion and helpful comments on the manuscript, and Prof. Dong Wang at the Institute of Chemistry, Chinese Academy of Sciences for the AFM analysis. We thank the National Natural Science Foundation of China (grant nos. 21927804, 21790390, 21790392, 21505141, 21575145, 21605146, 21635008 and 91543101) and the National Key R&D Program of China (grant no. 2018YFA0800903) for support. Y. Z. thanks the Youth Innovation Promotion Association of Chinese Academy of Sciences (grant no. 2017051), and Q. L. thanks the Beijing Municipal Natural Science Foundation (grant no. 7182190) for support.References
- A. Casini and J. Reedijk, Chem. Sci., 2012, 3, 3135–3144 RSC.
- X. Shu, X. Xiong, J. Song, C. He and C. Yi, Angew. Chem., Int. Ed., 2016, 55, 14246–14249 CrossRef CAS PubMed.
- D. Wang and S. J. Lippard, Nat. Rev. Drug Discovery, 2005, 4, 307–320 CrossRef CAS PubMed.
- Y. Jung and S. J. Lippard, Chem. Rev., 2007, 107, 1387–1407 CrossRef CAS PubMed.
- E. R. Jamieson and S. J. Lippard, Chem. Rev., 1999, 99, 2467–2498 CrossRef CAS PubMed.
- W. Zeng, Z. Du, Q. Luo, Y. Zhao, Y. Wang, K. Wu, F. Jia, Y. Zhang and F. Wang, Anal. Chem., 2019, 91, 6035–6042 CrossRef CAS PubMed.
- A. J. Deans and S. C. West, Nat. Rev. Cancer, 2011, 11, 467–480 CrossRef CAS PubMed.
- P. Knipscheer, M. Räschle, A. Smogorzewska, M. Enoiu, T. V. Ho, O. D. Schärer, S. J. Elledge and J. C. Walter, Science, 2009, 326, 1698–1701 CrossRef CAS PubMed.
- A. D. Baxevanis and D. Landsman, Nucleic Acids Res., 1995, 23, 1604–1613 CrossRef CAS PubMed.
- M. C. Thomas and C.-M. Chiang, Crit. Rev. Biochem. Mol. Biol., 2006, 41, 105–178 CrossRef CAS PubMed.
- U.-M. Ohndorf, M. A. Rould, Q. He, C. O. Pabo and S. J. Lippard, Nature, 1999, 399, 708–712 CrossRef CAS PubMed.
- S. Chen, D. Xu, H. Jiang, Z. Xi, P. Zhu and Y. Liu, Angew. Chem., Int. Ed., 2012, 51, 12258–12262 CrossRef CAS PubMed.
- A. C. Mullen, D. A. Orlando, J. J. Newman, J. Lovén, R. M. Kumar, S. Bilodeau, J. Reddy, M. G. Guenther, R. P. DeKoter and R. A. Young, Cell, 2011, 147, 565–576 CrossRef CAS PubMed.
- P. Martin-Malpartida, M. Batet, Z. Kaczmarska, R. Freier, T. Gomes, E. Aragón, Y. Zou, Q. Wang, Q. Xi, L. Ruiz, A. Vea, J. A. Márquez, J. Massagué and M. J. Macias, Nat. Commun., 2017, 8, 2070 CrossRef PubMed.
- B. J. Venters, Briefings Funct. Genomics, 2018, 17, 80–88 CrossRef CAS PubMed.
- M. K. Passarelli, A. Pirkl, R. Moellers, D. Grinfeld, F. Kollmer, R. Havelund, C. F. Newman, P. S. Marshall, H. Arlinghaus, M. R. Alexander, A. West, S. Horning, E. Niehuis, A. Makarov, C. T. Dollery and I. S. Gilmore, Nat. Methods, 2017, 14, 1175–1183 CrossRef CAS PubMed.
- R. Zenobi, Science, 2013, 342, 1201–1211 CrossRef CAS PubMed.
- V. Pareek, H. Tian, N. Winograd and S. J. Benkovic, Science, 2020, 368, 283–290 CrossRef CAS PubMed.
- J. Han, H. Permentier, R. Bischoff, G. Groothuis, A. Casini and P. Horvatovich, Trends Anal. Chem., 2019, 112, 13–28 CrossRef CAS.
- E. K. Neumann, T. D. Do, T. J. Comi and J. V. Sweedler, Angew. Chem., Int. Ed., 2019, 58, 9348–9364 CrossRef CAS PubMed.
- M. K. Passarelli and A. G. Ewing, Curr. Opin. Chem. Biol., 2013, 17, 854–859 CrossRef CAS PubMed.
- D.-S. Zhang, V. Piazza, B. J. Perrin, A. K. Rzadzinska, J. C. Poczatek, M. Wang, H. M. Prosser, J. M. Ervasti, D. P. Corey and C. P. Lechene, Nature, 2012, 481, 520–524 CrossRef CAS PubMed.
- M. L. Steinhauser, A. P. Bailey, S. E. Senyo, C. Guillermier, T. S. Perlstein, A. P. Gould, R. T. Lee and C. P. Lechene, Nature, 2012, 481, 516–519 CrossRef CAS PubMed.
- I. C. Vreja, S. Kabatas, S. K. Saka, K. Krohnert, C. Hoschen, F. Opazo, U. Diederichsen and S. O. Rizzoli, Angew. Chem., Int. Ed., 2015, 54, 5784–5788 CrossRef CAS PubMed.
- S. Kabatas, P. Agüi-Gonzalez, K.-A. Saal, S. Jähne, F. Opazo, S. O. Rizzoli and N. T. N. Phan, Angew. Chem., Int. Ed., 2019, 58, 3438–3443 CrossRef CAS PubMed.
- S. K. Saka, A. Vogts, K. Krohnert, F. Hillion, S. O. Rizzoli and J. T. Wessels, Nat. Commun., 2014, 5, 3664–3671 CrossRef PubMed.
- A. E. Dekas, R. S. Poretsky and V. J. Orphan, Science, 2009, 326, 422–426 CrossRef CAS PubMed.
- S. Y. Liu, W. Zheng, K. Wu, Y. Lin, F. F. Jia, Y. Zhang, Z. Y. Wang, Q. Luo, Y. Zhao and F. Y. Wang, Chem. Commun., 2017, 53, 4136–4139 RSC.
- Y. Zhang, Q. Luo, W. Zheng, Z. Wang, Y. Lin, E. Zhang, S. Lu, J. Xiang, Y. Zhao and F. Wang, Inorg. Chem. Front., 2018, 5, 413–424 RSC.
- C. Li, F. Xu, Y. Zhao, W. Zheng, W. Zeng, Q. Luo, Z. Wang, K. Wu, J. Du and F. Wang, Front. Chem., 2020, 8, 210 CrossRef PubMed.
- F. Jia, J. Wang, Y. Zhao, Y. Zhang, Q. Luo, L. Qi, Y. Hou, J. Du and F. Wang, Anal. Chem., 2020, 92, 15517–15525 CrossRef CAS PubMed.
- A. A. Legin, A. Schintlmeister, M. A. Jakupec, M. Galanski, I. Lichtscheidl, M. Wagner and B. K. Keppler, Chem. Sci., 2014, 5, 3135–3143 RSC.
- B. N. G. Giepmans, S. R. Adams, M. H. Ellisman and R. Y. Tsien, Science, 2006, 312, 217–224 CrossRef CAS PubMed.
- J. Brison, M. A. Robinson, D. S. W. Benoit, S. Muramoto, P. S. Stayton and D. G. Castner, Anal. Chem., 2013, 85, 10869–10877 CrossRef CAS PubMed.
- S. E. Senyo, M. L. Steinhauser, C. L. Pizzimenti, V. K. Yang, L. Cai, M. Wang, T.-D. Wu, J.-L. Guerquin-Kern, C. P. Lechene and R. T. Lee, Nature, 2013, 493, 433–436 CrossRef CAS PubMed.
- S. G. Ostrowski, C. T. Van Bell, N. Winograd and A. G. Ewing, Science, 2004, 305, 71–73 CrossRef CAS PubMed.
- R. Van de Plas, J. H. Yang, J. Spraggins and R. M. Caprioli, Nat. Methods, 2015, 12, 366–372 CrossRef CAS PubMed.
- F. Vollnhals, J. N. Audinot, T. Wirtz, M. Mercier-Bonin, I. Fourquaux, B. Schroeppel, U. Kraushaar, V. Lev-Ram, M. H. Ellisman and S. Eswara, Anal. Chem., 2017, 89, 10702–10710 CrossRef CAS PubMed.
- K. E. Sandman and S. J. Lippard, in Cisplatin: Chemistry and Biochemistry of a Leading Anticancer Drug, ed. B. Lippert, Verlag Helvetica Chimica Acta, Zurich, 1999, ch. 21, pp. 523–536 Search PubMed.
- P. Pil and S. Lippard, Science, 1992, 256, 234–237 CrossRef CAS PubMed.
- Y. Wang, Z. Du, W. Zheng, K. Wu, D. Xu, Q. Luo, Y. Zhao, J. Han, Y. Liu and F. Wang, Dalton Trans., 2017, 46, 6187–6195 RSC.
- Q. He, C. H. Liang and S. J. Lippard, Proc. Natl. Acad. Sci. U. S. A., 2000, 97, 5768–5772 CrossRef CAS PubMed.
- M. T. Proetto, C. R. Anderton, D. Hu, C. J. Szymanski, Z. Zhu, J. P. Patterson, J. K. Kammeyer, L. G. Nilewski, A. M. Rush, N. C. Bell, J. E. Evans, G. Orr, S. B. Howell and N. C. Gianneschi, ACS Nano, 2016, 10, 4046–4054 CrossRef CAS.
- R. Derynck and Y. E. Zhang, Nature, 2003, 425, 577–584 CrossRef CAS PubMed.
- N. Baburajendran, R. Jauch, C. Y. Z. Tan, K. Narasimhan and P. R. Kolatkar, Nucleic Acids Res., 2011, 39, 8213–8222 CrossRef CAS PubMed.
- W. Zhang, Y. Jiang, Q. Wang, X. Ma, Z. Xiao, W. Zuo, X. Fang and Y.-G. Chen, Proc. Natl. Acad. Sci. U. S. A., 2009, 106, 15679–15683 CrossRef CAS PubMed.
- K. He, X. Yan, N. Li, S. Dang, L. Xu, B. Zhao, Z. Li, Z. Lv, X. Fang, Y. Zhang and Y.-G. Chen, Cell Res., 2015, 25, 738–752 CrossRef CAS PubMed.
- M. Cheng, W. Zhang, J. Yuan, W. Luo, N. Li, S. Lin, Y. Yang, X. Fang and P. R. Chen, Chem. Commun., 2014, 50, 14724–14727 RSC.
- P. Mandke and K. M. Vasquez, DNA Repair, 2019, 83, 102701 CrossRef CAS PubMed.
- N. Li, Y. Yang, K. He, F. Zhang, L. Zhao, W. Zhou, J. Yuan, W. Liang and X. Fang, Sci. Rep., 2016, 6, 33469 CrossRef CAS.
Footnotes |
| † Electronic supplementary information (ESI) available. See DOI: 10.1039/d0sc06760a |
| ‡ The authors contributed equally to this work. |
| This journal is © The Royal Society of Chemistry 2021 |