
 Open Access Article
 This Open Access Article is licensed under a
 Creative Commons Attribution 3.0 Unported Licence
Imaging non-classical mechanical responses of lipid membranes using molecular rotors†
Miguel
Páez-Pérez
a,
Ismael
López-Duarte
ab,
Aurimas
Vyšniauskas
 ac,
Nicholas J.
Brooks
*a and
Marina K.
Kuimova
*a
ac,
Nicholas J.
Brooks
*a and
Marina K.
Kuimova
*a
aMSRH, Department of Chemistry, Imperial College London, Wood Lane, London, W12 0BZ, UK. E-mail: m.kuimova@imperial.ac.uk; n.brooks@imperial.ac.uk
bDepartamento de Química Orgánica, Universidad Autónoma de Madrid, Cantoblanco, 28049 Madrid, Spain
cCenter of Physical Sciences and Technology, Saulėtekio av. 3, Vilnius, Lithuania
First published on 22nd December 2020
Abstract
Lipid packing in cellular membranes has a direct effect on membrane tension and microviscosity, and plays a central role in cellular adaptation, homeostasis and disease. According to conventional mechanical descriptions, viscosity and tension are directly interconnected, with increased tension leading to decreased membrane microviscosity. However, the intricate molecular interactions that combine to build the structure and function of a cell membrane suggest a more complex relationship between these parameters. In this work, a viscosity-sensitive fluorophore (‘molecular rotor’) is used to map changes in microviscosity in model membranes under conditions of osmotic stress. Our results suggest that the relationship between membrane tension and microviscosity is strongly influenced by the bilayer's lipid composition. In particular, we show that the effects of increasing tension are minimised for membranes that exhibit liquid disordered (Ld) – liquid ordered (Lo) phase coexistence; while, surprisingly, membranes in pure gel and Lo phases exhibit a negative compressibility behaviour, i.e. they soften upon compression.
Introduction
Cellular plasma membranes are known to play a crucial role in determining cell fate and behaviour. In addition to serving as a protective barrier between a cell and its surroundings, it also allows the cell to sense its environment. The plasma membrane is particularly suited to transduce biophysical stimuli such as the morphology and topology of its surroundings, external forces or electromagnetic fields;1–3 as well as to react to these cues. Examples of these responses include alteration of cell shape,4 density,5 mechanical6,7 and electrical8 properties. This has been proven to be crucial in a number of diseases such as cancer, malaria, sickle cell anaemia or atherosclerosis (AS).9,10 It has been therefore proposed that studying these diseases from a mechanical point of view, as an alternative to traditional biochemical-based approaches,11–13 may provide a more robust biophysical understanding of these conditions, leading to a better understanding of the disease, as well as diagnosis and treatment.In the simplest case, the cell membrane could be modelled as a two-dimensional fluid lipid bilayer, embedding various proteins.14 Such bilayer can be characterized by its microviscosity η, which is proportional to the degree of lipid packing. Lipid packing is determined by the membrane tension, σ, the overall result of repulsive and attractive forces between lipid molecules.15,16 In steady state conditions σ tends to be minimised, which for membranes composed of a mixture of lipids may lead to the emergence of phase-separated domains. Although there is still some debate on the underlaying explanation for the heterogeneous organization of lipid membranes, the most commonly accepted reasons include reducing the hydrophobic mismatch between different lipids,17–19 van der Waals interactions between lipid molecules and entropy of the lipid acyl chains20 or local membrane curvature.21,22 The resulting lateral organisation of the plasma membrane is of great importance in signal transduction, as acknowledged in the ‘lipid raft’ hypothesis,23 which suggests that cholesterol-rich, more viscous microdomains of increased order in the cell membrane act as signalling and trafficking hubs.
However, the membrane's tension (and therefore viscosity) can change under the application of external stress, such as pressure,24,25 stretching26,27 or shearing.28,29 According to conventional mechanics, tensile efforts decrease lipid packing and membrane microviscosity, while compressive forces should have the opposite effect. Yet, several studies suggested that in practice a different behaviour is observed. For instance, while lipid packing was found to decrease under shear,30,31 the response to micropipette and osmotic tensioning of model membranes was heterogenous and depended on the lipid composition and the probing method.32–34 In fact, increased tension has been shown to trigger phase separation, to reorganize lipid domains and to determine their size and shape.26,27,32,35,36 On the other hand, pressure-induced phase separation has also been observed37 as well as an increase of the lipid packing of the Ld phase for single component membranes,38 whereas when Ld and Lo regions coexisted, packing of the more viscous Lo domains was increased instead.24 Furthermore, it has been proposed that solid gel domains may undergo pressure-induced softening,39 an unconventional mechanical response which may be a determinant step in the function of auditory hair cells.40 All in all, these results suggest there is a lipid-organization dependent response to external stress that warrants further studies.
Common ways to quantitatively evaluate membrane fluidity and microviscosity, such as fluorescence correlation spectroscopy,41 fluorescence recovery after photobleaching42 or single particle tracking,43 are not easily compatible with mapping large sample areas. Furthermore, their time resolution is limited, which prevents them from monitoring dynamic processes. On the other hand, environmentally sensitive fluorescent probes avoid these limitations. For example, Laurdan-based probes are frequently used to monitor lipid packing and phase by detecting changes in the bilayer's polarity, associated with accessibility to water.31,44,45 However, membrane microviscosity and polarity are not necessarily coupled.46 Molecular rotors have emerged as true viscosity-sensitive molecular probes which promise to overcome the issues outlined above by directly providing fast and quantitative spatiotemporally-resolved mapping of the lipid bilayer's microviscosity.47–51
The working principle of molecular rotors is based on the fact that the efficiency of the non-radiative decay in these fluorophores is coupled to the intramolecular motion of the rotor. Following excitation in less viscous environments, in which the intramolecular motion is not restricted, non-radiative decay becomes the predominant deactivation channel, leading to a decrease in the fluorescence quantum yield (Φf, eqn (1))50,52 and lifetime (τf, eqn (2))50,53 at lower viscosities, as expressed by the Förster–Hoffmann equation:54
 | (1) |
| τf = zηα | (2) |
In this work, thiophene-based molecular rotors (Fig. 1)56,62 are used to investigate how the bilayer composition affects the viscosity response of model membranes under osmotically induced stress. The ability of this probe to equally partition between the less viscous lipid disordered (Ld) and more tightly packed lipid ordered (Lo) phases56 allows to efficiently monitor the effect of membrane stress on both of these regions, via FLIM. This is particularly important, since this probe allows to directly study the Lo phase that makes up highly ordered membrane microdomains, the transduction hubs thought to play a key role in a number of diseases such as atherosclerosis.28,44,63
 | ||
| Fig. 1 Molecular structure of the thiophene dye 1 used in this work (a) and its time-resolved decay traces in toluene/castor oil mixtures of variable viscosity (b) and in lipid bilayers (DOPC and DPPC LUVs), (c). Dashed line in (c) represents DPPC gel to liquid transition temperature. | ||
Results and discussion
Thiophene-based molecular rotors as viscosity sensors
The thiophene-based dye 1, Fig. 1, has been previously shown to retain in cell plasma membranes of cultured mammalian cells and was suggested as a sensor of membrane potential.62 At the same time, dye 1 has been shown to have molecular rotor properties, displaying a reduced fluorescence lifetime upon the fluidification of lipid bilayers.56In order to quantify viscosity sensitivity of 1 we measured the steady state and time-resolved fluorescence responses of the dye in castor oil/toluene calibration mixtures. While these mixtures have similar polarity to DOPC-based lipid membranes,56 their viscosity can be varied between 2–1000 cP by varying their composition and temperature. Furthermore, by utilising these mixtures, the temperature effect on the photophysical behaviour of these dyes can be directly investigated.53
Emission spectra and time-resolved decay traces of 1 were recorded, and the intensity-weighted average lifetime (τw) was calculated for a biexponential fit according to:
 | (3) |
A log–log plot of τw against viscosity showed a clear increase in lifetime and fluorescence intensity with increased viscosity (Fig. 1 and S1†), together with a small temperature-dependent offset. The small offset may be due to the direct temperature sensitivity of 1 (Fig. 1).52,53 In any case, this data indicate that we must perform our measurements at a fixed temperature, to be able to trust the calibration values of our viscosity sensor.
We also studied the viscosity-sensitive behaviour of dye 2, where the acetylenic bridge of 1 is substituted for its olefinic counterpart (Fig. S2a†). The motivation for comparing dyes 1 and 2 came from the fact that both 1 and 2 localise in the plasma membranes of live cells and are suitable as second harmonic generation (SHG) microscopy probes, while 2 has a higher quantum yield, which is beneficial for imaging applications.62 However, our data indicates that 2 is not significantly sensitive to viscosity (Fig S2b–f†).
We used 1 incorporated in model membranes to record the membrane response to temperature variations. A temperature decrease results in a gradual increase in fluorescence lifetime of 1 incorporated into DOPC vesicles, corresponding to a smooth increase in microviscosity. Conversely, in a DPPC bilayer, a liquid-to-gel phase transition could be seen at 41 °C, by monitoring a change in the gradient of lifetime/temperature slope (Fig. 1). Furthermore, the increased membrane hydration upon fluidification56,62,64 is evidenced by a slight red shift in fluorescence spectra of 1 (Fig. S3c†). The microviscosity and polarity sensitivity of 1 was also confirmed in phase-separated GUVs composed by DOPC, DPPC and cholesterol (Fig. S4†). Overall, in these simple model membranes, 1 responds as expected from a viscosity-dependent molecular rotor.
Effect of lipid composition on the stress response of LUVs
As mentioned above, the stress response of lipid bilayers appears to strongly depend on lipid composition. We set out to use molecular rotor-based FLIM to directly monitor microviscosity of lipid membranes upon compression and stretching, induced by osmotic gradients, including in phase-separated membranes. The use of a single probe that equally partitions to lipid domains of varied packing56 would enable us to follow trends in microviscosity quantitatively. The use of diffraction-limited fluorescence lifetime-based microscopy together with GUVs will also allow to monitor domain emergence and disappearance directly, as well as their microviscosity.We compared lifetimes of 1 against the tension created by an osmotic gradient (isotropic stress, see ESI† for membrane tension calculation) in DOPC/DPPC/cholesterol membranes with varying percentages of each lipid (Fig. 2 and S5†). Two notably unexpected behaviours were observed: (i) negative compressibility of membranes in the solid gel and liquid-ordered phases and (ii) tension buffering via strain-hardening in membranes displaying Lo/Ld phase coexistence.
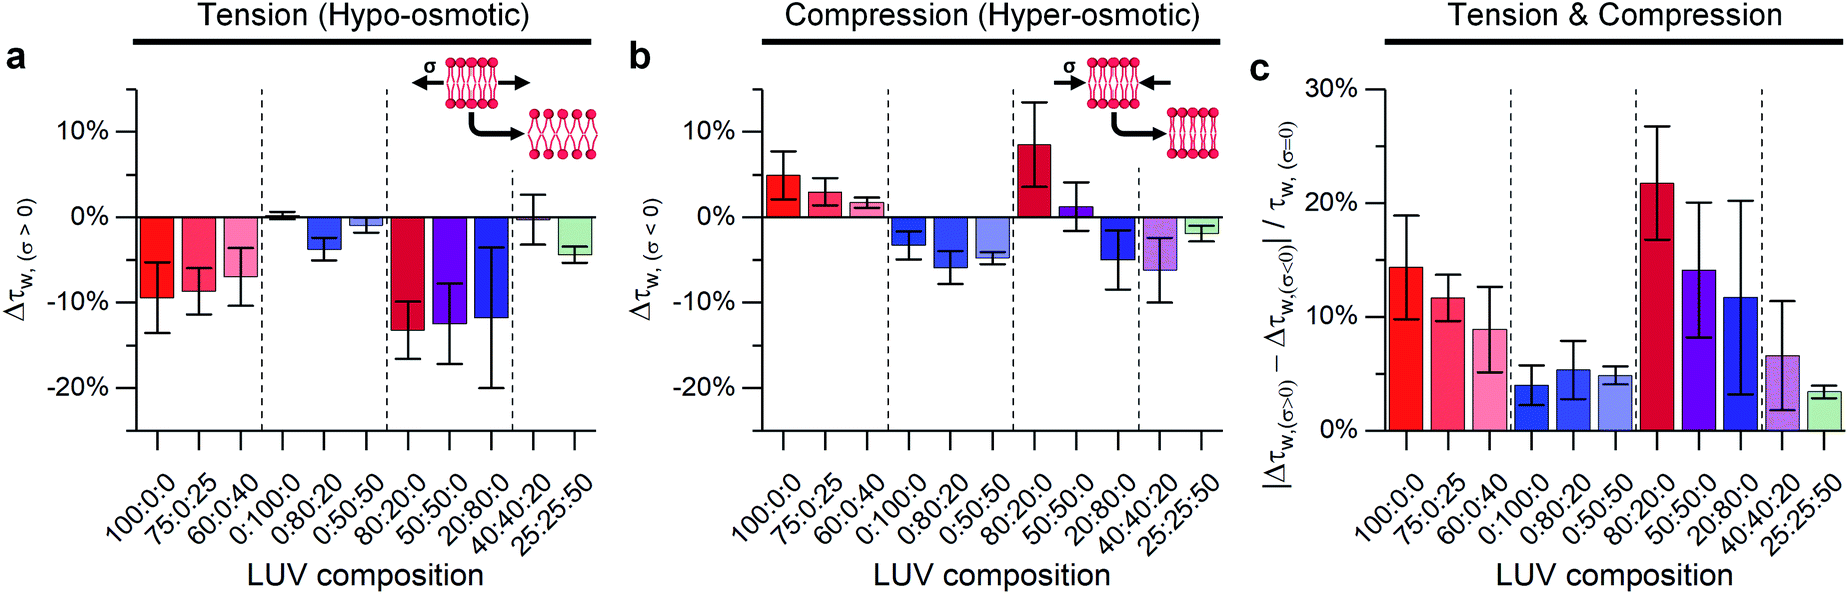 | ||
Fig. 2 The effect of DOPC![[thin space (1/6-em)]](https://www.rsc.org/images/entities/char_2009.gif) :DPPC:cholesterol ternary LUV composition on lifetime variations of 1 expressed as: Δτw = (τw/τw,σ=0) − 1 compared at 23 °C to iso-osmotic conditions for (a) membrane tension (ΔC = 0.36 M, σ = 0.098 mN m−1); (b) membrane compression (ΔC = −1.08 M, σ = −0.063 mN m−1) and (c) difference between hypo- and hyper-osmotic lifetime divided by lifetime under iso-osmotic conditions. Inset shows the expected change in lipid packing for a membrane following classical mechanics. Bars show mean ± S.D (n = 3). :DPPC:cholesterol ternary LUV composition on lifetime variations of 1 expressed as: Δτw = (τw/τw,σ=0) − 1 compared at 23 °C to iso-osmotic conditions for (a) membrane tension (ΔC = 0.36 M, σ = 0.098 mN m−1); (b) membrane compression (ΔC = −1.08 M, σ = −0.063 mN m−1) and (c) difference between hypo- and hyper-osmotic lifetime divided by lifetime under iso-osmotic conditions. Inset shows the expected change in lipid packing for a membrane following classical mechanics. Bars show mean ± S.D (n = 3). | ||
Negative compressibility of gel phase membranes
Initially, binary composition lipid bilayers containing either DOPC:cholesterol or DPPC:cholesterol were subjected to both tensile and compressive stress. Pure DOPC vesicles followed classical mechanics, decreasing their microviscosity under hypo-osmotic (i.e. increased tension due to water influx) and increasing microviscosity under hyper-osmotic (i.e. compression due to water efflux) conditions. However, by adding cholesterol, the resilience of the membrane properties to mechanical stress was increased, Fig. 2c. Cholesterol is known to insert in the Ld phase, filling free space created by the DOPC double bonds65,66 and increasing lipid ordering.32,46,67 This increased ordering is reflected in longer lifetimes recorded for 1 in the bilayers in the presence of cholesterol (Fig. S5†). In our experiments we see a significant reduction in the change of lifetime of 1 under osmotic shock in the presence of cholesterol (0% Chol > 25% > 40%, Fig. 2). Based on this data we hypothesise that cholesterol insertion could sterically resist DOPC chain compression. However, a higher amount of cholesterol was required for buffering hypo-osmotic induced tension; suggesting that a minimum cholesterol fraction is required to effectively rigidify the membrane against tensile stress, Fig. 2a.
In contrast to DOPC LUVs, DPPC LUVs remained unchanged under tension, Fig. 2a, probably owing to the stronger Van der Waals interactions between DPPC molecules in gel phase.68 On the contrary, bilayer compression resulted in a decrease of lifetime of 1, an unexpected result that suggests DPPC membranes become more laterally disordered and soften under pressure, a behaviour referred to as negative compressibility. Additional experiments were also performed to rule out possible artefacts due to a pressure-induced displacement of 1 out of the membrane69 (Fig. S6†).
Adding cholesterol to DPPC membranes leads to an increase in the lifetime of 1 (Fig. S5†), this is likely to be due to a local ordering effect of cholesterol65,70 or closer association between the rotor and the lipid's hydrocarbon tail.56 However, adding cholesterol did not alter the membrane's response to compression (Fig. 2), presumably because the lipid chain conformational order is not significantly reduced by cholesterol. On the other hand, DPPC:cholesterol LUVs became more fluid when subjected to tensile stress, leading to a behaviour akin to Ld phase of DOPC.
Our working hypothesis is that highly ordered lipid bilayers (e.g. gel phase of DPPC) soften with increased pressure, as previously predicted theoretically by Diggins IV et al.39 As opposed to DOPC, tightly packed gel-phase DPPC membranes cannot undergo further compaction due to the lack of free volume that was provided by DOPC unsaturation. Instead, the resulting excess lipid might create highly curved membrane protrusions.71,72 The likelihood of membrane buckling is discussed further in the ESI.†
We performed small- and wide-angle X-ray diffraction (SAXS/WAXS) experiments on DOPC and DPPC hydrated bilayer stacks under hydrostatic pressure (0–200 MPa) to further investigate this hypothesis (Fig. 3). Changes in the bilayer thickness were probed by SAXS, while WAXS was used to investigate changes in lipid packing density (i.e. area per lipid). Because the position of the diffraction peaks in the small angle region arises from both the bilayer thickness (dHH) and the water layer in between lamellae, we followed the procedure suggested by Rappolt et al.73 to estimate the actual bilayer thickness.
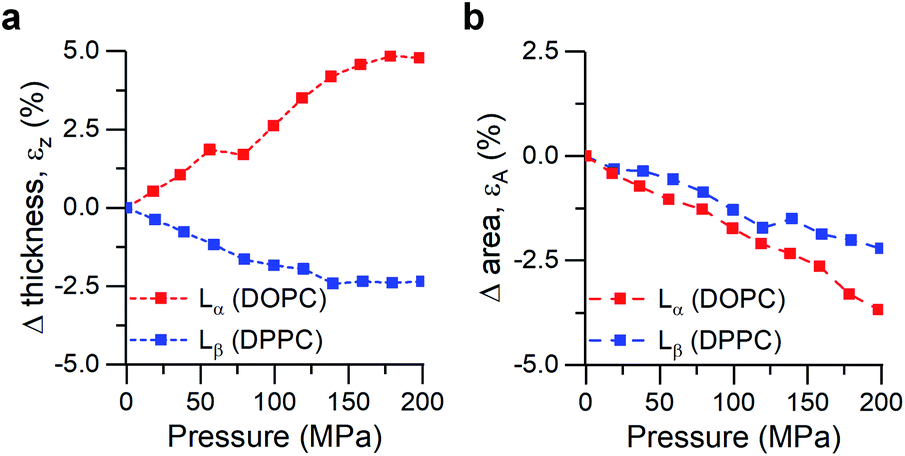 | ||
| Fig. 3 Calculated strains from SAXS/WAXS traces for DOPC and DPPC bilayers under pressure. (a) Strain normal to the membrane plane, defined as εz = ΔdHH/dHH,0, (b) Area strain of the membrane plane, defined as εA = ΔA/A0. See ESI† for detailed information. | ||
Increased pressure resulted in lateral compression of unsaturated DOPC bilayers, as evidenced by the negative area strain εA (Fig. 3b), which in turn caused a membrane thickening (positive εz, Fig. 3a) of around 5%, in agreement with our previously published work.74 This negative linear compressibility normal to the bilayer surface is a result of the anisotropic structure of the oriented lipid molecules which have a relatively high bulk modulus but significantly higher lateral compressibility due to the ability of the hydrocarbon chains to reduce their conformational disorder and consequently straighten out.
Gel phase DPPC molecules also increased their packing, albeit to a lesser extent, as was predicted by their lower area compressibility module. WAXS traces showed that increased pressure caused the peak maxima to shift towards higher q-values (increased lipid packing, Fig. 3b), and to change from the characteristic “peak and hump” shape of the tilted gel Lβ′ phase to a broader peak (similar to that of a rippled Pβ′, Fig. S7†). This effect was reversible once the pressure was reduced.
It has been previously hypothesized that the ripple phase (whose corrugations could be thought as membrane buckles) contains regions of lower order,75 in accordance with our observations of negative compressibility using the molecular rotor 1. Furthermore, contrary to the fluid DOPC bilayers, increased pressure on DPPC bilayers resulted in an overall reduction in their thickness (Fig. 3a), in agreement with previous reports using reduced temperature76,77 (equivalent to an increase in pressure according to the Clapeyron equation78).
In fact, the decrease of both bilayer thickness and lipid area indicates a negative Poisson ratio79 for the gel membranes (see ESI†).80 Thus, both X-ray data and the molecular rotor-based fluorescence data corroborate our conclusion of negative compressibility of DPPC in the gel phase.
Lo/Ld mediated stress buffering
We investigated binary DOPC:DPPC mixtures, where the coexistence of solid and liquid disordered domains was expected. For these compositions, the response to tension was similar for all DOPC:DPPC ratios: in all cases decrease in membrane microviscosity was observed under tension, same as for pure DOPC LUVs. We hypothesise that despite significant amounts of DPPC present, the presence of even a small amount of unsaturated lipid molecules may be able to disrupt long-range order in the bilayer, allowing the membrane to stretch.
In contrast, the response to membrane compression gradually changed with increasing DPPC content, resulting in a lower increase in membrane microviscosity. Eventually, negative compressibility behaviour was observed for DOPC:DPPC ≤ 20:80. This might indicate that even low amounts of unsaturated lipid would buffer the compression forces before they are transmitted to the Lo phase.
Adding cholesterol turns the gel Lβ to liquid ordered Lo phase, altering the membrane's behaviour. As shown in Fig. 2 LUVs with a 40:40:20 composition (which exhibit Lo/Ld phase coexistence) have an almost null decrease in microviscosity when subjected to tensile efforts, while compression, instead, triggers a decrease in membrane microviscosity. Yet, if cholesterol content is further increased to 50% of total lipid composition, a smaller change in lipid packing is observed, which we interpret as an increased buffering of compressive forces.
In summary, when no cholesterol is present (50:50:0 DOPC:DPPC:cholesterol LUV composition), the solid-like DPPC domains are not able to participate in stress buffering and a DOPC-like response is observed. On the other hand, when cholesterol is present, both Ld and Lo phases coexist, and they can rearrange upon tractive or compressive stress application;24,35 minimising the effect of tractive stress. However, further increasing the amount of cholesterol further decreases the free space between lipid molecules, favouring buffering of compressive forces instead.
The importance of highly ordered membrane regions in stress buffering is highlighted in Fig. 4. At room temperature, when phase-separated membranes were formed, we observed tension buffering under tension and negative compressibility under compression. However, above the membrane's Tm (45 °C, i.e. single Ld phase) the response of both 40:40:20 and 25:25:50 LUVs was similar to DOPC ones (Fig. 4 and S8†). 40:40:20 LUVs were unable to buffer tension stress and the negative compressibility properties were lost for both 40:40:20 and 25:25:50 membranes. Even though these measurements were performed at a different temperature, we are confident in the trends observed, due to (i) these being relative measurements vs. zero tension and (ii) only a small effect of temperature on the photophysics of 1, Fig. 1.
 | ||
| Fig. 4 Effect of cholesterol content and temperature on buffering of membrane stress in ternary DOPC:DPPC:cholesterol LUVs. Clear bars represent data at T = 23 °C; dashed bars represent data from a single phase at T = 45 °C. Bars show mean ± S.D. (n = 3). | ||
FLIM gives insight for Lo/Ld stress buffering mechanism
In order to gain direct evidence on the domain's behaviour upon changes in osmotic pressure, the microviscosity changes for phase separated GUVs were examined via FLIM.Initially, pure DOPC GUVs were used to validate the previous results. Under zero tension, lifetime of 1 was slightly higher for DOPC GUVs than for LUVs of identical composition (Fig. 5), possibly due to DOPC oxidation during the electroformation process or smaller number of bilayer defects in GUVs compared to LUVs,81 which can increase membrane microviscosity.82
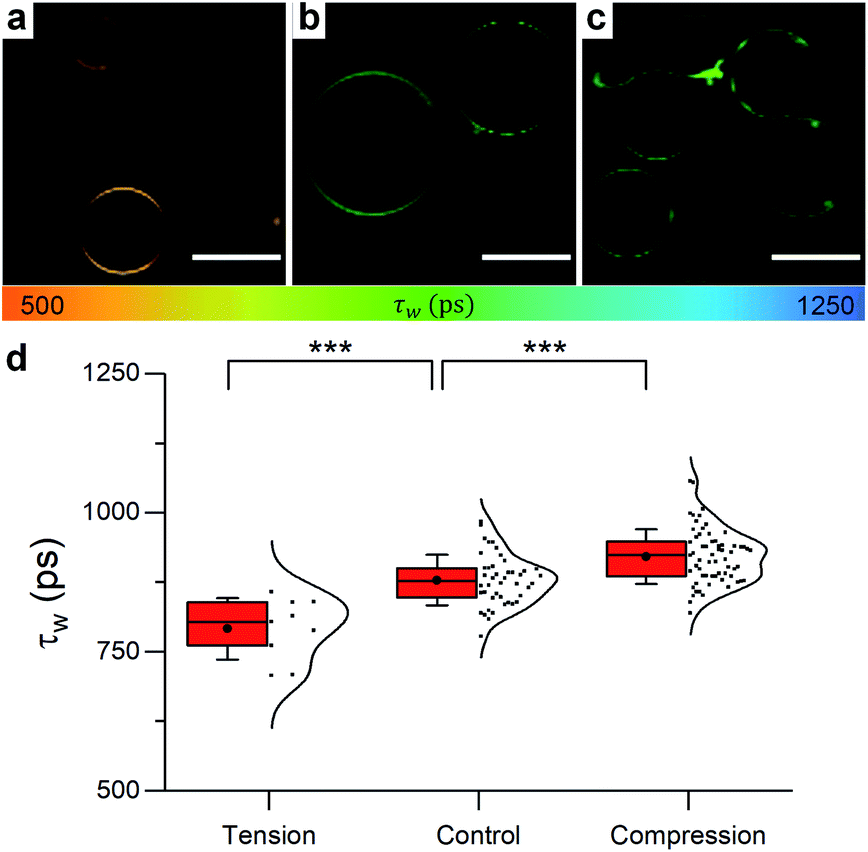 | ||
| Fig. 5 Example FLIM images of DOPC GUVs under (a) hypo-osmotic (ΔC = 0.18 M) (b) iso-osmotic (ΔC = 0 M) and (c) hyper-osmotic (ΔC = −0.36 M) conditions. (d) Average GUV τwn ≥ 10. Scale bar: 30 μm. | ||
When osmotic stress was applied to these single-phase vesicles, the observed behaviour was identical to that in LUVs, i.e. DOPC GUVs microviscosity decreased with increased tension. In addition, stretching the membrane porated some of the vesicles, while compressing it led to excess area that was sometimes relieved by ejection of smaller lipid structures (Fig. S9†). Furthermore, the change in the lifetime of 1 was more pronounced when the bilayer was stretched, consistent with the existing theory (Fig. S15†).
A real advantage of our approach is being able to directly monitor phase separation and the corresponding microviscosity changes in both phases, with diffraction-limited resolution. In 40:40:20 DOPC:DPPC:cholesterol GUVs Lo/Ld phase coexistence was detected, and the lifetime of 1 in the Ld phase was higher than that of pure DOPC as shown in Fig. 6. This observation is consistent with cholesterol partitioning in the Ld phase,70 and in agreement with the observed lifetimes of 1 in DOPC:cholesterol LUVs (Fig. S5†).
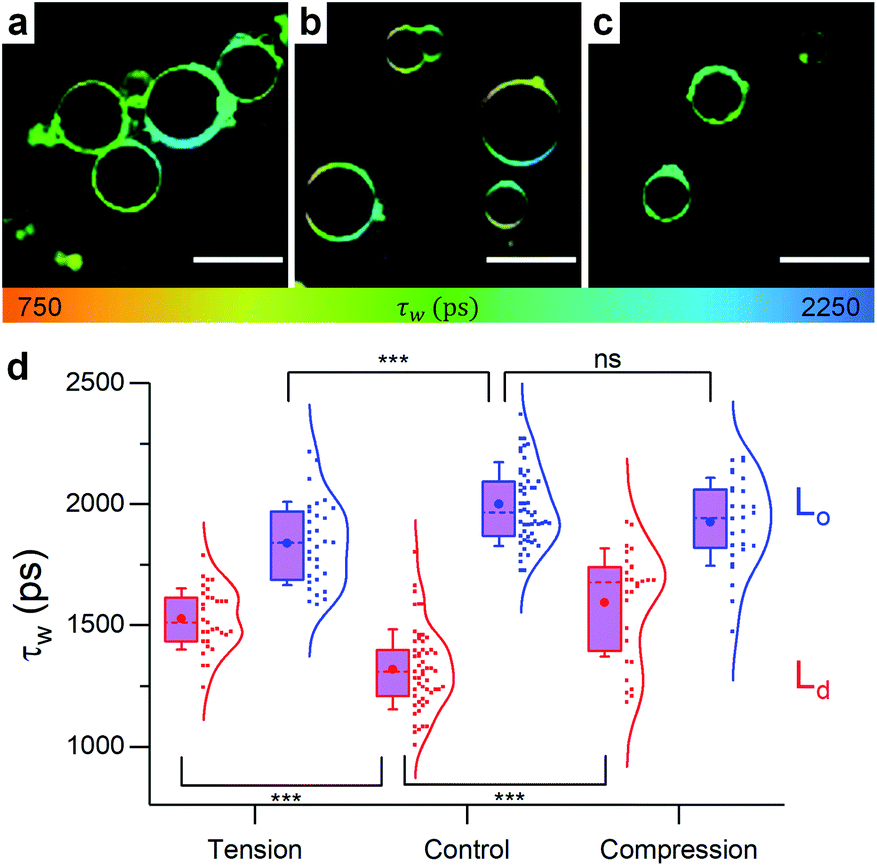 | ||
| Fig. 6 Example FLIM images of 40:40:20 DOPC:DPPC:cholesterol GUVs under (a) hypo-osmotic (ΔC = 0.18 M) (b) iso-osmotic (ΔC = 0 M) and (c) hyper-osmotic (ΔC = −0.36 M) conditions. Lo/Ld coexistence is evident, τw for Ld and Lo phases are shown in (d). n ≥ 10. Scale bar: 30 μm. | ||
In contrast to pure DOPC GUVs, when stretched, pore formation was not frequently observed in phase separated GUVs (Fig. S9†) and the overall microviscosity of phase-separated GUVs remained unchanged, Fig. S10,† in agreement with the LUV data. However, the microviscosity of the Ld phase increased while that of the Lo decreased, yet separated domains could still be visualised (Fig. 6). The increase of viscosity of the Ld phase upon stretching is an unexpected result and it was not observed in any of the DOPC:cholesterol LUV compositions tested, indicating that the presence of saturated lipid is crucial for this behaviour. This result was further confirmed by studying ternary lipid compositions where DPPC was substituted with EYSM, where, again, an increase in Ld phase viscosity upon tension was observed (Fig. S11†).
The increase in membrane rigidity and microviscosity, assuming both are determined by lipid packing density, with increasing tension is known as the strain-hardening effect, which has been reported to take place in red blood cells (RBCs) and endothelial cells under tension (from hypo-osmotic shock83 or high shear84,85), as well as in malaria-infected RBCs.86 This behaviour has been usually attributed to a rearrangement of cytoskeletal fibres: either actin87 or intermediate filaments (keratin).84,88
To our knowledge, however, our work is the first instance were the strain-hardening effect has been mapped in model bilayers, in the absence of cytoskeleton. As suggested by our data, the strain-hardening effect is mediated by lipid diffusion from Lo domains into the Ld matrix. This is supported by both the higher frequency of domain merging seen in GUVs (i.e. the number of vesicles in which no phase separation could be identified, Fig. S12†) and the FRET domain mixing assay performed on LUVs (Fig. S13†). Both assays further confirm the tension buffering via Lo-mediated diffusion hypothesis and agree with existing work where lipid domains were suggested to act as lipid reservoirs, key for stress buffering in Langmuir monolayers.89–91 These observations could be important in biology, aside from the effect on membrane mechanics, since the disruption of more ordered domains under tension was proven to trigger mechanosensitive signalling cascades in eukaryotic cells.92,93
On the other hand, membrane compression resulted in the increase of Ld viscosity while no change was seen for the Lo phase (Fig. 6). The net result in GUVs, therefore, is a slight increase of the average lifetime of 1, compared to the decrease observed in LUVs. Based on Fig. S9 and S12,† it appears that GUVs with a 40:40:20 DOPC:DPPC:chol composition react to osmotic pressure by ejecting lipid material as a mechanism for stress relieve, as was previously suggested in a number of studies.94–96
We hypothesize that budding off and membrane fission are the dominant mechanisms for relieving compression stress in GUVs. This process may be less likely in the case of significantly smaller LUVs. Additionally, lipid buds that were formed in LUVs will still be detected by a bulk spectroscopic measurement and therefore the pressure-induced softening may not be observed. The transition from the bilayer's buckling to budding and fission would be further facilitated by the higher compressive forces experienced by GUVs (Fig. S15†).
Further increasing cholesterol concentration to 50% (25:25:50 DOPC:DPPC:Chol GUVs) resulted in a single Lo phase (Fig. S14†). In this case, however, the average GUV viscosity increased under both tensile and compressive stress; contrary to what was seen in experiments using LUVs (Fig. 2). The increase in ordering under tension can be explained by the emergence of phase-separated domains,32 less likely to form in more curved membranes (as highly ordered domain formation is favoured in planar geometries21,22). Above ΔC = 0.18 M, the microviscosity of the new Lo phase is similar to the one measured in the 40:40:20 GUVs, however the lifetime of 1 in the Ld phase is significantly increased. This could be due to the increased fraction of cholesterol partitioning in the DOPC rich phase.70 The increase in viscosity under compression could be compared to that in 40:40:20 GUVs. As stress is released by fission of membrane buds, the curvature-induced softening of the more ordered Lo phase is not triggered and, instead, an increase of the overall viscosity due to compression of the unsaturated lipid chains is observed.
It must be noted though that results obtained by FLIM imaging should be interpreted with care. The spatial resolution is limited (particularly due to pixel binning required to attain a level of signal necessary for lifetime fitting), which can prevent the detection of smaller domains.
Based on all our results, in LUVs and in GUVs, we propose two mechanisms by which lipid bilayers can minimize mechanical stress (Fig. 7):
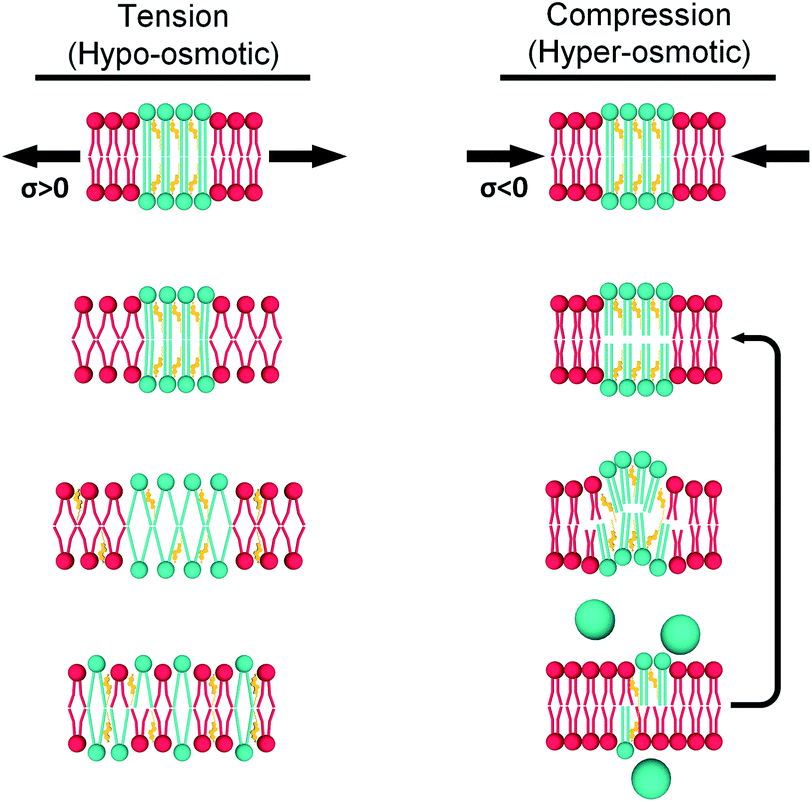 | ||
| Fig. 7 Hypothetical mechanisms for tension (left) and compression (right) buffering. When tension is applied, the Ld phase (red) expands and tension is ultimately transmitted to the Lo domains (green). Enough tension would decrease lipid packing in the Lo phase, but this is unfavourable and instead the Lo phase solubilizes into the Ld matrix. In contrast, increased compression would initially increase packing of DOPC molecules in the Ld phase. This would be followed by buckling out of the Lo domains and, eventually, ejection of excess lipid to relieve membrane stress (the last step is more likely to happen in larger GUVs). | ||
(1) Under load, unsaturated lipids with lower area expansion modulus (KA) such as DOPC,97 will be the first to deform. This is reflected by a change in viscosity of the Ld phase.
(2) The membrane stress will be ultimately transferred to the Ld/Lo interface, and the more ordered domains will respond differently for tension and compression forces.
Conclusions
By using viscosity sensitive probes, molecular rotors, that effectively incorporate in all lipid phases formed in DOPC:DPPC:cholesterol vesicles of varied compositions, our results suggest that lipid membranes behave as complex materials, which show non-classical mechanical behaviour. Particularly, bilayers showing Lo/Ld phase separation can buffer tensile efforts, while gel phases show negative compressibility under pressure. The former, considered a prototype for lipid rafts, emphasises their possible role in maintaining the cell's adaptability to external stress.
Materials and methods
Lipids 1,2-dioleoyl-sn-glycero-3-phosphocholine (DOPC), 1,2-dipalmitoyl-sn-glycero-3-phosphocholine (DPPC), 1-palmitoyl-2-oleoyl-sn-glycero-3-phosphocholine (POPC), 1,2-diphytanoyl-sn-glycero-3-phosphocholine (DPhPC), egg yolk sphingomyelin (EYSM) and biotinylated 1,2-dipalmitoyl-sn-glycero-3-phosphoethanolamine (Biotin@PE) were purchased in powder form from Avanti Polar Lipids® and resuspended in chloroform (20 mM) before use. Fluorescent lipids 1,2-dipalmitoyl-sn-glycero-3-phosphoethanolamine-N-(lissamine rhodamine B sulfonyl) (ammonium salt) (Rh@PE) and 1,2-dioleoyl-sn-glycero-3-phosphoethanolamine-N-(7-nitro-2-1,3-benzoxadiazol-4-yl) (ammonium salt) (NBD@PE) were obtained as chloroform solutions (1 mg mL−1) from Avanti Polar Lipids®. The thiophene-based dyes 1 and 2 were synthesised according to the previously published procedure.62 Stock solutions of 1 were prepared in DMSO (3 mM) or in CHCl3 (300 μM). All other reagents were purchased from Sigma Aldrich® or VWR and used without further purification. Solvents for fluorescence studies were of spectrophotometric grade.Rotor calibration
Mixtures of 0, 40, 90 and 100% (v/v) of castor oil in toluene were prepared, and 1 was dissolved to a final concentration of 6 μM by heating each solution above 70 °C. Time resolved fluorescence decays were measured from each of these solutions as described below at a range of temperatures 20–60 °C, providing a viscosity range of 2–1000 cP.52Large unilamellar vesicle (LUV) formation
A dried lipid film was created by mixing the lipid stock solutions at the appropriate DOPC:DPPC:cholesterol molar ratio. An aliquot of 1 or BODIPY molecular rotor (both 1 mM in CHCl3) were added at a 1:400 dye:lipid ratio, before using a rotary evaporator to remove the solvent and to create a lipid film. Deionised water or 0.4 M aqueous sucrose solution, for osmotic pressure experiments, were then added to hydrate the film to a final concentration of 1 mM lipid. The mixture was then vortexed and extruded 21 times through a 200 nm (unless otherwise stated) polycarbonate filter (Avanti Polar Lipids®).
Alternatively, pure lipid vesicles were prepared as described above and an aliquot of 1 in DMSO (1 mM stock solution) was externally added to achieve 1:400 dye:lipid ratio. The final concentration of DMSO was 0.5% v/v. The mixtures were incubated for at least 15 min above the melting temperature of the lipid (Tm). This was done to better mimic experiments involving cells, where the rotor is added to the plasma membrane from the aqueous phase. At these conditions, an excellent linear cross-calibration of the fitted lifetime of 1 with that of the well characterized BODIPY rotor56 (Fig. S16†) is seen, confirming its usefulness as a molecular rotor.
LUVs were then diluted by a factor of 10 (using aqueous solutions of different glucose concentration for osmotic pressure experiments) before the measurement. Dynamic Light Scattering (Malvern Panalytical, Zetasizer Ultra) was used to confirm vesicle size to be within the expected range (∼180 nm for 200 nm extrusion filter, data not shown).
Giant unilamellar vesicle (GUV) formation
30 μL of a 1 mg mL−1 lipid solution (of the appropriate DOPC:DPPC:cholesterol ratios (DPPC was substituted for EYSM when indicated), supplemented with 1% Biotin@PE and either 0.5% Rh@PE or 1% of 1 in CHCl3 at 1 mM) was spread onto a heated ITO slide. After drying for >1 h in a desiccator, a chamber was created by placing a polydimethyl siloxane (PDMS) spacer (∼2 mm thick) on top, which was then filled with 0.4 M sucrose solution and sealed with a second ITO slide. An electric field of 1.5 Vpp@10 Hz was applied for 90 min, followed by a detachment phase of 1.5 Vpp@2 Hz for 30 min. GUVs were diluted ten-fold before imaging.
Osmotic pressure experiments
Vesicles containing 0.4 M sucrose were diluted ten-fold in solutions with different glucose concentration, creating an osmotic gradient. Measurements were carried out after at least 5 min equilibration time. For the FRET experiments, the lipid mixture in CHCl3 was doped with 0.2%mol NBD-PE and 2%mol Rh-PE before creating the lipid film.Fluorescence spectra and lifetime measurements
Samples were placed in quartz cuvettes (10 mm path length). A Horiba Yvon Fluoromax 4 fluorimeter was used to record the emission spectra under 467 nm (for pure 1) or 460 nm (for FRET experiments) excitation, which were corrected for the wavelength-dependent emission detection sensitivity. Time resolved fluorescence decay traces of 1 were acquired using a Horiba Jobin Yvon IBH 5000 F time-correlated single photon counting (TCSPC) instrument with detection at 570 ± 32 nm or 650 nm ± 8 nm, for LUVs and castor oil/toluene, respectively, after 467 nm pulsed excitation (NanoLED). In the case of BODIPY rotor, a 404 nm pulsed laser was used, and the emission was recorded at 515 ± 32 nm. Acquisition was stopped after peak counts reached 10000, and the resulting traces were fitted to a biexponential decay using DAS® software. Temperature was controlled either with a Peltier cell (fluorimeter experiments, error: ±0.5 °C) or a water bath (TCSPC, error: ±1 °C) and samples were left to equilibrate for at least 5 min before each measurement.
Widefield microscopy
Observation chambers were made with a PDMS well and glass was coated with BSA@biotin-streptavidin to immobilize the GUVs. A Nickon Eclipse TE2000-E inverted microscope was used to acquire phase contrast and fluorescence images. Excitation was provided by a mercury arc lamp together with suitable filters.Fluorescence lifetime imaging microscopy (FLIM)
A Leica TSC SP5 II inverted confocal microscope with a 63× water immersion objective (NA: 1.2) was used to acquire lifetime images. Two-photon excitation at 900 nm was provided by a Ti:sapphire laser (Coherent, Chameleon Vission II 80 MHz), and fluorescence emission was collected between 500–700 nm. FLIM images were recorded using a TCPSC card (Becker and Hickl GmbH, SPC-830) with a size of 256 × 256 pixels and 256 channels. The IRF was obtained by measuring second harmonic generation (SHG) signal from urea. SPCImage (Becker & Hickl GmbH®) was used to fit the decays, ensuring a minimum of 200 counts per pixel (after binning). Sample preparation was the same as with wide-field microscopy.Lifetime classification into lipid phases
A custom-built MATLAB® script was used to identify phase separation. Briefly, GUVs were manually selected, and a lifetime histogram was created from the resulting ROI. Lifetimes were then divided into 3 groups using K-means classification (ensuring a threshold difference between them) and the groups were manually assigned to either Ld/Lo phase or to a single phase. The middle cluster was assigned either to one of the phases or remained separated (in which case it was considered as an intermediate viscosity state between the Ld and Lo regions).Sample preparation for X-ray measurements
A dry sample of a given lipid mixture (20 mg final lipid mass) was hydrated with excess water (70%) and subjected to ten freeze–thaw cycles to ensure proper lipid mixing. The sample was then loaded into 2 mm diameter polymer capillary tube, sealed with a rubber stopper, and stored at 4 °C until further use.High pressure X-ray diffraction
SAXS and WAXS measurements were carried out at beamline I22 at Diamond Light Source (UK) using a custom-built high-pressure cell. Radial integration of 2D SAXS and WAXS patterns gave the scattering intensity profiles. Peak intensity and position were obtained after baseline subtraction and fitting to one or two Voigt functions using a custom-built MATLAB® script. See ESI† for more details.Statistical analysis
Data is shown as mean ± S.D. Box plots display the 25–75% range, error bars represent ±S.D., median is shown by a horizontal line and mean by a dot. Origin® software was used to perform one-way ANOVA test. *p < 0.05; **p < 0.01; ***p < 0.001.Conflicts of interest
There are no conflicts to declare.Acknowledgements
MPP acknowledges the Engineering and Physical Sciences Research Council (EPSRC) and the British Heart Foundation (BHF) for the Doctoral Training Studentship from the Institute of Chemical Biology (Imperial College London). M. K. K. is grateful to the EPSRC for a Career Acceleration Fellowship (EP/I003983/1).Notes and references
- V. Zablotskii, T. Polyakova and A. Dejneka, BioEssays, 2018, 40, 1–10 CrossRef.
- R. H. W. Funk and T. K. Monsees, Cells Tissues Organs, 2006, 182, 59–78 CrossRef.
- V. Ruprecht, P. Monzo, A. Ravasio, Z. Yue, E. Makhija, P. O. Strale, N. Gauthier, G. V. Shivashankar, V. Studer, C. Albiges-Rizo and V. Viasnoff, J. Cell Sci., 2017, 130, 51–61 CrossRef CAS.
- A. Ron, E. U. Azeloglu, R. C. Calizo, M. Hu, S. Bhattacharya, Y. Chen, G. Jayaraman, S. Lee, S. R. Neves-Zaph, H. Li, R. E. Gordon, J. C. He, J. C. Hone and R. Iyengar, Nat. Commun., 2017, 8, 2145 CrossRef.
- W. H. Grover, A. K. Bryan, M. Diez-Silva, S. Suresh, J. M. Higgins and S. R. Manalis, Proc. Natl. Acad. Sci. U.S.A., 2011, 108, 10992–10996 CrossRef CAS.
- Y. Nematbakhsh and C. T. Lim, Acta Mech. Sin., 2015, 31, 268–273 CrossRef CAS.
- N. Guz, M. Dokukin, V. Kalaparthi and I. Sokolov, Biophys. J., 2014, 107, 564–575 CrossRef CAS.
- F. Nadim, J. Golowasch, A. Bose, A. Taylor, A. Patel, A. Pineda and C. Khalil, BMC Neurosci, 2009, 10, P21 CrossRef.
- J. Chen, Interface Focus, 2014, 4, 20130055 CrossRef.
- B. R. Kwak, M. Bäck, M.-L. Bochaton-Piallat, G. Caligiuri, M. J. A. P. Daemen, P. F. Davies, I. E. Hoefer, P. Holvoet, H. Jo, R. Krams, S. Lehoux, C. Monaco, S. Steffens, R. Virmani, C. Weber, J. J. Wentzel and P. C. Evans, Eur. Heart J., 2014, 35, 3013–3020 CrossRef CAS.
- R. Liu, X. Wang, K. Aihara and L. Chen, Med. Res. Rev., 2013, 34, 455–478 Search PubMed.
- I. Vhora, P. Bhatt and D. Baradia, Ther. Deliv., 2014, 5, 1007–1024 CrossRef CAS.
- M. Fraldi, A. Cugno, L. Deseri, K. Dayal and N. M. Pugno, J. R. Soc. Interface, 2015, 12, 20150656 CrossRef CAS.
- S. J. Singer and G. L. Nicolson, Science, 1972, 175, 720–731 CrossRef CAS.
- W. Rawicz, K. C. Olbrich, T. Mcintosh, D. Needham and E. Evans, Biophys. J., 2000, 79, 328–339 CrossRef CAS.
- O. Ces and X. Mulet, Signal Transduct, 2006, 6, 112–132 CrossRef CAS.
- F. Schmid, Biochim. Biophys. Acta Biomembr., 2016, 1859, 509–528 CrossRef.
- A. J. García-Sáez and P. Schwille, FEBS Lett., 2010, 584, 1653–1658 CrossRef.
- P. F. F. Almeida, A. Pokorny and A. Hinderliter, Biochim. Biophys. Acta Biomembr., 2005, 1720, 1–13 CrossRef CAS.
- J. Pan, S. Tristram-Nagle, N. Kučerka and J. F. Nagle, Biophys. J., 2008, 94, 117–124 CrossRef CAS.
- A. Callan-Jones, B. Sorre and P. Bassereau, Cold Spring Harb. Perspect. Biol., 2011, 3, 1–14 Search PubMed.
- R. Parthasarathy, C. H. Yu and J. T. Groves, Langmuir, 2006, 22, 5095–5099 CrossRef CAS.
- K. Simons and E. Ikonen, Nature, 1997, 387, 569–572 CrossRef CAS.
- H. M. G. Barriga, R. V. Law, J. M. Seddon, O. Ces and N. J. Brooks, Phys. Chem. Chem. Phys., 2016, 18, 149–155 RSC.
- M. A. Casadei, P. Mañas, G. Niven, E. Needs and B. M. Mackey, Appl. Environ. Microbiol., 2002, 68, 5965–5972 CrossRef CAS.
- D. Chen and M. M. Santore, Proc. Natl. Acad. Sci. U.S.A., 2014, 111, 179–184 CrossRef CAS.
- T. Portet, S. E. Gordon and S. L. Keller, Biophys. J., 2012, 103, L35–L37 CrossRef CAS.
- T. Tabouillot, H. S. Muddana and P. J. Butler, Cell. Mol. Bioeng., 2011, 4, 169–181 CrossRef CAS.
- F. Sturzenegger, T. Robinson, D. Hess and P. S. Dittrich, Soft Matter, 2016, 12, 5072–5076 RSC.
- S. K. Mallipattu, M. A. Haidekker, P. Von Dassow, M. I. Latz and J. A. Frangos, J. Comp. Physiol. A Neuroethol. Sensory, Neural, Behav. Physiol., 2002, 188, 409–416 CrossRef CAS.
- K. Yamamoto and J. Ando, J. Cell Sci., 2013, 126, 1227–1234 CrossRef CAS.
- A. Colom, E. Derivery, S. Soleimanpour, C. Tomba, M. D. Molin, N. Sakai, M. González-Gaitán, S. Matile and A. Roux, Nat. Chem., 2018, 1–22 Search PubMed.
- V. L. Thoms, T. T. Hormel, M. A. Reyer and R. Parthasarathy, Langmuir, 2017, 33, 12510–12515 CrossRef CAS.
- S. U. Alam Shibly, C. Ghatak, M. A. Sayem Karal, M. Moniruzzaman and M. Yamazaki, Biophys. J., 2016, 111, 2190–2201 CrossRef CAS.
- T. Hamada, Y. Kishimoto, T. Nagasaki and M. Takagi, Soft Matter, 2011, 7, 9061–9068 RSC.
- K. Oglęcka, P. Rangamani, B. Liedberg, R. S. Kraut and A. N. Parikh, Elife, 2014, 3, 1–18 CrossRef.
- N. L. C. McCarthy, O. Ces, R. V. Law, J. M. Seddon and N. J. Brooks, Chem. Commun., 2015, 51, 8675–8678 RSC.
- N. Periasamy, H. Teichert, K. Weise, R. F. Vogel and R. Winter, Biochim. Biophys. Acta Biomembr., 2009, 1788, 390–401 CrossRef CAS.
- P. Diggins IV, Z. A. McDargh and M. Deserno, J. Am. Chem. Soc., 2015, 137, 12752–12755 CrossRef.
- J. Kim, Biophys. J., 2015, 108, 610–621 CrossRef CAS.
- A. R. Burns, D. J. Frankel and T. Buranda, Biophys. J., 2005, 89, 1081–1093 CrossRef CAS.
- K. Sumitomo and A. Oshima, Langmuir, 2017, 33, 13277–13283 CrossRef CAS.
- T. T. Hormel, M. A. Reyer and R. Parthasarathy, Biophys. J., 2015, 109, 732–736 CrossRef CAS.
- K. Yamamoto and J. Ando, Am. J. Physiol.: Heart Circ. Physiol., 2015, 309, H1178–H1185 CrossRef CAS.
- M. Amaro, R. Šachl, P. Jurkiewicz, A. Coutinho, M. Prieto and M. Hof, Biophys. J., 2014, 107, 2751–2760 CrossRef CAS.
- G. M'Baye, Y. Mély, G. Duportail and A. S. Klymchenko, Biophys. J., 2008, 95, 1217–1225 CrossRef.
- M. A. Haidekker and E. A. Theodorakis, J. Biol. Eng., 2010, 4, 11 CrossRef.
- Y. Wu, M. Štefl, A. Olzyńska, M. Hof, G. Yahioglu, P. Yip, D. R. Casey, O. Ces, J. Humpolíčková and M. K. Kuimova, Phys. Chem. Chem. Phys., 2013, 15, 14986 RSC.
- M. A. Haidekker and E. A. Theodorakis, Org. Biomol. Chem., 2007, 5, 1669–1678 RSC.
- M. K. Kuimova, in Molecules at Work, Wiley-VCH Verlag GmbH & Co. KGaA, Weinheim, Germany, 2012, vol. 66, pp. 243–262 Search PubMed.
- M. K. Kuimova, S. W. Botchway, A. W. Parker, M. Balaz, H. A. Collins, H. L. Anderson, K. Suhling and P. R. Ogilby, Nat. Chem., 2009, 1, 69–73 CrossRef CAS.
- A. Vyšniauskas, I. López-Duarte, N. Duchemin, T. T. Vu, Y. Wu, E. M. Budynina, Y. A. Volkova, E. Peña Cabrera, D. E. Ramírez-Ornelas and M. K. Kuimova, Phys. Chem. Chem. Phys., 2017, 19, 25252–25259 RSC.
- A. Vyšniauskas and M. K. Kuimova, Int. Rev. Phys. Chem., 2018, 37, 259–285 Search PubMed.
- T. Förster and G. Hoffmann, Z. Phys. Chem., 1971, 75, 63–76 CrossRef.
- V. Kilin, O. Glushonkov, L. Herdly, A. Klymchenko, L. Richert and Y. Mely, Biophys. J., 2015, 108, 2521–2531 CrossRef CAS.
- M. R. Dent, I. López-Duarte, C. J. Dickson, P. Chairatana, H. L. Anderson, I. R. Gould, D. Wylie, A. Vyšniauskas, N. J. Brooks and M. K. Kuimova, Chem. Commun., 2016, 52, 13269–13272 RSC.
- J. T. Mika, A. J. Thompson, M. R. Dent, N. J. Brooks, J. Michiels, J. Hofkens and M. K. Kuimova, Biophys. J., 2016, 111, 1528–1540 CrossRef CAS.
- M. E. Nipper, S. Majd, M. Mayer, J. C. M. Lee, E. A. Theodorakis and M. A. Haidekker, Biochim. Biophys. Acta Biomembr., 2008, 1778, 1148–1153 CrossRef CAS.
- M. R. Dent, I. López-Duarte, C. J. Dickson, N. D. Geoghegan, J. M. Cooper, I. R. Gould, R. Krams, J. A. Bull, N. J. Brooks and M. K. Kuimova, Phys. Chem. Chem. Phys., 2015, 17, 18393–18402 RSC.
- M. A. Haidekker, N. L'Heureux and J. A. Frangos, Am. J. Physiol. Circ. Physiol., 2000, 278, H1401–H1406 CrossRef CAS.
- E. M. Woodcock, P. Girvan, J. Eckert, I. Lopez-Duarte, M. Kubánková, J. J. W. A. van Loon, N. J. Brooks and M. K. Kuimova, Biophys. J., 2019, 1984–1993 CrossRef CAS.
- I. López-Duarte, P. Chairatana, Y. Wu, J. Pérez-Moreno, P. M. Bennett, J. E. Reeve, I. Boczarow, W. Kaluza, N. A. Hosny, S. D. Stranks, R. J. Nicholas, K. Clays, M. K. Kuimova and H. L. Anderson, Org. Biomol. Chem., 2015, 13, 3792–3802 RSC.
- P. G. Frank and M. P. Lisanti, AJP Hear. Circ. Physiol., 2006, 290, H2165–H2166 CrossRef CAS.
- M. Ge and J. Freed, Biophys. J., 2003, 85, 4023–4040 CrossRef CAS.
- T. Róg, M. Pasenkiewicz-Gierula, I. Vattulainen and M. Karttunen, Biochim. Biophys. Acta Biomembr., 2009, 1788, 97–121 CrossRef.
- H. Martinez-Seara, T. Róg, M. Pasenkiewicz-Gierula, I. Vattulainen, M. Karttunen and R. Reigada, Biophys. J., 2008, 95, 3295–3305 CrossRef CAS.
- M. Y. El-Sayed, T. A. Guion and M. D. Fayer, Biochemistry, 1986, 25, 4825–4832 CrossRef CAS.
- K. J. Tierney, D. E. Block and M. L. Longo, Biophys. J., 2005, 89, 2481–2493 CrossRef CAS.
- C. Bernsdorff, A. Wolf, R. Winter and E. Gratton, Biophys. J., 1997, 72, 1264–1277 CrossRef CAS.
- Y. Ma, S. K. Ghosh, D. A. Dilena, S. Bera, L. B. Lurio, A. N. Parikh and S. K. Sinha, Biophys. J., 2016, 110, 1355–1366 CrossRef CAS.
- P. Rangamani, D. Zhang, G. Oster and A. Q. Shen, J. R. Soc. Interface, 2013, 10, 20130637 CrossRef.
- R. Lipowsky, Faraday Discuss., 2012, 161, 305–331 RSC.
- M. Rappolt, J. Appl. Phys., 2010, 107, 084701 CrossRef.
- S. Purushothaman, P. Cicuta, O. Ces and N. J. Brooks, J. Phys. Chem. B, 2015, 119, 9805–9810 CrossRef CAS.
- A. H. de Vries, S. Yefimov, A. E. Mark and S. J. Marrink, Proc. Natl. Acad. Sci. U.S.A., 2005, 102, 5392–5396 CrossRef CAS.
- L. F. Braganza and D. L. Worcester, Biochemistry, 1986, 25, 7484–7488 CrossRef CAS.
- W. J. Sun, S. Tristram-Nagle, R. M. Suter and J. F. Nagle, Biophys. J., 1996, 71, 885–891 CrossRef CAS.
- N. J. Brooks, O. Ces, R. H. Templer and J. M. Seddon, Chem. Phys. Lipids, 2011, 164, 89–98 CrossRef CAS.
- M. M. Terzi, M. Deserno and J. F. Nagle, Soft Matter, 2019, 15, 9085–9092 RSC.
- J. N. Grima, R. Caruana-Gauci, D. Attard and R. Gatt, Proc. R. Soc. A Math. Phys. Eng. Sci., 2012, 468, 3121–3138 Search PubMed.
- T. P. T. Dao, M. Fauquignon, F. Fernandes, E. Ibarboure, A. Vax, M. Prieto and J. F. Le Meins, Colloids Surfaces A Physicochem. Eng. Asp., 2017, 533, 347–353 CrossRef CAS.
- A. Vyšniauskas, M. Qurashi and M. K. Kuimova, Chem.–Eur J., 2016, 22, 13210–13217 CrossRef.
- M. A. A. Ayee, E. LeMaster, T. Teng, J. Lee and I. Levitan, Biophys. J., 2018, 114, 929–938 CrossRef CAS.
- B. M. Mazzag, J. S. Tamaresis and A. I. Barakat, Biophys. J., 2003, 84, 4087–4101 CrossRef CAS.
- S. S. Ye, Y. C. Ng, J. Tan, H. L. Leo and S. Kim, Theor. Biol. Med. Model., 2014, 11, 1–21 Search PubMed.
- Y. Zhang, C. Huang, S. Kim, M. Golkaram, M. W. A. Dixon, L. Tilley, J. Li, S. Zhang and S. Suresh, Proc. Natl. Acad. Sci. U.S.A., 2015, 112, 6068–6073 CrossRef CAS.
- J. Xu, Y. Tseng and D. Wirtz, J. Biol. Chem., 2000, 275, 35886–35892 CrossRef CAS.
- P. Fortier, S. Suei and L. Kreplak, PLoS One, 2012, 7, e41814 CrossRef CAS.
- I. López-Montero, L. R. Arriaga, F. Monroy, G. Rivas, P. Tarazona and M. Vélez, Langmuir, 2008, 24, 4065–4076 CrossRef.
- L. R. Arriaga, I. López-Montero, R. Rodríguez-García and F. Monroy, Phys. Rev. E: Stat., Nonlinear, Soft Matter Phys., 2008, 77, 1–10 CrossRef.
- L. R. Arriaga, I. Löpez-Montero, J. Ignés-Mullol and F. Monroy, J. Phys. Chem. B, 2010, 114, 4509–4520 CrossRef CAS.
- E. N. Petersen, H. W. Chung, A. Nayebosadri and S. B. Hansen, Nat. Commun., 2016, 7, 1–8 Search PubMed.
- D. E. Ingber, FASEB J., 2006, 20, 811–827 CrossRef CAS.
- S. Emami, W. C. Su, S. Purushothaman, V. N. Ngassam and A. N. Parikh, Biophys. J., 2018, 115, 1942–1955 CrossRef CAS.
- J. C. S. Ho, P. Rangamani, B. Liedberg and A. N. Parikh, Langmuir, 2016, 32, 2151–2163 CrossRef CAS.
- C. Nicolini, A. Celli, E. Gratton and R. Winter, Biophys. J., 2006, 91, 2936–2942 CrossRef CAS.
- L. Picas, F. Rico and S. Scheuring, Biophys. J., 2012, 102, L01–L03 CrossRef CAS.
Footnote |
| † Electronic supplementary information (ESI) available: Detailed calibration curves for molecular rotors; spectroscopic, FLIM and SAXS/WAXS characterization of lipid bilayers under stress. See DOI: 10.1039/d0sc05874b |
| This journal is © The Royal Society of Chemistry 2021 |