 Open Access Article
An azo dye for photodynamic therapy that is activated selectively by two-photon excitation†
Vinayak
Juvekar‡
a,
Chang Su
Lim‡
a,
Dong Joon
Lee
b,
Sang Jun
Park
b,
Gyeong Ok
Song
b,
Hyuk
Kang
 a and
Hwan Myung
Kim
 *ab
*ab
aDepartment of Chemistry, Department of Energy Systems Research, Ajou University, Suwon 443-749, South Korea. E-mail: kimhm@ajou.ac.kr
bDepartment of Energy Systems Research, Ajou University, Suwon 443-749, South Korea
First published on 6th November 2020
Abstract
Two-photon photodynamic therapy (TP-PDT) is a promising approach for the treatment of cancer because of its better penetration depth and superior spatial selectivity. Here, we describe an azo group containing cyclized-cyanine derivatives (ACC1 and ACC2) as a two-photon activated, type I based photosensitizer (PS). These small-molecule and heavy atom-free organic dyes showed marked reactive oxygen species (ROS)-generating ability under physiological conditions, as well as fast loading ability into the cells and negligible dark toxicity. Live cell analyses with one- and two-photon microscopy revealed that these dyes showed higher ROS generation ability upon two-photon excitation than upon one-photon excitation via the type I process. The PSs have superior PDT properties compared to conventional Visudyne and 5-ALA under mild conditions. These characteristics allowed for precise PDT at the target region in mimic tumor spheroids, demonstrating that the developed TP PS could be useful in efficient PDT applications and in designing various PSs.
Introduction
Photodynamic therapy (PDT) uses a synthetic photosensitizer (PS) that generates reactive oxygen species (ROS) upon photo-illumination. The generated ROS induces cell death due to organelle or vasculature damage.1 PDT has significant advantages over conventional cancer treatments owing to its non-invasiveness, instant healing process, and lack of drug resistance.2 Recent interest in the development of PDT agents has led to the development of various photosensitizers including porphyrin derivatives and heavy atom- and sulfur-containing derivatives.3 As most of these dyes are utilized with one-photon (OP) and linear excitation, ROS are produced throughout the beam pathways and cause injuries to surrounding healthy tissues. In addition, heavy atom-containing dyes have shown dark toxicity.4 Another major issue is hypoxia sensitivity of PS during the photochemical pathway. Most PSs generate singlet oxygen (1O2) through energy transfer to molecular oxygen upon excitation (type II). The hypoxic tumor environment and short lifetime of 1O2 reduce therapeutic efficacy, resulting in the need for high loading concentrations of PSs and/or prolonged light exposure times.5Two-photon excitation (TPE) is an alternate tool in PDT, which utilizes low-energy light in the near infrared (IR) region (700–950 nm) to penetrate deeper into tissues with minimum photodamage to the healthy tissues.6 Additionally, TP-PDT can be used with greater spatial precision owing to the quadratic dependence of TPE on the local photon intensity.7 Hence, the production of ROS can be controlled at the confined region to the focal plane of the laser beam, enabling treatment of the target pathologic site deep inside the tissue without damaging the surrounding healthy tissue.8 In combination with TPE, PS, which generates cytotoxic ROS via hypoxia-tolerant electron transfer type I photoreaction is beneficial. However, to the best of our knowledge, there has been no report of a two-photon excitable, type I based PS.
Over the years, the high biocompatibility of azo group-containing dyes has been utilized in developing a fluorescence off–on imaging system for sensing various bio-analytes and enzymes.9 The non-radiative decay of azo dyes can be attributed to fast internal conversion from a short-lifetime singlet exited state to the ground state.10 However, their fluorescence quenching processes are barely understood. An azo bridge has been used as a deactivating unit in PS, and upon removal of the azo bridge with external sources, PS was found to regain its 1O2 generation ability.11 Cyanine dyes are commonly utilized as imaging agents with high molar absorptivity. However, their development has been limited by photo-instability due to the open chain polymethine bridge. We speculated whether the combination of the azo group and cyanine dye could be used as a PDT agent, if the cyanine dye is modified to enhance the photostability.
Herein, we report azo group-containing cyclized-cyanine derivatives (ACC1 and ACC2) as two-photon activatable and type I based PSs (Scheme 1). These dyes showed higher ROS generation ability in two-photon excitation than in one-photon excitation. These small-molecule and heavy atom-free dyes showed marked ROS-generating ability via the type I process, fast loading ability into cells, and negligible dark toxicity. Furthermore, they have superior PDT properties compared to conventional PSs (5-ALA and Visudyne) under low PS loading concentration and TP excitation power.
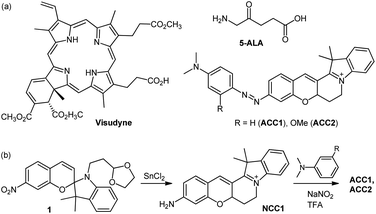 | ||
| Scheme 1 (a) Chemical structures of Visudyne, 5-ALA, ACC1, and ACC2. (b) Synthetic route to ACC1 and ACC2. | ||
Results and discussion
The design of the core dye focused on using the conformational rigidity of hemicyanine to produce a cyclized-cyanine (NCC1, Scheme 1), with the expectation that intramolecular rotation would halt the instability of the excited state, such as photoisomerization.12 In addition, NCC1 contains an electron push–pull system through linear π-conjugation between the amine and indolinium sites. Dimethyl aniline was coupled with NCC1 to generate an azo bridge-containing a dye (ACC1), which controls the photo-electronic properties of the resulting dye. ACC2 has a methoxy group at the ortho position of the azo bridge, giving it a more electron-rich character than ACC1.The synthetic routes of these dyes are outlined in Scheme 1. Key intermediate 1 was prepared through condensation between 4-nitrosalicylaldehyde and N-alkylated indolenine (Scheme S1, ESI†). Next, intramolecular cyclization via a conventional method, which utilizes H2SO4 and BBr3, failed to yield the desired NCC1 dye because of the presence of an electron-withdrawing NO2 group on compound 1.13 A one-pot reduction–cyclisation method using SnCl2 was found to produce NCC1 dye in moderate yield (32%). ACC1 and ACC2 were prepared via a SEAr-type reaction between the diazonium salt of NCC1 and N,N-dimethyl aniline derivatives, confirmed by 1H-NMR, 13C-NMR, and high resolution mass spectrometry (ESI).†
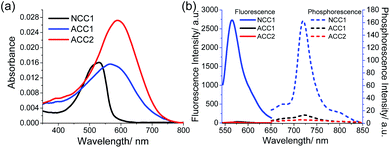
In PBS buffer (pH 7.4), NCC1 has an absorption maximum (λabs) at 532 nm and a fluorescence emission maximum (λfl) at 570 nm with an impressive fluorescent quantum yield (Φf) of 60% (Fig. 1). The λabs of ACC1 and ACC2 were shifted to longer wavelengths at 565 and 586 nm, respectively, at which the molar absorptivity of ACC2 (2.7 × 10⁴ M−1 cm−1) was 1.5-fold higher than those for NCC1 (1.8 × 10⁴ M−1 cm−1) and ACC1 (1.6 × 10⁴ M−1 cm−1). These spectral red shifts are likely due to the extended conjugation length and/or enhanced intramolecular charge transfer character. In contrast, the fluorescent and phosphorescence emission of ACC1 and ACC2 was negligible (Fig. 1b). The value of the two-photon action cross section (δ) for NCC1, measured by the fluorescence method, was 103 GM (10−50 cm4 s per photon), while the values for ACC1 and ACC2 could not be determined because of their weak emission (Fig. S1, ESI†).14 This remarkable fluorescence quenching in one- and two-photon processes could be attributed to intersystem crossing and/or thermal relaxation, which led us to assess the ROS generation efficiency.
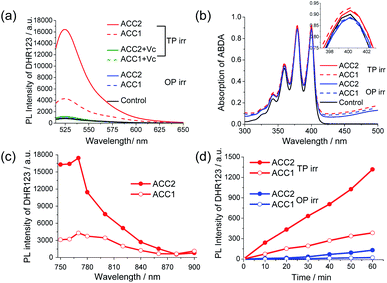
The ROS generation ability of ACC1 and ACC2 in PBS buffer was evaluated in the presence of a general fluorescent turn-on ROS indicator, dihydrorhodamine 123 (DHR 123).15 Upon OP irradiation at λabs using a fluorescence spectrophotometer for 30 min, the emission signal of DHR 123 increased marginally (Fig. 2a). Interestingly, upon TP irradiation at 770 nm for 30 min at 100 mW power, a strong emission at 526 nm in ACC1 solution was observed (Fig. 2a), due to the ROS-mediated oxidation of DHR 123.15c Furthermore, an approximately 4-fold higher efficiency was observed with ACC2 than with ACC1. However, under similar TP exposure both PS in the presence of antioxidant Vitamin-C (Vc, 100 μM), the fluorescence of oxidised DHR 123 at 526 nm suppressed significantly (Fig. 2a).3d ROS inhibition studies in the cuvette revealed, DHR 123 turn-on response completely reduced upon Tiron addition (a well-known superoxide scavenger) and the DHR 123 fluorescent intensity was unaffected by the other radical scavengers (Fig. S2a and b†).16 Even though intracellular DHR 123 turn-on response was not affected by Tiron treatment, but we observed fluorescence depletion upon peroxynitrite inhibition, a known reactive nitrogen species usually forms in the cell due to abundance of superoxide radical (Fig. S2c and d†).17 These studies indicates superoxides are probably generated by the developed PS. Furthermore, the core dye (NCC1) showed no spectral changes in DHR 123, indicating that the azo bridge likely plays a crucial role in the TP-excited ROS generation (Fig. S3, ESI†).Under similar OP and TP conditions, 1O2 generation efficiency was tested using 2,2′-[9,10-anthracenediylbis(methylene)]dimalonic acid (ABDA). Upon OP and TP irradiation, there was no significant spectral change in ABDA (Fig. 2b), indicating that ACC1 and ACC2 mainly generate ROS via a type I photochemical reaction. The TP exposure (30 min at 100 mW power) tests at different wavelengths in the range of 750–900 nm indicated that 770 nm is an optimum excitation source for ROS generation, and ACC2 is more efficient than ACC1 (Fig. 2c). To elucidate whether the more efficient ROS generation in TP than in OP depends on the incident light power, we compared OP (λmax) and TP (770 nm) exposure under similar irradiation powers (50 μW, Fig. 2d). The results showed that both ACC1 and ACC2 dyes tend to generate significantly higher amounts of ROS for TP irradiation than for OP (Fig. 2d). Next, the stability of azo group on PS under biological relevant reducing agent glutathione (GSH) and photostability under TP conditions has been examined. The absorptions and fluorescence spectra of ACC1 and ACC2 indicated that azo bridge barely affected by 10 mM GSH and continuous TP irradiation for 30 min (Fig. S4a and b†).11b,18
To examine the greater ROS generation in TPE, the electronic structures of ACC1 and ACC2 were estimated by quantum mechanical calculations. In both molecules, the S1 state had the largest oscillator strength (Tables S1 and S2, ESI†), which might be responsible for the absorption at 580 nm. The energy gap between S1 and the lower-lying triplet states (T1, T2, and T3) was between 0.4 and 1.1 eV (Fig. S5, ESI†). While the oscillator strength of S2 was very low, the S3 state had an appreciable oscillator strength, which could be excited by a two-photon of 770 nm radiation. The energy gaps for S3 and T5 were 0.01 and 0.07 eV, respectively. This much smaller energy gap between singlet and triplet states via TPE as compared to that via OPE may facilitate fast intersystem crossing, whereas the higher energy gap through OPE may facilitate thermal relaxation (for more details, see ESI†). Indeed, under OP exposure to the ACC2 solution, a higher temperature was observed than that for TPE (Fig. S6, ESI†).
ACC1 and ACC2 were incubated in live HeLa cells and tested using OP microscopy (OPM) and TP microscopy (TPM). The OPM and TPM images of ACC1-labelled cells showed a modest fluorescence signal (Fig. S7a, ESI†). These signals might be due to the partially decomposed azo bridge that produced the NCC1 dye during incubation. The xyλ mode spectra of NCC1-incubated cells were identical to those from ACC1-labelled cells and the decomposed ratio was approximately 10%, as determined by their intensity calibration (Fig. S7a and b, ESI†). A similar result was observed for ACC2. These signals could be useful for analyzing the morphological aspect and image-guided process. Next, we subjected ACC1 and ACC2 to dark toxicity using CCK-8 kit assays. The cell viability of these PS incubated in HeLa cells for 24 h was reasonable in the absence of TP exposure (Fig. S8, ESI†), indicating decent dark toxicity.
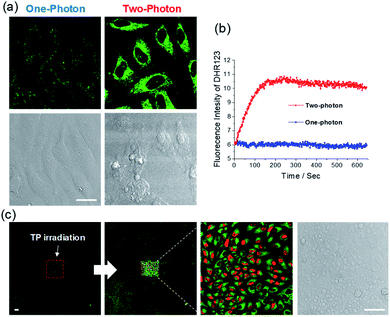
We tested the ROS-generating ability of ACC1 and ACC2 in live cells. The dye-loaded cells were subjected to TP irradiation at 770 nm with an incident power intensity of 1.6 mW (290 × 290 μm2) for 100 scans (1.3 s per scan). Remarkably, instant cell bleb formation was observed in the bright field and fast ROS production within the cells was confirmed by an increase in DHR 123 fluorescence intensity (Fig. 3a, b and S9, ESI). The ACC2 dye showed higher ROS production than ACC1 in the cells, as observed in PBS buffer. However, when OP irradiation was maintained at 488 nm (or 552 nm), there were no significant cell blebs in the bright field and no measurable ROS (Fig. 3a and b). This result showed the advantage of using these dyes themselves or with other imaging agents for the monitoring process in the nontoxic OP mode, and then for PDT by changing to TP mode. In an attempt to demonstrate that the TP irradiation of ACC1- and ACC2-labeled cells caused apoptosis, PDT analysis was performed with propidium iodide (PI), a well-known red-fluorescent nuclear counterstain to detect dead cells in a population.19 HeLa cells to TP irradiation at the target area. Along with increasing DHR 123 intensity, apparent PI nucleus accumulation with intense red fluorescence was observed only at the target area (Fig. 3c and S10, ESI). A similar result was obtained with ACC1 (Fig. S11, ESI†). The control experiment with NCC1 incubated with HeLa cells resulted in bright fluorescent emission without photodamage (Fig. S12, ESI†).
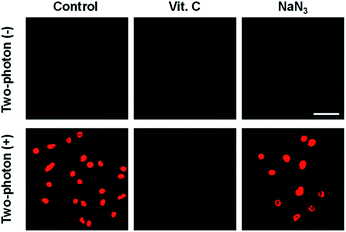
To elucidate intracellular TP-PDT via ROS radical-driven (type I) versus singlet oxygen generation (type II), cellular experiments in the presence of ROS scavengers have been conducted. As shown in Fig. 4 and S13 (ESI),† control experiments using ACC1 and ACC2, respectively, incubated with HeLa cells and upon TP irradiation and subsequent PI staining confirmed that most of the cells underwent apoptosis. In addition, the cells underwent apoptosis in the presence of the singlet oxygen scavenger NaN3. In contrast, in the presence of Vitamin-C (a well-known ROS scavenger), no cell toxicity was observed (Fig. 4). These results indicate that TP-illuminated cell apoptosis occurred through the type I PDT process.
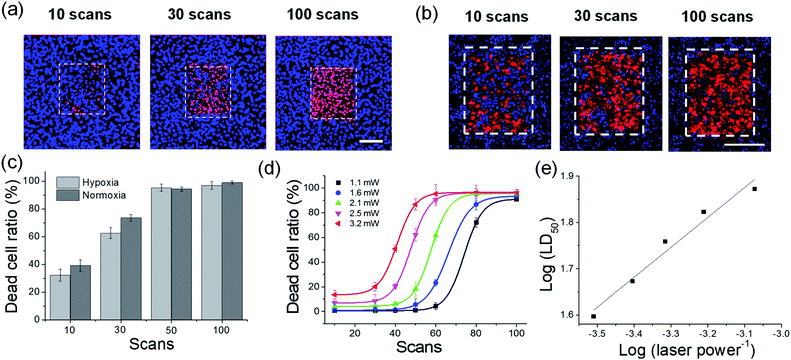
Subsequently, the dead cell ratio was measured under different excitation powers (Fig. 5). PDT efficiency was determined by the cell staining method with PI and Hoechst 33342 for counting the dead and live cells, respectively. Irradiation at 770 nm of ACC2-loaded cells showed an increase in the number of PI-stained cells, whereas the non-irradiated region showed Hoechst stained cells, indicating that cell apoptosis was a result of TP irradiation (Fig. 5a). In order to mimic of hypoxia state deep within solid tumor, under hypoxic condition (5% CO2, 2% O2) HeLa cells cultured for 4 h and under same condition 1 μM ACC2 incubated in HeLa cells for 1 h.16 For precise hypoxic conditions, HeLa cells were cultured in stage-top incubator system (LCI, Seoul) ensured hypoxic conditions maintained during PDT and dead cell ratio studies. Importantly, under hypoxic conditions 1 μM ACC2 maintained PDT effect and PDT efficiency in comparison with normoxia (Fig. 5b and c). The dead cell ratio plot revealed that ACC2-loaded cells showed cytotoxicity of 40% within 10 scans. Upon increasing the number of scans to 100, ACC2-loaded cells showed complete cell ablation (Fig. S14b, ESI†). ACC1 exhibited similar behavior, except for a marginally lower efficiency (Fig. S14, ESI†). In addition, the 200 scans of TP irradiation under normoxic (21% O2) and hypoxic (2% O2) conditions without PSs showed no PI staining indicates PDT effects on cells contributed by PSs (Fig. S15, ESI†). The TP-PDT efficiency of ACC1 and ACC2 was estimated by LD50 under distinct power sources (1.1–3.2 mW). The TP irradiation at laser powers of 1.1 mW to 3.2 mW showed LD50 for both dyes with comparable 50% cell death. In addition, at 1.1 mW power, ACC2 showed complete cell ablation after 100 scans, making it one of the most efficient PS (Fig. S14b, ESI†).20 Furthermore, the linear relationship between log(LD50) and log(laser power−1) was observed. This proves that both probes underwent a non-linear PDT process (Fig. 5d and S14c, ESI†). These results demonstrated that both ACC2 and ACC1 are efficient TP type I PSs.20a,b
The intracellular localization studies of NCC1, ACC1 and ACC2 dye has been performed by employing commercially available organelle trackers.21 As sown in dual channel imaging Fig. S16–S18, ESI,† the fluorescence distribution of NCC1 dye within cell overlapped significantly with MitoTracker Deep Red (MTDR) with correlation coefficient of 0.96, whereas for LysoTracker Green (LTG) and ER Tracker Red (ETR) of NCC1 dye showed lower Pearson's coefficient values 0.21 and 0.66 respectively (Fig. S16, ESI†). Similarly, ACC1 and ACC2 intracellular localization performed against Mito, Lyso, and ER trackers by studying the NCC1 partial release within cell. Both PS ACC1 and ACC2 dye showed strong mito-localisation with Pearson's coefficient values 0.88 and 0.94 respectively. Whereas, ACC2 and ACC1 probes partially overlapped with Lyso- (PC 0.25 and 0.22) and ER- (PC 0.60 and 0.53). These results confirm that cyclized-cyanine core on the NCC1 dyes and PS (ACC1 and ACC2) may directs obvious preferential mitochondrion accumulation over other vital organelles due to the electrostatic interaction between mitochondrion and probes (Fig. S17 and 18, ESI†).
To investigate PDT efficiency, our TP PSs were compared with known FDA-approved 5-ALA and Visudyne, in which Visudyne has a proven record of TP phototoxicity over photofrin and 5-ALA.22 Because conversion of 5-ALA to PS protoporphyrin IX (PpIX) involves heme biosynthesis, HeLa cells were incubated with 1 mM 5-ALA for 24 h to enhance PpIX production. As shown in Fig. 6, 5-ALA and Visudyne failed to show TP-illuminated toxicity, even at higher treatment concentrations and prolonged incubation. ACC2 and ACC1 showed cell apoptosis at 10-times lower concentration (1 μM) than that for Visudyne (Fig. 6), indicating that ACC2 and ACC1 are efficient TP PSs.
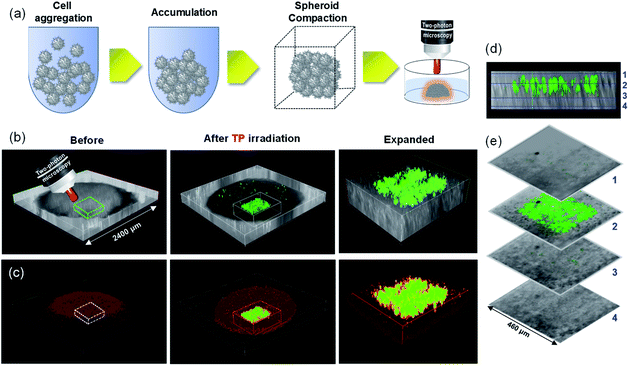
Promising results obtained from the PSs in TP-PDT on 2D cell culture motivated us to further study its PDT efficiency in mimicking multicellular tumor spheroids (MCTSs).23 To demonstrate the ability of the PSs in micro cancer therapy, 2400 μm MCTSs were prepared and incubated with ACC2 for 30 min (Fig. 7). The spatial target region, with a diameter of 40 ± 5 μm inside MCTS, was selected and irradiated with 770 nm (100 fs, 80 MHz, 1.6 mW) incident light for TPE along the z-sections. The 3D images showed ROS generation precisely in the focal plane of the laser beam. Hence, ACC2 is capable of PDT at the specific region inside of mimic tumor spheroids without damage to the non-target region (Fig. 7b–e).
Conclusions
In summary, azo-containing cyclized-cyanine dyes (ACC1 and ACC2) as TP and type I PSs were developed. These small-molecule and heavy atom-free dyes showed marked ROS-generating ability under physiological conditions, fast loading ability into cells, and negligible dark toxicity. OPM and TPM experiments and inhibition studies revealed that PSs selectively generate ROS via TP excitation and type I processes. These PSs have superior PDT properties compared to conventional Visudyne and 5-ALA under low loading concentration, incubation time, and TP excitation power. These characteristics allowed for precise PDT only at the target region in mimic tumor spheroids. These results demonstrate that the TP PS will be useful for efficient PDT applications and for designing various PSs.Experimental section
Materials and methods
All chemicals and reagents were purchased from commercial suppliers and used without further purification. All solvents were purified by a solvent purifier prior to ACC1 and ACC2 probe synthesis by standard methods. Stock solutions of the probe were prepared by dissolving in DMSO (Sigma-Aldrich, St. Louis, MO, USA). A full description of the synthesis of the probe and its intermediates is presented in the ESI Methods section.† The synthesis results were characterized by 1H-NMR, 13C-NMR, and ESI high-resolution mass spectrometry. 1H-NMR and 13C-NMR spectra were recorded using a Bruker 600 MHz spectrometer using CDCl3, methanol-d4, and DMSO-d6 as solvents. The chemical shifts are reported in ppm, and the coupling constant is given in Hz. The spectra of the probe in the absorption and emission spectra were recorded using a UV-vis spectrophotometer (S-3100) and a fluorescence spectrophotometer (FluoroMate FS-2) with a 1 cm quartz cell, respectively. The fluorescence quantum yield was determined using Rhodamine 6G (Φ = 0.98 in MeOH) as the reference.ROS detection
To determine ROS generation, non-fluorescent dihydrorhodamine 123 (DHR 123) was taken with ACC1 and ACC2 dye in PBS buffer (pH 7.4). The cuvettes were irradiated with two-photon at 770 nm of incident power 100 mW or 50 μW for 10 to 60 min and by changing the TP wavelength to 750–900 nm. The fluorescence spectra were observed by OP excitation at 500 nm in each case immediately after each TP irradiation. In addition, DHR 123 before and after exposure to TP without PS has been studied (Fig. S3, ESI†). For OP ROS generation studies under similar conditions, a fluorescence spectrophotometer was used at the probe's λabs. Furthermore, NCC1 dye, a precursor of developed PS, was added to PBS instead of PS subjected to similar TP conditions.Singlet oxygen detection
20 μM ACC1 and ACC2 dye was taken with 70 μM 2,2′-[9,10-anthracenediylbis(methylene)]dimalonic acid (ABDA), in water and the cuvettes were exposed to two-photon at 770 nm with power 100 mW for 30 min and absorption spectra were immediately measured to study ABDA decomposition at 380 nm. As a control, 70 μM ABDA was taken in water and, as before, the cuvette was exposed to TP and after 30 min 770 nm TP irradiation absorption was measured. For OP singlet oxygen detection, a fluorescence spectrophotometer was used at the probe's λabs.Quantum mechanical calculations
The geometry of the molecules was optimized in the ground state at the ωB97xd/cc-PVDZ level of theory, and the vertical excited states were computed at TD-ωB97xd/cc-PVTZ for both singlet and triplet states. The results are summarized in Tables S1 and S2, ESI.†Photothermal studies
1 mM ACC2 in ethanol was irradiated with 600 nm and 770 nm under similar incident power for 10 min before measuring the temperature variation using an IR-thermal camera. Temperature was measured every minute.One- and two-photon fluorescence microscopy
Confocal images (ROS generation experiments with DHR 123 and imaging of NCC1 and PI) were obtained using a confocal microscope (Leica TCS SP8 MP, Wetzlar, Germany) equipped with an oil immersion 40× objective (numerical aperture, 1.30). The excitation wavelength and emission slit settings for each dye were as follows: NCC1 (488 nm and 590–640 nm), DHR 123 (488 nm and 495–540 nm), PI (552 nm and 650–700 nm), and Hoechst 33342 (TP 750 nm, 400–500 nm).PDT experiment using a two-photon light source
HeLa cells were incubated (37 °C, CO2 5%) with 1 μM ACC1 or ACC2 in MEM-free media for 30 min. Before TPM exposure, the cell culture was washed twice with PBS buffer. The two-photon excitation source was an 80 MHz mode-locked Mai-Tai® Ti-Sapphire tunable laser (690–1040 nm, 100 fs laser pulse) tuned to 770 nm for ACC1 and ACC2, respectively. The two-photon laser power was calculated by measuring the power at the end point of the 40× objective lens using a Nova II power meter (Ophir, Photonics). In all two-photon PDT experiments, the laser power delivered to the cells was estimated to be 1.6 mW, 1.3 s per scan. The two-photon PDT experiment was performed in the xyt scan mode for different scan numbers (image size, 512 × 512 pixels; field of view, 290 × 290 μm; scanning frequency, 80 MHz).PDT efficiency estimation in normoxia (21% O2)
HeLa cells (7.0 × 10⁴ per dish) were seeded on 20 mm confocal imaging dishes (glass bottom dish, NEST) and stabilized for 72 h. HeLa cells were incubated with 1 μM ACC1 and ACC2 for 30 min and a two-photon PDT experiment was performed. After PDT treatment, the HeLa cells were incubated with 10 μM propidium iodide (PI) for 30 min. Afterward, cells were washed and the images were taken using a confocal microscope with excitation at 552 nm and emissions of 650–700 nm (for PI). To calculate the dead cell ratio more accurately, 1 μM Hoechst 33342 was stained with PI, and the corresponding ratio (live/dead) was calculated using the number of blue and red fluorescent dots.PDT efficiency estimation in hypoxia (2% O2)
For intracellular death cell ratio measurement under hypoxia environment, firstly, HeLa cells were plated onto glass bottomed confocal dishes (MatTek) and incubated at 37 °C under normal incubation condition (5% CO2, 21% O2) for about 72 h. For optimal experimental Hypoxic conditions, Stage-top incubator system with temperature and humidity control (LCI, Seoul) was used, which fitted perfectly on microscope for PDT and cell viability studies under hypoxia. Now, HeLa cells incubated additionally for 4 h under hypoxia condition (5% CO2, 2% O2) in Stage-top incubator. After that, 1 μM ACC2 was added to the cell dishes and continued incubation for 1 h under hypoxia. For more reliably result, the cell culture medium used in the cell culture and medium of 1 μM ACC2 were bubbled with the mix gas (5% CO2, 2% O2, and 95% N2) in advance for 30 min. Then, TP irradiation was performed (770 nm, 1.6 mW, 1.3 s per scan, 10–100 scan) and immediately 10 μM PI and 2 μM Hoechst33382 was stained for 30 minutes. Finally, using confocal microscopy the intracellular blue and red fluorescence from Hoechst33382 and PI signals attributing to two-photon-triggered PDT effect could be detected. Excitation: TP 750 nm (for Hoechst 33342) and 552 nm (for PI). Emission: 425–475 nm (blue, Hoechst 33342) and 650–720 nm (red, PI).Generation and analysis of HeLa MCTSs
Three-dimensional (3D) MCTSs were prepared using the liquid overlay method. A trypsin/EDTA solution was used to separate HeLa cells in the exponential growth stage into single-cell suspensions. HeLa cells (2 × 10⁵) were transferred to 1.5% agarose-coated transparent 25-well plates with 30 μL of Dulbecco's modified Eagle medium (DMEM) containing 10% serum. The single HeLa cells in the wells generated approximately 2400 μm in diameter of MCTSs on day 4 with 5% CO2 in air at 37 °C in an incubator chamber. After generation of HeLa MCTSs, each MCTS in a 25-well plate was transferred to 20 mm confocal imaging dishes (glass bottom dish, NEST) and imaged using a 40× objective with xyz mode to monitor the volume of the MCTS.Conflicts of interest
There are no conflicts to declare.Acknowledgements
This study was supported by grants from the National Leading Research Lab Program of the National Research Foundation of Korea (NRF), funded by the Korean government (MSIP) (NRF-2019R1A2B5B03100278), Center for Convergence Research of Neurological Disorders (NRF-2019R1A5A2026045), the GRRC program of Gyeong-gi province (GRRCAJOU2019B02, Photonics-Medical Convergence Technology Research Center), and Ajou University research fund.References
- (a) D. E. J. G. J. Dolmans, D. Fukumura and R. K. Jain, Nat. Rev. Cancer, 2003, 3, 380–387 CrossRef CAS; (b) P. Agostinis, K. Berg, K. A. Cengel, T. H. Foster, A. W. Girotti, S. O. Gollnick, S. M. Hahn, M. R. Hamblin, A. Juzeniene, D. Kessel, M. Korbelik, J. Moan, P. Mroz, D. Nowis, J. Piette, B. C. Wilson and J. Golab, Ca - Cancer J. Clin., 2011, 61, 250–281 CrossRef; (c) C. S. Foote, Photochem. Photobiol., 1991, 54, 659 CrossRef CAS; (d) A. T. Dharmaraja, J. Med. Chem., 2017, 60, 3221–3240 CrossRef CAS.
- (a) B. A. Chabner and T. G. Roberts Jr, Nat. Rev. Cancer, 2005, 5, 65 CrossRef CAS; (b) C. Holohan, S. Van Schaeybroeck, D. B. Longley and P. G. Johnston, Nat. Rev. Cancer, 2013, 13, 714 CrossRef CAS; (c) T. Wang, D. Wang, H. Yu, M. Wang, J. Liu, B. Feng, F. Zhou, Q. Yin, Z. Zhang, Y. Huang and Y. Li, ACS Nano, 2016, 10, 3496–3508 CrossRef CAS.
- (a) A. Kamkaew, S. H. Lim, H. B. Lee, L. V. Kiew, L. Y. Chung and K. Burgess, Chem. Soc. Rev., 2013, 42, 77–88 RSC; (b) A. Turksoy, D. Yildiz and E. Akkaya, Coord. Chem. Rev., 2019, 379, 47–64 CrossRef CAS; (c) M. H. Lan, S. J. Zhao, W. M. Liu, C. S. Lee, W. J. Zhang and P. F. Wang, Adv. Healthcare Mater., 2019, 8, 1900132 CrossRef; (d) M. Li, J. Xia, R. Tian, J. Wang, J. Fan, J. Du, S. Long, X. Song, J. W. Foley and X. J. Peng, J. Am. Chem. Soc., 2018, 140, 14851–14859 CrossRef CAS; (e) V. N. Nguyen, S. Qi, S. Kim, N. Kwon, G. Kim, Y. Yim, S. Park and J. Yoon, J. Am. Chem. Soc., 2019, 141, 16243–16248 CrossRef CAS; (f) X. Miao, W. Hu, T. He, H. Tao, Q. Wang, R. Chen, L. Jin, H. Zhao, X. Lu, Q. Fan and W. Huang, Chem. Sci., 2019, 10, 3096–3102 RSC; (g) J. Karges, U. Basu, O. Blacque, H. Chao and G. Gasser, Angew. Chem., Int. Ed., 2019, 58, 14334–14340 CrossRef CAS; (h) X. Zhao, S. Long, M. Li, J. Cao, Y. Li, L. Guo, W. Sun, J. Du, J. Fan and X. Peng, J. Am. Chem. Soc., 2020, 142, 1510–1517 CrossRef CAS.
- (a) S. H. Lim, C. Thivierge, P. Nowak-Sliwinska, J. Han, H. van den Bergh, G. Wagnieres, K. Burgess and H. B. Lee, J. Med. Chem., 2010, 53, 2865–2874 CrossRef CAS; (b) S. Kolemen, M. Isik, G. M. Kim, D. Kim, H. Geng, M. Buyuktemiz, T. Karatas, X. F. Zhang, Y. Dede, J. Yoon and E. U. Akkaya, Angew. Chem., Int. Ed., 2015, 54, 5340–5344 CrossRef CAS.
- (a) Y. Cheng, H. Cheng, C. Jiang, X. Qiu, K. Wang, W. Huan, A. Yuan, J. Wu and Y. Hu, Nat. Commun., 2015, 6, 8785 CrossRef CAS; (b) Z. Zhou, J. Song, L. Nie and X. Chen, Chem. Soc. Rev., 2016, 45, 6597–6626 RSC; (c) X. Li, D. Lee, J. D. Huang and J. Yoon, Angew. Chem., Int. Ed., 2018, 57, 9885–9890 CrossRef CAS; (d) G. Lan, K. Ni, S. S. Veroneau, X. Feng, T. G. Nash, T. Luo, Z. Xu and W. Lin, J. Am. Chem. Soc., 2019, 141, 4204–4208 CrossRef CAS; (e) W. Zhuang, L. Yang, B. Ma, Q. Kong, G. Li, Y. Wang and B. Z. Tang, ACS Appl. Mater. Interfaces, 2019, 11, 20715–20724 CrossRef CAS.
- (a) W. Denk, J. Strickler and W. Webb, Science, 1990, 248, 73–76 CrossRef CAS; (b) A. M. Smith, M. C. Mancini and S. Nie, Nat. Nanotechnol., 2009, 4, 710–711 CrossRef CAS; (c) F. Helmchen and W. Denk, Nat. Methods, 2005, 2, 932–940 CrossRef CAS; (d) H. M. Kim and B. R. Cho, Chem. Rev., 2015, 115, 5014–5055 CrossRef CAS.
- (a) W. R. Zipfel, R. M. Williams and W. W. Webb, Nat. Biotechnol., 2003, 21, 1369–1377 CrossRef CAS; (b) E. Papagiakoumou, E. Ronzitti and V. Emiliani, Nat. Methods, 2020, 17, 571–581 CrossRef CAS.
- (a) Y. Shen, A. J. Shuhendler, D. Ye, J. J. Xu and H. Y. Chen, Chem. Soc. Rev., 2016, 45, 6725–6741 RSC; (b) F. Bolze, S. Jenni, A. Sour and V. Heitz, Chem. Commun., 2017, 53, 12857–12877 RSC.
- A. Chevalier, P.-Y. Renard and A. Romieu, Chem.–Asian J., 2017, 12, 2008–2028 CrossRef CAS.
- W. Piao, S. Tsuda, Y. Tanaka, S. Maeda, F. Liu, S. Takahashi, Y. Kushida, T. Komatsu, T. Ueno, T. Terai, T. Nakazawa, M. Uchiyama, K. Morokuma, T. Nagano and K. Hanaoka, Angew. Chem., Int. Ed., 2013, 52, 13028–13032 CrossRef CAS.
- (a) L. Zeng, S. Kuang, G. Li, C. Jin, L. Ji and H. Chao, Chem. Commun., 2017, 53, 1977–1980 RSC; (b) W. Piao, K. Hanaoka, T. Fujisawa, S. Takeuchi, T. Komatsu, T. Ueno, T. Terai, T. Tahara, T. Nagano and Y. Urano, J. Am. Chem. Soc., 2017, 139, 13713–13719 CrossRef CAS.
- (a) W. Sun, S. Guo, C. Hu, J. Fan and X. Peng, Chem. Rev., 2016, 116, 7768–7817 CrossRef CAS; (b) A. S. Waggoner and R. B. Mujumdar, US. Pat., 6133445A, Oct. 17, 2000.
- (a) M. Cooper, A. Ebner, M. Briggs, M. Burrows, N. Gardner, R. Richardson and R. West, J. Fluoresc., 2004, 14, 145–150 CrossRef CAS; (b) M. S. Michie, R. Gotz, C. Franke, M. Bowler, N. Kumari, V. Magidson, M. Levitus, J. Loncarek, M. Sauer and M. J. Schnermann, J. Am. Chem. Soc., 2017, 139, 12406–12409 CrossRef CAS.
- C. Xu and W. W. Webb, J. Opt. Soc. Am. B, 1996, 13, 481–491 CrossRef CAS.
- (a) L. M. Henderson and J. B. Chappell, Eur. J. Biochem., 1993, 217, 973–980 CrossRef CAS; (b) A. Gomes, E. Fernandes and J. L. Lima, J. Biochem. Biophys. Methods, 2005, 65, 45–80 CrossRef CAS; (c) J. S. Nam, M.-G. Kang, J. Kang, S.-Y. Park, S. J. C. Lee, H.-T. Kim, J. K. Seo, O.-H. Kwon, M. H. Lim, H.-W. Rhee and T.-H. Kwon, J. Am. Chem. Soc., 2016, 138, 10968–10977 CrossRef CAS.
- M. Li, Y. Shao, J. H. Kim, Z. Pu, X. Zhao, H. Huang, T. Xiong, Y. Kang, G. Li, K. Shao, J. Fan, J. W. Foley, J. S. Kim and X. Peng, J. Am. Chem. Soc., 2020, 142, 5380–5388 CrossRef CAS.
- (a) R. Radi, Proc. Natl. Acad. Sci. U.S.A., 2018, 115, 5839–5848 CrossRef CAS; (b) M. Hayyan, M. A. Hashim and I. M. AlNashef, Chem. Rev., 2016, 116, 3029–3085 CrossRef CAS.
- V.-N. Nguyen, Y. Yim, S. Kim, B. Ryu, K. M. K. Swamy, G. Kim, N. Kwon, C.-Y. Kim, S. Park and J. Yoon, Angew. Chem., Int. Ed., 2020, 59, 8957–8962 CrossRef CAS.
- (a) F. T. Andon and B. Fadeel, Acc. Chem. Res., 2013, 46, 733–742 CrossRef CAS; (b) I. Nicoletti, G. Migliorati, M. C. Pagliacci, F. Grignani and C. Riccardi, J. Immunol. Methods, 1991, 139, 271–279 CrossRef CAS.
- (a) B. Gu, W. Wu, G. Xu, G. Feng, F. Yin, P. H. J. Chong, J. Qu, K.-T. Yong and B. Liu, Adv. Mater., 2017, 29, 1701076 CrossRef; (b) S. Zhen, S. Wang, S. Li, W. Luo, M. Gao, L. G. Ng, C. C. Goh, A. Qin, Z. Zhao, B. Liu and B. Z. Tang, Adv. Funct. Mater., 2018, 28, 1706945 CrossRef; (c) S. Wang, W. Wu, P. Manghnani, S. Xu, Y. Wang, C. Goh, L. G. Ng and B. Liu, ACS Nano, 2019, 13, 3095–3105 CrossRef CAS.
- E. M. M. Manders, F. J. Verbeek and J. A. Aten, J. Microsc., 1993, 169, 375–382 CrossRef.
- (a) H. A. Collins, M. Khurana, E. H. Moriyama, A. Mariampillai, E. Dahlstedt, M. Balaz, M. K. Kuimova, M. Drobizhev, V. X. Yang and D. Phillips, Nat. Photonics, 2008, 2, 420–424 CrossRef CAS; (b) M. Khurana, H. A. Collins, A. Karotki, H. L. Anderson, D. T. Cramb and B. C. Wilson, Photochem. Photobiol., 2007, 83, 1441–1448 CrossRef CAS.
- (a) O. Tredan, C. M. Galmarini, K. Patel and I. F. Tannock, J. Natl. Cancer Inst., 2007, 99, 1441–1454 CrossRef CAS; (b) H. Huang, B. Yu, P. Zhang, J. Huang, Y. Chen, G. Gasser, L. Ji and H. Chao, Angew. Chem., Int. Ed., 2015, 54, 14049–14052 CrossRef CAS.
Footnotes |
| † Electronic supplementary information (ESI) available: Synthetic procedures for NCC1, ACC1 and ACC2; computational data; 1H-NMR, 13C-NMR, and HRMS data; supplemental figures and tables (PDF). See DOI: 10.1039/d0sc05686c |
| ‡ V. J. and C. S. L. contributed equally to this work. |
| This journal is © The Royal Society of Chemistry 2021 |

