 Open Access Article
Ex vivo identification of circulating tumor cells in peripheral blood by fluorometric “turn on” aptamer nanoparticles†
Wenxi
Xia
a,
Xiaoyan
Shangguan
a,
Miao
Li
ab,
Yang
Wang
a,
Dongmei
Xi
a,
Wen
Sun
 a,
Jiangli
Fan
 a,
Kun
Shao
*a and
Xiaojun
Peng
 *a
*a
aState Key Laboratory of Fine Chemicals, Dalian University of Technology, Dalian 116024, China. E-mail: pengxj@dlut.edu.cn
bSchool of Biological Engineering, Dalian Polytechnic University, Ganjingzi District, Dalian 116034, PR China
First published on 22nd December 2020
Abstract
The detection of the circulating tumor cells (CTCs) detached from solid tumors has emerged as a burgeoning topic for cancer diagnosis and treatment. The conventional CTC enrichment and identification mainly rely on the specific binding of the antibodies on the capture interface of the magnetic nanoparticles with the corresponding biomarkers on the cell membranes. However, these methods could easily generate false-negative results due to the extremely low concentration of CTCs and the internal heterogeneity of the tumor cells. Herein, with the aim of selectively identifying CTCs and improving the detection accuracy in peripheral blood, we designed the fluorometric “turn on” Au nanoparticles (DHANs) with the modification of a tumor-targeted moiety, dehydroascorbic acid (DHA) and a fluorometric aptamer, which could be “switched-on” by an over-expressed intracellular protein, namely hypoxia-inducible factor-1α (HIF 1α). This novel nanoformulated detection platform demonstrated the great capacity for visualizing various CTCs in peripheral blood with significantly improved detection efficiency and sensitivity. As a result, the nanoplatform has a great potential to be further applied for CTC detection in vitro or in vivo, which holds promise for extensive CTC studies.
Introduction
Circulating tumor cells (CTCs) detached from primary tumor sites into the peripheral blood have been regarded as one of the most promising biomarkers as “liquid biopsy” for clinical early diagnosis and disease progression prediction.1–7 However, the detection and enumeration of CTCs remain challenged since extremely rare CTCs (merely 1 CTC out of 1 × 10⁹ hematological cells) in blood impede the detection efficiency and capture purity.8,9 Moreover, the surface antigen markers of CTCs are variable due to heterogeneity, which further renders the application.10 Currently, the isolation of CTCs is generally applied based on morphologic criteria (cell size or density) and affinity-based strategy,11,12 which mainly rely on the specific binding of ligands (antibody, aptamer, peptide, etc.)13 on the capture interface of the magnetic nanoparticles with biomarkers (EpCAM, HER2, CK19, etc.)14–18 on the targeted cell membranes. However, considering the intrinsic characteristics of CTCs, even though they possess numerous merits, the disadvantages of currently available detection methods cannot be ignored. First, owing to the high heterogeneity of CTCs, false-positive signals are often generated during the CTC detection, which limits its extensive application.19 Second, CTCs would nonspecifically absorb proteins and other blood components in the process of enrichment, resulting in the high background interference. More importantly, CTCs usually exhibit an altered phenotype compared with the parental tumor cells from where they are derived, causing the inconsistent results between the in vitro mimic CTC assays with in vivo experiments. All these drawbacks limit the precise and extensive assessment of CTCs in actual samples. In order to overcome these limitations, developing a new detection strategy is desirable for wide CTC research.Tumor microenvironments, such as high reactive oxygen species (ROS) level, low pH and highly expressed enzymes, have gradually become effective biomarkers for tumor imaging and cancer therapy.20–27 Hypoxia, as an important feature of solid malignancies, associates with the activation of angiogenesis, metastasis and recurrence potential.28–30 As reported, the expression levels of many proteins are up-regulated when tumor cells stay in a hypoxic environment.31 Among these proteins, hypoxia-inducible factor-1α (HIF 1α) is a transcription activating factor that regulates gene expression induced by intracellular oxygen concentrations, particularly under hypoxia conditions, which play a critical role in numerous cancer biology activity including inflammatory response, angiogenesis, vasodilation, metabolic reprogramming, vascular permeability and the epithelial–mesenchymal transition (EMT).32–36 Moreover, HIF 1α then up-regulates the expression of target genes under hypoxia conditions such as facilitative glucose transporters (GLUT1), glycolytic enzymes, and lysyl oxidase (LOX).37,38 Herein, the up-regulated expression of HIF 1α and GLUT1 on tumor cells under hypoxia conditions could be considered as the distinctive characteristics, which were applied into CTC detection strategy in our study.
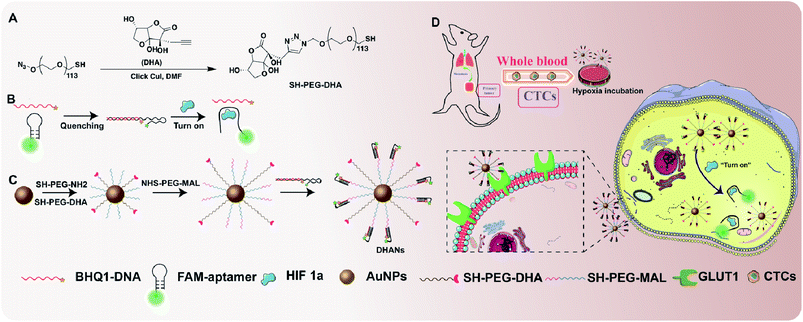
The functional ligands (antibodies, aptamers, proteins and peptides) could vector the nanoparticles to the tumor cells with overexpressed receptors. Compared with antibodies and peptides, aptamers (small oligonucleotides) have been successfully applied for tumor targeting due to their admirable pharmacokinetic properties, such as small size, simple synthesis and lack of immunogenicity.39–43 Recently, there are several publications about “turn-on” aptamers in the presence of HIF 1α.44,45 Herein, based on the favorable characteristics of aptamers, we introduced a partially double stranded oligonucleotide with HIF 1α-induced structural switch-ability, which was synthesized as a fluorescence biosensor for specifically detecting and identifying intracellular HIF 1α. The double stranded oligonucleotide was conjugated to AuNPs via a PEG segment. In addition, alkynated dehydroascorbic acid (DHA), as one excellent substrate of highly expressed GLUT1 on tumor cells,46,47 was also modified on the surface of the AuNP-aptamer by a click reaction. The formed DHA-nanoparticles could easily bind with CTCs owing to the high affinity of DHA towards GLUT1 and subsequently enter CTCs via endocytosis. In this study, a FAM-labeled aptamer (FAM-aptamer) and BHQ1-labeled DNA (BHQ1-DNA) were used as a fluorometric probe and quencher, respectively. In the absence of HIF 1α, the fluorescence of FAM was quenched by the approaching BHQ1 due to the partially hybridized structure. However, in the presence of HIF 1α, the secondary structure of the aptamer changed owing its higher affinity towards HIF 1α, and the fluorescence of FAM was recovered. Therefore, the fluorometric aptamer-conjugated AuNPs could be used to precisely identify CTCs by highly expressed HIF 1α in the hypoxic environment.
Thus, we designed the fluorometric “turn-on” Au nanoparticles (DHANs) with the modification of the tumor-targeted moiety, DHA and a HIF 1α-switchable fluorometric aptamer (Scheme 1). AuNPs have been selected as the carrier due to their significant advantages of high stability, longer circulation time and easy functionalization.48 This nanoformulated CTC detection platform exhibited great sensitivity and accuracy for he specifically detecting different types of CTCs under hypoxic conditions in vitro. Introducing hypoxia as a stimulus into the detection strategy could significantly improve the signal-to-background ratios and avoid the false-positive results. Importantly, the favorable detection nanoplatform implies its significant potential for extensive CTC research.
Results and discussion
Synthesis and characterization of DHANs
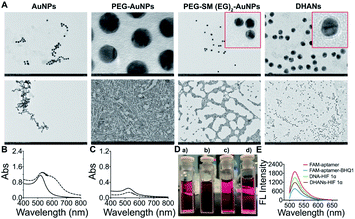
The as-prepared AuNPs with controlled size around 13 nm were the reduction product of gold ions by citrate.49 In order to stabilize AuNPs in a nonaggregated state in biological systems, PEG-derivatives, acting as a passivation layer, were coated onto the nanoparticles. Two classes of PEG thiols have been utilized: (1) SH-PEG5000-N3 possessing an azide group that could react with the acetylene DHA via click chemistry; (2) SH-PEG5000-NH2 offering an amino group to link with NHS-PEG-MAL, which possesses maleimide to react with SH-DNA double strands. The synthesis method of passivated AuNPs was referred to the previous literature.50,51 The synthesis route of DHA is shown in Scheme S1.†The 1H NMR, 13C NMR and HRMS spectra of DHA are shown in Fig. S1–S3.† The reaction between acetylene DHA with azide PEG is shown in Scheme 1A. The 1H NMR spectrum of DHA-PEG5000-SH is shown in Fig. S4.†
The morphology and dispersibility of various AuNPs were characterized by DLS (Table S1†). The transmission electron microscopy (TEM) of AuNPs shown in Fig. 1A demonstrated that all passivation systems afforded AuNPs were nonaggregated with better dispersion than bare gold nanoparticles. Both PEG and DNA layers could be clearly observed in TEM magnified images. Furthermore, we also investigated the stability of AuNPs in deionized water and cell culture medium (DMEM) by UV-vis measurements. As shown in Fig. 1B, the results showed that bare AuNPs are dispersed in deionized water with strong absorption at 518 nm; however, the coagulation and absorption band changed when the supernatant was centrifuged and added with the DMEM medium. Since passivated AuNPs could remain stable in the DMEM medium, similar as in the deionized water, UV absorption at 518 nm did not change obviously (Fig. 1C). This phenomenon could be directly observed by the naked eye. As shown in Fig. 1D, AuNPs dispersed in deionized water were stable red, and rapidly aggregated in the DMEM medium (blue), whereas the passivated AuNPs and DHANs could disperse uniformly and appear red in the DMEM medium. All these results demonstrated that DHANs were successfully obtained and showed a good stability in the DMEM medium, suggesting that they could be applied in subsequent cell biological experiments. Detail sequences of the DNA strand are listed in the ESI.† FAM fluorescence could be effectively quenched by BHQ1 to form a double strand, which has been confirmed by fluorescence intensity spectra. However, in the presence of HIF 1α, the aptamer tempted to bind with HIF 1α, the DNA double strands on DHANs were switched and the fluorescence of FAM was recovered (Fig. 1E).
Afterward, to verify the in vitro cytotoxicity of DHANs, methyl thiazolytetrazolium (MTT) assay was carried out. MCF-7 cells and 4T1 cells were incubated with different concentrations of DHANs for 24 h, respectively. It was worth noting that DHANs showed negligible cytotoxicity, demonstrating their comparable biocompatibility in vitro (Fig. S5†).
Cellular uptake and internalization mechanism
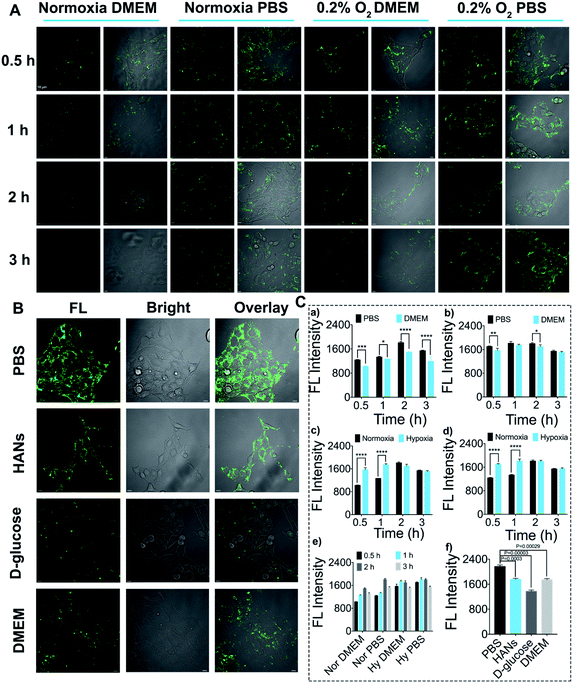
In order to study the applicability of DHANs to identify CTCs in vitro, 4T1 cells were selected for the assessment of cellular uptake and intracellular internalization mechanism. The effects of DHANs on the cell uptake were investigated at multiple levels including oxygen concentration, culture medium, incubation time and AuNP modification. First, to investigate the effect of oxygen concentration on the cellular uptake, we incubated 4T1 cells with 200 μg mL−1 DHANs under hypoxia (0.2% O2) and normoxia (21% O2), respectively. All the cellular uptakes of DHANs were evaluated by confocal laser scanning microscopy (CLSM). As shown in Fig. 2A, due to the high expression of HIF-1α in the hypoxic environment, the fluorescence intensity of 4T1 cells under 0.2% O2 content was significantly stronger than that in normal culture environment, which showed similar phenomenon in MCF-7 cells as well (Fig. S6†). It can be seen in Fig. 2C(c and d) of quantitative analysis that the fluorescence intensity of hypoxia was obviously higher than that of normoxia, whether in PBS or DMEM medium. The aforementioned results clearly demonstrated that HIF 1α was overexpressed in the hypoxia environment and the secondary structure of aptamer-DNA could be successfully switched inside the tumor cells, resulting in the green fluorescence release of the FAM probe.GLUT1, as one target of HIF 1α, also presented higher expression on the tumor cell membrane under hypoxic conditions. The concentrations of GLUT1 and HIF 1α in 4T1 cells under hypoxia and normoxia were verified via immunofluorescence and flow cytometry (Fig. S7†). Second, to further investigate the effects of the high targeting efficiency of DHANs, we chose the DMEM medium and PBS buffer as incubation media. The DMEM medium contained D-glucose concentration up to 10 mM, which would saturate GLUT1 as a competitive substrate and hinder the uptake of DHANs. As shown in Fig. 2A, the enhanced fluorescence signal of DHANs was detected in 4T1 cells in the PBS medium compared to that in the DMEM medium, and the quantitative analysis of the fluorescence intensity are shown in Fig. 2C(a and b).
To further explore the effect of GLUT1 on DHAN internalization, the PBS medium with 10 mM of D-glucose extra added was set as the negative control as well. As shown in Fig. 2B, compared with the PBS medium without D-glucose, the fluorescence intensity of 4T1 cells significantly decreased in that with 10 mM D-glucose, which confirmed that the cellular uptake of DHANs was mediated via GLUT1. In addition, the cellular uptakes of DHANs and HANs (without DHA modification) were compared as well. As shown in Fig. 2B, the fluorescence intensity of the DHAN-treated group was significantly obvious than that of the HAN-treated group under the same incubation conditions. As shown in Fig. 2C(f), the significant different constant P values of the PBS medium compared with those of the DMEM medium, PBS with extra D-glucose and HANs were 0.00029, 0.00003 and 0.0003, respectively. These results undoubtedly validated that DHA could effectively identify tumor cells with overexpressed GLUT1. Finally, we investigated the effects of the incubation time on the cellular uptake. 4T1 cells were incubated with 200 μg mL−1 DHANs for 0.5, 1, 2 and 3 h. As shown in Fig. 2A, the fluorescence intensity did not show an obvious increase with the extension of time, and the corresponding quantitative analysis of the fluorescence intensity is shown in Fig. 2C(e). Thus, 1 h was selected as the optimal incubation time. The intracellular co-localization of DHANs was carried out in 4T1 cells. The green fluorescence signals of DHANs overlapped well with the LysoTracker Red, suggesting the internalization of DHANs was through lysosome (shown in Fig. S8†).
Overall, the optimized condition for the CTC detection in vitro was under 0.2% O2 and PBS medium for 1 h. The above-mentioned results indicated that the high concentration of HIF 1α in tumor cells under hypoxia could effectively activate DHANs, and subsequently the “turn-on” green fluorescence signal from the FAM aptamer had the potential to precisely identify CTCs with high signal-to-background ratios in the complicated blood samples.
In vitro detection of spiked cells in blood as mimic CTC samples
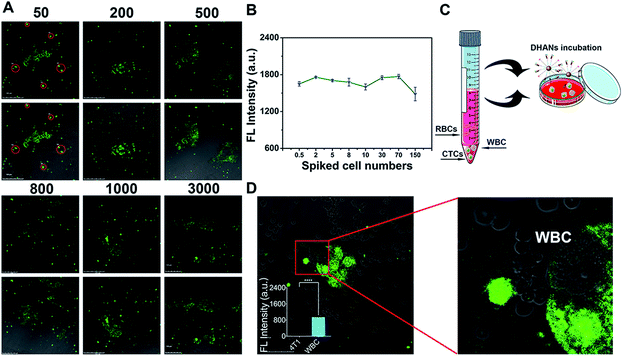
The detection ability of DHANs for CTCs in blood is a crucial factor. Therefore, we spiked 4T1 cells in fresh blood samples collected from the veins of nontumor-bearing mice for the evaluation of the detection ability of DHANs in mimic CTC samples. Under the optimized conditions, CTCs were allowed to adhere to the glass surface of culture dishes for 20 h (12 h 21% O2/8 h 0.2% O2 at 37 °C) after blood centrifugation to remove most red blood cells (RBCs). The dishes were washed with PBS (pH 7.4) and incubated with 200 μg mL−1 DHANs for additional 1 h in the PBS medium. After incubating with DHANs, CLSM imaging in living 4T1 cells are shown in Fig. 3A. The hypoxia environment did not interfere with the cell activity and morphology. Different densities of 4T1 cells were added to a 1 mL fresh blood samples. It was observed that there was no correlation between the fluorescence intensity and cell numbers, which could be beneficial to detect the CTC samples in even lower concentrations (Fig. 3B). As shown in Fig. 3A, the given concentrations of the spiked cell number ranging from 50 to 3000 mL−1, which could be identified by CLSM after a series of pro-process steps including hemolysis and centrifugation (Fig. 3C). The spiked CTCs might be lost in the processing step; however, the treated lower concentration CTCs still could be clearly observed, suggesting that FAM fluorescence triggered by HIF 1α and DHANs had good detection ability towards CTCs in blood.Subsequently, we further investigated the application and accuracy of DHANs for identifying CTCs in a whole sheep blood sample. To verify the extensive application of DHANs for detecting various tumor cells in different blood environments, we spiked MCF-7 cells in the sheep blood (Fig. S9†). As shown in Fig. 3A and S5,† DHANs had excellent identification capacity for both MCF-7 cells and 4T1 cells, even in the different blood samples. This result demonstrated that the extensive identification capacity of DHANs for various CTC types spiked in numerous blood environments.
Then, we further investigated the highly selective and precise detection of DHANs towards CTCs. As shown in the partially enlarged images (Fig. 3D), the fluorescence intensity of CTCs is higher than that of white blood cells (WBCs). WBCs showed negligible fluorescence signals. The fluorescence imaging of further control experiment in the absence of added 4T1 cells has been shown in Fig. S10.† The results indicated that DHANs were attempted to selectively bind with tumor cells compared to leukocytes, demonstrating that DHANs could achieve the specific recognition of tumor cells via the aptamer binding-induced “turn-on” green fluorescence signals of FAM. Herein, the identification purity of CTCs was greatly improved and avoided the high background interference of WBCs. According to the above simulated blood CTC experiments, DHANs showed few background interferences, excellent biocompatibility, extensive application and accurate specificity towards CTC identification in blood samples, which would be helpful for further applications in CTC research.
Murine 4T1 lung metastasis model for the real CTC detection
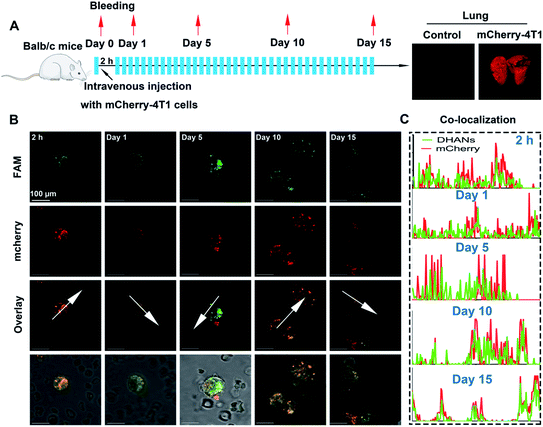
After demonstrating the in vitro identification ability of DHANs towards CTCs, we then constructed a tumor-conditioned medium (TCM)-stimulating mouse model for ex vivo detection. Mice breast cancer 4T1 cells were transfected with the red fluorescent protein (mCherry-4T1). The function of transduced implantation was essential for two reasons: (1) to probe the presence of CTCs in peripheral blood, tumor cells accumulated in lung during the blood circulation, corresponding to a decrease in veins due to the tissue accumulation; (2) to evaluate the precise identification of DHANs for CTCs by fluorescence co-localization. In our experiments, the transduced 4T1 cells were expanded and injected intravenously into normal BALB/c mice, and then, the mice were left to bleed at 2 h post-injection, or on day 1, 5, 10, and 15, respectively. Fig. 4A showed the timeline and treatment schedule for lung excision. All mice (1 normal mouse and 6 TCM mice) were euthanized on 15th day, and the lungs were harvested for further analysis using a stereoscopic microscope (Fig. 4A, Olympus, Japan). Blood from each mouse was collected, processed and then planted on the culture multiwell. The CTC samples collected from the mice were cultured for 12 h under the normoxia environment and then transferred to hypoxic conditions.The CTCs were incubated with 200 μg mL−1 DHANs in the PBS medium for 1 h before performing under CLSM. The blood glucose should not interfere with the detection results since GLUT1s on tumor cells were not fully saturated by the glucose molecules (∼6 mM) in the blood of mice. Secondly, the process of D-glucose transportation through GLUT1 is dynamic, and once inside the cells, glucose will be consumed rapidly as an energy resource in the hypoxic environment. Therefore, GLUT1 occupied by blood glucose should not affect the detection outcomes of CTCs by DHANs. Mounted wells were imaged on CLSM using a 100× oil objective to identify the CTC region. As shown in Fig. 4B, the fluorescence signals of mCherry and FAM well-overlapped, demonstrating DHANs could efficiently identify CTCs with a higher co-localization coefficient (Fig. 4C).
Besides, as it was seen from the merge imaging of bright and fluorescence, we investigated that DHANs exhibited the high level of specific recognition towards mCherry-CTCs, even though WBCs could introduce a negligible fluorescence signal. These results confirmed the excellent target-ability of DHANs towards CTCs and the high signal-to-background ratios brought by the HIF 1α-induced aptamer. As shown in Fig. 4B on day 10, CTC clusters produced by the aggregation of neighboring cells were also identified by DHANs, which further demonstrated the high sensitivity and extensive application of DHANs. These metastasis experiments attested to the good performance of our detection nanoplatform and reiterated the merits of DHANs for ex vivo probing of CTCs in complicated biological environments.
Identification of CTC in primary tumor sites and metastases
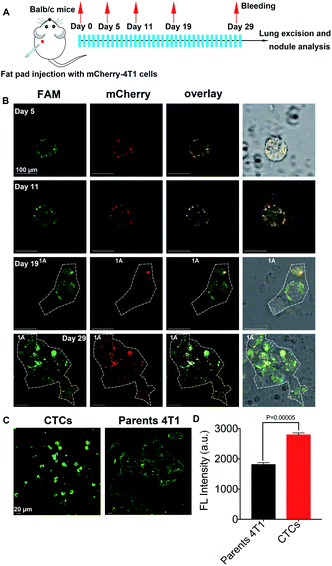
As reported, CTCs are considered to be the primary effector of metastasis.19 To further confirm that DHANs could identify CTCs, normal BALB/c mice (n = 6) were injected with 0.5 × 10⁶ mCherry-labeled 4T1 (mCherry-4T1) cells into the mammary fat pad to model lung metastasis. Fig. 5A shows the timeline and treatment schedule for lung excision. All mice were euthanized on the 29th day. As expected, primary breast tumors began to be overt observed after 3 weeks. Thus, at the premetastatic phase (day 0–14),52 partial CTCs were lost in the processing step or cleared by immune mechanisms, leading to the small amount CTCs present in drawn blood.53 In our system, the period of the lowest number of CTCs from each mouse on day 5 could be clearly detected in 1 mL blood. Fig. 5B shows the CTC imaging panel for the mCherry-4T1 cells on day 5, 11, 19, and 29. As shown in Fig. 5B, the fluorescence imaging displayed the high level of the specific recognition of our platform and DHAN-labeled CTCs are clearly distinguishable, although WBC introduced some false-negative signals. CTC clusters produced from day 19 further proved the extensive application of DHANs. In addition, some previous literature showed that CTCs expressed more HIF 1α in the hypoxia environment compared with parental 4T1 cells.31 The conclusion ensured that the identified CTCs via DHANs were exact tumor cells, rather than other epithelial cells released into circulation. As shown in Fig. 5C, the fluorescence intensity of CTCs was much higher than that of parental 4T1 cells under the same incubation conditions. As shown in Fig. 5D, the significant difference constant P values of CTCs compared with parental tumor cells were 0.00005, which directly confirmed our deduction.Conclusions
Taken together, a novel dehydroascorbic acid (DHA)-modified and hypoxia-inducible factor-1α (HIF 1α)-induced fluorometric aptamer-conjugated AuNPs (DHANs) had been successfully constructed, which exhibited high sensitivity towards the extensive detection of the CTCs under hypoxic physiological conditions. After the modification of DHA and HIF 1α aptamer, the identification accuracy of DHANs was greatly improved in vitro and ex vivo, which contributed to the HIF 1α-induced “turn on” fluorescence signal allowing the precise selectivity of CTCs with relatively high signal-to-background ratios. In addition, the response of DHANs towards CTCs could be widely utilized in various cancers, thus avoiding the false-negative results. The excellent ability of DHANs in identifying even single CTC from the whole blood sample demonstrated its potential in cancer diagnosis. Our platform might provide a novel strategy of CTC detection for further extensive clinical applications.Conflicts of interest
There are no conflicts to declare.Acknowledgements
All the animal procedures were carried out according to the Guidelines for Care and Use of Laboratory Animals of Dalian Medical University, and the experiment was approved by the Animal Protection and Use Committee of Dalian Medical University. All oligonucleotides were synthesized and HPLC-purified by TaKaRa Biotechnology Co., Ltd (Dalian, China). This work was supported by National Science Foundation of China (project 21421005), NSFC-Liaoning United Fund U1608222 and U1908202 and Young Top Talents in “Xingliao” Plan, XLYC1907123.Notes and references
- K. Chen, P. Dopico, J. Varillas, J. Zhang, T. J. George and Z. H. Fan, Angew. Chem., Int. Ed., 2019, 58, 7606–7610 CrossRef CAS.
- J. Tan, F. Zhang, D. Karcher and R. Bock, Nat. Commun., 2019, 10, 2019 CrossRef.
- G. He, J. Feng, A. Zhang, L. Zhou, R. Wen, J. Wu, C. Yang, J. Yang, C. Li, D. Chen, J. Wang, N. Hu and X. Xie, Nano Lett., 2019, 19, 7201–7209 CrossRef CAS.
- E. Lallana, F. Fernandez-Trillo, A. Sousa-Herves, R. Riguera and E. Fernandez-Megia, Pharm. Res., 2012, 29, 902–921 CrossRef CAS.
- X. Liu, J. Li, B. L. Cadilha, A. Markota, C. Voigt, Z. Huang, P. P. Lin, D. D. Wang, J. Dai, G. Kranz, A. Krandick, D. Libl, H. Zitzelsberger, I. Zagorski, H. Braselmann, M. Pan, S. Zhu, Y. Huang, S. Niedermeyer, C. A. Reichel, B. Uhl, D. Briukhovetska, J. Suárez, S. Kobold, O. Gires and H. Wang, Sci. Adv., 2019, 5, eaav4275 CrossRef.
- L. Wu, H. Ding, X. Qu, X. Shi, J. Yang, M. Huang, J. Zhang, H. Zhang, J. Song, L. Zhu, Y. Song, Y. Ma and C. Yang, J. Am. Chem. Soc., 2020, 142, 4800–4806 CrossRef CAS.
- F. Degliangeli, P. Kshirsagar, V. Brunetti, P. P. Pompa and R. Fiammengo, J. Am. Chem. Soc., 2014, 136, 2264–2267 CrossRef CAS.
- T. H. Kim, Y. Wang, C. R. Oliver, D. H. Thamm, L. Cooling, C. Paoletti, K. J. Smith, S. Nagrath and D. F. Hayes, Nat. Commun., 2019, 10, 1478 CrossRef.
- S. Sharma, R. Zhuang, M. Long, M. Pavlovic, Y. Kang, A. Ilyas and W. Asghar, Biotechnol. Adv., 2018, 36, 1063–1078 CrossRef CAS.
- J. H. Myung, K. A. Tam, S. Park, A. Cha and S. Hong, Wiley Interdiscip. Rev.: Nanomed. Nanobiotechnol., 2016, 8, 223–239 Search PubMed.
- W. Wang, H. Cui, P. Zhang, J. Meng, F. Zhang and S. Wang, ACS Appl. Mater. Interfaces, 2017, 9, 10537–10543 CrossRef CAS.
- S.-W. Lv, Y. Liu, M. Xie, J. Wang, X.-W. Yan, Z. Li, W.-G. Dong and W.-H. Huang, ACS Nano, 2016, 10, 6201–6210 CrossRef CAS.
- E. S. Johnson, S. Xu, H.-M. Yu, W.-F. Fang, Y. Qin, L. Wu, J. Wang, M. Zhao, P. G. Schiro, B. Fujimoto, J.-L. Chen and D. T. Chiu, Anal. Chem., 2019, 91, 14605–14610 CrossRef CAS.
- Y. Li, Q. Lu, H. Liu, J. Wang, P. Zhang, H. Liang, L. Jiang and S. Wang, Adv. Mater., 2015, 27, 6848–6854 CrossRef CAS.
- H. J. Yoon, T. H. Kim, Z. Zhang, E. Azizi, T. M. Pham, C. Paoletti, J. Lin, N. Ramnath, M. S. Wicha, D. F. Hayes, D. M. Simeone and S. Nagrath, Nat. Nanotechnol., 2013, 8, 735–741 CrossRef CAS.
- M. H. Park, E. Reátegui, W. Li, S. N. Tessier, K. H. K. Wong, A. E. Jensen, V. Thapar, D. Ting, M. Toner, S. L. Stott and P. T. Hammond, J. Am. Chem. Soc., 2017, 139, 2741–2749 CrossRef CAS.
- Z. Li, G. Wang, Y. Shen, N. Guo and N. Ma, Adv. Funct. Mater., 2018, 28, 1–11 Search PubMed.
- Z. M. Chang, Z. Wang, D. Shao, J. Yue, H. Xing, L. Li, M. Ge, M. Li, H. Yan, H. Hu, Q. Xu and W. F. Dong, ACS Appl. Mater. Interfaces, 2018, 10, 10656–10663 CrossRef CAS.
- R. G. Sobral-Filho, L. DeVorkin, S. Macpherson, A. Jirasek, J. J. Lum and A. G. Brolo, ACS Nano, 2018, 12, 1902–1909 CrossRef CAS.
- T. Wang, D. Wang, H. Yu, M. Wang, J. Liu, B. Feng, F. Zhou, Q. Yin, Z. Zhang, Y. Huang and Y. Li, ACS Nano, 2016, 10, 3496–3508 CrossRef CAS.
- E. Lee, X. Li, J. Oh, N. Kwon, G. Kim, D. Kim and J. Yoon, Chem. Sci., 2020, 11, 5735–5739 RSC.
- L. Wu, W. Zeng, L. Feng, Y. Hu, Y. Sun, Y. Yan, H.-Y. Chen and D. Ye, Sci. China: Chem., 2020, 63, 741–750 CrossRef CAS.
- M. Yang, J. Fan, W. Sun, J. Du, S. Long, K. Shao and X. Peng, Chem. Commun., 2019, 55, 8583–8586 RSC.
- K. Han, Q. Lei, H.-Z. Jia, S.-B. Wang, W.-N. Yin, W.-H. Chen, S.-X. Cheng and X.-Z. Zhang, Adv. Funct. Mater., 2015, 25, 1248–1257 CrossRef CAS.
- R. G. Sobral, L. DeVorkin, S. Macpherson, A. Jirasek, J. J. Lum and A. G. Brolo, ACS Nano, 2018, 12, 1902–1909 CrossRef.
- D. V. Hingorani, J. L. Crisp, M. K. Doan, M. F. Camargo, M. A. Quraishi, J. Aguilera, M. Gilardi, L. A. Gross, T. Jiang, W. T. Li, W. M. Ongkeko, E. E. W. Cohen, J. S. Gutkind, S. R. Adams and S. J. Advani, Biomaterials, 2020, 248, 120032 CrossRef CAS.
- M. Yang, J. Fan, J. Zhang, J. Du and X. Peng, Chem. Sci., 2018, 9, 6758–6764 RSC.
- H. Zhu, L. Zhang, Y. Liu, Y. Zhou, K. Wang, X. Xie, L. Song, D. Wang, C. Han and Q. Chen, Sci. Rep., 2016, 6, 39245 CrossRef CAS.
- T. Thambi, V. G. Deepagan, H. Y. Yoon, H. S. Han, S.-H. Kim, S. Son, D.-G. Jo, C.-H. Ahn, Y. D. Suh, K. Kim, I. Chan Kwon, D. S. Lee and J. H. Park, Biomaterials, 2014, 35, 1735–1743 CrossRef CAS.
- E. Paolicchi, F. Gemignani, M. Krstic-Demonacos, S. Dedhar, L. Mutti and S. Landi, Oncotarget, 2016, 7, 13464–13478 CrossRef.
- K. Ameri, R. Luong, H. Zhang, A. A. Powell, K. D. Montgomery, I. Espinosa, D. M. Bouley, A. L. Harris and S. S. Jeffrey, Br. J. Cancer, 2010, 102, 561–569 CrossRef CAS.
- G. L. Semenza, Trends Pharmacol. Sci., 2012, 33, 207–214 CrossRef CAS.
- D. Liao, C. Corle, T. N. Seagroves and R. S. Johnson, Cancer Res., 2007, 67, 563–572 CrossRef CAS.
- L. Zhang, G. Huang, X. Li, Y. Zhang, Y. Jiang, J. Shen, J. Liu, Q. Wang, J. Zhu, X. Feng, J. Dong and C. Qian, BMC Cancer, 2013, 13, 108 CrossRef CAS.
- M. Schindl, S. F. Schoppmann, H. Samonigg, H. Hausmaninger, W. Kwasny, M. Gnant, R. Jakesz, E. Kubista, P. Birner and G. Oberhuber, Clin. Cancer Res., 2002, 8, 1831–1837 CAS.
- K. Lee, H. Zhang, D. Z. Qian, S. Rey, J. O. Liu and G. L. Semenza, Proc. Natl. Acad. Sci. U. S. A., 2009, 106, 17910–17915 CrossRef CAS.
- J. T. Erler, K. L. Bennewith, M. Nicolau, N. Dornhöfer, C. Kong, Q.-T. Le, J.-T. A. Chi, S. S. Jeffrey and A. J. Giaccia, Nature, 2006, 440, 1222–1226 CrossRef CAS.
- H. M. Sowter, P. J. Ratcliffe, P. Watson, A. H. Greenberg and A. L. Harris, Cancer Res., 2001, 61, 6669–6673 CAS.
- C. Liu, J. Chen, G. Mao, C. Su, X. Ji and Z. He, Anal. Methods, 2016, 8, 5957–5961 RSC.
- S. D. Jayasena, Clin. Chem., 1999, 45, 1628–1650 CrossRef CAS.
- L. Xue, X. Zhou and D. Xing, Anal. Chem., 2012, 84, 3507–3513 CrossRef CAS.
- W. Sheng, T. Chen, W. Tan and Z. H. Fan, ACS Nano, 2013, 7, 7067–7076 CrossRef CAS.
- M. Labib, B. Green, R. M. Mohamadi, A. Mepham, S. U. Ahmed, L. Mahmoudian, I.-H. Chang, E. H. Sargent and S. O. Kelley, J. Am. Chem. Soc., 2016, 138, 2476–2479 CrossRef CAS.
- Q. Wang, W. Huang, P. Zhang, L. Chen, C. Luo, H. Zhou, L. Qing and P. Luo, Microchim. Acta, 2020, 187, 61 CrossRef CAS.
- R. Yang, W. Wu, Q. Chen, Q. Wang and J. Gao, ACS Biomater. Sci. Eng., 2018, 4, 2606–2613 CrossRef CAS.
- C. P. Corpe, J. H. Lee, O. Kwon, P. Eck, J. Narayanan, K. L. Kirk and M. Levine, J. Biol. Chem., 2005, 280, 5211–5220 CrossRef CAS.
- M. F. McCarty, Med. Hypotheses, 2013, 81, 664–670 CrossRef CAS.
- M.-C. Daniel and D. Astruc, Chem. Rev., 2004, 104, 293–346 CrossRef CAS.
- J. Du, H. Ge, Q. Gu, H. Du, J. Fan and X. Peng, Nanoscale, 2017, 9, 19139–19144 RSC.
- L. Maus, J. P. Spatz and R. Fiammengo, Langmuir, 2009, 25, 7910–7917 CrossRef CAS.
- L. Maus, O. Dick, H. Bading, J. P. Spatz and R. Fiammengo, ACS Nano, 2010, 4, 6617–6628 CrossRef CAS.
- R. N. Kaplan, R. D. Riba, S. Zacharoulis, A. H. Bramley, L. Vincent, C. Costa, D. D. MacDonald, D. K. Jin, K. Shido, S. A. Kerns, Z. Zhu, D. Hicklin, Y. Wu, J. L. Port, N. Altorki, E. R. Port, D. Ruggero, S. V. Shmelkov, K. K. Jensen, S. Rafii and D. Lyden, Nature, 2005, 438, 820–827 CrossRef CAS.
- B. Hong and Y. Zu, Theranostics, 2013, 3, 377–394 CrossRef CAS.
Footnote |
| † Electronic supplementary information (ESI) available: Synthetic route of DHA, 1H NMR and HRMS spectra of DHA, summary of nanoparticle properties, MTT assay of DHANs in living cells, cellular uptake of DHANs on living cells and the fluorescence imaging of spiked MCF-7 cells in sheep blood. See DOI: 10.1039/d0sc05112h |
| This journal is © The Royal Society of Chemistry 2021 |

