 Open Access Article
Creative Commons Attribution 3.0 Unported Licence
Aggregation-induced phosphorescence sensitization in two heptanuclear and decanuclear gold–silver sandwich clusters†
Zhou
Lu‡
 ab,
Yu-Jie
Yang‡
c,
Wen-Xiu
Ni
 d,
Mian
Li
 c,
Yifang
Zhao
 a,
Yong-Liang
Huang
 d,
Dong
Luo
 a,
Xiaoping
Wang
 e,
Mohammad A.
Omary
 *b and
Dan
Li
 *a
*a
aCollege of Chemistry and Materials Science, Guangdong Provincial Key Laboratory of Functional Supramolecular Coordination Materials and Applications, Jinan University, Guangzhou 510632, P. R. China. E-mail: danli@jnu.edu.cn
bDepartment of Chemistry, University of North Texas, 1155 Union Circle #305070, Denton, Texas 76203, USA. E-mail: omary@unt.edu
cDepartment of Chemistry, Shantou University, Guangdong 515063, P. R. China
dDepartment of Chemistry, Shantou University Medical College, Shantou, Guangdong 515041, P. R. China
eNeutron Scattering Division, Oak Ridge National Laboratory, Oak Ridge, Tennessee 37831-6475, USA
First published on 30th October 2020
Abstract
The strategy of aggregation-induced emission enhancement (AIEE) has been proven to be efficient in wide areas and has recently been adopted in the field of metal nanoclusters. However, the relationship between atomically precise clusters and AIEE is still unclear. Herein, we have successfully obtained two few-atom heterometallic gold–silver hepta-/decanuclear clusters, denoted Au6Ag and Au9Ag, and determined their structures by X-ray diffraction and mass spectrometry. The nature of the AuI⋯AgI interactions thereof is demonstrated through energy decomposition analysis to be far-beyond typical closed-shell metal–metal interaction dominated by dispersion interaction. Furthermore, a positive correlation has been established between the particle size of the nanoaggregates and the photoluminescence quantum yield for Au6Ag, manifesting AIEE control upon varying the stoichiometric ratio of Au![[thin space (1/6-em)]](https://www.rsc.org/images/entities/char_2009.gif) :
:![[thin space (1/6-em)]](https://www.rsc.org/images/entities/char_2009.gif) Ag in atomically-precise clusters.
Ag in atomically-precise clusters.
Introduction
Synthesis of few-atom nanoclusters (NCs) is a work of art and represents the atomic precision of chemistry, building a bridge from traditional coordination chemistry to plasmonic metal clusters.1–5 With advanced single crystal X-ray analysis and high-quality mass spectrometry techniques at hand, precise formulas and total structures of both cluster kernels and protecting ligands can be obtained to facilitate the exploration of the structure–property relationship at the molecular scale.6,7 Nevertheless, achieving a unanimous interpretation of metallophilicity (aka. metal–metal interaction) in fields spanning from oligomeric metal complexes to atomically precise metal NCs remains a Sisyphus task by means of multiple descriptions in different narratives.1,2,8–18So far, the majority of research studies in these fields have focused on same-atom clusters rather than heterometallic ones due to the synthetic challenge of controllable doping/tailoring of another kind of atom at the level of atomic precision.5,7,14,19 One of the topical studies is the doping of silver atoms into gold clusters, whereby their same valence shell electrons and similar coordination modes could bring unique optoelectronic behaviours.20–26 A representative example is gradually substituting gold atoms with silver in the 25-metal-atom NC AgxAu25−x and the 13th silver atom replacement results in a 200-fold boost in photoluminescence quantum yield (ΦPL)20 which is attributed to a combination of stabilization of the lowest unoccupied molecular orbital (LUMO), rigidity enhancement, and symmetry preservation despite the great perturbation of the electronic structure.21 In other words, the stoichiometric ratio of Au![[thin space (1/6-em)]](https://www.rsc.org/images/entities/char_2009.gif) :
:![[thin space (1/6-em)]](https://www.rsc.org/images/entities/char_2009.gif) Ag is a key factor in regulating the photophysics of these molecular clusters.22–26
Ag is a key factor in regulating the photophysics of these molecular clusters.22–26
The aggregation of molecules in solution is a ubiquitous phenomenon in supramolecular and biological systems and has been recognized as a promising strategy to enhance the photoluminescence of ordered nanostructures by virtue of metal–metal interactions/bondings,27–30 sometimes accompanied by other non-covalent interactions among the protecting ligands (e.g. π–π/C–H⋯π interactions, hydrogen bonding).31 The concept of aggregation-induced emission (AIE), first discovered in a class of organic molecules undergoing a mechanism of restriction of intramolecular motions (RIM) to boost luminescence,32 is now relegated to a phenomenal description propagating broadly to many areas, such as metal complexes,33,34 supramolecular cages35,36 and self-assembled metal NCs.27,37–44 It is unsurprising that a mist steals over the comprehension of AIE in NCs given the deadlock of even more blurred structure–property correlation compared with the aforementioned.
Previously, we have demonstrated the self-assembly of a cyclic trinuclear AuI–pyrazolate complex and silver cation in solution or by mechanochemistry approaches and managed to determine the single crystallographic structure of a heptanuclear sandwich-like cluster.45 Herein, we report the synthesis, crystal structure, metal–metal bonding analyses, and unusual observation of stoichiometric-ratio-dependent aggregation-induced emission enhancement (AIEE) in the self-assembly processes of two atomically precise gold–silver clusters in solution.
Results and discussion
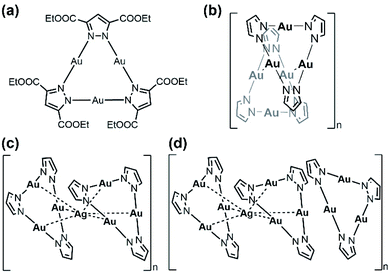
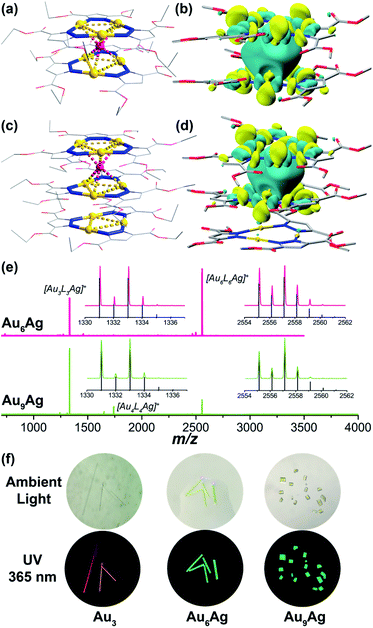
The cyclic trinuclear AuI complex (denoted Au3, Scheme 1a) based on the ligand bis-3,5-(ethoxycarbonyl)2-1H-pyrazole (HL) was chosen as the precursor due to its unique near-planar geometry and aromatic/electron-rich property.1,2,46 In previous work done by Chilukuri, Omary, Hipps, and co-workers, Au3 showed one-dimensional chair-stacking led by two pairs of alternate intermolecular AuI⋯AuI interactions (Scheme 1b, 3.273 Å & 3.493 Å).47 The reported routes to heterometallic NCs include co-reduction of two metal ion precursors, intercluster reactions and metal tailoring to homometallic NCs, which lack the prediction of the doping/alloying positions. Controllable syntheses at a precise atomic level have been occasionally reported by adopting a metal cluster as the precursor owing to abundant metal/ligand interacting sites, especially through the insertion of a silver cation into Au NCs.14,48 In the present work, solution-based reactions between Au3 and AgPF6 in different stoichiometric ratios afford two sandwich-like clusters [Au3–Ag+–Au3][PF6−] and {Au3–Ag+–[Au3]2}[PF6−] (denoted Au6Ag and Au9Ag, Scheme 1c and d) supported by Lewis-acid/π-base and cation–π interactions, restricting foreign ions along the C3 axis (Fig. 1).X-ray photoelectron spectroscopy (XPS) studies proved the monovalence of the gold and silver atoms without reduction before or after the reactions (Fig. S5†). Single crystals suitable for X-ray structural analysis were obtained from gas-phase diffusion or slow evaporation under room temperature for needle-like Au6Ag and block-shaped Au9Ag, respectively. X-ray crystallographic studies reveal that both heterometallic AuI–AgI clusters exhibit infinite column stacking modes in one dimension (c-axis), containing sandwich-like [Au3–Ag+–Au3] fragments (Fig. 1a, c and S13–S15†). Au6Ag crystallizes in a P![[6 with combining macron]](https://www.rsc.org/images/entities/char_0036_0304.gif) space group and Au9Ag crystallizes in a P
space group and Au9Ag crystallizes in a P![[6 with combining macron]](https://www.rsc.org/images/entities/char_0036_0304.gif) 2c space group; Au3 species remain intact in both heterobimetallic clusters and follow the C3 rotation symmetry. Different from other ligand-unsupported Au–Ag clusters, the sole silver cation is totally surrounded by six Au atoms (not coordinated with organic ligands) to form a twisted trigonal prism; the distances of the Au–Ag contacts fall in the range of 2.617(5)–2.7871(7) Å (Table S2†), shorter than most ligand-supported/unsupported gold–silver contacts.49 Besides, in Au9Ag, we also find an additional Au3 in the repeating unit showing close intertrimer Au⋯Au distances of 3.175(6)–3.649(3) Å (Fig. 1c). The full-sandwich-like fragments ([Au6L6Ag]+, m/z = 2557.198 in Au6Ag; 2557.138 in Au9Ag) and half-sandwich fragments ([Au3L3Ag]+, m/z = 1333.060 in Au6Ag; 1333.009 in Au9Ag), as well as their resolved isotopic peaks, are confirmed by matrix-assisted laser desorption/ionization time-of-flight mass spectroscopy (MALDI-TOF-MS, Fig. 1e). The full triple-decker cluster of Au9Ag ([Au9L9Ag]+, calculated m/z = 3781.253) could not be observed in the MS study, probably due to the lability of the intermolecular AuI⋯AuI interactions.
2c space group; Au3 species remain intact in both heterobimetallic clusters and follow the C3 rotation symmetry. Different from other ligand-unsupported Au–Ag clusters, the sole silver cation is totally surrounded by six Au atoms (not coordinated with organic ligands) to form a twisted trigonal prism; the distances of the Au–Ag contacts fall in the range of 2.617(5)–2.7871(7) Å (Table S2†), shorter than most ligand-supported/unsupported gold–silver contacts.49 Besides, in Au9Ag, we also find an additional Au3 in the repeating unit showing close intertrimer Au⋯Au distances of 3.175(6)–3.649(3) Å (Fig. 1c). The full-sandwich-like fragments ([Au6L6Ag]+, m/z = 2557.198 in Au6Ag; 2557.138 in Au9Ag) and half-sandwich fragments ([Au3L3Ag]+, m/z = 1333.060 in Au6Ag; 1333.009 in Au9Ag), as well as their resolved isotopic peaks, are confirmed by matrix-assisted laser desorption/ionization time-of-flight mass spectroscopy (MALDI-TOF-MS, Fig. 1e). The full triple-decker cluster of Au9Ag ([Au9L9Ag]+, calculated m/z = 3781.253) could not be observed in the MS study, probably due to the lability of the intermolecular AuI⋯AuI interactions.
To evaluate the binding energies of ligand-unsupported AuI⋯AgI and AuI⋯AuI interactions, density functional theory (DFT) calculations were carried out (ESI,† Computational section). In previous reports, the estimated energy of 14 kcal mol−1 was regarded as ligand-unsupported AuI⋯AgI metallophilicity and ground state charge-transfer character, behaving like “loose clusters”.9 Here, our energy decomposition analysis (EDA) reveals that electrostatic attraction and orbital interaction also make considerable contributions, suggesting that the interaction between the silver cations and Au3 is beyond Lewis acid/π-base or cation–π interactions (Fig. S28†). The orbital interaction value of ∼18 kcal mol−1 for each ligand-unsupported AuI⋯AgI interaction (six pairs of ∼110 kcal mol−1 in total, Table S9†) is regarded as strong (dative) bonding by the natural orbitals for chemical valence (NOCV) method with electron-sharing from gold to silver, along with considerable dispersion energy (Fig. S29–S33†).8,18,50,51 A recent report revealed that for metal–metal bonds of metals with filled d-orbitals, the charge-shift character increases as the covalency decreases.52 The electrostatic interactions lead to contributions of about 50% to the attraction energies in the EDA results, corresponding to the remarkable charge-shift character of the later transition metals. As a result, the synergic non-bonding interactions, including Lewis acid/π-base interactions (electrostatic derivation) and closed-shell metal–metal interactions (dispersion force), lead to Au–Ag bonding (orbital interactions) with remarkable bonding energies. Besides, the intertrimer AuI⋯AuI interactions in Au9Ag are only reckoned as aurophilicity-mediated by relativistic effects, reflected by the other derivative dispersion energy.53 According to the molecular orbital analysis, the LUMOs of Au6Ag* and Au9Ag* (replacing ethoxycarbonyl with methoxycarbonyl groups due to little contribution to the electronic structures) are mainly composed of the Au 5d and Ag 5s atomic orbitals in the sandwich-like fragments (Fig. 1b and d), showing strong sd hybridizations attributed to relativistic contractions.7,20,54 The inserted silver cation only alters the electronic density of the sandwich-like fragments in Au9Ag*, with the additional Au3 hardly contributing to the LUMO.45 By contrast, the composition of the 5dz2 orbitals from all Au atoms could be identified in doubly-degenerate filled frontier orbitals (two highest-occupied molecular orbitals (HOMOs) and two next-HOMOs (HOMO−1s) – see Fig. S36–S37†). This indicates remarkable metal contribution to the frontier occupied molecular orbitals. The energy level diagram (Scheme S1†) clearly reflects the great perturbation of the inserted silver ions, rendering higher-density electron delocalization in the metal kernels, as well as more stabilized frontier virtual orbitals (LUMOs) and narrower HOMO–LUMO gaps.
Au3, Au6Ag, and Au9Ag are all strongly emissive in the solid state (Fig. 1f and S16†). The homometallic Au3 emits at the maximum of 670 nm with ΦPL of 67.5% under room temperature; both heterobimetallic nanoclusters Au6Ag and Au9Ag show the maximum emission peak at 496 nm with ΦPL of 43.9% and 12.0%, respectively. The room-temperature emission lifetimes fall into the microsecond region (τ = 15.32, 9.31, and 9.11 μs for Au3, Au6Ag, and Au9Ag, respectively; Table S5, Fig. S25 and S26†), characteristic of phosphorescence. Time-dependent density functional theory (TD-DFT) calculations reveal that the phosphorescence of Au3 originates from intra-ligand charge transfer (3ILCT) and metal-to-ligand charge transfer (3MLCT), despite the relatively short intermolecular Au⋯Au distances. In contrast, the added AuI⋯AgI bonding manifests as low-energy absorption (around 400 nm, Fig. S17†), consistent with the TD-DFT results of ligand-protected metal centred (1MC/3MC) characteristics (Fig. S28 and Tables S14–S17†).
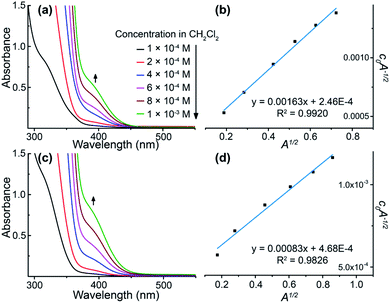
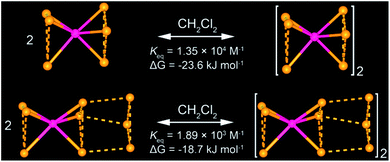
All of these homometallic and heterometallic clusters show good solubility in dichloromethane solution and are still strongly emissive. Unlike common phosphorescent complexes/clusters,55–57 it is exciting that these NCs are insensitive to oxygen quenching due to ligand-protected metal cores (Table S8†). Au3 exhibits a high-energy absorption peak at 264 nm and two distinct emission peaks at around 350 and 710 nm in CH2Cl2 solution (Fig. S22†), which fall into the near UV and infrared regions. As shown in Fig. 2a and c, both Au6Ag and Au9Ag exhibit a high-energy monomer absorbance peak at around 315 nm and an additional low-energy oligomer band at around 390 nm at higher concentrations. By calculations of apparent molar extinction coefficients, deviation from Beer's law is observed for the lower-energy absorption bands around 390 nm, as depicted and analysed in Fig. 2b, d, and S21,† respectively.58 Further analyses and good linearities confirm the assumption of monomer–dimer aggregations of both Au6Ag and Au9Ag in CH2Cl2 solution, giving rise to remarkable nanoscale clustering into an [Au6Ag]2 tetradecanuclear 14-metal-atom cluster and an [Au9Ag]2 icosanuclear 20-metal-atom cluster—giving rise to respective equilibrium constants (Keq) of ca. 1.35 × 10⁴ M−1 and 1.89 × 10³ M−1, and Gibbs free energy (ΔG) of −23.6 and −18.7 kJ mol−1 at 298 K (Table S6† and Chart 1).
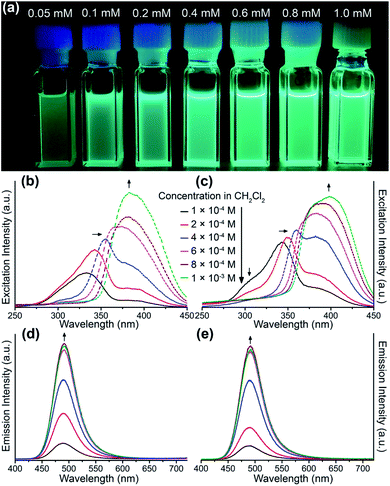
Solution-state photoluminescence measurements were also conducted for both heterobimetallic clusters and only Au6Ag shows a dependent correlation between the luminescence efficiency and concentration (Fig. 3a). Similar to the absorption spectra, a consistent trend of excitation energy versus concentration is also observed for both Au6Ag and Au9Ag (Fig. 3b and c), showing intensity increment of the low-energy band and bathochromic shift of the high-energy band, which finally combine into a broad excitation band at high concentrations.45 Moreover, the positive correlations between the luminescence intensity and concentrations of these two clusters are also verified. Different from the absorption and excitation, no spectral shift, but increased emission intensities, are observed when concentrating the gold–silver clusters in solution, both showing maxima at 491 nm (Fig. 3d and e), almost identical to that of solid-state emissions.
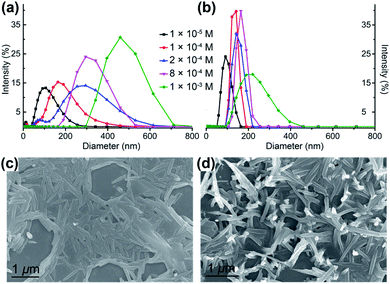
A further step is to demonstrate that the gold–silver clusters have indeed undergone aggregation processes in solution and to quantify the emission enhancement, i.e. fully confirming the AIEE phenomenon. Dynamic light scattering (DLS) experiments clearly reveal the generation of nanoaggregates of Au6Ag and Au9Ag (Fig. 4a, b and Table 1), which could also be witnessed by scanning electron microscopy (Fig. 4c, d and S10†). The average particle diameter of Au6Ag expands from 109 nm at 0.01 mM to 471 nm at 1.0 mM, while that of Au9Ag remains at around 150 nm in the range of 0.1 mM and 1.0 mM. As shown in Table 1, the size of the nanoaggregates directly influences the ΦPL magnitudes, which range from ΦPL of 27.0% to 60.6% for an average diameter of 179 nm to 471 nm, respectively, for Au6Ag. In contrast, Au9Ag exhibits steady ΦPL values of around 37% and particle diameters of around 150 nm. It is interesting to observe such an unusual stoichiometric-ratio-dependent AIEE behaviour in a system of atomically precise clusters.
| Cluster | Concentration [mM] | Average particle diameter [nm] | Φ PL [%] |
|---|---|---|---|
| Au6Ag | 0.1 | 179 | 27.0 |
| 0.2 | 283 | 31.6 | |
| 0.4 | — | 42.8 | |
| 0.6 | — | 51.8 | |
| 0.8 | 316 | 50.2 | |
| 1.0 | 471 | 60.6 | |
| Au9Ag | 0.1 | 134 | 34.0 |
| 0.2 | 148 | 36.4 | |
| 0.4 | — | 40.9 | |
| 0.6 | — | 36.4 | |
| 0.8 | 166 | 39.5 | |
| 1.0 | 216 | 34.2 |
A helpful insight to justify the ΦPL/AIEE trend variation in the hepta- vs. deca-nuclear clusters herein is provided by the calculated radiative/non-radiative decay rate constants (Au6Ag: 1.69/4.59 × 104 s−1 at 0.1 mM, 3.19/2.07 × 104 s−1 at 1.0 mM; Au9Ag: 2.05/3.98 × 104 s−1 at 0.1 mM, 1.94/3.74 × 104 s−1 at 1.0 mM). For Au6Ag, the inhibition of non-radiative decay upon aggregation is in line with the phenomenal description of AIE,32 but the promotion of the radiative transition efficiency is unconventional. Comparing the crystallographic disorder in the columnar structures of Au6Ag and Au9Ag (Fig. S14 and S15†), one might notice that the silver cations in the former experience partial occupancy disorder along the C3 axis. In the literature, weakly-disordered systems with reduced effective mass were suggested to have strong electron/hole mobility that is responsible for the enhanced photoluminescence.20,59 Besides, via quantitative analysis of solution-state absorption spectra, we have attained a 7× larger equilibrium constant (Keq) for Au6Ag than for Au9Ag, suggesting a stronger tendency for the former to aggregate in solution (Table S6† and Chart 1).
Conclusions
Herein, different narratives for ligand-unsupported d10–d10 M–M′ interactions (with covalent bonding strength) and aggregation-induced emission enhancement (with larger than doubled ΦPL) are provided for sandwich-like gold–silver clusters through a combined experimental/computational study. The synergy effect, from Lewis acid/π-base interactions and metal–metal interactions (metallophilicity), gives rise to enhanced stability of the sandwich-like structures with ligand-unsupported Au–Ag bonding interactions and the comprehension of the bonding nature between d10 metals. The regulation of the stoichiometric ratio of Au![[thin space (1/6-em)]](https://www.rsc.org/images/entities/char_2009.gif) :
:![[thin space (1/6-em)]](https://www.rsc.org/images/entities/char_2009.gif) Ag in the nanoclusters with similar morphology results in nanocluster aggregation and further emission enhancement. Thus, a bridge is built between the effect of doping a foreign silver ion into cyclic trinuclear AuI complexes and the photophysical properties regulated by the Au
Ag in the nanoclusters with similar morphology results in nanocluster aggregation and further emission enhancement. Thus, a bridge is built between the effect of doping a foreign silver ion into cyclic trinuclear AuI complexes and the photophysical properties regulated by the Au![[thin space (1/6-em)]](https://www.rsc.org/images/entities/char_2009.gif) :
:![[thin space (1/6-em)]](https://www.rsc.org/images/entities/char_2009.gif) Ag ratio in the aggregated nanoclusters.
Ag ratio in the aggregated nanoclusters.
Experimental section
Materials
All starting materials were purchased from commercial sources and used as received without further purification. The solvents used for synthesis were of analytical grade and those for the photophysical studies were of HPLC grade. Detailed characterization methods are included in the ESI.†Synthesis of cyclo-trimer gold(I) bis-3,5-(ethoxycarbonyl)2-pyrazolate Au3
To 15 mL of an ethanol solution of bis-3,5-(ethoxycarbonyl)2-1H-pyrazole (HL, 0.106 g, 0.5 mmol), 30 mL of an acetone solution of gold(tetrahydrothiophene)chloride (0.160 g, 0.5 mmol) was added. After the addition of a few drops of anhydrous triethylamine, a white precipitate immediately formed and the suspension was stirred for another 15 min to react completely. The white precipitate was collected by filtration and washed with methanol, acetone, and diethyl ether (3 × 1 mL for each) in a high yield (0.165 g, yield 82%) showing bright red emission under UV light. UV-vis in CH2Cl2 (λmax/nm): 264. FT-IR (KBr pellet, ν/cm−1): 3169w, 2984w, 1735s, 1465m, 1433m, 1387m, 1370m, 1257s, 1180s, 1089m, 1039m, 1018w, 848s, 759m, 628w. Elemental analyses for Au3C27O12N6H33, found: C, 26.82; H, 2.929; N, 6.75; calcd: C, 26.48; H, 2.716; N, 6.86. 1H-NMR (CDCl3, 400 MHz): δ/ppm = 7.60 (s, 2.7, –pyrazolate), 4.45 (q, 12.0, –CH2–), 1.40 (t, 18.5, –CH3).Synthesis of [Au3–Ag–Au3][PF6] (Au6Ag)
A mixture of AgPF6 (0.008 g, 0.03 mmol) and two equivalents of Au3 (0.077 g, 0.06 mmol) in 10 mL of CH2Cl2 solution was stirred under room temperature for 30 min to afford a greenish suspension. Needle-like crystals of [Au3–Ag–Au3][PF6] (denoted as Au6Ag) were obtained by diffusing n-hexane/diethylether (3![[thin space (1/6-em)]](https://www.rsc.org/images/entities/char_2009.gif) :
:![[thin space (1/6-em)]](https://www.rsc.org/images/entities/char_2009.gif) 2, v/v) into the greenish transparent filtrate (0.068 g, yield 80%). MALDI-TOF-MS (α-cyano-4-hydroxycinnamic acid as the matrix): m/z for [Au3L3Ag]+: found 1333.060, calcd 1333.020; [Au6L6Ag]+: found 2557.198, calcd 2557.134. FT-IR (KBr pellet, ν/cm−1): 3169w, 2984m, 1128s, 1710s, 1531m, 1470m, 1428w, 1389w, 1369m, 1308m, 1271s, 1255s, 1230s, 1178s, 1080s, 1038m, 1018w, 852m, 762s, 628w. Elemental analyses for Au6C54O24N12H66AgPF6, found: C, 24.33; H, 2.305; N, 6.35. Calcd: C, 24.01; H, 2.462; N, 6.22. 1H-NMR (CDCl3 + CH2Cl2, 500 MHz): δ/ppm = 6.68 (br, 6.2, –pyrazolate), 4.04 (br, 24.0, –CH2–), 1.21 (br, 36.8, –CH3).
2, v/v) into the greenish transparent filtrate (0.068 g, yield 80%). MALDI-TOF-MS (α-cyano-4-hydroxycinnamic acid as the matrix): m/z for [Au3L3Ag]+: found 1333.060, calcd 1333.020; [Au6L6Ag]+: found 2557.198, calcd 2557.134. FT-IR (KBr pellet, ν/cm−1): 3169w, 2984m, 1128s, 1710s, 1531m, 1470m, 1428w, 1389w, 1369m, 1308m, 1271s, 1255s, 1230s, 1178s, 1080s, 1038m, 1018w, 852m, 762s, 628w. Elemental analyses for Au6C54O24N12H66AgPF6, found: C, 24.33; H, 2.305; N, 6.35. Calcd: C, 24.01; H, 2.462; N, 6.22. 1H-NMR (CDCl3 + CH2Cl2, 500 MHz): δ/ppm = 6.68 (br, 6.2, –pyrazolate), 4.04 (br, 24.0, –CH2–), 1.21 (br, 36.8, –CH3).
Synthesis of {[Au3]2–Ag–Au3}[PF6] (Au9Ag)
A mixture of AgPF6 (0.008 g, 0.03 mmol) and more than three equivalents of Au3 (0.123 g, 0.10 mmol) in 10 mL of CH2Cl2 solution was stirred under room temperature for 30 min to afford a greenish suspension. After evaporating off the greenish filtrate under room temperature, block-shaped crystals along with a black solid could be found in the vial. A mixed solvent of ethyl acetate and CH2Cl2 (1![[thin space (1/6-em)]](https://www.rsc.org/images/entities/char_2009.gif) :
:![[thin space (1/6-em)]](https://www.rsc.org/images/entities/char_2009.gif) 10, v/v) was used to dissolve the crystals and insoluble substances were filtered out. Block-shaped crystals of {[Au3]2–Ag–Au3}[PF6] (denoted as Au9Ag) were obtained by evaporating the greenish transparent ethyl acetate/CH2Cl2 filtrate under room temperature (0.056 g, yield 47%). MALDI-TOF-MS (α-cyano-4-hydroxycinnamic acid as the matrix): m/z for [Au3L3Ag]+, found 1333.009, calcd 1333.020; [Au4L4Ag]+, found 1741.057, calcd 1741.059; [Au6L6Ag]+: found 2557.138, calcd 2557.134. FT-IR (KBr pellet, ν/cm−1): 2982m, 1740s, 1716s, 1635w, 1526w, 1472m, 1435m, 1386m, 1368m, 1254s, 1174s, 1082m, 1038m, 843s, 757m, 626w, 558w. Elemental analyses for Au9C81O36N18H99AgPF6, found: C, 24.96; H, 2.578; N, 6.53. Calcd: C, 24.78; H, 2.541; N, 6.42. 1H-NMR (CDCl3 + CH2Cl2, 500 MHz): δ/ppm = 7.44 (br, 10.9, –pyrazolate), 4.40 (br, 36.0, –CH2–), 1.39 (t, 52.4, –CH3).
10, v/v) was used to dissolve the crystals and insoluble substances were filtered out. Block-shaped crystals of {[Au3]2–Ag–Au3}[PF6] (denoted as Au9Ag) were obtained by evaporating the greenish transparent ethyl acetate/CH2Cl2 filtrate under room temperature (0.056 g, yield 47%). MALDI-TOF-MS (α-cyano-4-hydroxycinnamic acid as the matrix): m/z for [Au3L3Ag]+, found 1333.009, calcd 1333.020; [Au4L4Ag]+, found 1741.057, calcd 1741.059; [Au6L6Ag]+: found 2557.138, calcd 2557.134. FT-IR (KBr pellet, ν/cm−1): 2982m, 1740s, 1716s, 1635w, 1526w, 1472m, 1435m, 1386m, 1368m, 1254s, 1174s, 1082m, 1038m, 843s, 757m, 626w, 558w. Elemental analyses for Au9C81O36N18H99AgPF6, found: C, 24.96; H, 2.578; N, 6.53. Calcd: C, 24.78; H, 2.541; N, 6.42. 1H-NMR (CDCl3 + CH2Cl2, 500 MHz): δ/ppm = 7.44 (br, 10.9, –pyrazolate), 4.40 (br, 36.0, –CH2–), 1.39 (t, 52.4, –CH3).
Crystallographic study
X-ray crystallographic data were collected on a XtaLab PRO MM007HF DW Diffractometer System equipped with a MicroMax-007DW MicroFocus X-ray generator and Pilatus 200K silicon disarray detector (Rigaku, Japan, Cu Kα, λ = 1.54184 Å or Mo Kα, λ = 0.71073 Å) under 293 K or 100 K. Data reductions were performed on CrysAlisPro. Structures were solved by using direct methods by ShelXT for Au3 and SIR2004 for Au9Ag in the OLEX2 program package, and all non-hydrogen atoms were refined anisotropically by the full-matrix least-squares method on F2 by using the ShelXL program.60 The hydrogen atoms were located from different maps and refined with isotropic temperature factors. In the Au9Ag structure, Au and Ag atoms exhibit positional disorder. Detailed structure refined information is appended in the CIF file.For Au6Ag, a fully-satisfactory crystal structure of the sample could not be obtained via single-crystal XRD (SCXRD) directly due to the single crystal batch's weak diffraction and the disorder problem of the ligands. The cell parameters and heavy atomic positions (Au and Ag) were generated from SCXRD data via the Patterson method; ligands were built based on the structure of Au3 and refined by Rietveld refinement in the Reflex module of Materials Studio (residuals: Rp = 12.65%, Rwp = 19.86%). The results of EDX, mass spectra, and elemental analyses could fit the model very well. The Ag atoms in Au6Ag are partially occupied along the c axis in the P![[6 with combining macron]](https://www.rsc.org/images/entities/char_0036_0304.gif) space group and, therefore, the repeating unit [along c] consists of alternating {3 Au6Ag, 1 Au3 and 1 Au9Ag2}/{1 Au9Ag2 1 Au3 and 3 Au6Ag} clusters (Fig. S13 and S14†). The silver atoms in the Au9Ag2 cluster adopt a face-sharing octahedral geometry Au3–Ag-(μ-Au)3–Ag–Au3. Based on the refinement results, silver atoms except Ag1 are half-occupied and the Au–Ag distances range from 2.641(7) to 2.713(6) Å. The DFT-computed Au–Ag distances and their reasonable agreement with the non-disordered experiment in the Au9Ag model should lend some credibility to the DFT-computed Au–Ag distances in the Au6Ag model, which only showed reasonable distances in the 2.7 Å range.
space group and, therefore, the repeating unit [along c] consists of alternating {3 Au6Ag, 1 Au3 and 1 Au9Ag2}/{1 Au9Ag2 1 Au3 and 3 Au6Ag} clusters (Fig. S13 and S14†). The silver atoms in the Au9Ag2 cluster adopt a face-sharing octahedral geometry Au3–Ag-(μ-Au)3–Ag–Au3. Based on the refinement results, silver atoms except Ag1 are half-occupied and the Au–Ag distances range from 2.641(7) to 2.713(6) Å. The DFT-computed Au–Ag distances and their reasonable agreement with the non-disordered experiment in the Au9Ag model should lend some credibility to the DFT-computed Au–Ag distances in the Au6Ag model, which only showed reasonable distances in the 2.7 Å range.
Crystal data and structure refinement parameters are summarized in Table S1.† Selected bond lengths and angles are given in Tables S2 – S4.† CCDC no. 1968678 and 1968679 for Au3 and Au9Ag.
Conflicts of interest
There are no conflicts to declare.Acknowledgements
This work was financially supported by the National Natural Science Foundation of China (No. 21731002, 21975104, and 21801095), the Guangdong Major Project of Basic and Applied Research (2019B030302009), the China Postdoctoral Science Foundation (2017M622894) and Jinan University. MAO acknowledges supporting aspects of his group's contributions by the Welch Foundation (Grant B-1542), U.S. National Science Foundation (CHE-1413641), and the Shenzhen/China Peacock Plan (No. 1208040050847074). We appreciate Dr Xue Li and Xue-Zhi Wang (JNU) for the help with the mass spectrometry studies, and Dr Vladimir Nesterov (UNT) for the help with the crystallography studies.Notes and references
- J. Zheng, Z. Lu, K. Wu, G.-H. Ning and D. Li, Chem. Rev., 2020, 120, 9675–9742 CrossRef CAS.
- R. Galassi, M. A. Rawashdeh-Omary, H. V. R. Dias and M. A. Omary, Comments Inorg. Chem., 2019, 39, 287–348 CrossRef CAS.
- R. Jin, C. Zeng, M. Zhou and Y. Chen, Chem. Rev., 2016, 116, 10346–10413 CrossRef CAS.
- I. Chakraborty and T. Pradeep, Chem. Rev., 2017, 117, 8208–8271 CrossRef CAS.
- X. Kang and M. Zhu, Chem. Soc. Rev., 2019, 48, 2422–2457 RSC.
- S. Hossain, Y. Niihori, L. V. Nair, B. Kumar, W. Kurashige and Y. Negishi, Acc. Chem. Res., 2018, 51, 3114–3124 CrossRef CAS.
- S. Wang, Q. Li, X. Kang and M. Zhu, Acc. Chem. Res., 2018, 51, 2784–2792 CrossRef CAS.
- P. Pyykkö, N. Runeberg and F. Mendizabal, Chem.–Eur. J., 1997, 3, 1451–1457 CrossRef.
- E. J. Fernández, C. Hardacre, A. Laguna, M. C. Lagunas, J. M. López-de-Luzuriaga, M. Monge, M. Montiel, M. E. Olmos, R. C. Puelles and E. Sánchez-Forcada, Chem.–Eur. J., 2009, 15, 6222–6233 CrossRef.
- R. Galassi, M. M. Ghimire, B. M. Otten, S. Ricci, R. N. McDougald Jr, R. M. Almotawa, D. Alhmoud, J. F. Ivy, A.-M. M. Rawashdeh, V. N. Nesterov, E. W. Reinheimer, L. M. Daniels, A. Burini and M. A. Omary, Proc. Natl. Acad. Sci. U. S. A., 2017, 114, E5042–E5051 CAS.
- S. Jin, X. Zou, L. Xiong, W. Du, S. Wang, Y. Pei and M. Zhu, Angew. Chem., Int. Ed., 2018, 57, 16768–16772 CrossRef CAS.
- S. Jin, S. Wang and M. Zhu, Chem.–Asian J., 2019, 14, 3222–3231 CrossRef CAS.
- Q. Zheng, S. Borsley, G. S. Nichol, F. Duarte and S. L. Cockroft, Angew. Chem., Int. Ed., 2019, 58, 12617–12623 CrossRef CAS.
- A. Ghosh, O. F. Mohammed and O. M. Bakr, Acc. Chem. Res., 2018, 51, 3094–3103 CrossRef CAS.
- A. Muñoz-Castro, D. MacLeod Carey and R. Arratia-Pérez, J. Phys. Chem. A, 2010, 114, 666–672 CrossRef.
- P. Ai, M. Mauro, A. A. Danopoulos, A. Muñoz-Castro and P. Braunstein, J. Phys. Chem. C, 2019, 123, 915–921 CrossRef CAS.
- A. Muñoz-Castro, Inorg. Chem. Front., 2019, 6, 2349–2358 RSC.
- Z. Lu, B. Chilukuri, C. Yang, A.-M. Rawashdeh, R. K. K. Arvapally, S. Tekarli, X. Wang, C. Cardenas, T. R. Cundari and M. A. Omary, Chem. Sci., 2020, 11, 11179–11188 RSC.
- S.-K. Peng, Z. Lu, M. Xie, Y.-L. Huang, D. Luo, J.-N. Wang, X.-W. Zhu, X. Li, X.-P. Zhou and D. Li, Chem. Commun., 2020, 56, 4789–4792 RSC.
- S. Wang, X. Meng, A. Das, T. Li, Y. Song, T. Cao, X. Zhu, M. Zhu and R. Jin, Angew. Chem., Int. Ed., 2014, 53, 2376–2380 CrossRef CAS.
- M. Zhou, J. Zhong, S. Wang, Q. Guo, M. Zhu, Y. Pei and A. Xia, J. Phys. Chem. C, 2015, 119, 18790–18797 CrossRef CAS.
- X.-L. Pei, Z.-G. Jiang and Q.-M. Wang, Angew. Chem., Int. Ed., 2014, 53, 12771–12775 CrossRef.
- G. Soldan, M. A. Aljuhani, M. S. Bootharaju, L. G. AbdulHalim, M. R. Parida, A.-H. Emwas, O. F. Mohammed and O. M. Bakr, Angew. Chem., Int. Ed., 2016, 55, 5749–5753 CrossRef CAS.
- Z. Lei, X.-L. Pei, Z.-J. Guan and Q.-M. Wang, Angew. Chem., Int. Ed., 2017, 56, 7117–7120 CrossRef CAS.
- Y. Du, Z.-J. Guan, Z.-R. Wen, Y.-M. Lin and Q.-M. Wang, Chem.–Eur. J., 2018, 24, 16029–16035 CrossRef CAS.
- S. Jin, W. Liu, D. Hu, X. Zou, X. Kang, W. Du, S. Chen, S. Wei, S. Wang and M. Zhu, Chem.–Eur. J., 2018, 24, 3712–3715 CrossRef CAS.
- X. Kang, S. Wang, Y. Song, S. Jin, G. Sun, H. Yu and M. Zhu, Angew. Chem., Int. Ed., 2016, 55, 3611–3614 CrossRef CAS.
- Z. Wu, Y. Du, J. Liu, Q. Yao, T. Chen, Y. Cao, H. Zhang and J. Xie, Angew. Chem., Int. Ed., 2019, 58, 8139–8144 CrossRef CAS.
- Z. Wang, Z. Zhu, C. Zhao, Q. Yao, X. Li, H. Liu, F. Du, X. Yuan and J. Xie, Chem.–Asian J., 2019, 14, 765–769 CrossRef CAS.
- Q. Li, M. Zhou, W. Y. So, J. Huang, M. Li, D. R. Kauffman, M. Cotlet, T. Higaki, L. A. Peteanu, Z. Shao and R. Jin, J. Am. Chem. Soc., 2019, 141, 5314–5325 CrossRef CAS.
- S. Li, X.-S. Du, B. Li, J.-Y. Wang, G.-P. Li, G.-G. Gao and S.-Q. Zang, J. Am. Chem. Soc., 2018, 140, 594–597 CrossRef CAS.
- J. Mei, N. L. C. Leung, R. T. K. Kwok, J. W. Y. Lam and B. Z. Tang, Chem. Rev., 2015, 115, 11718–11940 CrossRef CAS.
- X. Yan, H. Wang, C. E. Hauke, T. R. Cook, M. Wang, M. L. Saha, Z. Zhou, M. Zhang, X. Li, F. Huang and P. J. Stang, J. Am. Chem. Soc., 2015, 137, 15276–15286 CrossRef CAS.
- H.-K. Cheng, M. C.-L. Yeung and V. W.-W. Yam, ACS Appl. Mater. Interfaces, 2017, 9, 36220–36228 CrossRef CAS.
- N. Liu, T. Lin, M. Wu, H.-K. Luo, S.-L. Huang and T. S. A. Hor, J. Am. Chem. Soc., 2019, 141, 9448–9452 CrossRef CAS.
- H. Li, T.-Z. Xie, Z. Liang, Y. Shen, X. Sun, Y. Yang and T. Liu, J. Phys. Chem. C, 2019, 123, 23280–23286 CrossRef CAS.
- N. Goswami, Q. Yao, Z. Luo, J. Li, T. Chen and J. Xie, J. Phys. Chem. Lett., 2016, 7, 962–975 CrossRef CAS.
- X. Kang, S. Wang and M. Zhu, Chem. Sci., 2018, 9, 3062–3068 RSC.
- Z. Luo, X. Yuan, Y. Yu, Q. Zhang, D. T. Leong, J. Y. Lee and J. Xie, J. Am. Chem. Soc., 2012, 134, 16662–16670 CrossRef CAS.
- X. Dou, X. Yuan, Y. Yu, Z. Luo, Q. Yao, D. T. Leong and J. Xie, Nanoscale, 2014, 6, 157–161 RSC.
- Z. Wu, J. Liu, Y. Gao, H. Liu, T. Li, H. Zou, Z. Wang, K. Zhang, Y. Wang, H. Zhang and B. Yang, J. Am. Chem. Soc., 2015, 137, 12906–12913 CrossRef CAS.
- M. Sugiuchi, J. Maeba, N. Okubo, M. Iwamura, K. Nozaki and K. Konishi, J. Am. Chem. Soc., 2017, 139, 17731–17734 CrossRef CAS.
- Z. Wu, H. Liu, T. Li, J. Liu, J. Yin, O. F. Mohammed, O. M. Bakr, Y. Liu, B. Yang and H. Zhang, J. Am. Chem. Soc., 2017, 139, 4318–4321 CrossRef CAS.
- X. Wei, X. Kang, S. Jin, S. Wang and M. Zhu, CCS Chem., 2020, 2, 1929–1939 CrossRef.
- W.-X. Ni, Y.-M. Qiu, M. Li, J. Zheng, R. W.-Y. Sun, S.-Z. Zhan, S. W. Ng and D. Li, J. Am. Chem. Soc., 2014, 136, 9532–9535 CrossRef CAS.
- S. M. Tekarli, T. R. Cundari and M. A. Omary, J. Am. Chem. Soc., 2008, 130, 1669–1675 CrossRef CAS.
- B. Chilukuri, R. N. McDougald Jr, M. M. Ghimire, V. N. Nesterov, U. Mazur, M. A. Omary and K. W. Hipps, J. Phys. Chem. C, 2015, 119, 24844–24858 CrossRef CAS.
- Q. Li, T.-Y. Luo, M. G. Taylor, S. Wang, X. Zhu, Y. Song, G. Mpourmpakis, N. L. Rosi and R. Jin, Sci. Adv., 2017, 3, e1603193 CrossRef.
- A. C. Tsipis, Coord. Chem. Rev., 2017, 345, 229–262 CrossRef CAS.
- The Chemical Bond, ed. G. Frenking and S. Shaik, Wiley-VCH Verlag GmbH & Co. KGaA, Weinheim, Germany, 2014 Search PubMed.
- H. Schmidbaur and H. G. Raubenheimer, Angew. Chem., Int. Ed., 2020, 59, 14748–14771 CrossRef CAS.
- J. Joy, D. Danovich, M. Kaupp and S. Shaik, J. Am. Chem. Soc., 2020, 142, 12277–12287 CrossRef CAS.
- H. Schmidbaur and A. Schier, Chem. Soc. Rev., 2008, 37, 1931–1951 RSC.
- F. Muniz-Miranda, M. C. Menziani and A. Pedone, J. Phys. Chem. C, 2015, 119, 10766–10775 CrossRef CAS.
- R.-W. Huang, Y.-S. Wei, X.-Y. Dong, X.-H. Wu, C.-X. Du, S.-Q. Zang and T. C. W. Mak, Nat. Chem., 2017, 9, 689–697 CrossRef CAS.
- W.-P. To, G. S. M. Tong, W. Lu, C. Ma, J. Liu, A. L.-F. Chow and C.-M. Che, Angew. Chem., Int. Ed., 2012, 51, 2654–2657 CrossRef CAS.
- L.-R. Xing, Z. Lu, M. Li, J. Zheng and D. Li, J. Phys. Chem. Lett., 2020, 11, 2067–2073 CrossRef CAS.
- M. A. Rawashdeh-Omary, M. A. Omary and H. H. Patterson, J. Am. Chem. Soc., 2000, 122, 10371–10380 CrossRef CAS.
- E. Ben-Naim and P. L. Krapivsky, Phys. Rev. Lett., 2009, 102, 190602 CrossRef CAS.
- (a) G. M. Sheldrick, Acta Crystallogr., Sect. A: Found. Adv., 2015, 71, 3–8 CrossRef; (b) M. C. Burla, R. Caliandro, M. Camalli, B. Carrozzini, G. L. Cascarano, L. De Caro, C. Giacovazzo, G. Polidori and R. Spagna, J. Appl. Crystallogr., 2005, 38, 381–388 CrossRef CAS; (c) O. V. Dolomanov, L. J. Bourhis, R. J. Gildea, J. A. K. Howard and H. Puschmann, J. Appl. Crystallogr., 2009, 42, 339–341 CrossRef CAS; (d) G. M. Sheldrick, Acta Crystallogr., Sect. C: Struct. Chem., 2015, 71, 3–8 Search PubMed.
Footnotes |
| † Electronic supplementary information (ESI) available: General synthesis, characterizations, crystallography studies, photoluminescence data, computational details and results. CCDC 1968678 and 1968679. For ESI and crystallographic data in CIF or other electronic format see DOI: 10.1039/d0sc05095d |
| ‡ Z. L. and Y.-J. Y. contributed to this work equally. |
| This journal is © The Royal Society of Chemistry 2021 |

