 Open Access Article
Biomimetic hydrogen-bonding cascade for chemical activation: telling a nucleophile from a base†
Hyunchang
Park
 and
Dongwhan
Lee
 *
*
Department of Chemistry, Seoul National University, 1 Gwanak-ro, Gwanak-gu, Seoul 08826, Korea. E-mail: dongwhan@snu.ac.kr
First published on 2nd November 2020
Abstract
Hydrogen bonding-assisted polarization is an effective strategy to promote bond-making and bond-breaking chemical reactions. Taking inspiration from the catalytic triad of serine protease active sites, we have devised a conformationally well-defined benzimidazole platform that can be systematically functionalized to install multiple hydrogen bonding donor (HBD) and acceptor (HBA) pairs in a serial fashion. We found that an increasing number of interdependent and mutually reinforcing HBD–HBA contacts facilitate the bond-forming reaction of a fluorescence-quenching aldehyde group with the cyanide ion, while suppressing the undesired Brønsted acid–base reaction. The most advanced system, evolved through iterative rule-finding studies, reacts rapidly and selectively with CN− to produce a large (>180-fold) enhancement in the fluorescence intensity at λmax = 450 nm.
Introduction
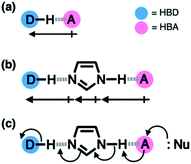
Hydrogen bonding is a versatile functional motif for chemical structure design. An elaborate arrangement of hydrogen bonding donor (HBD) and acceptor (HBA) units has been exploited for molecular recognition,1–5 signaling,6–8 self-assembly,9–12 and chemical activation.13–15 Beyond the paradigm of a simple HBD–HBA pair (Fig. 1a), a serial array of multiple HBD–HBA pairs can also be constructed in a cascade fashion (Fig. 1b).16–18 With an amphoteric proton mediator in the middle, electronic polarization at one end automatically increases the donor/acceptor ability of the other end of the extended network.19–23In such a cooperative arrangement of paired HBD–HBA units, the induced polarization at the mediator site makes the hydrogen bonds shorter and stronger, when compared to a single HBD–HBA contact.19 A prominent example of the cascade hydrogen bonding in action is a class of enzymes having a catalytic triad, such as serine protease, canonical esterase, and lactonase.23–27 At the active site of these enzymes, the carboxylate group of aspartate, imidazole group of histidine, and hydroxyl group of serine constitute an extended hydrogen bonding array (Fig. 2a).
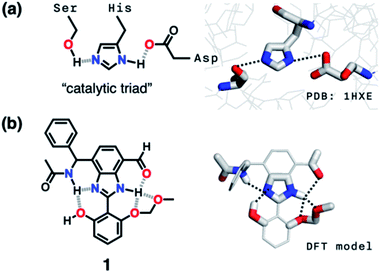 | ||
| Fig. 2 (a) Chemical structure and X-ray structure of the active site of serine protease (PDB: 1HXE). (b) Chemical structure and a DFT (B3LYP-D3/6-31G(d,p)) model of the synthetic “triad” 1 showing alternative modes of hydrogen bonding. | ||
In biological systems, the amphoteric imidazole group functions as a mediator of the cascade hydrogen bonding (Fig. 1b). The hydrogen bonding between aspartate and histidine polarizes the amine N–H group to enhance the basicity of the imine nitrogen, which translates to a stronger N⋯H–O hydrogen bond between histidine and serine. An unusually downfield-shifted proton resonance of the imidazole N–H proton at ca. 15 ppm reflects tight hydrogen bonding, which polarizes the serine O–H group to enhance its nucleophilicity toward electrophilic substrates.23 For the enzymes, it would be challenging to control the strength of hydrogen bonds by using limited types of functional groups offered by amino acid residues. As such, the construction of a hydrogen bonding array, in which the whole is more than the sum of its parts, is an effective strategy to make the best out of what is naturally available.
Design principles
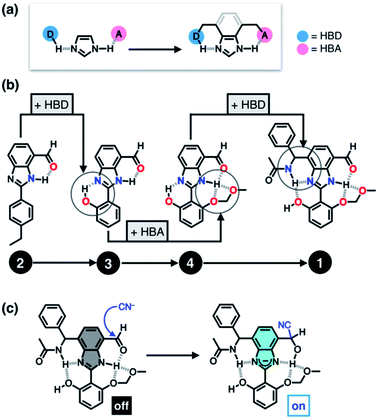
Taking inspiration from the chemical activation strategy of such a catalytic triad, we have designed a benzimidazole-based synthetic surrogate 1 (Fig. 2b). In the case of enzymes, the three-dimensional polypeptide scaffold enables the precise positioning and alignment of HBD–HBA units. Instead of using peptides, we employed the rigid π-conjugated backbone of benzimidazole as a minimalist artificial platform to build a biomimetic hydrogen bonding network. Through facile functionalization at the 2-, 4-, and 7-positions of the benzimidazole ring (Fig. 3), various HBD and HBA units can be installed around the imidazole core. Additionally, the rich photophysics of the 2-arylbenzimidazole motif offers excellent opportunities to develop these biomimetic small molecules into fluorescent probes.28,29In this paper, we report the chemistry of a latent fluorophore 1 (Fig. 2 and 3) and its application for the detection of the toxic cyanide ion. From the simplest molecular prototype 2, a systematic increase in the number of HBD–HBA units helps polarize the aldehyde carbonyl group (Fig. 3b). The enhanced electrophilicity of the aldehyde moiety of 1 effectively promotes the selective covalent capture of the cyanide ion (Fig. 3c), and allows rapid fluorescence turn-on detection. More importantly, comparative studies on 1 and its simpler “site models” 2–4 established that multiple interconnected HBD–HBA pairs help distinguish a nucleophile from a Brønsted base.
Results and discussion
Synthesis of a minimalist prototype
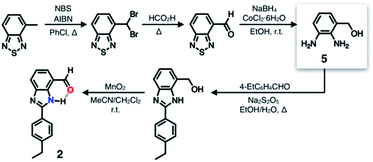
A single HBD–HBA pair was first installed onto the benzimidazole platform to prepare 2 (Scheme 1). To maximize the effects of chemical transformation on the emissive properties, it would be ideal if the functional group that is activated by hydrogen bonding (Fig. 1c) functions also as a fluorescence quencher. For such a purpose, an aldehyde group was employed as an HBA unit. Through fast intersystem crossing, an aldehyde group facilitates the quenching of a π-conjugated fluorophore to which it is directly attached.30–33The chemical structure of 2 (Fig. 3b) satisfies this minimum requirement of this design concept. As outlined in Scheme 1, the synthesis of 2 involved oxidative condensation of diamine 5 and aldehyde, and subsequent oxidation of the primary alcohol group. Except for the reduction of the thiadiazole precursor, all reactions proceeded in moderate to good yields (> 75%). The poor isolation yield of the intermediate 5 might be due to the instability of the electron-rich diamine functionality. The synthetic modularity in the imidazole ring construction aided structural diversification (vide infra).
Spectroscopic studies and response to the cyanide ion
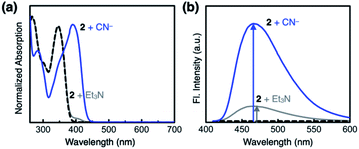
Compound 2 responds to the cyanide anion by large changes in both UV-vis absorption and fluorescence emission spectra. As shown in Fig. 4a, the addition of cyanide to a solution of 2 in DMSO led to a decrease in the absorption at λmax = 345 nm with the development of a new band at λmax = 390 nm. While 2 is only weakly emissive due to the efficient fluorescence quenching by the aldehyde group, the intrinsic blue emission of benzimidazole (λmax,em = 465 nm) was restored upon addition of cyanide (Fig. 4b).In the control experiments with other chemical species, however, we realized that a large enhancement in the emission intensity also occurs with the addition of a Brønsted base, such as Et3N (Fig. 4b). The excitation spectrum of 2, obtained in the presence of Et3N, revealed that absorption at λ ≈ 400 nm is responsible for the emission at λmax,em = 465 nm (Fig. S1a†). This finding implicates that the loss of hydrogen bonding by deprotonation of the acidic benzimidazole proton could also contribute to the fluorescence enhancement, presumably by suppressing the intersystem crossing of aldehyde as the main quenching pathway. In other words, both addition and deprotonation reactions could take place in the reaction of 2 with cyanide, but the fluorescence responses are essentially indistinguishable.
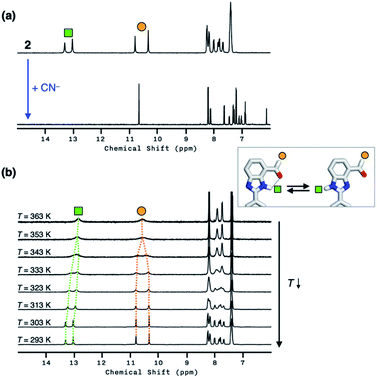
To delineate the nature of the chemical reaction that is responsible for the fluorescence enhancement (Fig. 4b), we carried out detailed solution 1H NMR spectroscopic studies. At room temperature (T = 298 K), the 1H NMR spectrum of 2 in DMSO-d6 (Fig. 5a, top) shows a pair of broadened resonances associated with benzimidazole N–H and aldehyde C–H protons. In stark contrast, the 1H NMR spectrum of a solution of 2 in CDCl3 (Fig. S2†) shows a well-resolved spectral pattern that is consistent with the chemical structure of 2, thus ruling out the involvement of impurities in the complicated 1H NMR spectrum obtained in DMSO-d6.
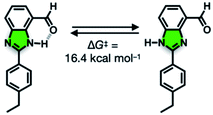
We suspect that the intramolecular N–H⋯O bond of 2 does not provide sufficient thermodynamic bias toward one tautomer over the other in DMSO-d6 (Fig. 5b and Scheme 2). Indeed, the two distinct resonances of the benzimidazole N–H protons at δ = 13.31 and 13.04 ppm converge into a single averaged feature at δ = 12.93 ppm as the temperature is increased (Fig. 5b, coalescence at Tc = 343 K). From eqn (1), the corresponding rate constant (kc) can be determined using the Δν value (108 Hz) at the slow exchange limit.34 By applying the Eyring equation in eqn (2), an activation energy of ΔG‡ = 16.4 kcal mol−1 was determined, which is typical for the energy barrier for the tautomerization.35,36 In this process, the resonances of the aldehyde protons at δ = 10.81 and 10.34 ppm, each associated with the two tautomers, also converge into a single resonance at δ = 10.54 ppm.
 | (1) |
 | (2) |
The addition of cyanide to 2 in DMSO-d6 produced multiple products, presumably from the reactions involving nucleophilic attack as well as simple deprotonation, as deduced from the 1H NMR spectrum (Fig. 5a, bottom). We tentatively concluded that the weak and solvent-exposed hydrogen bond of 2 is prone to tautomerization, and subjected to multiple reaction pathways with cyanide functioning as either a nucleophilic Lewis base or a simple Brønsted base.
Structural evolution of the hydrogen bonding network
To suppress the undesired acid–base chemistry observed for 2 (Fig. 4 and 5), additional functional groups were introduced to construct tighter hydrogen bonding. We postulated that a stronger bond polarization (Fig. 1) of cascade hydrogen bonding should shift the tautomer equilibrium to make the hydrogen-bonded form dominant even in a polar solvent environment (Scheme 3, bottom), thereby enhancing the electrophilicity of the aldehyde group toward covalent capture of the cyanide anion. As summarized in Scheme 3, probes 3 and 4 were readily prepared from the common diamine intermediate 5 (Scheme 1).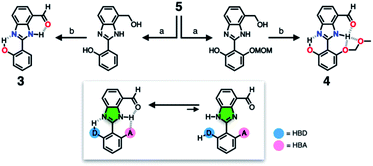 | ||
| Scheme 3 Construction of a hydrogen bonding network to shift the tautomer equilibrium. (a) Aldehyde, Na2S2O5, EtOH, H2O, Δ. (b) MnO2, MeCN/CH2Cl2, r.t. | ||
For 3, a hydroxyl group is installed as the HBD at the 2-aryl ring extending from the benzimidazole core. Similarly to the catalytic triad (Fig. 2a), the O–H⋯N hydrogen bonding between the hydroxyl group and the imine nitrogen atom of benzimidazole is expected to push the tautomer equilibrium to reinforce the N–H⋯O hydrogen bonding between the aldehyde and amine moieties of the benzimidazole core. Furthermore, the acidic phenolic O–H (pKa ∼10)37 could also function as a sacrificial proton donor in the acid–base reaction to keep the N–H group intact. Even when the acid–base reaction takes place, the deprotonation reaction should occur preferentially at the hydroxyl group, so that the benzimidazole fluorophore would be less perturbed.
As a further structural elaboration, probe 4 has an additional hydrogen bonding acceptor, the –OMOM group. Here, the hydrogen bonding between the ether oxygen atom of –OMOM and the imidazole N–H group is anticipated to help planarize the π-system and strengthen the bifurcated hydrogen bonding. It makes intuitive chemical sense that the multiple HBD–HBA pairs within 4 should work cooperatively in the same direction (Fig. 1b) to preferentially stabilize the desired tautomer which benefits from stronger hydrogen bonding (Scheme 3, bottom).
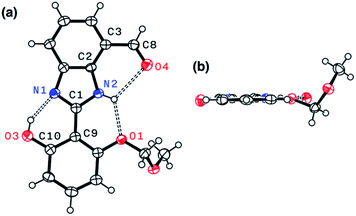
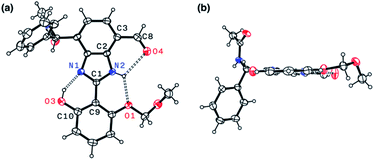
Indeed, single-crystal X-ray crystallography confirmed the presence of an extensive hydrogen bonding network within 4. As shown in Fig. 6, the X-ray structure of 4 revealed three hydrogen bonds (dashed lines) around the imidazole core with short Nimidazole⋯Ophenol (2.568(3) Å) and Nimidazole⋯Oether (2.634(4) Å) distances and essentially a coplanar arrangement of the extended π-system (torsional angle for N1–C1–C9–C10 = 0.65°; C2–C3–C8–O4 = 1.92°).
Cascade hydrogen bonds: effects on the reactivity and solution structure
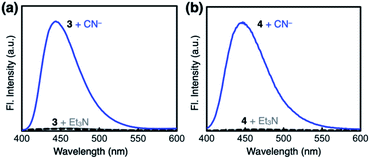
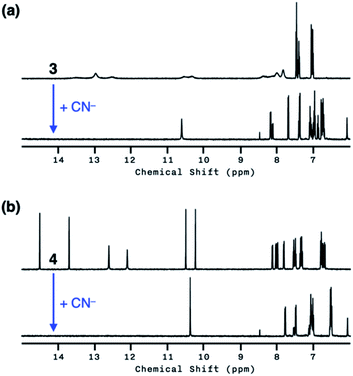
Both 3 and 4 exhibited dramatic fluorescence enhancement upon treatment with the cyanide anion (Fig. 7). Unlike 2, however, they remained silent toward Et3N, thus differentiating the Brønsted base from the Lewis base. When comparison is made with 2, slightly blue-shifted but almost superimposable emission spectra (λmax,em = 445 nm) were observed for the cyanide reaction products of 3 and 4.We anticipated that multiple HBD–HBA pairs within 3 and 4 would shift the tautomer equilibrium to benefit from the additive and reinforcing dipole alignment (Scheme 3, bottom). The results from 1H NMR spectroscopic studies, however, were rather inconclusive. As shown in Fig. 8, the coexistence of two tautomers was still observed at r.t. for both 3 and 4. While the broadened proton resonances of 3 resemble those of 2 (Fig. 5a, top), the two tautomers of 4 appear as sharp and well-resolved spectral patterns in ca. 1![[thin space (1/6-em)]](https://www.rsc.org/images/entities/char_2009.gif) :
:![[thin space (1/6-em)]](https://www.rsc.org/images/entities/char_2009.gif) 1 ratio (Fig. 8a and b, top).
1 ratio (Fig. 8a and b, top).
Similar to the case of 2, a mixture of products were obtained when cyanide was added to 3 (Fig. 8a, bottom), presumably reflecting the tautomer equilibrium. The sharp and well-resolved 1H NMR spectrum of 4 suggests much slower interconversion between the two tautomers (Scheme 3, bottom), which is consistent with the more extensive hydrogen bonding array in 4 than in its simpler analogues 2 and 3. Nevertheless, the coexistence of the two tautomers for 4 still resulted in the formation of multiple products upon reaction with CN− (Fig. 8b, bottom). Apparently, the presence of three hydrogen bonds (Fig. 6) is still insufficient for a complete conversion of 4 to a single product.
Biomimetic hydrogen bonding network
As described above, studies on 2–4 suggested the need for a stronger and more tightly regulated hydrogen bonding network to control both the tautomer equilibrium and the reactivity toward the nucleophile. We thus decided to install an additional HBD–HBA motif onto 4 to prepare 1 (Fig. 3b). Within a six-membered ring setting, the highly polarized N–H bond of an amide moiety is ideally suited to make a good HBD–HBA pair with the imidazole imine-N atom, as predicted by the energy-minimized DFT (B3LYP-D3/6-31G(d,p)) model shown in Fig. 2b. In line with the schematic diagram shown in Fig. 1, comparative DFT studies on 1 and the simple HBD–HBA pair 2 predict a large difference in the molecular dipole moment of 6.4413 D (for 1) vs. 0.5614 D (for 2). The molecular electrostatic potential (MEP) maps of 1 and 2 (Fig. S4†) also show a larger polarization of electron density across cascading dipoles.To functionalize the 4-position of the benzimidazole core, the overall synthetic scheme needed to be modified to introduce a bromo substituent at the early stage (Scheme 4). From the bromo-functionalized diamine, sequential oxidative condensation and oxidation reactions afforded 6 in a high yield (72% for two steps). By a cross-coupling reaction onto this bromo position, various functional groups could be installed. An aliphatic amide group was chosen in our molecular design to suppress direct electronic conjugation with the benzimidazole core, thereby minimizing perturbation of the photophysical properties. A palladium-catalyzed Suzuki–Miyaura cross-coupling of 6 with α-(acetylamino)benzylboronic ester furnished the target compound 1. The low isolation yield (ca. 17%) in this final step is due to the purification procedure involving repetitive recrystallization.
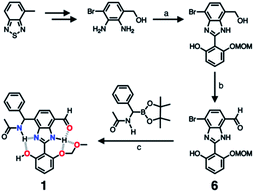 | ||
| Scheme 4 Synthetic route to 1. (a) Aldehyde, Na2S2O5, EtOH/H2O, Δ. (b) MnO2, MeCN/CH2Cl2, r.t. (c) Pd2(dba)3, P(tBu)3·HBF4, KF, dioxane/H2O, Δ. | ||
The single-crystal X-ray structure of 1 shown in Fig. 9 confirmed the presence of multiple hydrogen bonds. The interatomic distances of hydrogen bonds, 2.5431(1)–2.9007(1) Å, are similar to those of 4 (Fig. 6). The essentially co-planar arrangement of the π-conjugated backbone of 1 (torsional angle for N1–C1–C9–C10 = 4.17°; C2–C3–C8–O4 = 2.03°) further validates the functional role of the hydrogen bonding network as a conformational lock. Unlike the DFT computational model (Fig. 2b), the amide N–H group of 1 is twisted away from the benzimidazole-N atom. A close inspection of the crystal packing diagram revealed an extensive intermolecular Namide–H⋯Ocarbonyl hydrogen bonding network between adjacent molecules, which is reinforced further by π–π stacking and C–H⋯π contacts (Fig. S5†). Apparently, such intermolecular interactions in the condensed phase prevail over the inherent propensity of 1 to make the intramolecular Namide–H⋯Nimidazole hydrogen bond as a discrete molecular species (Fig. 2b).
Hydrogen bonding network: effects on the reactivity and solution structure
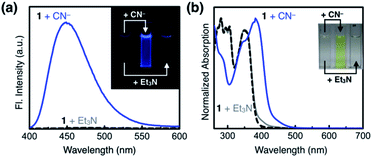
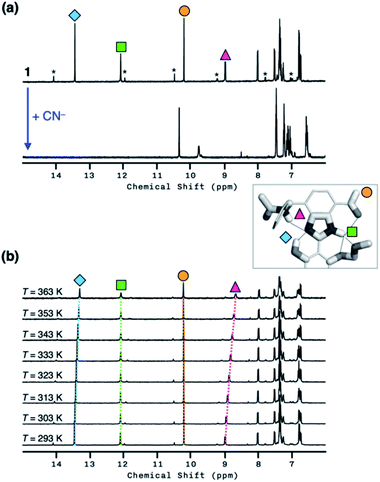
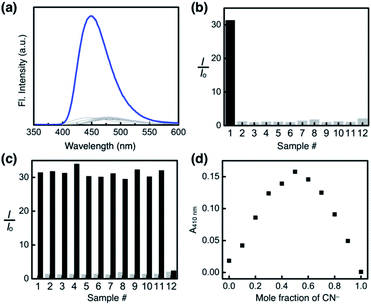
As shown in Fig. 10a, the addition of the cyanide anion to a solution of 1 elicited a rapid and dramatic (> 180-fold) enhancement in the emission intensity at λmax,em = 450 nm, whereas no spectral change was observed with the Brønsted base Et3N. A large spectral change was also observed in the electronic excitation upon the addition of cyanide (Fig. 10b) with a color change to yellow. In contrast, only a slight increase in the absorption at λ ≈ 400 nm region was observed with Et3N, with the rest of the spectrum remaining essentially superimposable (Fig. 10b). This visually discernible colorimetric change and fluorescence turn-on allow naked-eye detection of the cyanide anion (Fig. 10, inset pictures).To investigate the solution structure of 1, 1H NMR spectroscopic studies were carried out. The 1H NMR spectrum of 1 (4.0 mM) in DMSO-d6 measured at T = 293 K indicates the dominance of one prevailing tautomer (> 90%, based on the peak integration values; Fig. 11a, top), which remains essentially invariant even with increasing the temperature up to T = 363 K (Fig. 11b). The 2D ROESY NMR spectrum of 1 (4.0 mM) obtained in DMSO-d6 at r.t. revealed prominent ROE signals between (i) benzimidazole N–H and aldehyde C–H, and (ii) benzimidazole N–H and methylene protons of the –OMOM group (Fig. S6†). These ROE correlations provide compelling evidence for the dominant tautomeric form of 1, as predicted by DFT computational studies (Fig. 2b). The gradual up-field shifts of the phenolic O–H (δ = 13.46 to 13.30 ppm) and amide N–H protons (δ = 8.99 to 8.68 ppm) with increasing temperature (Fig. 11b) also suggest their involvement in intramolecular hydrogen bonding.38,39
The high conformational stability of 1 was established further by concentration-dependent 1H NMR studies. Within the concentration range of 1.5–4.0 mM, no noticeable change was observed in the 1H NMR spectrum of 1 in DMSO-d6, implying that 1 remains folded in solution against intermolecular hydrogen bonding (Fig. S7†). In stark contrast, compound 3 having relatively weak hydrogen bonds undergoes significant broadening of benzimidazole aromatic proton resonances with increasing sample concentration (Fig. S8†). Furthermore, the addition of a small amount of H2O (2 μL) to a solution of 3 in DMSO-d6 (2.0 mM, 500 μL) sharpened the resonances of these aromatic protons by rapid proton exchange with the N–H group (Fig. S9†). No spectral change was observed for 1 under the same conditions (Fig. S10†).
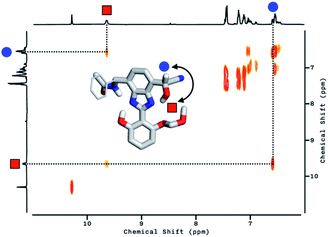
With the hydrogen-bonded tautomeric form prevailing for 1 in solution, the addition of the cyanide anion resulted in a clean and complete conversion to the cyanohydrin adduct (Fig. 11a, bottom). To better interpret the 1H NMR spectrum of the reaction product, we carried out 2D-COSY NMR studies. As shown in Fig. 12, the cross-peaks at δ = 9.7 ppm and δ = 6.6 ppm arise from the J-coupling of O–H and C–H protons, respectively, of the cyanohydrin.32,33,40–42 In addition, HPLC-MS analysis (Fig. S11†) confirmed the formation of the cyanohydrin adduct of 1 at m/z = 473.15 corresponding to [M + H]+.
Telling a nucleophile from a base
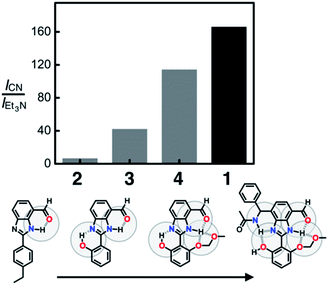
To compare the ability of 1–4 to distinguish a nucleophile (i.e. CN−) from a Brønsted base (i.e. Et3N), each of the probe molecules was treated with either the cyanide anion (25 equiv.) or Et3N (25 equiv.). The emission intensity was measured at λem = 450 nm, and the ratio ICN/IEt3N was calculated for each molecule. With an increasing number of HBD–HBA units installed around the same fluorogenic benzimidazole core (Fig. 3b), a systematic increase in the ICN/IEt3N ratio was observed along the series 2 → 3 → 4 → 1 (Fig. 13). Stronger and networked hydrogen bonds seem to promote the bond-forming reaction while effectively suppressing the undesired acid–base reaction. Comparative 1H NMR studies (Fig. 5, 8, and 11) establish that such hydrogen bonds can also shift the solution equilibrium toward the more reactive tautomer to the cyanide anion.Selectivity toward cyanide and reaction stoichiometry
To test the selectivity of the probe 1, aqueous solution samples of 12 different anions, including CN−, F−, Cl−, Br−, I−, N3−, SCN−, OAc−, NO3−, ClO4−, PF6−, and OH− (25 equiv., delivered as sodium salts except for KPF6 and KOH), were added to 1 (0.100 mM) in a DMSO–H2O (99![[thin space (1/6-em)]](https://www.rsc.org/images/entities/char_2009.gif) :
:![[thin space (1/6-em)]](https://www.rsc.org/images/entities/char_2009.gif) 1, v/v) mixed-solvent system, and the emission spectra were recorded under identical conditions. As summarized in Fig. 14a and b, the fluorescence turn-on response was observed exclusively for the cyanide anion.
1, v/v) mixed-solvent system, and the emission spectra were recorded under identical conditions. As summarized in Fig. 14a and b, the fluorescence turn-on response was observed exclusively for the cyanide anion.
A large enhancement in the emission intensity was also observed at λem = 450 nm when the cyanide anion was subsequently added to the mixture of 1 and other anions except OH− (Fig. 14c). We suspect that deprotonation by a strong base could disrupt the cascade hydrogen bonding, thus diminishing the response of 1 toward subsequently added CN−. The reaction stoichiometry between 1 and cyanide was determined by Job plot analysis using UV-vis spectroscopy. A sharp maximum at the mole fraction of 0.5 provides compelling evidence for the formation of a 1![[thin space (1/6-em)]](https://www.rsc.org/images/entities/char_2009.gif) :
:![[thin space (1/6-em)]](https://www.rsc.org/images/entities/char_2009.gif) 1 adduct (Fig. 14d), which is also consistent with the results from 1H NMR (Fig. 11a and 12) and HPLC-MS studies (Fig. S11†).
1 adduct (Fig. 14d), which is also consistent with the results from 1H NMR (Fig. 11a and 12) and HPLC-MS studies (Fig. S11†).
Kinetics studies: rapid detection of cyanide under ambient conditions
The rate constant for the bimolecular reaction between 1 and cyanide was determined by recording time-dependent UV-vis absorption spectra (Fig. S12†). A large enhancement in the absorption at λ = 400 nm brought by the addition of the cyanide anion helped track the progress of the reaction over time (Fig. 10b). The activation of the electrophilic aldehyde group by the hydrogen bonding array led to a rapid chemical transformation. Even at a low temperature (T = 15 °C), the reaction of 1 with cyanide in DMSO–MeCN (1![[thin space (1/6-em)]](https://www.rsc.org/images/entities/char_2009.gif) :
:![[thin space (1/6-em)]](https://www.rsc.org/images/entities/char_2009.gif) 1, v/v) was completed within < 2 seconds (Fig. S12a†). Under the pseudo-first-order kinetic reaction conditions, the kinetic trace was fitted to obtain pseudo-first-order rate constants, k′ (=k2[CN−]0); the second-order rate constant k2 was estimated from the linear relationship between k′ and [CN−]0 (Fig. S12b†). While the precise determination of rate constants was hampered by the fast reaction rate, the calculated k2 value (1.3 × 10³ M−1 s−1) is among that of the fastest-responding cyanide probes that operate by a covalent capture strategy.32,43–50 With 20 equiv. of cyanide anion, the reaction half-life t1/2 is as short as 0.53 s.
1, v/v) was completed within < 2 seconds (Fig. S12a†). Under the pseudo-first-order kinetic reaction conditions, the kinetic trace was fitted to obtain pseudo-first-order rate constants, k′ (=k2[CN−]0); the second-order rate constant k2 was estimated from the linear relationship between k′ and [CN−]0 (Fig. S12b†). While the precise determination of rate constants was hampered by the fast reaction rate, the calculated k2 value (1.3 × 10³ M−1 s−1) is among that of the fastest-responding cyanide probes that operate by a covalent capture strategy.32,43–50 With 20 equiv. of cyanide anion, the reaction half-life t1/2 is as short as 0.53 s.
Conclusions
As a synthetic mimic of a biological hydrogen bonding triad, a T-shaped π-conjugated platform was structurally elaborated. In our molecular design, the amphoteric benzimidazole core reinforces bond-polarizing HBD–HBA networks to activate an electrophilic aldehyde group for the covalent capture of the toxic CN− anion. We found that a systematic increase in the number of hydrogen bonds allows the molecules to distinguish bond-making nucleophiles from proton-abstracting Brønsted bases. The most advanced molecular probe 1 has four hydrogen bonds around the fluorogenic benzimidazole core, and detects the cyanide ion by a rapid and selective turn-on response. Efforts are currently underway in our laboratory to expand the scope of this non-covalent design strategy to other types of chemical transformations of relevance to target-specific signal transduction.Conflicts of interest
There are no conflicts to declare.Acknowledgements
This work was supported by the National Research Foundation (NRF) of Korea (2020R1A2C2006381 and 2017M3D1A1039558) funded by the Ministry of Science and ICT.Notes and references
- A. P. Davis, Chem. Soc. Rev., 2020, 49, 2531–2545 RSC.
- P. Ríos, T. J. Mooibroek, T. S. Carter, C. Williams, M. R. Wilson, M. P. Crump and A. P. Davis, Chem. Sci., 2017, 8, 4056–4061 RSC.
- H. Yao, H. Ke, X. Zhang, S.-J. Pan, M.-S. Li, L.-P. Yang, G. Schreckenbach and W. Jiang, J. Am. Chem. Soc., 2018, 140, 13466–13477 CrossRef CAS.
- J. F. Neal, W. Zhao, A. J. Grooms, M. A. Smeltzer, B. M. Shook, A. H. Flood and H. C. Allen, J. Am. Chem. Soc., 2019, 141, 7876–7886 CrossRef CAS.
- C. Guo, H. Wang, V. M. Lynch, X. Ji, Z. A. Page and J. L. Sessler, Chem. Sci., 2020, 11, 5650–5657 RSC.
- D. Basudhar, Y. Madrona, E. T. Yukl, S. Sivaramakrishnan, C. R. Nishida, P. Moënne-Loccoz and P. R. Ortiz de Montellano, J. Biol. Chem., 2016, 291, 16100–16111 CrossRef CAS.
- E. Odella, S. J. Mora, B. L. Wadsworth, M. T. Huynh, J. J. Goings, P. A. Liddell, T. L. Groy, M. Gervaldo, L. E. Sereno, D. Gust, T. A. Moore, G. F. Moore, S. Hammes-Schiffer and A. L. Moore, J. Am. Chem. Soc., 2018, 140, 15450–15460 CrossRef CAS.
- E. Odella, S. J. Mora, B. L. Wadsworth, J. J. Goings, M. A. Gervaldo, L. E. Sereno, T. L. Groy, D. Gust, T. A. Moore, G. F. Moore, S. Hammes-Schiffer and A. L. Moore, Chem. Sci., 2020, 11, 3820–3828 RSC.
- J. Wang, K. Liu, R. Xing and X. Yan, Chem. Soc. Rev., 2016, 45, 5589–5604 RSC.
- F. Zapata, L. González, A. Caballero, A. Bastida, D. Bautista and P. Molina, J. Am. Chem. Soc., 2018, 140, 2041–2045 CrossRef CAS.
- L. Gabrielli, D. Núñez-Villanueva and C. A. Hunter, Chem. Sci., 2020, 11, 561–566 RSC.
- D. Núñez-Villanueva, G. Iadevaia, A. E. Stross, M. A. Jinks, J. A. Swain and C. A. Hunter, J. Am. Chem. Soc., 2017, 139, 6654–6662 CrossRef.
- R. R. Knowles and E. N. Jacobsen, Proc. Natl. Acad. Sci. U. S. A., 2010, 107, 20678–20685 CrossRef CAS.
- A. G. Doyle and E. N. Jacobsen, Chem. Rev., 2007, 107, 5713–5743 CrossRef CAS.
- S. Bhunia, A. Rana, P. Roy, D. J. Martin, M. L. Pegis, B. Roy and A. Dey, J. Am. Chem. Soc., 2018, 140, 9444–9457 CrossRef CAS.
- C. Nagamani, U. Viswanathan, C. Versek, M. T. Tuominen, S. M. Auerbach and S. Thayumanavan, Chem. Commun., 2011, 47, 6638–6640 RSC.
- Y. Zhou, G. Deng, Y.-Z. Zheng, J. Xu, H. Ashraf and Z.-W. Yu, Sci. Rep., 2016, 6, 36932 CrossRef CAS.
- H. Guo and M. Karplus, J. Phys. Chem., 1994, 98, 7104–7105 CrossRef CAS.
- A. Shokri, J. Schmidt, X.-B. Wang and S. R. Kass, J. Am. Chem. Soc., 2012, 134, 2094–2099 CrossRef CAS.
- F. Bartha, O. Kapuy, C. Kozmutza and C. Van Alsenoy, J. Mol. Struct.: THEOCHEM, 2003, 666–667, 117–122 CrossRef CAS.
- A. Bhattacherjee and S. Wategaonkar, Phys. Chem. Chem. Phys., 2016, 18, 27745–27749 RSC.
- R. Ludwig, J. Mol. Liq., 2000, 84, 65–75 CrossRef CAS.
- P. A. Frey, J. Phys. Org. Chem., 2004, 17, 511–520 CrossRef CAS.
- A. Rauwerdink and R. J. Kazlauskas, ACS Catal., 2015, 5, 6153–6176 CrossRef CAS.
- L. Polgár, Cell. Mol. Life Sci., 2005, 62, 2161–2172 CrossRef.
- C. L. Perrin and J. B. Nielson, Annu. Rev. Phys. Chem., 1997, 48, 511–544 CrossRef CAS.
- P. Kumar, P. K. Agarwal, M. B. Waddell, T. Mittag, E. H. Serpersu and M. J. Cuneo, Angew. Chem., Int. Ed., 2019, 58, 16260–16266 CrossRef CAS.
- H. J. Kim, C. H. Heo and H. M. Kim, J. Am. Chem. Soc., 2013, 135, 17969–17977 CrossRef CAS.
- C.-H. Chen, W.-S. Huang, M.-Y. Lai, W.-C. Tsao, J. T. Lin, Y.-H. Wu, T.-H. Ke, L.-Y. Chen and C.-C. Wu, Adv. Funct. Mater., 2009, 19, 2661–2670 CrossRef CAS.
- S. K. Lower and M. A. El-Sayed, Chem. Rev., 1966, 66, 199–241 CrossRef CAS.
- Kenry, C. Chen and B. Liu, Nat. Commun., 2019, 10, 2111 CrossRef CAS.
- J. Jo, A. Olasz, C.-H. Chen and D. Lee, J. Am. Chem. Soc., 2013, 135, 3620–3632 CrossRef CAS.
- J. Jo and D. Lee, J. Am. Chem. Soc., 2009, 131, 16283–16291 CrossRef CAS.
- H. S. Gutowsky and C. H. Holm, J. Chem. Phys., 1956, 25, 1228–1234 CrossRef CAS.
- E. D. Raczyńska and W. Kosińska, Chem. Rev., 2005, 105, 3561–3612 CrossRef.
- C. Zucco, E. L. Dall'Oglio, G. V. Salmória, H. Gallardo, A. Neves and M. C. Rezende, J. Phys. Org. Chem., 1998, 11, 411–418 CrossRef CAS.
- M. D. Liptak, K. C. Gross, P. G. Seybold, S. Feldgus and G. C. Shields, J. Am. Chem. Soc., 2002, 124, 6421–6427 CrossRef CAS.
- S. H. Gellman, G. P. Dado, G.-B. Liang and B. R. Adams, J. Am. Chem. Soc., 1991, 113, 1164–1173 CrossRef CAS.
- B. W. Gung, Z. Zhu and B. Everingham, J. Org. Chem., 1997, 62, 3436–3437 CrossRef CAS.
- K.-S. Lee, H.-J. Kim, G.-H. Kim, I. Shin and J.-I. Hong, Org. Lett., 2008, 10, 49–51 CrossRef CAS.
- S. K. Kwon, S. Kou, H. N. Kim, X. Chen, H. Hwang, S.-W. Nam, S. H. Kim, K. M. K. Swamy, S. Park and J. Yoon, Tetrahedron Lett., 2008, 49, 4102–4105 CrossRef CAS.
- Y. Jhong, W. H. Hsieh, J.-L. Chir and A.-T. Wu, J. Fluoresc., 2014, 24, 1723–1726 CrossRef CAS.
- Z. Xu, X. Chen, H. N. Kim and J. Yoon, Chem. Soc. Rev., 2010, 39, 127–137 RSC.
- Y.-M. Dong, Y. Peng, M. Dong and Y.-W. Wang, J. Org. Chem., 2011, 76, 6962–6966 CrossRef CAS.
- L. Hou, F. Li, J. Guo, X. Zhang, X. Kong, X. T. Cui, C. Dong, Y. Wang and S. Shuang, J. Mater. Chem. B, 2019, 7, 4620–4629 RSC.
- Y.-D. Lin, Y.-S. Pen, W. Su, K.-L. Liau, Y.-S. Wen, C.-H. Tu, C.-H. Sun and T. J. Chow, Chem.–Asian J., 2012, 7, 2864–2871 CrossRef CAS.
- S.-J. Hong, J. Yoo, S.-H. Kim, J. S. Kim, J. Yoon and C.-H. Lee, Chem. Commun., 2009, 189–191 RSC.
- A. Tigreros, J.-C. Castillo and J. Portilla, Talanta, 2020, 215, 120905 CrossRef CAS.
- S. M. Kim, M. Kang, I. Choi, J. J. Lee and C. Kim, New J. Chem., 2016, 40, 7768–7778 RSC.
- S. Zhu, M. Li, L. Sheng, P. Chen, Y. Zhang and S. X.-A. Zhang, Analyst, 2012, 137, 5581–5585 RSC.
Footnote |
| † Electronic supplementary information (ESI) available: Experimental procedures, characterization data and supplementary figures, including 1H and 13C NMR spectra, crystallographic data, FT-IR and HR-MS analysis. CCDC 2031617–2031619. For ESI and crystallographic data in CIF or other electronic format see DOI: 10.1039/d0sc05067a |
| This journal is © The Royal Society of Chemistry 2021 |

