 Open Access Article
CrystalGrower: a generic computer program for Monte Carlo modelling of crystal growth†
Adam R.
Hill
 a,
Pablo
Cubillas‡
a,
James T.
Gebbie-Rayet‡
a,
Mollie
Trueman
a,
Nathan
de Bruyn
a,
Zulaikha al
Harthi
a,
Pablo
Cubillas‡
a,
James T.
Gebbie-Rayet‡
a,
Mollie
Trueman
a,
Nathan
de Bruyn
a,
Zulaikha al
Harthi
 a,
Rachel J. S.
Pooley
ag,
Martin P.
Attfield
 a,
Vladislav A.
Blatov
 bc,
Davide M.
Proserpio
 bd,
Julian D.
Gale
f,
Duncan
Akporiaye
e,
Bjørnar
Arstad
e and
Michael W.
Anderson
 *af
*af
aCentre for Nanoporous Materials, School of Chemistry, The University of Manchester, Oxford Road, Manchester M13 9PL, UK. E-mail: m.anderson@manchester.ac.uk
bSamara Center for Theoretical Materials Science (SCTMS), Samara State Technical University, Molodogvardeyskaya Street 244, Samara 443100, Russia
cSamara Center for Theoretical Materials Science (SCTMS), Samara University, Academician Pavlov Street 1, Samara 443011, Russia
dUniversità degli Studi di Milano, Dipartimento di Chimica, Via Camillo Golgi 19, 20133 Milano, Italy
eSINTEF Industry, PO Box 124, Blindern, 0314 Oslo, Norway
fCurtin Institute for Computation, School of Molecular and Life Sciences, Curtin University, GPO Box U1987, Perth, Western Australia 6845, Australia
gA*STAR, Institute of Materials Research and Engineering, Fusionopolis 2, Singapore
First published on 18th November 2020
Abstract
A Monte Carlo crystal growth simulation tool, CrystalGrower, is described which is able to simultaneously model both the crystal habit and nanoscopic surface topography of any crystal structure under conditions of variable supersaturation or at equilibrium. This tool has been developed in order to permit the rapid simulation of crystal surface maps generated by scanning probe microscopies in combination with overall crystal habit. As the simulation is based upon a coarse graining at the nanoscopic level features such as crystal rounding at low supersaturation or undersaturation conditions are also faithfully reproduced. CrystalGrower permits the incorporation of screw dislocations with arbitrary Burgers vectors and also the investigation of internal point defects in crystals. The effect of growth modifiers can be addressed by selective poisoning of specific growth sites. The tool is designed for those interested in understanding and controlling the outcome of crystal growth through a deeper comprehension of the key controlling experimental parameters.
Introduction
When a crystal grows successfully it does so by accepting and then rejecting nutrient. The rejection is crucial to eliminate mistakes and this interplay is achieved through the very small, often sub kT, free energies of crystallisation. The purpose of our software, CrystalGrower, is to access these free energies by simultaneously simulating crystal habit and nanoscopic surface topography. The latter is particularly sensitive to these small free energies and accessible experimentally via atomic force microscopy.In recent years it has been possible, experimentally, to take a deeper view into the molecular aspects of crystal growth owing to the advent of scanning probe microscopies that provide unprecedented detail regarding the topography at crystal surfaces. In favourable circumstances, for solution-mediated growth, this may be achieved under in situ conditions of either growth or dissolution. The resolution afforded by, for instance, atomic force microscopy, is ideally suited to the task at hand. Commercially available instrumentation can easily achieve a vertical resolution close to 0.1 nm and a lateral resolution of a few tens of nanometres. Crystal growth features often reflect this resolution ratio and are consequently mapped with excellent precision. Much higher, near atomic lateral resolution, can also be achieved by careful operation of the microscope, however, for many of the important questions in crystal growth this additional resolution is unnecessary.1 Our group has been particularly active applying these techniques to the problem of crystal growth in nanoporous materials, such as zeolites,2–7 and related structures, such as metal–organic frameworks (MOFs) and zeotypes.8–13 This has meant developing a new strategy for investigating crystal growth that maps onto previous knowledge gathered using other techniques but also maximizes the new information available. In this regard we have developed both new experimental protocols along with theoretical simulation tools. This paper concerns primarily the latter endeavour – the development of a computational model that simulates our experimental data, CrystalGrower (CG)13 – however, we also present a full discussion of the relevant experimental facts that support the approximations invoked. The understanding that we develop through these computational techniques is discussed in terms of its influence on synthetic protocols to achieve crystals with controlled habit, size, defects, surface structure, more efficient crystallisation etc. The techniques presented in this paper could be of potential use to a variety of industrial fields, ranging from catalysis and pharmaceuticals to agrochemicals and electronics, and with streamlining should be accessible to experimentalists in addition to computational scientists.
Generic model of crystal growth
Thermodynamic basis
The Monte Carlo model for crystal growth used in CG is adapted from the strategy developed by Meekes et al.14 for their computer algorithm MONTY (Monte Carlo on any crystal surface). In that work they developed a methodology that pieced together a series of 2-dimensional simulations of growth rates for principal crystallographic directions in order to predict the ultimate crystal morphology under conditions of variable supersaturation. In this work our goal is to perform a similar calculation but in three dimensions in order to be able to simulate all the intricacies of crystal form at the nanoscale. In this manner the fundamental free-energies of crystallisation emanating from the calculation may be refined against both the nanoscale topological features available from scanning probe microscopy as well as the overall crystal habit (including surface roughening, screw dislocations etc.). Nonetheless, in order to understand the CG methodology, the thermodynamic basis should be revisited and some of the simplifications and approximations introduced in previous work re-emphasised. This is of particular importance as further approximations are introduced here to tackle the crystal growth of several material types (including nanoporous, molecular and ionic crystals) and, consequently, the results and conclusions must be considered in this light.Our approach is grounded in the Bell–Evans–Polanyi principle that for a series of closely related chemical processes, such as those found in crystallisation, the thermodynamics serves as a proxy for the rate constants in a kinetic Monte Carlo simulation. This is a principle often invoked for catalytic processes and we conjecture that for processes such as desolvation and surface attachment, where transition states will be similar, then the same approximation should be valid to within a time constant.
There are several important simplifications in order to tackle the problem of crystal growth. First, the allowed transitions within systems are restricted to immediate exchanges from the mother liquor (or mother phase such as a gel or solution) to the crystal phase and vice versa. Then growth and dissolution only occurs from bulk crystallographic positions with no changes in orientation of the growth unit. The most important assumption is that the difference in entropy between surface sites in the crystal phase is ignored. The reasoning for this being that translation and rotational contributions to the entropy, usually found within the mother phase, are absent within the crystal phase. There could be some rotation at surface sites and entropy due to phonons, but the relative differences should be small for most solids. The main difference is the change from solution to crystal which is captured. That is not to say that there is no entropy change as structural solvent is released back into solution with concomitant entropy increase and the energy levels in Fig. 1 reflect the total free energy change. This structural solvent will be subsumed by the mother phase and there will be negligible change in free energy of the solution phase.
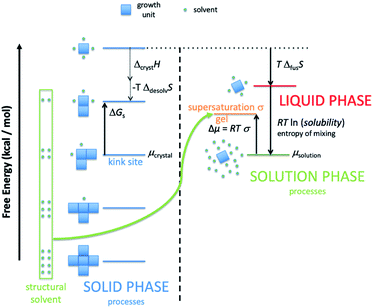
Fig. 1 shows schematically the different simplified states-of-matter that have been considered. The raw crystal growth unit in vacuo, depicted as a small square, will have the highest free energy (energy level not shown). As this growth unit is introduced into a solution from which crystals grow then it will become solvated by solvent, depicted as small filled circles. As the crystal grows from the mother liquor, solvent is displaced and replaced by attachment to the growing crystal surface. Depending on the type of attachment more or less solvent will be displaced and more or less crystal will become attached to the growth unit. These different surface attachments will result in many different surface site-types. Finally the growth unit will be incorporated into the bulk crystal and all solvent is finally displaced. Fig. 1 shows the relative free energies of the different scenarios for the growth unit. The highest energy is an isolated but solvated growth unit and the lowest energy is in the crystal bulk. Surface sites have higher free energies in an order depending upon relative connectivity to the crystal and solvent. Meekes et al.14 make an important but reasonable assumption that the internal energy lost to a particular growth unit by desolvation is in direct proportion to the internal energy gained by attachment to the crystal. They also assume that every growth and dissolution event is microscopically reversible. In order to recognize more intuitively the meaning of this approach we introduce our own terminology which is presented in Fig. 1. First, we define a surface site type by the subscript “s”. Then the probability for growth at a particular surface site is given by: Pgrowths and the probability for dissolution is: Pdissolutions. We define our zero level on our energy scale to be that of the energy of the crystal kink site, for reasons discussed later in this manuscript where we discuss the Δμ parameter. The free energy of a given site type relative to the kink site energy is then termed ΔGs and the driving force (Δμ) is also measured relative to the kink site energy. Reinterpretation of Meekes et al.14 then leads to:
 | (1) |
On this basis, the probability for growth Psgrowth and the probability for dissolution Psdissolution are then given by:
 | (2) |
 | (3) |
Fig. 1 shows a schematic representation of the important energy levels for an arbitrary crystallisation system. In this example we separate the enthalpic and entropic free energy terms between the solid and liquid phase, respectively. The transition from bulk solution to solid is split into two entropy-reducing steps. The first: a growth unit is first pulled from the mother solution and isolated, costing free energy equal to the entropy of mixing:
ΔGmix = RT![[thin space (1/6-em)]](https://www.rsc.org/images/entities/char_2009.gif) ln(solubility) ln(solubility) | (4) |
Second, the isolated and solvated unit must then be frozen into the solid state (costing free energy equal to the system temperature multiplied by the entropy of fusion for the compound).
| ΔfusG = TΔfusS | (5) |
This yields the fictitious site at the top of the crystal free energy ladder.
The values of the crystallisation free energies ΔGs, once determined, can be refined against experimental observables such as the crystal surface topography and the overall crystal habit. The magnitude of ΔGs is of the order of a kcal mol−1 and is consequently difficult to access via direct computation with an accuracy necessary to describe the subtle variations observed in surface topology at the nanoscale. Consequently, our methodology provides a direct route to establish these crystallisation free energies with high accuracy. The key is to have more experimental observables than parameters that are to be refined. Therein lies the problem of defining the surface sites in a straightforward manner that permits useful analysis and extraction of crystallisation ΔGs. The next sections describe how this can be done for nanoporous framework, molecular and ionic crystals.
Adapting the model to nanoporous materials – experimental basis for a closed cage approach
To begin discussion of adapting this method for use with nanoporous materials, let us consider the crystal growth of a zeolite. Typical starting growth conditions for a zeolite consist of an aluminosilicate gel formed through the cross-linking of alumina and silica species via oxygen bridges, under highly basic conditions. Some zeolite preparations contain only inorganic cations, in others, organic bases that act as templating or structure-directing agents are also present. This is a complex system in which the amorphous aluminosilicate gel consists of several different species with varying molecular weights and diverse ring and cage types. If we consider a simplified system that only consists of silica then there is an abundance of both spectroscopic data, mainly 29Si NMR, and mass spectrometry that shows the plethora of species present at the early stages of zeolite nucleation and crystal growth.15–18 Consequently, we have a seemingly intractable problem if we wish to construct even a simple model of crystal growth. And yet, despite the complexity in the solutions/gels from which the crystals grow for a given set of synthetic conditions, the crystal outcome is very well defined and, generally, predictable. The crystal morphology and size are most often reproducible as is the fine detail of the surface structure observed by scanning probe microscopies. Consequently, the rules for crystal growth must be well defined and limited. The reason for the plethora of species present in the solution or the gel is that these species all possess very similar energies. The partially condensed ring and cage structures consist of a mixture of Q0, Q1, Q2, Q3 and some Q4 T-sites (Qn is a tetrahedral framework component connected to n tetrahedral framework components and 4-n hydroxyl groups, T means tetrahedral) with the energy of the structures increasing when they are less condensed.The driving force (Δμ) for zeolite crystal growth originates from the fact that in the zeolite the bulk consists of only Q4 and the surface consists primarily of Q3 T-sites and hence the free-energy is lowered relative to the gel or solution where there is a greater preponderance of lower coordinate Qn species. It is now fairly well established that the free-energy differences between gel and zeolite are rather low, on the order of −1 to −2.5 kcal mol−1,19,20 and consequently the driving force for any crystal growth model is on this order of magnitude. Nonetheless, the direction of travel during a zeolite crystal growth process is towards greater condensation of growth units and this is the first clue in our simplification strategy.
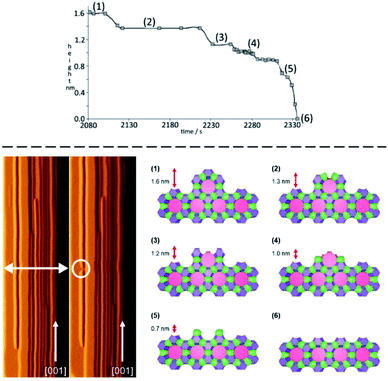
The next piece of evidence that helps guide our simplification comes from the wide range of atomic force micrograph images that we have recorded over the last 15 years on crystals of nanoporous materials. Post-mortem images, collected on crystals that have been taken from the reaction mixture following rapid sample quenching, invariably present surface features consistent with specific structural elements. Surface terraces of one unit cell or a simple fraction of a unit cell are frequently observed.5,8,11 Terrace shapes are usually consistent to a greater or lesser degree with the symmetry at the surface of the crystal.11 These observations are consistent with certain surface structures being much preferred with lower free energies. This is a general rule when considering zeolites, silicoaluminophosphates (SAPOs), aluminophosphates (AlPOs), zinc phosphates (ZnPOs) or MOFs. It is possible to conjecture the nature of the surface terminations for these materials based upon terrace heights and compare this to structures that are consistent with these heights that present a low area density of Q3 or Q2 T-sites. In many of these cases the predicted structures are closed cage structures that consist only of Q4 and Q3 terminations and no less condensed T-sites. These observations, however, are all based upon ex situ surface measurements whereby the crystal has been removed from solution. It is not surprising, therefore, that the most persistent, lowest energy structures are presented at the crystal surface. The most compelling evidence that helps to simplify our crystal growth model comes from in situ crystal growth and crystal dissolution measurements. In this respect our work on the dissolution of zeolite L reported previously clinches the argument.7 In that work we used the AFM tip to aid a progressive dissolution of zeolite L by “unstitching” the structure unit-by-unit (see schematic representation in Fig. 2). The surface structure of zeolite L consists of columns of cancrinite cages connected by double six-rings. These columns are aligned along the long c-axis of the crystal. Growth and dissolution of these columns parallel to the crystal surface is rapid in the c-direction and much slower in the orthogonal direction parallel to the crystal surface. It is slower still in a direction orthogonal to the crystal surface. Nevertheless, under mild basic conditions (insufficient to dissolve the crystal terraces on the timescale of the AFM experiment) it is possible to slowly dissolve a terrace in this slowest growth direction through gentle rastering of the AFM tip across the crystal terrace. This would eventually cut through the 1.6 nm high terrace in what we found previously to be a series of six (possibly seven) very well-defined steps, rather than a continuous dissolution process. After each step a section of the structure was removed, and the terrace remained metastable for a period before the next section was removed. We also showed that each of the six steps was consistent with a surface consisting of closed cages. In other words, the surface structure only consisted of optimally condensed Q3 groups and no terminations with a lower level of condensation. Such a result is not surprising as it is expected that the lowest energy structures have the greatest condensation but that this has been demonstrated experimentally via an in situ experiment adds much greater weight to the importance of these closed cage structures during crystal growth.
In situ AFM measurements are also consistent with the view that certain well-defined structures dominate at the crystal surface during both crystal growth and dissolution. Most zeolite crystals are grown under elevated temperature and pressure from gels, conditions that are challenging or frequently unattainable for in situ AFM measurements. Consequently, our work has focused primarily on in situ dissolution measurements. On the other hand, in situ growth measurements are relatively facile for nanoporous zinc phosphates and for MOFs. All such measurements give a consistent overall picture of dissolution or growth through metastable units.
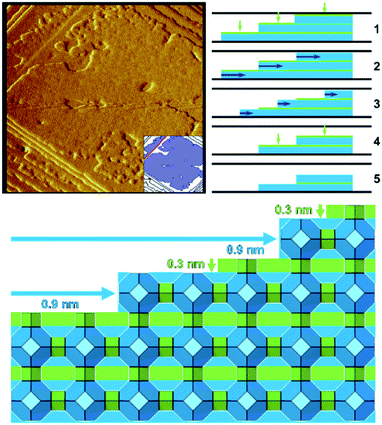
Zeolite A when dissolved under mild basic conditions shows that the well-defined terraces dissolve in two stages (Fig. 3).21 First, a 0.3 nm layer is removed through a non-correlated dissolution (patches of the terrace dissolving randomly), followed by the dissolution of a 0.9 nm layer in a correlated manner (terrace retreat as the edge is dissolved preferentially). These observations are consistent with the dissolution of a full layer of double four-rings and sodalite cages, respectively. The two cage types differ in their dissolution behaviour due to their connectivity within the framework; double four-rings within the zeolite A structure are not connected to each other by direct bonds through the framework, whereas sodalite cages are directly bonded to each other. This leads to the double four-rings being able to dissolve randomly, while one sodalite cage at the edge of a terrace must be removed before another cage can be dissolved, leading to dissolution in a correlated manner. These observations again are consistent with the importance of closed cages.
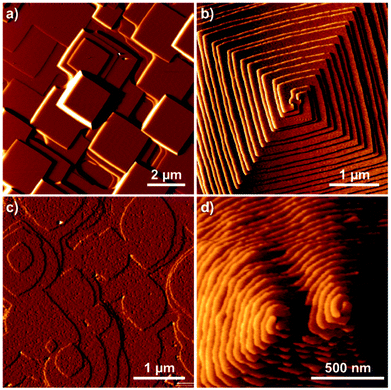
In situ AFM studies, e.g. measurements of growth of both the nanoporous ZnPO (SOD structure) and numerous MOF and zeolitic imidazolate framework (ZIF) structures (including MOF-5 and ZIF-8, Fig. 4), show the growth of terraces with well-defined shape.10,22 Growth occurs through both surface nucleation and terrace spreading (birth-and-spread) in addition to growth through spirals at screw dislocations. All terrace heights are consistent with simple fractions of unit cells that coincide with closed cage structures. In the case of MOFs, by careful analysis of early stage surface nucleation it is possible to briefly observe fractional cages containing Qn terminations lower than Qmax−1 (where Qmax denotes the highest coordination an atom in the MOF cage can possess). However, the dominating structures are consistent with closed cages.
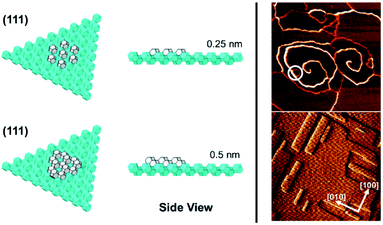
In the case of the ZnPO (SOD) structure a similar phenomenon is observed on the (111) facet as that previously described for the dissolution of zeolite A (Fig. 5).11 In this system two growth mechanisms are observed in situ occurring simultaneously: one, birth-and-spread, the other, spiral growth. Owing to the nature of the screw dislocation for the latter mechanism, the Burgers vector at the screw core necessitates that the terrace height is twice that observed for the birth-and-spread mechanism. Consequently, the framework units for terraces grown through the birth-and-spread mechanism are not connected through the framework but only connected weakly through extra-framework cations and water. Conversely, terraces formed through the spiral growth mechanism at the screw dislocation are fully connected through the framework. As a result, the shapes of the terraces are quite different. For the birth-and-spread mechanism the growth is isotropic, yielding more-or-less circular terraces that do not reflect the symmetry of the growth surface. For the spiral growth mechanism, the terraces are triangular reflecting the 3-fold symmetry on the (111) facet. This is evidence that the framework connectivity plays the primary role in defining growth rates and ultimate morphology whereas weaker non-framework interactions play a secondary role.
These collective observations lead to the conclusion that these closed cages can be considered as the rate-determining steps in the crystal growth process (provided the structure can be constructed from closed cages). The cages are considered to be space-filling and, consequently, the crystal growth is considered as growth of a dense crystalline phase, not as a nanoporous material. All the pores in a nanoporous structure are filled during crystal growth, whether with specific organic templates, inorganic cations and water or organic solvent molecules. Therefore, by considering the crystal growth in terms of rate-determining steps that fill space the importance of all the structural features are introduced and given a suitable weighting.
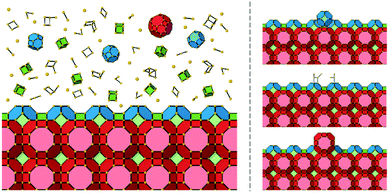
It is important to distinguish between the closed cages as rate-determining structural features (so called “units of growth”) and the actual growth units. By simplifying the problem to the rate-determining steps the primary growth units become less important for defining the growth process. Closed cages can complete by a continuous process of random growth and dissolution of any type of growth unit (monomers, dimers etc.). Dissolution is predominant until a closed cage is formed, and, for a zeolite structure, the surface structure is primarily composed of Q3 T-sites. More generally, for a nanoporous material, the condensation of structural units is maximized when a closed cage is formed. Fig. 6 shows a schematic representation that distinguishes between the unknown growth units and the known rate-determining steps in the crystal growth process.
Using such a simplification of the crystal growth of a nanoporous material also gives a picture as to why a growing crystal is self-selective for the repeated growth of the same crystal structure. Once nucleated, a crystal self-replicates because if a new structure is formed that is not correct it will never be able to complete the closed cages. Consequently, the resulting less condensed units (Q2 or Q1) will dissolve and the incorrect structure will unzip. This will happen repeatedly until the correct structure is formed and the surface is entirely Q3. If there are two alternative structures that can form on the growing surface, both of which are entirely Q3, then an intergrowth can be formed. Of course, the model is predicated on the establishment of viable crystal nuclei that will also be formed by a set of random condensation and dissolution events with at least a small preference for one structure type, however, in this work we do not want to deal directly with the initial nucleation event. Nevertheless, we can show that, by using our growth strategy, it is possible to predict the length of time required to form an initial nucleus based upon predictions of the supersaturation conditions and the energy landscape for crystal growth. This in turn could help suggest strategies to reduce the induction time required for zeolite synthesis.
A general model with natural tiles
A long-standing issue in the study of zeolites and other nanoporous materials is a lack of consistency in the usage of building schemes when investigating their crystal structures.23,24 Units from different schemes are routinely mixed together with the majority of schemes (aside from fundamental building units) lacking a basic list of rules governing their selection and application. Another issue facing each building scheme is its portability to structures other than its testing set. Common motifs from each scheme do appear frequently across several zeolite frameworks (e.g. the double four-ring), but far too often structures are encountered that partially, or entirely, cannot be constructed using certain building schemes. Secondary building units (SBUs) are a perfect example of this, where only 23 SBU types exist as of 2007,25 and usually rely on the crystal structure of a zeolite being composed entirely of a single SBU type with its nodes connected by edges to be fully constructed.26 Additionally, most building schemes have their use arbitrarily adjusted with respect to the sharing of edges, vertices and faces in attempts to build crystal structures in their entirety. Each of these arbitrary, human-made choices creates an impossible situation for algorithms to be employed to break down crystal structures into sensible units. SBUs and other building schemes also have the additional downside that (aside from polyhedral building units – PBUs), they do not convey any physical features of zeolite frameworks and are merely topographical units to deconstruct a crystal structure.27A proposed solution to this problem is the use of a completely new building scheme, with purely mathematically defined rules for their construction, and use, that can be generalised across all crystal structures. Natural tiling (also called the natural building unit – NBU) is a scheme which adheres to these conditions.27 In fact, the International Zeolite Association discontinued the assignment of SBUs for new zeolite structures in 2007, favouring the use of natural tiles or the broadest category of building unit: composite building units (CBUs).28,29
Tiles are generated using crystal nets and a sequence of 4 strict rules:
i. The symmetry of the tiling must coincide with the symmetry of the crystal net.
ii. Each tile face must be a strong ring (a single ring, not a sum of smaller rings). An exception can occur for the tiles that have ‘waists’ – non-strong rings, which divide the tile into two parts confined by strong rings. Such tiles can be split into two tiles, which have the ‘waist’ ring as a face.27
iii. All strong rings that are not faces must intersect each other.
iv. If more than one tiling obeys rules i–iii due to intersecting strong rings, only the smaller ring of a pair of rings with unequal sizes is used as a tile face. If both rings are equal in size, neither is selected as a tile face. This rule also means that the tile derived applying this rule cannot be split into smaller tiles in a unique way.26
Although there are an infinite number of tilings possible for each net, applying this set of rules results in a single unique (natural) tiling for each crystal net. As all the natural tiling method uses is the 3D net as input, this method can be transposed without issue to any regular crystal structure. A few exceptions can occur for some special types of structures, in particular, catenated arrays, which do not allow any tiling because they consist of several nets.
The natural tiling represents a normal (face-to-face) partition of the space so that each tile face (strong ring) is shared strictly between two tiles. The numbers of the net vertices (v), edges (e), tile faces (f) and tiles (t) are related by the Euler–Poincaré formula:
| v − e + f − t = 0. |
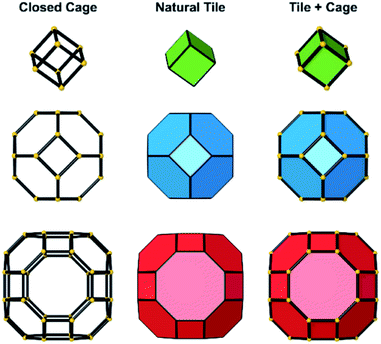
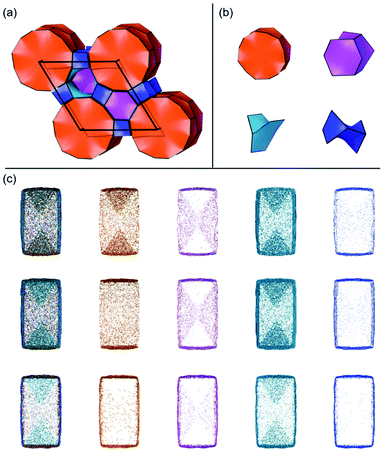
Several units from other building schemes can also be described as natural tiles. For example, commonly appearing cage structures such as the double-4 ring (an SBU), the sodalite cage (a polyhedral building unit – PBU), and the alpha cage (another PBU) all have natural tile equivalents: t-cub, t-toc and t-grc, respectively. This equivalence extends as far as to encompass the previously discussed closed cages, which all have natural tiling equivalents (Fig. 7). It is important to note, however, that a natural tile is a space-filling object that the crystal net is grown around, whereas a closed cage refers to the entire cage including the net. Regardless of this distinction, in CG the crystal net is combined with the tile, allowing the term tile and cage to be used interchangeably.
Using the software package ToposPro,30 natural tilings can be computed for almost all types of crystal net, including every zeolite framework, assuming a unit cell structure is available. A recent study31 revealed 392 topologically different natural tiles in the 239 zeolite frameworks known at that time. By studying these data, the conclusion can be drawn that roughly one quarter of zeolite frameworks can be constructed entirely of closed tiles. In order to fully assemble all zeolite frameworks, structures containing Q2 T-sites must be incorporated; so-called “open cages/open tiles”.
A statistical breakdown of zeolites composed entirely of closed tiles, entirely of open tiles, and composed of a mixture of both closed and open tiles is presented in Tables 1–4. Table 1 shows that zeolites composed entirely of open tiles are, by far, the majority. The proportion of zeolites formed from a combination of closed and open tiles is roughly equal to the proportion formed entirely of closed tiles. Tables 2–4 list the number of different tile types that different zeolite frameworks are composed of: closed tiles, open tiles and a combination of open and closed tiles, respectively. A key observation from these tables is that zeolites composed solely of closed tiles tend to be less complex (i.e. a lower number of different tile types are required to construct them) with the most complex frameworks requiring only five different tile types to be fully described. This contrasts with frameworks composed entirely of open tiles, along with a mixture of open and closed tiles, which require 16 different tile types to fully construct the more complex frameworks. Frameworks composed of a mixture of open and closed tiles tend to contain open tiles as the majority. Table S1 (ESI†) lists the number of closed tile types that are included in mixed frameworks, with the maximum number of closed tile types in a mixed framework being four. An average taken over the 68 frameworks composed of open and closed tiles indicates that only one in three tiles is closed, although the proportion of closed vs. open tiles varies substantially across all these frameworks. This ratio of closed to open tiles is also approximately one to three when measured across all known zeolite frameworks.
| Framework composition | Number of structures |
|---|---|
| Total | 252 |
| All closed tiles | 57 |
| All open tiles | 127 |
| Mixture of open and closed tiles | 68 |
| No. of closed tiles | Structure types |
|---|---|
| 1 | SOD (1) |
| 2 | AEI, AFG, AFY, AST, AWW, CHA, ESV, ETR, ITE, JSR, LEV, LOS, MEI, MEP, MTN, NPT, OBW, RHO, RTE, RTH, RUT, RWY, SAS, SGT (24) |
| 3 | AFS, AFV, AFX, AVL, BOZ, BPH, DDR, DOH, EAB, ERI, FAR, FAU, FRA, GIU, KFI, LIO, LTA, MAR, SAT, SAV, SFW, TOL (22) |
| 4 | AFT, AVE, EMT, IFY, IRN, SVV, SWY, UFI (8) |
| 5 | LTN, TSC (2) |
| No. of open tiles | Structure types |
|---|---|
| 1 | ABW, APC, AWO, CGS, GIS, JOZ, OSO, PUN, WEI (9) |
| 2 | ANA, ATT, BCT, BIK, BRE, BSV, EPI, JBW, JSN, JST, MON, MTF, NAB, NPO, NSI, PHI, PTY, PWO, PWW, SBN, UEI, YUG, ZON (23) |
| 3 | AEN, AFR, AHT, ATO, ATS, BOF, CAS, CDO, CFI, -CHI, CZP, DFT, EDI, ETV, GOO, IHW, JSW, -LIT, NAT, NON, -PAR, RRO, RWR, SFE, SFO, SIV, STF, STT, TON, VET (30) |
| 4 | AEL, AET, AFI, AFN, AFO, APD, ATV, CGF, CSV, DAC, EWO, EWS, *-EWT, FER, IFR, LTJ, MOR, MRT, MTT, MVY, NES, OSI, OWE, PON, SAF, SSY, THO, VFI, VSV (29) |
| 5 | DON, EEI, EUO, GON, IFO, JRY, LAU, LOV, *MRE, MTW, PSI, -RON, SFN (13) |
| 6 | *BEA, ETL, MFS, SFH, *-SSO, VNI (6) |
| 7 | JNT, OKO, PCR, RSN, -SVR (5) |
| 8 | BOG, TER (2) |
| 9 | CON, MEL, *STO (3) |
| 10 | MFI, SFS (2) |
| 11 | *-ITN (1) |
| 12 | *PCS (1) |
| 13 | TUN (1) |
| 14 | (0) |
| 15 | *SFV (1) |
| 16 | IMF (1) |
| No. of tile types | Structure types |
|---|---|
| 1 | N/A |
| 2 | ACO, ATN, CAN, STW (4) |
| 3 | GME, HEU, ITW, MAZ, MER, SFF, SOF, STI, UOZ (9) |
| 4 | ASV, IFW, SOS, -SYT (4) |
| 5 | IWV, LTL, MSO, OFF, POR, PWN, SZR, *UOE, UOS, USI, -WEN (11) |
| 6 | BEC, -CLO, *CTH, EON, LTF, SAO, SBT (7) |
| 7 | EZT, -IFU, -IRY, ITT, -ITV, MSE, MWF, PAU, SBE, SBS, SEW, SOR, SSF (13) |
| 8 | -IFT, IRR, ISV, MOZ, POS, *-SVY, UTL (7) |
| 9 | ITR, IWR, IWS, MWW (4) |
| 10 | ITH, SFG (2) |
| 11 | DFO, YFI (2) |
| 12 | SOV (1) |
| 13 | UWY (1) |
| 14 | IWW (1) |
| 15 | (0) |
| 16 | ITG, UOV (2) |
Closed tiles were previously selected as building units for crystal growth due to their metastability, and evidence supporting their formation being rate determining steps during the crystal growth process. Although open tiles incorporate the more unstable Q2 T-sites into building units, the natural tiling algorithm in ToposPro only includes the smallest number of Q2 sites to allow the assembly of the entire zeolite framework. If closed tiles can construct the framework, these are always chosen over open tiles. This indicates that open tiles are still the lowest possible energy structures that can fully construct the remaining three quarters of zeolite frameworks and are still a sensible choice as crystal building units when considering crystal growth.
Only nine of the currently known zeolite frameworks are composed of a single type of open tile (Table 3, first row). In all these tiles there are more Q3 T-sites than Q2, as expected using the natural tiling algorithm and due to their higher stability than Q2 T-sites. Seven of the nine tiles have less than 25% of their total T-sites with a condensation value of Q2, whereas for the remaining two tiles (in the ABW and OSO frameworks) the values are 43% and 45% of their T-sites, respectively. As the frameworks are entirely composed of a single type of open tile, a substantial number of tiles terminating the surface containing Q2 T-sites were expected. However, this was not the case seen in our simulations for all nine frameworks, as tiles were oriented at the surface to minimise the number of Q2 sites exposed to solution. This behaviour persisted even when the stability of Q2 T-sites was equal to the Q3 T-sites, which is unlikely based on thermodynamics. The proportion of exposed Q2 sites decreased further still upon increasing the energy penalty for Q2 sites. This indicates that regardless of tile composition, generally, open tiles on the surface are oriented in a way that a minimal number of Q2 sites are exposed. Studying an open tile framework with in situ AFM, in the same manner as performed for zeolite L would be important for definitive proof in what is occurring during the crystal growth process of these materials.
Energy ladders for nanoporous materials in terms of tiles in order to describe ΔGs
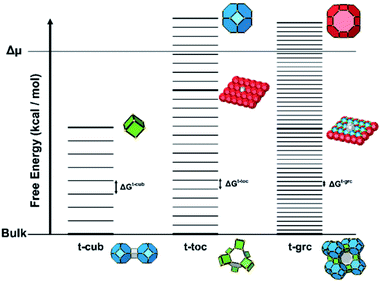
The free energy of a closed tile in a zeolite-like framework material depends primarily on two factors. The first is the degree of condensation of the tile and the second is the contents of the tile. The degree of condensation refers to the number of fully condensed Q4 bulk crystal T-sites versus incompletely condensed Q2 and Q3 surface or defect T-sites. For a zeolite there is an added degree of complexity in that the T-sites may be either silicon or aluminium, however, for our initial deliberations we will neglect this effect. Every condensation event in a zeolite lowers the overall free energy of the crystal. Under basic conditions for an all silica preparation this may be considered as follows:The magnitude of this effect has been measured experimentally by two different measurements: first, via calorimetric means which gives the energy stored per T–O–T unit as −0.57 kcal mol−1; second, by NMR measurements that monitor the equilibrium populations in solution which yield a value of −4.2 kcal mol−1 per condensation event.19,20 This latter value is measured under conditions that more closely resemble the conditions during crystal growth and is, therefore, more likely to be a useful guide for our studies. For example, if we consider the closed t-toc tile (also known as the sodalite or β cage), which appears in the SOD, LTA, FAU and EMT zeolite frameworks, then the tile is composed of 24 T-sites. If this tile is housed within the bulk zeolite structure, then all 24 T-sites are Q4 and the tile has the lowest free energy possible. A t-toc tile at the surface of the crystal has a mixture of Q3 and Q4 sites. The more Q3 sites present in the tile the higher the free energy of the tile and the less stable the tile. We can expect that the presence of each Q3 unit raises the free energy by a value on the order of 1–4 kcal mol−1. The highest possible energy structure is a t-toc tile with 24 Q3 sites. This is, of course, a fictitious site that is unconnected to the zeolite crystal, yet fully hydrated and with the same entropy as it would have had had it been connected to the crystal. There are a total of 25 permutations for the number of Q4 and Q3 in a closed tile with 24 T-sites (24 of which we may consider viable if we ignore the permutation with 24 Q3 T-sites). To a first order approximation these 25 permutations can be placed on a free energy ladder with 25 equally spaced rungs. 24 Q4 T-sites at the bottom of the ladder, equivalent to the free energy of the crystal bulk and the fictitious 24 Q3 T-sites on the top rung. The spacing between the rungs are on the order of 1–4 kcal mol−1. For crystal growth we are primarily interested in the surface structures where material is grown or dissolved. Consequently, it is the relative energy of the Q3, or more uncondensed sites, that are key. The energy ladder is then a measure of the degree of “un-condensation” and the lowest rung can be placed at an arbitrary zero energy for every tile.
The second important effect on the free energy of a closed tile is the contents of the tile. A small fraction of the known zeolite crystal structures crystallise only in the presence of inorganic cations and water as extra-framework species. These, nonetheless, act as important templates around which the tiles grow. The vast majority of zeolite and zeotype structures are synthesised in the presence of organic structure-directing agents (SDA's or templates) that act to stabilize the tile units. Double 4-ring (t-cub in natural tile notation) closed tiles can be stabilized with F– ions in zeolites and those in MOFs are stabilized with organic solvents. The effect of all these agents is to render the crystal a dense phase during crystallization which is the reason to consider these crystal-growth processes as that of a dense phase, not an open-framework, system. In terms of the energy ladder the templating agents act to reduce the spacing between the rungs if a tile is stabilized. In our work this becomes one of our unknown parameters that are determined through Monte Carlo calculations and simulation of experimental variables – e.g. crystal habit and surface topology.
For a zeolite structure with more than one tile type, such as zeolite A, which has t-toc, t-grc (also known as the α cage) and t-cub tiles, there are three energy ladders (see Fig. 8). The base of each ladder is at the same energy level, that for all Q4. The number of rungs is 49 for the t-grc with 48 T-sites and 9 for the t-cub with 8 T sites. The t-toc tile is as discussed previously. The separations between the rungs on each of the three ladders are the three variables that can be determined by simulation of experimental variables.
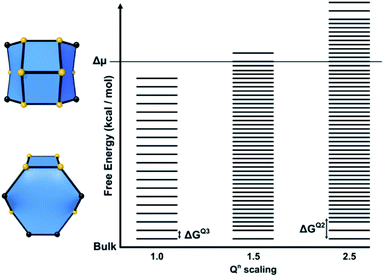
For structures containing open cages, this approach must be modified slightly. The free energy of a tile structure still depends on the two factors discussed previously, however an additional parameter must be accounted for when considering the degree of condensation an open tile possesses. For closed tiles, the only possible change in condensation is the process of a Q3 T-site becoming a Q4 T-site, open tiles add the additional possibility of a Q2 to Q3 transition. The energies for each of these processes may not necessarily be equal, therefore a further parameter is included to scale the energy for a Q2 to Q3 condensation. This energy is scaled relative to the energy for a Q3 to Q4 condensation and affects the spacing between rungs for permutations of tiles that contain Q2 sites. This parameter is known as the Qn scaling in CG. An energy level diagram for a zeolite framework composed of a single type of open tile is shown in Fig. 9 with the Qn scaling parameter varied.
In summary, for a closed tile system a free energy ladder is constructed. The number of site configurations (equal to the number rungs on a ladder) is one more than the number of T-sites in a given tile. The lowest rung represents the bulk crystal energy. The spacing between the rungs is equal and on the order of 1–4 kcal mol−1. The number of ladders depends upon the number of tile types and the ladder spacings are unknown refinable variables. The actual spacing, which is a consequence of the tile content, is determined through Monte Carlo fitting of crystal habit and surface topography.
For open tile systems, the number of unknown variables is increased by one: the Q2 to Q3 condensation energy relative to the Q3 to Q4 condensation energy, which is also determined through Monte Carlo fitting. The spacing between rungs varies at points on the ladder, dependent on the energy assigned for Q2 to Q3 condensations.
This simplified picture, at this stage, has ignored secondary effects such as: differences from isomorphous substitution of heteroatoms at T-sites, Al for Si for instance; similarly of zeotypes such as zinco-phosphates where the number of Zn and P in a tile will determine the free energy. Then there are even more minor effects such as the contents of neighbouring tiles or the differences in precise crystallographic environment of the T-sites in a tile. Nonetheless, the key goal of CG is the creation of a general model to be used across as many systems as possible, with more system-specific variables invoked at a later stage.
Extending the approach to other materials – energy stabilisation through neighbour connectivity
For the zeolite-like (framework) structures discussed in the previous sections, simplification of the crystal growth process to tile structures is justified due to their existence as units of growth, where their formation is described as the rate-determining step during crystal growth. For other structure types, it is far more sensible to consider the actual growth units during the crystal growth process. For example, molecular and ionic crystals are two broad classifications of crystal structure types where the growth units are clearly definable and non-exchangeable units: single molecules or ions. In this context, non-exchangeable means that a clearly defined crystallographic position exists for each species; one species cannot switch places with another aside from at defects in the crystal structure. This contrasts with simplified zeolite-like structures where each vertex of a tile can be treated as the same species and their positioning is not important in defining the overall energy of the tile. Each vertex is treated identically to the rest of the vertices in the tile (assuming their free energies of condensation are the same).For ionic and molecular crystals, the incorporation of an entire ion or molecule into the crystal structure is the rate-determining step, meaning the unit of growth and the growth unit are in fact the same thing. Therefore, for studying the crystal growth of these material types it is important to consider the free energy of each species that composes the crystal structure individually. This requires interrogation of the growth unit interactions with neighbouring species. A molecule within a molecular crystal, for example, may interact with its neighbours through hydrogen bonds, van der Waals interactions or pi–pi stacking in the case of aromatic molecules. The free energy difference between these interactions and that between the molecule and the solvent will define the growth kinetics.
In many cases neighbouring molecules are in multiple orientations in relation to the origin molecule, leading to separate sets of interactions between the origin molecule and its neighbours. For example, a single hydrogen bond to one neighbour versus two hydrogen bonds to another neighbour in a different orientation leads to each neighbour contributing a different interaction energy to the origin molecule, despite being the same type of molecule. Multi-component crystals on the other hand such as MOFs have separate species such as metal clusters, organic linkers and solvent species, that will all have their own sets of interactions to each other e.g. different kinds of chemical bonds. Identifying the number of interactions, the type of interactions and which species they connect to is key to our approach to partition the crystal structure into site types and create energy ladders for molecular and ionic crystals, as performed for zeolite-like structures. The identification of the interactions between the growth units and the chosen solvent are also crucial to match accurately experimental crystal morphologies. Solvent-dependent morphologies are frequently encountered during crystallisation, caused by changes in the free energy for the process of desolvation and incorporation into the crystal structure.
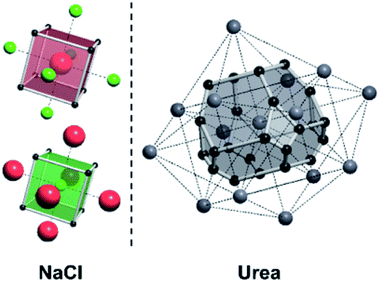
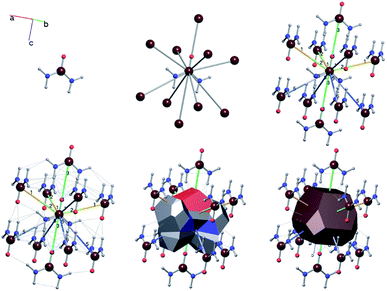
A useful method for recognising interactions between species in molecular and ionic crystals, along with their overall strength is the use of Voronoi–Dirichlet Polyhedra (VDP).32 VDP are space-filling polyhedra that can, when packed together construct an entire crystal structure. VDP are constructed for each individual unit in a crystal, setting its position as the centre of the polyhedron, then searching in three-dimensional space to a set distance for all points that are closer to the central species than neighbouring species.33 This results in planes as boundaries between neighbouring species. Each plane can be considered as a polyhedral face, that when combined with other surrounding planes results in a space-filling three-dimensional polyhedron: a VDP (Fig. 10). All neighbours near enough to each other for a face to be formed are classed as adjacent, and all neighbours past the cut-off distance for VDP formation are ignored. As each species will have a VDP, the units can be packed together to fully describe the crystal structure, similar to the natural tiles used in zeolite-like structures.
One added benefit of using VDP is that they also give insight into the interactions between species in crystal structures. Neighbours that are closer together have larger shared VDP faces by definition and generally have stronger interactions between each other due to their proximity. Generally, the larger the VDP face, the larger the interaction between neighbouring species.32 It is important to note that the VDP approach is merely a useful method for identifying the existence and strength of interactions between neighbours and is not an actual unit of growth as natural tiles are.
The similarities between the two approaches must be emphasised. Both schemes are concerned with the interactions of a unit with neighbouring units, be that unit a tile composed of many species, or a single molecule or ion. The free energies of units of growth in both scenarios are decided by the growth of neighbouring units and how these pre-formed connections lower the free energy of the species attempting to grow or raise the free energy for species attempting to dissolve.
Energy ladders for other materials in terms of neighbour connectivity
Energy ladders for crystals described using individual growth units differ in their construction to those using tiles and condensation, although they both demonstrate the same concept. As for zeolite-like structures, the most stable and most unstable crystal unit types can be identified for molecular, ionic or atomic species. The most stable unit is the fully coordinated unit in the crystal bulk and the most unstable unit is a fully uncoordinated site: an isolated, solvated unit not connected to the crystal, identical to zeolite-like structures. Each rung between these two states is a different permutation of neighbours (or multiple permutations in cases of degeneracy) connected to the central unit. A unit's overall free energy decreases with each added coordination, taking it closer to its most stable crystal bulk state.The number of rungs on each ladder, along with the spacing between the rungs is where the procedure differs. Gaining a coordination to a neighbour lowers the free energy of a species by the amount of energy assigned to that neighbour. This energy is equivalent to the change in energy for replacing a solvent species with a neighbouring crystal species. In this scenario, these replacement energy values for neighbours are our unknown parameters, similar to the tile energies encountered in zeolite-like structures. These energies can initially be assigned by educated guesses using the VDP approach, by experimentally measured values or by values calculated through ab initio simulations, all of which are followed by Monte Carlo refinement and fitting of the crystal habit and topography to microscopy data.
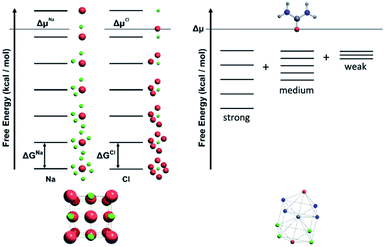
For a crystal structure treated with the individual growth unit approach, the number of ladders is equal to the number of distinct species that construct the crystal structure, e.g. NaCl would have two ladders, one for Na+ and one for Cl− (Fig. 11, left). The number of permutations depends on the number of neighbours, their interaction types, along with the types of the neighbours themselves. Also affected by these parameters are the number of rungs on the final ladder, as degeneracies can appear between permutations, dependant on the energies assigned to the interactions from different neighbours. Example energy ladders for urea, where three different interaction energies are used for various neighbours are shown on the right-hand side of Fig. 11. The energy contribution from each of these interaction types can be varied to result in numerous different ladder structures.
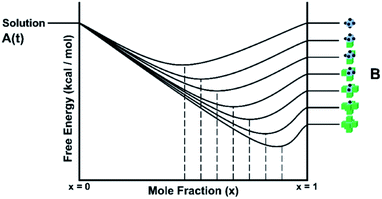
Solution/gel phase and the driving force Δμ
The solution or gel phase in the CG method is treated similarly to the MONTY method. Bulk crystal and bulk solution are the two ground states in the crystal growth process, with all steps or site types between being intermediate states. A unit of growth in bulk solution is fully encapsulated with solvent, which is in turn surrounded by the bulk solvent phase. Before addition to the crystal surface, this unit must undergo one or several desolvation steps, all with associated energy barriers. Upon isolation from bulk solution and loss of entropy to the solid phase, the unit of growth is at its highest possible free energy, with no stabilisation contributed from either the bulk solution or crystal phase. This fictitious site is the site placed at the top level of all the crystal site energy ladders discussed in the previous sections. A schematic free energy diagram for the conversion between solution and crystal is shown in Fig. 12, with A denoting the solution phase and B denoting the crystal phase.In CG, the solution behaves like a continuum, supplying new units of growth to the crystal to grow or subtracting units of growth away to dissolve. It is governed entirely by the bulk term of the thermodynamic driving force (supersaturation or Δμ). Currently we are not capturing diffusion limited growth, although that could be added in the future by coding the transport of nutrient near the crystal surface. The parameter Δμ contains the differences in free energy, entropy and volume between the bulk solution and bulk crystal phases, along with the temperature and pressure of the system, assuming these remain constant during the simulation. This parameter is key in the equations that underpin CG (eqn (2) and (3)), where the probabilities of growth and dissolution are calculated for each crystal site type. The second term in each equation is governed by Δμ and is assigned a positive or negative sign for the calculation of the probability of growth or dissolution for a crystal site, respectively. Considering the entire crystal, if Δμ is positive then the overall rate of growth is greater than dissolution. When Δμ = 0 these rates are equal and when Δμ is negative the crystal dissolves.
The growth of a unit at a kink site is equivalent to the addition of bulk crystal as the overall growth of a crystal is almost entirely controlled by addition at kink sites. Consequently, the energy at the kink site is, more-or-less, the chemical potential of the crystal.
Δμ must also be high enough to overcome the energy barrier to nucleation before any crystal growth is observed. For the first few steps in any CG simulation crystal growth must occur via the highest energy site types near the top of the energy ladder. As no crystal growth has occurred in the system, most or all neighbour connections are missing, raising the free energy for the first few growing units. This leads to repeated periods of growth of a small cluster of units, then rapid dissolution, identical to the process of reaching a critical nucleus size seen in experimental crystal growth. With infinite time, provided Δμ > 0 a crystal will eventually form, however, as simulations have a fixed time length, this barrier must be surmounted early in the simulation to produce any crystals of useful size.
Plotting the value of Δμ on the same axes as the energy level diagram demonstrates this issue, as all sites below Δμ are favoured to grow, whereas all those above are favoured to dissolve. Even though μcrystal is at or lower than the middle of the energy ladder, the crucial nucleation rungs are far above this value (Fig. 8, 9 and 11). This issue can be easily overcome by setting Δμ higher than these levels at the beginning of the simulation to surmount this barrier and grow the necessary critical nucleus size, then reduce the value of Δμ to a more reasonable amount, nearer μcrystal. This solution does however limit the information that can be gathered about the nucleation kinetics for a system and should be used when considering only the crystal growth process.
During real crystal growth experiments, the Δμ is generally tied to the concentration of growth “nutrient” added to the reaction mixture (among other conditions such as temperature and pressure profiles). The concentration of these units over time can fluctuate depending on the experimental setup used. Units can be gradually consumed versus time in cases without direct interference, kept constant through constant flow setups or directly manipulated by the rapid addition or removal of units from the solution phase. Each of these experiment types result in completely different profiles of Δμ vs. time and have a large influence on the crystal growth process, the resulting crystal morphologies and the observed surface topology. To account for this, a number of potential Δμ “modes” are available for use with the CG method that can be selected to most accurately match experimental setups. Details on these modes can be found in the ESI† provided with this manuscript.
Computational methodology
CrystalGrower §
A typical CG run is divided into three main phases: (i) the initialisation phase, concerned with reading in parameters from the user then assembling the crystal structure of the material to be grown and constructing the energy ladders for each species in a system; (ii) the growth/dissolution loop of the program, where the Monte Carlo selection process occurs and crystal site types are selected by probability weightings to grow or dissolve by a random number generator. Within the main loop is also a checking routine that updates neighbouring sites to the site selected for growth or dissolution; (iii) the final output stage, where numerical data are written to a set of text files that can be used to investigate the values of several parameters related to the energetics of the crystal growth process vs. simulation time. This is also the stage where scaled cartesian coordinate data are output for use in visualisation software.For the initialisation phase a structure file must be created that contains all the information about connectivity within the crystal structure of interest. We have developed a standard format for this structure file (see ESI† material) that can be generated automatically. For framework structures such as zeolites a package within the software ToposPro has been developed that generates the structure input file for CG directly. Structure files for other crystal types can either be generated by ToposPro or by a bespoke in-house program. In all cases the starting point is a standard CIF file.
The Monte Carlo selection algorithm at the core of CG incorporates the calculation of both the probability weighting along with statistical chance for selection of each site permutation/type in the system. By multiplying the population of a site type with its probability weighting (Pgrowths and Pdissolutions) a relative probability of selection is calculated for each site type. Comparing the relative probability values with the value of a random number calculated at each iteration allows the selection of a site type at which to grow or dissolve. This selection process is pseudorandom and similar in nature to importance sampling usually encountered in Monte Carlo calculations. Once a site type is selected, a second generated random number can be used to select a particular site at random within the chosen site type to be grown or dissolved. Each site configuration will possess both a growth site type and a dissolution site type that can be selected, with their populations recalculated at each iteration. A fully detailed discussion of the CG methodology is included in the ESI† presented with this manuscript.
In addition to the general algorithm for the crystal growth of any structure, CG also contains a set of extra features that can be used to modify the crystal growth process of a material. These features include: a general mechanism for adding a single screw dislocation along any crystallographic direction; addition of growth modifiers; distinguishing between different coordination types, e.g. the carbonate ion in calcite, each oxygen can be coordinated to one or two calcium ions; effect of ordering of framework structures, such as Si, Al ordering in zeolite A; and multiple driving forces for growth from non-stoichiometric solutions.
CrystalGrower visualiser
During early development stages, it was deemed necessary to develop a companion visualisation package capable of displaying results from CG – the CrystalGrower Visualiser (CGV). Previous CG versions relied on third-party software for visualisation of simulated morphologies and surface topologies, such as Wolfram Mathematica for two-dimensional systems, and VMD or Ovito for three-dimensional systems. Neither of these programs are ideally suited for the output from CG and led to slow processing speeds and difficulty in handling larger file sizes.The CGV was developed in tandem with the visualisation output format from CG, meaning all issues encountered with the use of third-party software are eliminated. Originally built to visualise closed cages for a small number of zeolite structures from an internal database, the CGV is now capable of visualising any structure built from natural tiles or individual growth units. A general algorithm uses the data output from CG to construct natural tiles, place spheres at appropriate positions to represent individual growth units or construct entire molecules from atoms and bonds. These constructed objects can then be called at appropriate coordinates to assemble a simulated crystal in its entirety. The CGV can display data in several ways depending on user requirements and contains several tools for studying the output of CG in greater detail. Movies can also be generated with the CGV to study growth and dissolution processes of any material simulated with CG. Full discussion of the visualisation methodology and the features available in the CGV are presented in the ESI.†
ToposPro interface
Prior to the generalisation of the CG algorithm, it was necessary to develop a methodology for decomposing crystal structures into units of growth as starting points for crystal growth. The software ToposPro already performed this task and had been widely used in the field of crystal topology to study the three-dimensional partitioning of zeolite frameworks26,34 and ideal nets27 into natural tiles along with molecular crystals into VDP.32An additional output format was coded into ToposPro where a text file is produced containing structural information after deconstruction to units of growth. The format of this structure file was designed collaboratively, resulting in a file containing all the topological information required to calculate the neighbours for every species in the unit cell. The format of the structure file is discussed in further detail in the ESI.†
More recently, further development has taken place on the structure file generation process through VDP, resulting in the capacity to model more complex crystal growth features. By using full molecular VDP rather than molecular centroids, local atom–atom connections are retained when simplifying the crystal net for CG. This results in more accurate neighbour identification as interacting atoms between molecules may be far closer to each other than centroids would suggest (especially in the case of asymmetric molecules). Retaining this information also allows the assignment of different energy weightings to different molecular coordinations, similar to the Qn scaling parameter discussed for natural tile structures. This is particularly of use for differentiating multidentate coordinations from their monodentate counterparts.
Tiling and molecular structure files are produced in a similar manner, first a CIF file is read into a database, then the coordination of the species is calculated with the AutoCN module in ToposPro. Here users can specify the strength of interactions to consider by modifying the minimum solid angle (tied to the smallest face size to consider on the generated VDP) to use during the coordination number calculation. Longer range and weaker interactions can be considered by reducing the minimum solid angle during this calculation, meaning a variety of coordinations can be calculated for a single structure with varying levels of complexity.
Once the coordination between atoms and molecules has been calculated, the ADS module in ToposPro is invoked to calculate either the natural tiling for the connected net (for zeolites and other framework materials) or a simplified net whilst considering VDP (molecular and ionic crystals). The structure file can then be exported from ToposPro for use in CG simulations.
For the case of the simplified net, an additional file is required to treat the structure in CG: an index of the interaction types originating from each molecule/ion along with an energy value to assign said interaction in kcal mol−1. Each interaction type is assigned a number (e.g. molecule 1, interaction type 1 could be a pair of hydrogen bonds with the same length to different neighbours), and a free energy of crystallisation is assigned to this interaction by the user. The free energy of crystallisation in this context is the energy cost to replace the interaction to the crystal with an interaction to solvent. This file is also generated automatically by ToposPro by utilising the point group for the molecular/ionic species that assemble the crystal structure. As the structure is transformed to the primitive cell and P1 symmetry for use in CG, this information is calculated before the transformation, then reduced to match the species retained within the primitive cell from the convenient cell. As the interactions are generated during the net simplification process, the interactions types can be used as labels while visualising the structure using the IsoCryst module in ToposPro. Fig. 13 shows urea as an example where the bond labels identify the six interaction types that originate from each urea molecule. Due to the interaction types being calculated using the point group of the molecule, molecules that differ only by their symmetry positions will share the same interaction types in the same order, simplifying the energy assignment process. Use of the point group also allows the energy assignment of interaction directions separately (i.e. A–B ≠ B–A), crucial for modelling the growth of polar crystals.
Using molecular VDP, ToposPro can also estimate the strength of an interaction based on the size of the VDP face for a molecular interaction. It must be noted however that these are interaction strength estimations and will differ from the free energies of crystallisation required for CG, although they are a good starting point. Another point must be emphasised that molecular VDP are calculated as a sum of the atomic VDP for each atom in the molecule. The ramification of this definition is that the atom–atom connections calculated using AutoCN will determine if a molecule–molecule interaction will appear i.e. if an atom–atom interaction between a molecule and a neighbour is weak, then it will be excluded before a closer and stronger atom–atom connection on another neighbour, regardless of if the centroid of the first neighbour is closer than the second to the reference molecule. This differs to a purely geometric approach where only distances between centroids will decide if a molecule–molecule interaction will appear.
Graphical user interface
CrystalGrower can be operated either directly at the command line, or through a tkinter-based graphical user interface (GUI). The GUI simplifies the generation of CG input files and automates the running of the program. The user has the option to run a single simulation, or to queue a series of simulations, with selected numerical variables changing stepwise across the series. Simulation parameters can be saved and loaded, allowing previous simulations to be repeated quickly and easily. Within the interface it is possible to monitor the progress of simulations and abort them if necessary. The CrystalGrower GUI runs with full functionality on both Windows and macOS.Examples
Framework crystals
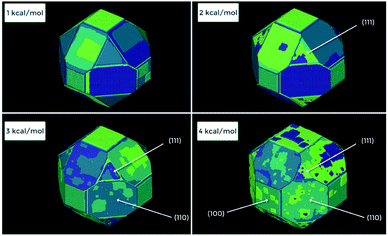
Framework crystals such as zeolites can be treated efficiently using the tiling approach. Other nanoporous materials such as MOFs can also be treated through a tiling approach, however, our experience indicates that it is better to treat MOFs in a similar manner to molecular crystals with a finer coarse-graining of the problem (see next section). The example given in Fig. 14 is that of zeolite L an important catalyst for applications such as the dehydrocyclization of light naphtha. This one-dimensional wide-pore system is constructed from five tiles with a mixture of open and closed cages. Four small tiles construct the backbone of the zeolite and the final large tile defines the large pore system. Much of the growth form is defined by this large tile with 48 vertices that requires considerable free-energy to stabilise when each vertex condensation takes ca. 1.5 kcal mol−1. As a consequence, the structure builds through the smaller cages that grow around the large cage which then only completes when it is already almost entirely condensed. The result is the individual cancrinite columns that form on the {100} facets of the hexagonal prismatic crystals. Only when two of these cancrinite columns are, by chance, adjacent to one another does the bridging cancrinite column form circumscribing the large t-lil cage and forming the one-dimensional large pores. The (001) facet, by contrast, despite also growing layer-by-layer, has a much more fractal type of growth that is often observed in this crystal system. See ESI S_movie_1† that show zeolite L crystal growth.Molecular and ionic crystals – growth modifiers
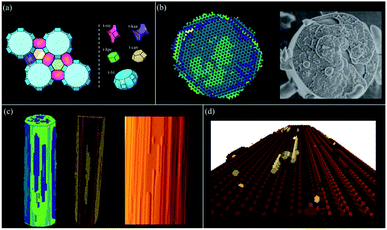
Molecular and ionic crystals, or indeed metallic crystals, are treated as Voronoi–Dirichlet Polyhedra and some examples are shown in Fig. 15. L-Cystine is a good example of a molecular crystal whereby the principal growth mechanism is via a complex pinwheel type screw dislocation that runs along the c-axis. The morphology of L-cystine can be controlled by the addition of growth modifiers such as L-cystine dimethylester that bind to the (100) face.35CrystalGrower permits an investigation of the consequences of binding at specific growth sites, and Fig. 15 shows the effect of binding at a 2-coordinate site bridging the fast and a slow growth direction. The strength of binding can also be varied in order to test the efficiency required to effect morphology control.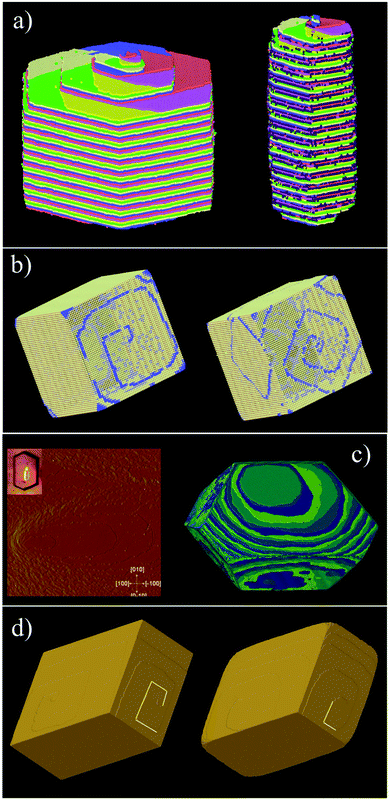 | ||
| Fig. 15 All the simulations in this figure have been carried out using the Voronoi–Dirichlet Polyhedra (VDP) procedure. (a) shows L-cystine growth with (right) and without (left) the addition of growth modifiers (the dark spheres) that affect the crystal aspect ratio (see S_movie_2 in ESI†). (b) shows the metal organic framework MOF-5 under two supersaturation conditions – left an excess of metal component and right an excess of linker. The crystal terraces emanating from the screw dislocation switch from diamonds to squares consistent with atomic force microscopy measurements. The blue component is the metal which is primarily exposed at the edge of the crystal terrace (see S_movie_3 in ESI†). (c) show the organic crystal, adipic acid whereby the both the crystal morphology and surface terracing are faithfully reproduced with 4 local free-energies of crystallisation ranging from 0.85 to 2.3 kcal mol−1 (see S_movie_4 in ESI†). (d) shows two simulations of calcite under low supersaturation conditions (left) and close to equilibrium (right). The screw dislocation exhibits straight terrace edges on the obtuse step under both conditions but curved edges on the acute step near equilibrium as observed experimentally. | ||
Metal organic frameworks (MOFs) pose some interesting issues for crystal growth simulation. The crystals are composed of extended covalent or coordinate interactions that describe the open framework structure. However, the crystal morphology and surface topography cannot be understood only in terms of this network. MOF-5, as an example, exhibits gross morphology and surface topography change22 when the ratio of linker to metal is altered in the growth medium. Further, the structural linkages in MOF-5 lie strictly along <100> directions and yet strong topological features are expressed along other principal crystal axes. This all points to the solvent being intimately involved in the crystal growth process. Fig. 15b demonstrates that when the solvent–framework interactions are included in the growth simulation then the observed topological changes can be faithfully simulated. Care has to be taken regarding the activity of the different components in the simulation as the metal and linker are used up during growth whereas the solvent always remains in large excess.
Often crystal growth phenomena are controlled by subtle crystallographic differences such as the presence of obtuse/acute steps such as in adipic acid, Fig. 15c, or calcite, Fig. 15d. These would be easy to address in a bespoke code for an individual crystal system but is more challenging for a general code. This, however, can be achieved in both these cases by considering coordination pairs which is a feature of the CrystalGrower code. For adipic acid this permits fine tuning of the crystallisation free energies for specific processes down to below 1 kcal mol−1. In the case of calcite it is found that these coordination pairs – i.e. whether a carbonate is coordinated via one oxygen to either one or two calcium ions – is an important distinction between the acute and obtuse steps and may well explain their observed differences in growth rates and relative terrace rounding.36
Screw dislocations and point defects
Dislocations and defects in crystals are critical phenomena when considering crystal growth mechanisms. Their appearance both informs our understanding of the growth mechanism as well as changing the outcome and consequent functionality of the crystal. Within CrystalGrower it is both possible to introduce specific dislocations as well as to observe defects spontaneously emerge during the crystal growth. Most crystals, although not all, that our group and others have observed during crystal growth using atomic force microscopy contain screw dislocations. The topographic form of these screw dislocations is a sensitive signature of the crystal growth mechanism and energetics. Consequently, simulating these specific dislocations is an important aspect and CrystalGrower has been adapted to allow a generic screw dislocation to be added to any crystal structure. The direction and displacement of the screw core can be chosen arbitrarily as long as it is consistent with an allowed Burgers vector for the crystal system. In the initial code version only one screw dislocation can be added owing to the complexity of adding a completely generic screw dislocation, however, it is envisaged in the future that multiple screw dislocations and families of screw dislocations could be added.
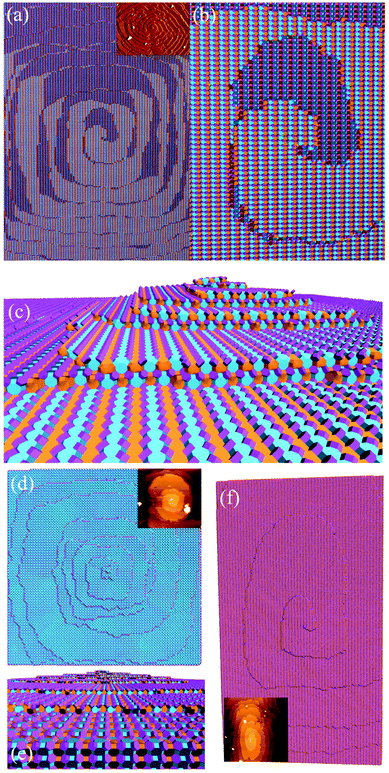
Fig. 16 shows one complex crystal system, the nanoporous silico-aluminophosphate STA-7 with the SAV topology, that exhibits three different screw dislocations. The first dislocation is an interweaved double screw on the (100) facet that is faithfully reproduced using CrystalGrower, see Fig. 15a–c. The double screw is split into two individual growth terraces that are related by an inversion centre that switches fast and slow growth directions. This results in an interweaved pattern principally driven by the t-sav cage in STA-7 with ![[4 with combining macron]](https://www.rsc.org/images/entities/char_0034_0304.gif) 2m point group symmetry. The fourfold symmetry along the c-axis results in a single screw on the (001) face with more-or-less isotropic growth, again faithfully reproduced by CrystalGrower, see Fig. 16d and e. STA-7 also exhibits another screw dislocation on the (100) facet, see Fig. 16f, that is a single elliptical screw that is completely inconsistent with permitted Burgers vectors for this structure. However, STA-7 belongs to a family of 4 structures with the potential to intergrow as a result of changes in the double six-ring linkages. One of these allowed intergrowths is that of SAPO-18, AEI topology, that can intergrow on the (100) facet of SAV. Fig. 16f shows that a simulation of the AEI structure using exactly the same energetics used for the SAV structures predicts a single screw with the same topology as that observed on the STA-7 crystals. This shows how such spiral growth signatures at screw dislocations can be utilised to determine the presence of very low concentrations of intergrowth structures that would be extremely difficult to determine by other techniques. Movies of the growth and structure of these screw dislocations can be seen in the ESI S_movie_5.†
2m point group symmetry. The fourfold symmetry along the c-axis results in a single screw on the (001) face with more-or-less isotropic growth, again faithfully reproduced by CrystalGrower, see Fig. 16d and e. STA-7 also exhibits another screw dislocation on the (100) facet, see Fig. 16f, that is a single elliptical screw that is completely inconsistent with permitted Burgers vectors for this structure. However, STA-7 belongs to a family of 4 structures with the potential to intergrow as a result of changes in the double six-ring linkages. One of these allowed intergrowths is that of SAPO-18, AEI topology, that can intergrow on the (100) facet of SAV. Fig. 16f shows that a simulation of the AEI structure using exactly the same energetics used for the SAV structures predicts a single screw with the same topology as that observed on the STA-7 crystals. This shows how such spiral growth signatures at screw dislocations can be utilised to determine the presence of very low concentrations of intergrowth structures that would be extremely difficult to determine by other techniques. Movies of the growth and structure of these screw dislocations can be seen in the ESI S_movie_5.†
The internal crystal structure of SAV also shows that point defect clusters spontaneously form during crystal growth, see Fig. 17. This is a result of the possibility for the crystal growth to propagate not only by attachment at a terrace edge but also by a three dimensional growth that leaves unfilled gaps. This latter phenomenon will be much less likely than the former but will depend upon competitive growth rates on different facets.
In some cases, clusters of defects are seen to preferentially appear in certain zones within simulated crystals. We have previously shown how the spontaneous appearance of these high-density defect zones mimics the optical birefringence seen experimentally in the MFI framework.13 Similar behaviour is seen for the AFI framework (Fig. 18), also known to exhibit hourglass-shaped defect zoning when studied with optical, Raman or fluorescent microscopy.37 Competitive growth rates between facets lead to the retention of internal defects, with incomplete tiles left within the crystal in favour of addition at the surface. Fig. 18c shows how the zoning pattern can differ for each of the four tiles that assemble the AFI structure (Fig. 18a and b), with some tiles exhibiting stronger hourglass patterns than others, and some zoning along different crystallographic directions. This figure also shows how the densities of defects are affected by the supersaturation of the solution phase, with the defect density generally decreasing with decreasing supersaturation. In some cases, the appearance of zoning can disappear completely (particularly the large t-apf cage at undersaturated conditions). Control over crystal defect concentration is highly desirable for many areas of industry, particularly catalysis. The relatively large number of internal defects seen for this structure could have implications that the energetics of the internal volume of the crystal and its surface are closer in value compare to structures with less defects.
Effect of supersaturation
The effect of supersaturation on the growth dynamics is readily probed using CrystalGrower. An example is shown in Fig. 19 for zeolite A which expresses three principal facets: {100}; {110}; {111}. A full movie of the growth is shown in the ESI S_movie_6a† and shows that {111} facet growth is switched on at the lowest supersaturation followed by {110} facets and finally the {100} facets. As can be seen from the sequence the {111} facets become gradually smaller as the supersaturation is increased because of the significantly faster nucleation and growth of these facets demonstrating that the morphology of zeolite A can be controlled by careful adjustment of supersaturation. High supersaturation could be achieved in gels with low cross-linking (i.e. high concentration of Q3 and Q2 units) whereas low supersaturation could be achieved in gels containing high cross-linking. Control of zeolite A morphology is important for its use as a detergent builder in order to prevent crystals with sharp corners. The effect of supersaturation is also shown in the zeolite L system, ESI S_movie_6b† which shows that the equilibrium crystal habit and the habit at high supersaturation are very similar. It is only at critical intermediate supersaturations when growth on certain facets is turned on or off that the habit deviates.Prospects for predictive growth
Thus far the energy ladder for materials has been largely determined empirically by fitting to experimental observations. An exciting prospect for the future would be a scenario in which the relative free energy of growth units relative to solution phase could be computed in an automated manner to create a predictive tool. Certainly indirect calculation of the solubility via the free energy of dissolution is already possible in a number of ways, many of which could be automated. This would require determination of the solvation free energy of the growth unit via either molecular dynamics or an accurate continuum solvent model, followed by the computation of the lattice free energy of the target material. While calculation of the stability of most crystalline solids is now possible with increasingly high levels of quantum mechanical theory,38 use of more approximate methods would better suit the goal of an automated approach. An accurate, yet significantly less costly strategy, for molecular crystals is to compute the properties, such as electron density, of a single monomer and then compute the lattice energy based on force field-like expressions for the Coulomb interactions, polarisation, repulsion and dispersion between molecules. This strategy was pioneered by Gavezzotti through the PIXEL approach,39 which can be coupled with a graphical interface to yield interaction energies in an automated fashion.40 Other similar methods, such as CE-B3LYP,41,42 have performed impressively in benchmarks against CCSD(T)/CBS data at a fraction of the cost. While in principle the direct use of force field calculations would be even more efficient, to date most attempts to create a universal force field that could be applied in an automated way to a wide range of systems have lacked sufficient accuracy, at least without specific refinement of the parameterisation. Here again there are grounds to be optimistic, with the advent of new general force fields that appear to accurately reproduce quantum mechanical results,43 while the increased focus on data science and the ability to utilise crystallographic databases is also leading to greater transferability.44While the prospects for automated accurate prediction of bulk solubility are extremely promising, the determination of the free energies of growth units at the crystal–solvent interface remains a challenge, especially when the solvent can be strongly coordinating, such as is the case for water. In the special case of highly soluble molecular crystals, such as urea, it has proven to be possible to determine not only the equilibrium constants for individual surface sites, but also the rate constants directly from molecular dynamics.45 However, this represents the exception rather than the rule. For most systems where growth rates are slow on a molecular dynamics timescale it is necessary to carefully determine the free energies for attachment/detachment of growth units individually by bias-enhanced techniques to map the free energy, being careful to consider the rate at which solvent molecules exchange within the coordination shell. Although this can now be readily accomplished for a single ion binding to a terrace,46 the challenge rapidly increases when considering attachment to steps or kinks due to the increasing dimensionality of the free energy landscape.47,48 Consequently, there are relatively few known free energy maps for growth units at the interfacial sites of most interest,49 and so overcoming this remains the greatest obstacle to fully ab initio predictive growth modelling.
Future challenges
With the general basis of the model established, we are continually investigating additional features that could be added to improve the approach and extend its use to more complex crystal growth scenarios. Each of these features has its own set of challenges for the creation of a general algorithm that allows their application in any crystal system.Of particular interest for the future are defect structures such as twins and intergrowths that are observed across numerous crystal structures. Twinning can be viewed as the easier of the two problems to tackle as the crystal structure remains the same, although there will be an extended defect in the structure at the twin plane. Research is required into general rules for allowed twins across all space groups and the conditions which lead to their formation to create a general model. Much like screw dislocations, the first step to implementing twinning in CG would be to allow users to specify a twin that they have observed experimentally, although spontaneous twin generation based on simulation conditions would be ideal. Regardless, an adjustment to how CG grows crystals would be required, currently relying on the underlying crystal structure as a “scaffolding” to guide the crystal growth process.
Intergrowths are an extension of this problem, where the crystal structure itself also changes. Previous attempts to model the growth of an intergrown system of zeolites MER and PHI using a supercell were successful. However, this would not match general intergrowth structures in reality as it was not a random intergrowth or an extended intergrowth running through the crystal, but an intergrowth appearing in the same location in every repeating supercell. Similar developments would be required to find a general rule for allowed intergrowths across all crystal structures. Graph similarity has been proposed as a predictor for possible interzeolite transformations, although this is only for a small class of crystals.50
The addition of families of screw dislocations has also been considered, with the challenge being how to model the interaction overlapping screw cores. This is an essential addition as screw dislocations frequently appear on multiple facets in crystals studied with AFM, and implementing only one screw dislocation can have a dramatic effect on the overall crystal morphology by artificially preferring crystal growth in one crystallographic direction over all others.
Also planned is the addition of modelling competing polymorphs. Again requiring the modification of the underlying method CG uses to grow crystals, our intention here is to separate our simulated growth environment into a segment for each polymorph with a shared growth medium. Placing the energy ladders for each competing structure on the same free energy axis, would indicate which polymorph would be most likely to nucleate primarily under certain crystallisation conditions. This would be decided by the free energy of the sites for nucleation towards the top of the energy ladders, along with the solubility of the compound (which would have control over the overall energy spacing and kink site energy).
Extensions to the modelling of the solution phase are also desired, particularly to model the effects of diffusion-limited growth mechanisms. This would grant the ability to model fractal growth behaviour as famously seen in ice to generate snowflakes, or the Hopper type growth seen in bismuth and other mineral crystals. Adding in a local supersaturation parameter rather than a system-wide parameter is likely the way to achieve this, with the possibility of incorporating measured diffusion coefficients into the model.
Conclusions
By using a simple approach of calculating the free energy of crystallisation of units of growth, combined with the effect of the growth or dissolution of species upon their neighbours, we present CrystalGrower (CG): a unified methodology for the simulation of crystal growth of any crystal type. Calculation of the probability of growth or dissolution in the CG method relies entirely on the free energies of crystallisation of units of growth and a bulk thermodynamic term for the driving force towards crystallisation (Δμ). A Monte Carlo selection algorithm, where the probability weighting of sites is accounted for, along with statistical chance, ensures that favoured sites are frequently chosen for growth or dissolution. This occurs while still allowing for the rare chance of a disfavoured site being chosen. Two building schemes for crystal structures are presented: natural tiles evolving from the closed cage approach used in early CG versions for zeolite-like structures; and individual growth units for tackling ionic, molecular and atomic crystals. Although the building schemes differ, the overall method of modelling the crystal growth is the same, and care must be taken to select the scheme that most accurately matches the crystal type being studied.The CG methodology has been shown to accurately replicate and predict experimental results for crystal morphology and surface topology for several material types.13 The current program versions are designed as a base for use in general crystallisation studies, with numerous improvements planned to account for more complex cases that arise in some crystal growth scenarios. We hope that the CG methodology presented in this manuscript will lead to further steps forward in the field of crystallisation when adopted by others researchers in the wider community.
Contribution of authors
M. W. A. conceived ideas, wrote the CrystalGrower growth code and performed simulations, J. T. G.-R. wrote an early version of the growth and visualization code and performed simulations, A. R. H. wrote the CrystalGrower visualization code and performed simulations, N. dB., Z. aH., R. J. S. P and P. C. recorded AFM images, M. P. A. coordinated MOF work, M. T. wrote the graphical user interface, V. A. B. modified the ToposPro code to interface with CrystalGrower, D. M. P. developed ideas to integrate tiling methodology, D. A. and B. A. funded A. R. H. and contributed to discussions about the mechanism of crystal growth, and J. D. G. computed energetics for the calcite and L-cystine systems.Conflicts of interest
There are no conflicts to declare.Acknowledgements
V. A. B. is grateful to the Russian Science Foundation (Grant No. 16-13-10158) for support of developing the tiling approach. D. M. P. thanks the Universitá degli Studi di Milano for Grant No. PSR2015-1718. The Research Council of Norway, through the project Catlife, ‘Catalyst transformation and lifetimes by in situ techniques and modelling’, P#233848, is acknowledged for financial support. A. R. H. and J. T. G.-R. are grateful for part funding from EPSRC through CASE awards. J. D. G. thanks the Australian Research Council for support through grant FL180100087, and the Pawsey Supercomputing Centre and National Computational Infrastructure for provision of computing resources. We also acknowledge the Leverhulme Trust and the Royal Society for financial support.Notes and references
- F. J. Giessibl, Mater. Today, 2005, 8, 32–41 CrossRef CAS.
- M. W. Anderson, J. R. Agger, J. T. Thornton and N. Forsyth, Angew. Chem., Int. Ed. Engl., 1996, 35, 1210–1213 CrossRef CAS.
- J. R. Agger, N. Pervaiz, A. K. Cheetham and M. W. Anderson, J. Am. Chem. Soc., 1998, 120, 10754–10759 CrossRef CAS.
- J. R. Agger, N. Hanif, C. S. Cundy, A. P. Wade, S. Dennison, P. A. Rawlinson and M. W. Anderson, J. Am. Chem. Soc., 2003, 125, 830–839 CrossRef CAS.
- L. I. Meza, M. W. Anderson and J. R. Agger, Chem. Commun., 2007, 2473–2475 RSC.
- R. Brent and M. W. Anderson, Angew. Chem., 2008, 120, 5407–5410 CrossRef.
- R. Brent, P. Cubillas, S. M. Stevens, K. E. Jelfs, A. Umemura, J. T. Gebbie, B. Slater, O. Terasaki, M. A. Holden and M. W. Anderson, J. Am. Chem. Soc., 2010, 132, 13858–13868 CrossRef CAS.
- M. W. Anderson, J. R. Agger, N. Hanif and O. Terasaki, Microporous Mesoporous Mater., 2001, 48, 1–9 CrossRef CAS.
- M. Shöâeè, M. W. Anderson and M. P. Attfield, Angew. Chem., Int. Ed., 2008, 47, 8525–8528 CrossRef.
- P. Y. Moh, P. Cubillas, M. W. Anderson and M. P. Attfield, J. Am. Chem. Soc., 2011, 133, 13304–13307 CrossRef CAS.
- M. A. Holden, P. Cubillas, M. P. Attfield, J. T. Gebbie and M. W. Anderson, J. Am. Chem. Soc., 2012, 134, 13066–13073 CrossRef CAS.
- R. Wagia, I. Strashnov, M. W. Anderson and M. P. Attfield, Angew. Chem., Int. Ed., 2016, 55, 9075–9079 CrossRef CAS.
- M. W. Anderson, J. T. Gebbie-Rayet, A. R. Hill, N. Farida, M. P. Attfield, P. Cubillas, V. A. Blatov, D. M. Proserpio, D. Akporiaye, B. Arstad and J. D. Gale, Nature, 2017, 544, 456 CrossRef CAS.
- S. X. M. Boerrigter, G. P. H. Josten, J. van de Streek, F. F. A. Hollander, J. Los, H. M. Cuppen, P. Bennema and H. Meekes, J. Phys. Chem. A, 2004, 108, 5894–5902 CrossRef CAS.
- S. D. Kinrade and T. W. Swaddle, Inorg. Chem., 1988, 27, 4259–4264 CrossRef CAS.
- C. T. G. Knight and R. K. Harris, Magn. Reson. Chem., 1986, 24, 872–874 CrossRef CAS.
- R. K. Harris and B. J. Kimber, Appl. Spectrosc. Rev., 1975, 10, 117–137 CrossRef CAS.
- D. P. Petry, M. Haouas, S. C. C. Wong, A. Aerts, C. E. A. Kirschhock, J. A. Martens, S. J. Gaskell, M. W. Anderson and F. Taulelle, J. Phys. Chem. C, 2009, 113, 20827–20836 CrossRef CAS.
- G. S. Pokrovski, J. Schott, S. Salvi and R. Gout, Mineral. Mag., 1998, 62 A, 1194–1195 CrossRef.
- B. Tagirov, J. Schott, J.-C. Harrichoury and J. Escalier, Geochim. Cosmochim. Acta, 2004, 68, 1333–1345 CrossRef CAS.
- L. Itzel Meza, M. W. Anderson, B. Slater and J. R. Agger, Phys. Chem. Chem. Phys., 2008, 10, 5066–5076 RSC.
- P. Cubillas, M. W. Anderson and M. P. Attfield, Chem.–Eur. J., 2012, 18, 15406–15415 CrossRef CAS.
- J. V. Smith, Microporous and other Framework Materials with Zeolite-Type Structures; Landolt-Börnstein New Series IV/14 Subvolume A: Tetrahedral Frameworks of Zeolites, Clathrates and Related Materials, Springer-Verlag Berlin Heidelberg, Berlin, 2000 Search PubMed.
- R. X. Fischer and W. H. Baur, Microporous and other Framework Materials with Zeolite-Type Structures Landolt-Börnstein New Series IV/14 Subvolumes B-H Zeolite-Type Crystal Structures and their Chemistry, Springer-Verlag Berlin Heidelberg, Berlin, 2000 Search PubMed.
- C. Baerlocher, L. B. McCusker and D. H. Olson, in Atlas of Zeolite Framework Types, Elsevier Science B.V., Amsterdam, 6th edn, 2007, p. 373 Search PubMed.
- N. A. Anurova, V. A. Blatov, G. D. Ilyushin and D. M. Proserpio, J. Phys. Chem. C, 2010, 114, 10160–10170 CrossRef CAS.
- V. A. Blatov, O. Delgado-Friedrichs, M. O'Keeffe and D. M. Proserpio, Acta Crystallogr., 2007, A63, 418–425 CrossRef.
- H. van Koningsveld, Compendium of Zeolite Framework Types: Building Schemes and Type Characteristics, Elsevier Science, 1st edn, 2007 Search PubMed.
- C. Baerlocher and L. B. McCusker, Database of Zeolite Structures, http://www.iza-structure.org/databases/, accessed 4 September 2018 Search PubMed.
- V. A. Blatov, A. P. Shevchenko and D. M. Proserpio, Cryst. Growth Des., 2014, 14, 3576–3586; https://topospro.com/ Search PubMed.
- O. A. Blatova, A. A. Golov and V. A. Blatov, Z. Krist-Cryst. Mater., 2019, 234, 421–436 CAS.
- V. A. Blatov, Crystallogr. Rev., 2004, 10, 249–318 CrossRef CAS.
- W. Fischer and E. Koch, Zeitschrift für Krist., 1979, 150, 245–260 CrossRef CAS.
- V. A. Blatov, G. D. Ilyushin and D. M. Proserpio, Chem. Mater., 2013, 25, 412–424 CrossRef CAS.
- A. G. Shtukenberg, L. N. Poloni, Z. Zhu, Z. An, M. Bhandari, P. Song, A. L. Rohl, B. Kahr and M. D. Ward, Cryst. Growth Des., 2015, 15, 921–934 CrossRef CAS.
- K. J. Davis, P. M. Dove, L. E. Wasylenki and J. J. De Yoreo, Am. Mineral., 2004, 89, 714–720 CrossRef CAS.
- L. Karwacki, E. Stavitski, M. H. F. Kox, J. Kornatowski and B. M. Weckhuysen, in Zeolites and related materials: trends, targets and challenges, ed. A. Gédéon, P. Massiani and F. T.-S. Babonneau, Stud. in Surf. Sci. Catal., Elsevier, 2008, vol. 174B, pp. 757–762 Search PubMed.
- G. H. Booth, A. Grüneis, G. Kresse and A. Alavi, Nature, 2013, 493, 365–370 CrossRef CAS.
- A. Gavezzotti, J. Phys. Chem. B, 2002, 106, 4145–4154 CrossRef CAS.
- A. G. P. Maloney, P. A. Wood and S. Parsons, CrystEngComm, 2016, 18, 3273–3281 RSC.
- M. J. Turner, S. Grabowsky, D. Jayatilaka and M. A. Spackman, J. Phys. Chem. Lett., 2014, 5, 4249–4255 CrossRef CAS.
- S. P. Thomas, P. R. Spackman, D. Jayatilaka and M. A. Spackman, J. Chem. Theory Comput., 2018, 14, 1614–1623 CrossRef CAS.
- S. Spicher and S. Grimme, Angew. Chem., Int. Ed., 2020, 59, 15665–15673 CrossRef CAS.
- A. Gavezzotti, L. Lo Presti and S. Rizzato, CrystEngComm, 2020, 22, 7350–7360 RSC.
- S. Piana, M. Reyhani and J. D. Gale, Nature, 2005, 438, 70 CrossRef CAS.
- S. Kerisit and S. C. Parker, J. Am. Chem. Soc., 2004, 126, 10152–10161 CrossRef CAS.
- A. G. Stack, P. Raiteri and J. D. Gale, J. Am. Chem. Soc., 2012, 134, 11–14 CrossRef CAS.
- M. De La Pierre, P. Raiteri, A. G. Stack and J. D. Gale, Angew. Chem., Int. Ed., 2017, 56, 8464–8467 CrossRef CAS.
- M. N. Joswiak, M. F. Doherty and B. Peters, Proc. Natl. Acad. Sci., 2018, 115, 656–661 CrossRef CAS.
- D. Schwalbe-Koda, Z. Jensen, E. Olivetti and R. Gómez-Bombarelli, Nat. Mater., 2019, 18, 1177–1181 CrossRef CAS.
Footnotes |
| † Electronic supplementary information (ESI) available. See DOI: 10.1039/d0sc05017b |
| ‡ Present addresses: Scientific Computing Department, STFC Daresbury Laboratory, Warrington WA4 4AD, UK (J. T. G.-R.). Earth Sciences Department, Durham University, Lower Mountjoy, South Road, Durham DH1 3LE, UK (P. C.). |
| § A general release of CG (both GUI and command line versions) and the CG visualiser are available at crystalgrower.org. Documentation is hosted at crystalgrower.org along with links to video guides hosted on our YouTube channel: CrystalGrower. Readers can also contact the corresponding author of this manuscript for access to the software. ToposPro is freely available for non-commercial users at topospro.com and a light version of ToposPro is available at crystalgrower.org. |
| This journal is © The Royal Society of Chemistry 2021 |

