
 Open Access Article
 This Open Access Article is licensed under a Creative Commons Attribution-Non Commercial 3.0 Unported Licence
Boosting the electrocatalytic performance of NiFe layered double hydroxides for the oxygen evolution reaction by exposing the highly active edge plane (012)†
Jia-Wei
Zhao‡
,
Zi-Xiao
Shi‡
,
Cheng-Fei
Li
,
Lin-Fei
Gu
and
Gao-Ren
Li
 *
*
MOE Laboratory of Bioinorganic and Synthetic Chemistry, The Key Laboratory of Low-carbon Chemistry & Energy Conservation of Guangdong Province, School of Chemistry, Sun Yat-sen University, Guangzhou 510275, China. E-mail: ligaoren@mail.sysu.edu.cn
First published on 6th October 2020
Abstract
The intrinsic activity of NiFe layer double hydroxides (LDHs) for the oxygen evolution reaction (OER) suffers from its predominantly exposed (003) basal plane, which is thought to have poor activity. Herein, we construct a hierarchal structure of NiFe LDH nanosheet-arrays-on-microplates (NiFe NSAs-MPs) to elevate the electrocatalytic activity of NiFe LDHs for the OER by exposing a high-activity plane, such as the (012) edge plane. It is surprising that the NiFe NSAs-MPs show activity of 100 mA cm−2 at an overpotential (η) of 250 mV, which is five times higher than that of (003) plane-dominated NiFe LDH microsheet arrays (NiFe MSAs) at the same η, representing the excellent electrocatalytic activity for the OER in alkaline media. Besides, we analyzed the OER activities of the (003) basal plane and the (012) and (110) edge planes of NiFe LDHs by density functional theory with on-site Coulomb interactions (DFT+U), and the calculation results indicated that the (012) edge plane exhibits the best catalytic performance among the various crystal planes because of the oxygen coordination of the Fe site, which is responsible for the high catalytic activity of NiFe NSAs-MPs.
Introduction
The oxygen evolution reaction (OER) is a crucial reaction that provides protons and electrons in many energy storage and conversion systems.1–8 However, the sluggish kinetic process of the OER results in a high overpotential to deliver the desired current density because of its multi-step electron transfer process.9–14 Precious-metal oxides, such as IrO2 and RuO2, are efficient OER electrocatalysts, but their low abundance and high cost prohibit large-scale applications.15–17 Therefore, the exploration of low-cost electrocatalysts with high OER electrocatalytic activity is highly pursued.Among the various low-cost OER electrocatalyst alternatives, NiFe layered double hydroxides (LDHs) have drawn particular interest owing to their abundant reserves and superior performance.18–22 In many two-dimensional layered materials, the catalytic properties often originate from their scarce edge planes rather than the basal plane.23–25 The edge planes contain edge-site atoms that are not fully coordinated and thus exhibit unique catalytic behaviors.26 This conclusion has also been applied to metal layered hydroxides, LDHs, and their corresponding oxyhydroxides. Theoretically, Bajdich et al. showed that the edge planes, such as the (104) and (012) planes, are more active for the OER than the (001) basal plane in β-CoOOH.27 Similar arguments have also been applied to the theoretical investigation of β-NiOOH and γ-NiOOH for the OER.26,28 However, to date, there is little experimental evidence to prove the superior OER catalytic activity of edge planes of LDHs, such as NiFe LDHs, because the traditional LDHs mainly expose the low-activity basal plane.29,30 To understand the role of edge planes and optimize the activity of NiFe LDHs for the OER, the active edge-plane-dominated NiFe LDHs should be explored for efficient OER.31
Based on our previous studies,32–34 here we employed a plane engineering method to expose the abundant edge planes of NiFe LDHs, and a hierarchal NiFe LDHs nanosheet-arrays-on-microplates (NiFe NSAs-MPs) on nickel foam (NF) was designed and successfully synthesized. Compared with the traditional (003)-dominated NiFe LDHs microsheet arrays (NiFe MSAs), the NiFe NSAs-MPs have fully exposed edge planes, such as the (012), (015) and (110) planes, and they exhibit a fivefold enhancement in OER catalytic activity at an overpotential of 250 mV. Herein, the origin of the high catalytic activity of NiFe NSAs-MPs is studied by experiments and density functional theory for calculation of the on-site Coulomb interaction of localized electrons (DFT+U).35 By excluding the influences of mass and specific surface area, we proved the high catalytic activity of the (012) edge plane experimentally. The theoretical calculations show that the (012) edge plane exhibits superior activity with a low theoretical onset overpotential of ∼330 mV for the OER, and the (003) and (110) planes exhibit relatively low catalytic activity with high theoretical onset overpotentials of ∼460 and ∼410 mV, respectively. This work provided the experimental and theoretical evidence to demonstrate the high electrocatalytic activity of the (012) edge plane of NiFe LDHs and realized the synthesis of NiFe NSAs-MPs rich in the exposed (012) edge plane for the OER.
Results and discussion
In order to design high-efficiency NiFe LDH electrocatalysts for the OER, the origin of the catalytic activity of the different crystal planes of NiFe LDHs is firstly studied theoretically. The exposed edge plane of NiFe LDHs may be responsible for its catalytic activity. Herein, we employed density functional theory with on-site Coulomb interactions (DFT+U) to determine the theoretical OER onset overpotential of the crystal planes of NiFe LDHs.36 Based on the adsorbate evolution mechanism (AEM, Fig. S1†) proposed by Nørskov and Rossmeisl,37,38 the detailed OER process on NiFe LDHs is shown in Fig. 1a and b (where the asterisk “*” represents an electroactive site on the catalyst surface, and OH*, O*, and OOH* are the adsorbed intermediates). For the analysis of the catalytic activity of the crystal plane, the dehydrogenated basal plane (003) and two typical edge planes (012) and (110) were investigated, which are mainly exposed planes of NiFe LDHs, as shown in the PDF card of the XRD pattern in Table S1.† The linear relationship established by Norskov et al. was utilized to create a volcano plot,15 as shown in Fig. 1c. According to this linear theory, when the O* binding energy (G*O–G*OH) on NiFe LDHs during the OER is about 1.5 eV and the OH* binding energy (G*OH) is within the range of 0.4–1.6 eV, the NiFe LDH catalyst will have superior OER electrocatalytic performance. It is worth mentioning that in addition to the basal plane, we found that the reaction site is an Fe site rather than a Ni site. The theoretical calculation results shown in Fig. 1c indicate that the (012) plane is the most active plane for the OER with the lowest onset overpotential, as shown in the deep green region, while the (110) and (003) planes both show poor catalytic activity with high onset overpotentials, as shown in the red and yellow regions, respectively. In order to further determine the performance of the crystal planes, we also calculated the lattice-oxygen-participated oxygen evolution reaction (LOER) mechanism with the lattice oxygen of LDHs as the reaction site. It can be seen that the (003) and (110) planes both show high activity in the LOER, as shown in the light green region in Fig. 1c, but their activities are still inferior to that of the (012) plane, indicating that the (012) edge plane is the most active crystal plane of NiFe LDHs.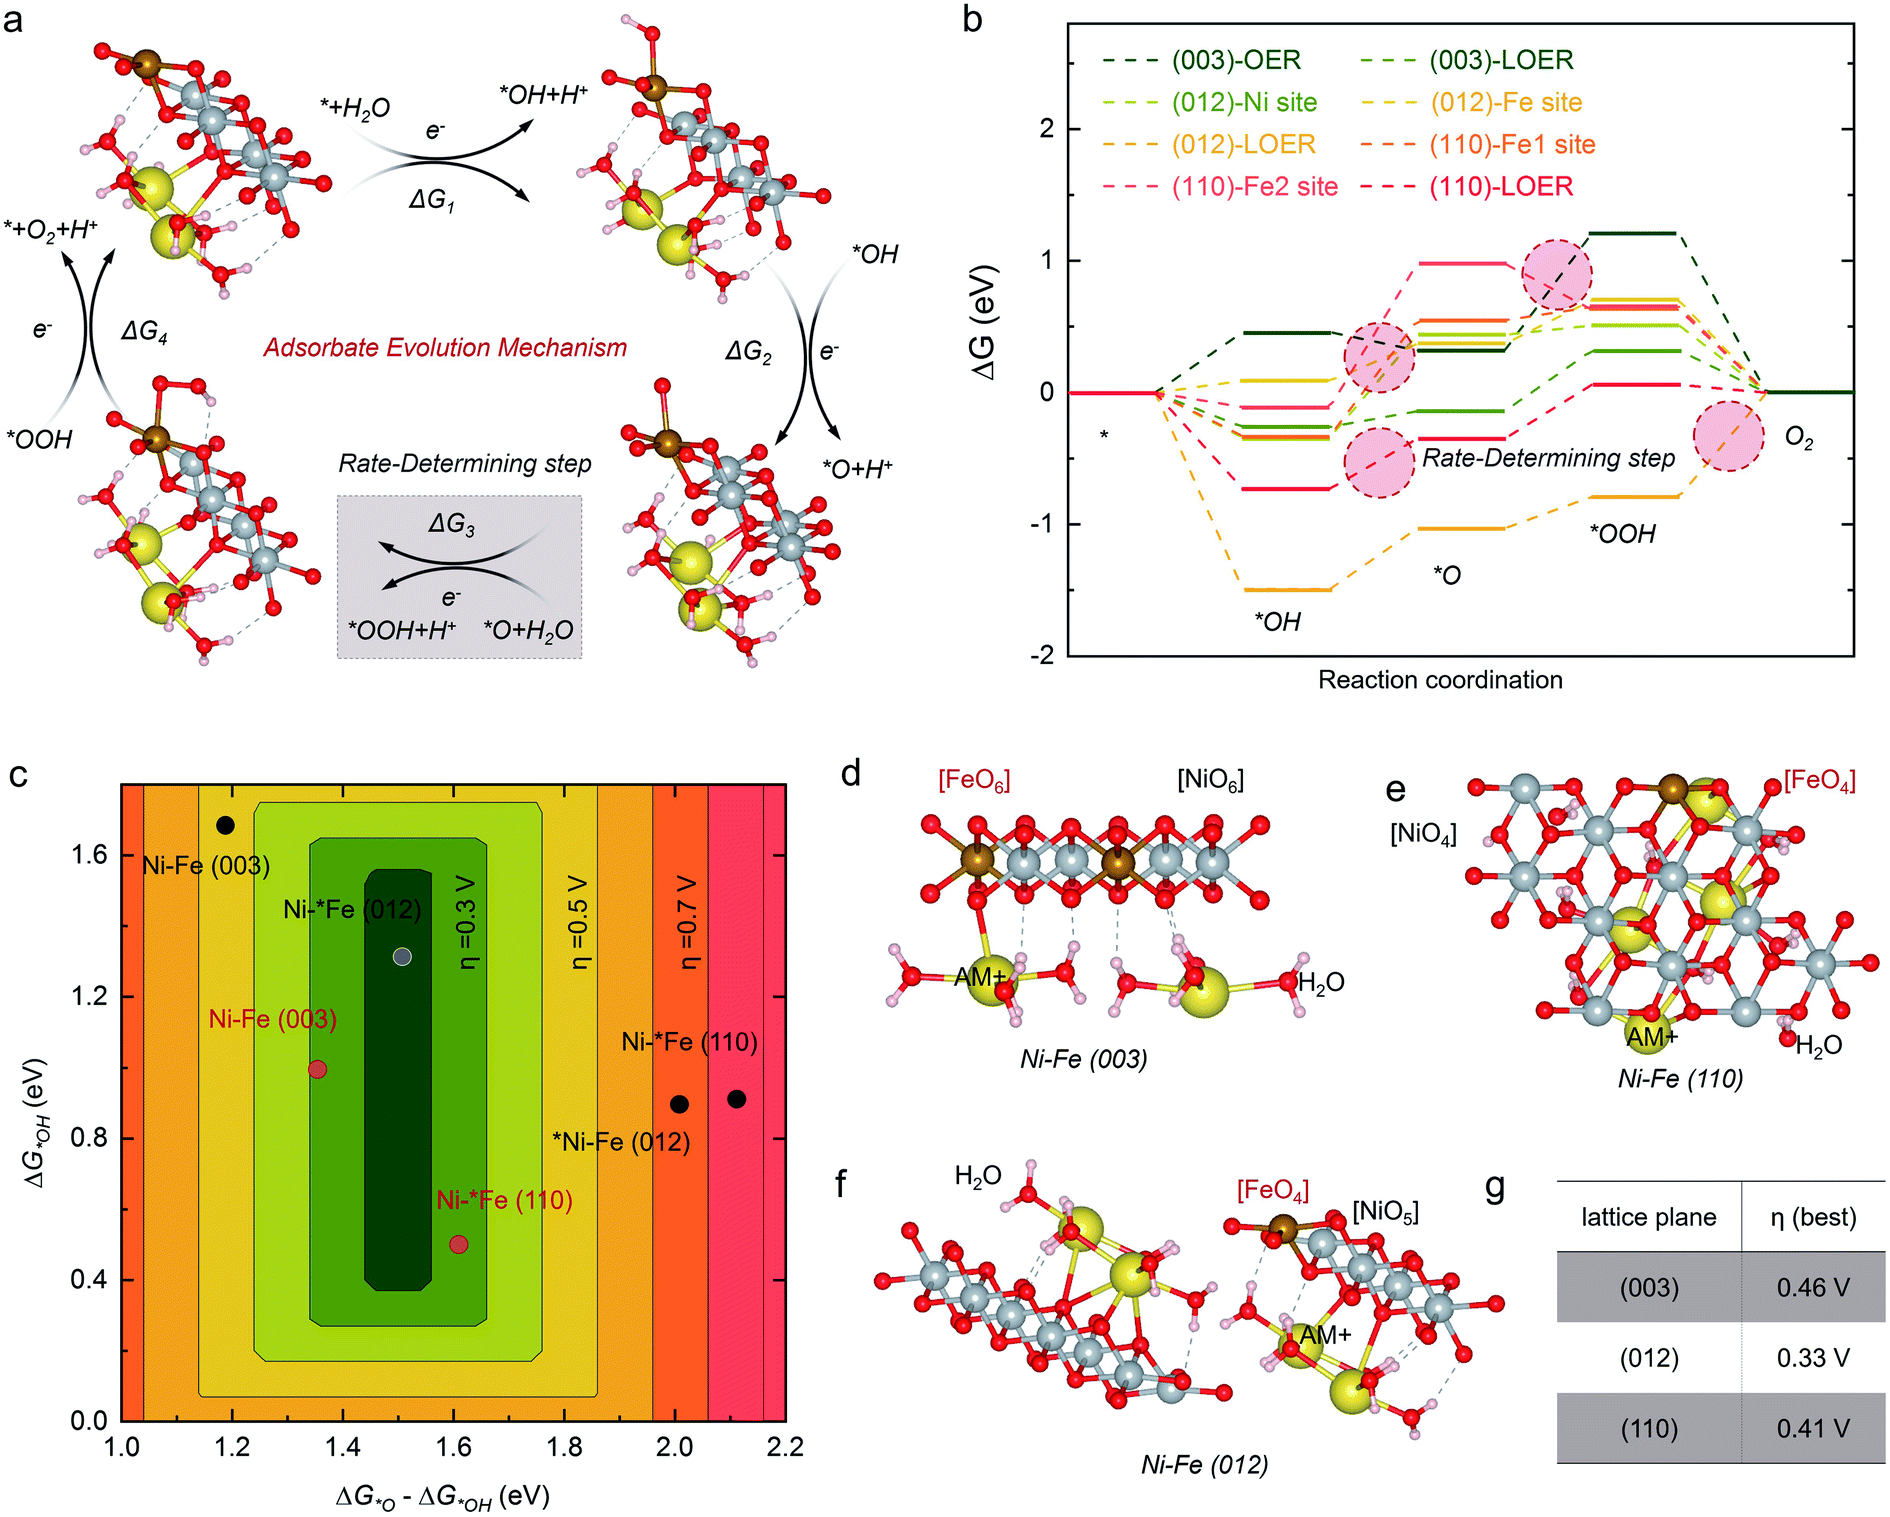 | ||
| Fig. 1 (a) Schematic illustration of the OER on the (012) plane in the AEM. (b) Simulated OER activity of the (003), (012) and (110) planes of NiFe LDHs. (c) Theoretical overpotential (η) volcano plot with O* and OH* binding energies as descriptors, using the scaling relationship between OH and OOH reported in previous work. (d–f) Visual representation of NiFe LDHs surfaces, including (003), (110) and (012) planes. (g) Theoretical onset overpotentials of different crystal planes. | ||
The traditional sheet-like NiFe LDHs, such as NiFe MSAs shown in Fig. 2a, only consist of a single sheet, and high levels of the (003) crystal plane are mainly exposed to the electrolyte. According to above DFT theoretical calculation results shown in Fig. 1, the (003) plane is the most stable and inert crystal plane, and this kind of NiFe MSAs will show poor catalytic activity for the OER. Although the (110) plane is the edge plane, its OER performance is still low under the AEM mechanism. The (012) plane is the most ideal crystal plane for the OER, and it is only distributed on the edge, as shown in Fig. 2b. Therefore, it is highly desirable to synthesize NiFe NSAs-MPs rich in exposed (012) edge plane, as shown in Fig. 2c.
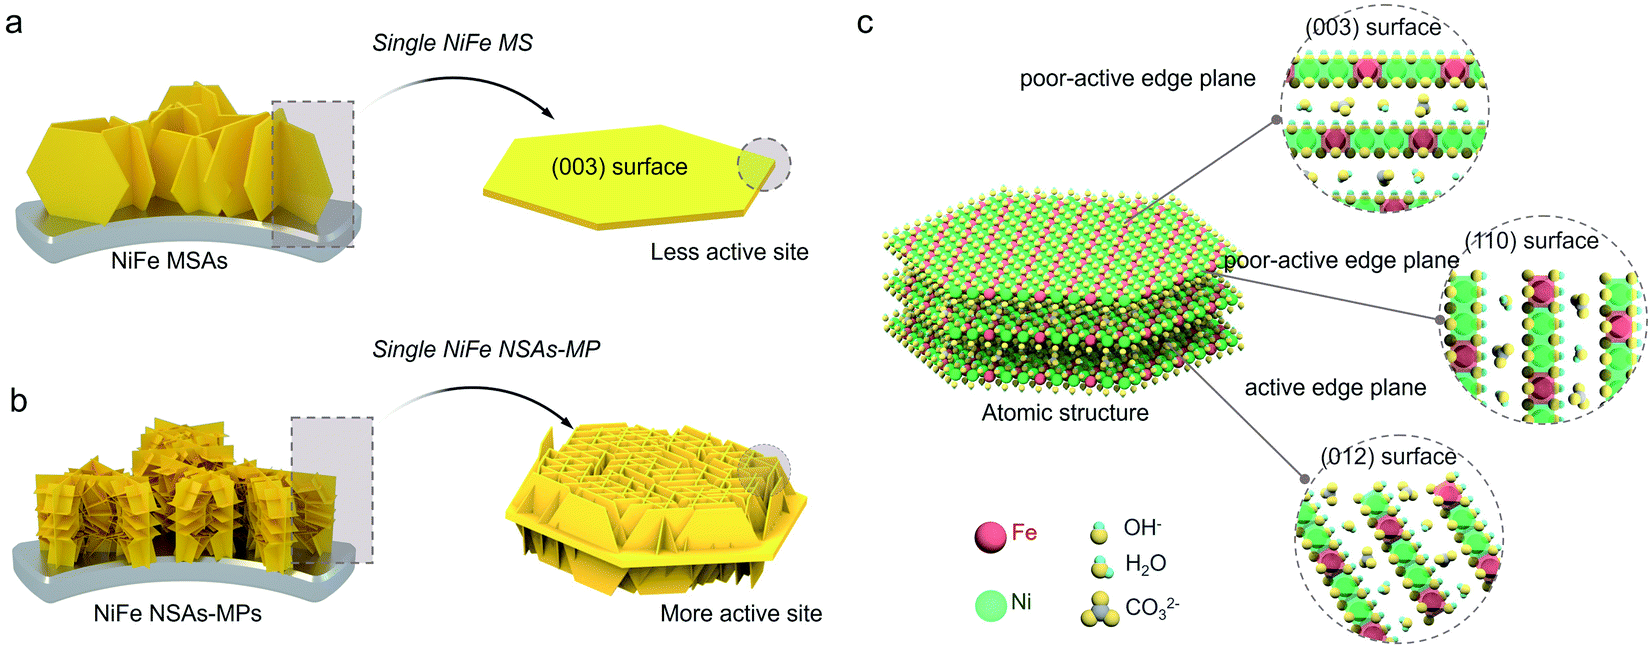 | ||
| Fig. 2 The microstructures of (a) NiFe MSAs and (b) NiFe NSAs-MPs. (c) The different planes in the crystalline structures of NiFe LDHs: the common (003) crystal plane and the (110) and (012) edge planes. | ||
The synthesis process and the detailed synthesis procedures for NiFe NSAs-MPs are shown in Fig. S3† and the Experimental section in the ESI.† SEM images of the NiFe NSAs-MPs are shown in Fig. 3a, which shows the half-hexagonal nanosheet arrays grown vertically on a hexagonal microplate with a diameter of ∼2 μm (SEM images of NiFe MSAs are shown in Fig. S7†).31,34,39 It is noticeable that the nanosheets primarily grow along three different directions, which are parallel to the edges of the hexagonal microplate, namely the [010], [100] and [110] directions. In order to determine the structural composition of the catalyst, Raman spectroscopy was performed to provide information about the phases and structures of the NiFe NSAs-MPs (Fig. 3b). The Raman bands at 301, 456 and 540 cm−1 can be assigned as the Eg(R), A1g and Eg(T) modes of the HO–Ni(Fe)–OH framework of the NiFe LDHs, respectively.40 A broad and weak band centered at 3509 cm−1 represents the mixture of Fe–OH and Ni–OH. It is noticeable that the band at 730 cm−1 can be assigned to CO32−, which is intercalated in the NiFe NSAs-MPs, but this band is not seen for the NiFe MSAs.41 Combining all of the X-ray photoelectron spectra (XPS) for the NiFe NSAs-MPs (Fig. S11 and S12†), the structural composition of the NiFe NSAs-MPs is confirmed as Ni1−xFex(CO3)x/2(OH)2·yH2O. To further determine the electronic structure of the NiFe NSAs-MPs and NiFe MSAs, the Fe 2p and Ni 2p XPS spectra for various samples were compared, and a negligible difference was found among the same elements for the NiFe NSAs-MPs and NiFe NSAs, as shown in Fig. 3c and d.
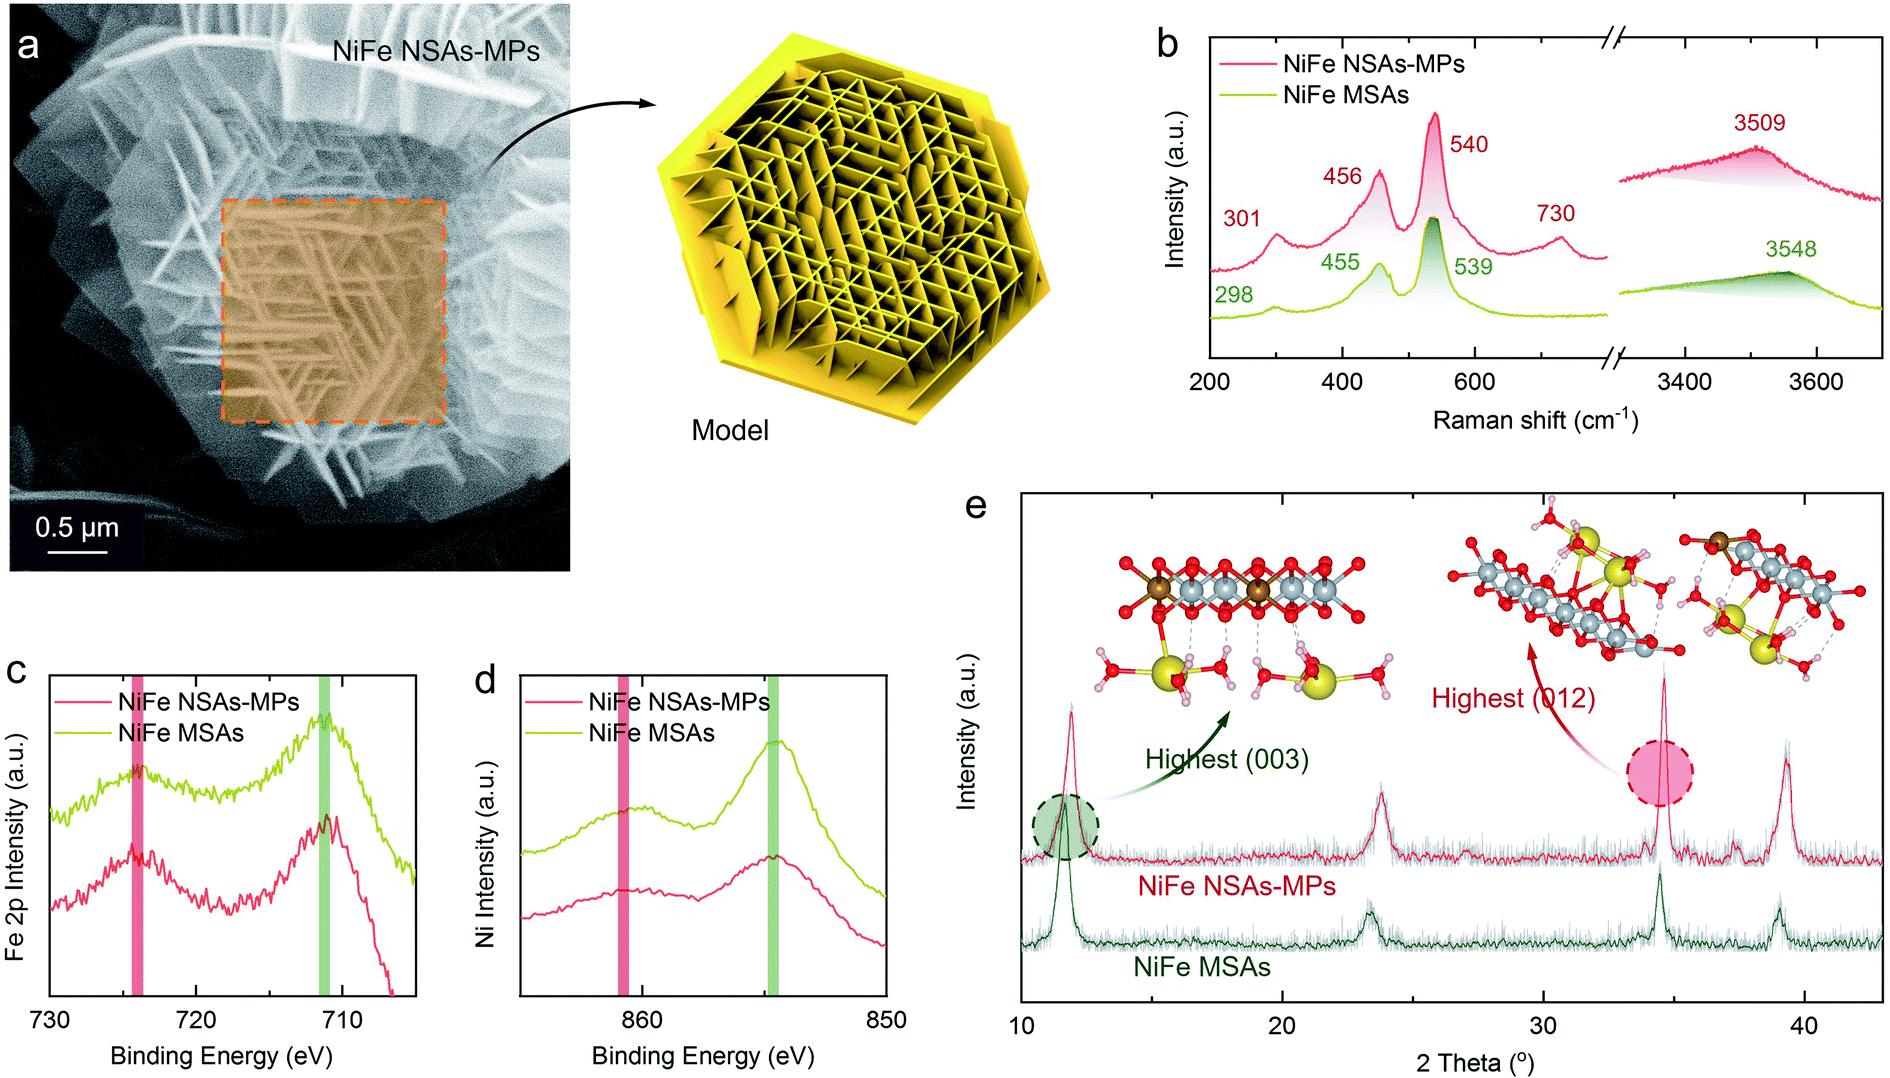 | ||
| Fig. 3 (a) SEM image of NiFe NSAs-MPs grown on NF and the corresponding schematic diagram (b) Raman spectra of NiFe NSAs-MPs and NiFe MSAs. (c and d) Comparisons of Fe 2p and Ni 2p spectra of NiFe NSAs-MPs and NiFe MSAs. (e) XRD patterns of NiFe NSAs-MPs and NiFe MSAs. | ||
X-ray diffraction (XRD) patterns were used to reveal the crystalline structure of the NiFe NSAs-MPs, as shown in Fig. 3e. For comparative study, the traditional (003)-dominated NiFe MSAs was also characterized. The NiFe NSAs-MPs and NiFe MSAs both present similar characteristic diffraction peaks to those of the NiFe LDHs (JCPDS no. 49-0188, Table S1†),42 suggesting that they have the same crystalline structure. For the NiFe MSAs, the strongest peak is attributed to the (003) plane, and the relative intensities of the (012), (015) and (018) planes to the (003) plane are only about 56.5%, 31.4%, and 17.1%, respectively (Table S2.2†). However, in the XRD pattern of the NiFe NSAs-MPs, the strongest peak is attributed to the (012) plane, and the relative intensities of the (012), (015) and (018) planes to that of the (003) plane are 129.4%, 70.9%, and 62.5%, respectively, indicating that the dominating exposed planes are the (012) edge plane rather than its traditionally mostly exposed (003) basal plane (see Table S2.1†). Therefore, the NiFe NSAs-MPs with predominant (012) edge plane were successfully fabricated.
Transmission electron microscopy (TEM) of the NiFe NSAs-MPs focused on the nanosheets and microplates separately to identify the crystallinity. The lattice fringe and the corresponding fast Fourier transform (FFT) pattern of the nanosheet show interplanar distances of 0.162, 0.193 and 0.229 nm, corresponding to the (015), (018) and  planes of the NiFe LDHs, respectively.42 This indicates that the (2
![[1 with combining macron]](https://www.rsc.org/images/entities/char_0031_0304.gif) 0) plane, which is perpendicular to the (015), (018) and
0) plane, which is perpendicular to the (015), (018) and  planes, is preferentially exposed at the border of the microplate, as shown in Fig. 4a, b and e. Similar results were obtained from the TEM image of the microplate, whose interplanar distances are 0.205 and 0.239 nm, corresponding to the (104) and (107) planes of the NiFe LDHs, respectively,42 revealing that the nanosheets preferentially expose the (20) plane (Fig. 4c, d and f). Within the hexagonal unit cell of the NiFe LDHs (P
![[3 with combining macron]](https://www.rsc.org/images/entities/char_0033_0304.gif) m1 space group, Z = 1), the (20) and (20) surfaces are equal to the (110) plane (Fig. 4g).29 Therefore, the nanosheets and microplates in the NiFe NSAs-MP all are NiFe LDHs, and they all prefer to expose the edge planes, such as (012) and (110), at the borders, which is consistent with the XRD results.
m1 space group, Z = 1), the (20) and (20) surfaces are equal to the (110) plane (Fig. 4g).29 Therefore, the nanosheets and microplates in the NiFe NSAs-MP all are NiFe LDHs, and they all prefer to expose the edge planes, such as (012) and (110), at the borders, which is consistent with the XRD results.
 | ||
| Fig. 4 (a) TEM image of a single NiFe NSAs-MPs. (b) HRTEM image of the NiFe LDHs microplate. (c) TEM image of the nanosheets grown on the microplate. (d) HRTEM image of the NiFe LDHs nanosheets grown on the microplate. Illustration of (e) the exposed planes of the border of the nanosheet and (f) the exposed planes of the border of the microplate. (g) The equivalence of the (20), (20) and (110) facets in the NiFe LDHs. | ||
The OER performance of the NiFe NSAs-MPs was studied in 1.0 M KOH solution. The linear sweep voltammetry (LSV) curves of the NiFe NSAs-MPs and the NiFe MSAs were measured after 100 cycles of cyclic voltammetry activation, as shown in Fig. 5a. The NiFe NSAs-MPs have an onset oxidation overpotential of only ∼170 mV and an overpotential of only ∼250 mV at 100 mA cm−2, which is much lower than that for the NiFe MSAs (∼300 mV). The current densities of the NiFe MSAs and bare NF are ∼20 and ∼1 mA cm−2 at 1.47 V, respectively, which are only ∼20% and ∼1% of that of the NiFe NSAs-MPs. The above results show the excellent catalytic activity of the NiFe NSAs-MPs for the OER. The Tafel slopes derived from the LSVs of the NiFe NSAs-MPs, NiFe NSAs, and bare NF are 34.5, 63.0, and 137.4 mV dec−1, respectively (Fig. 5d), so the Tafel slope of the NiFe NSAs-MPs is much smaller than those of the NiFe NSAs and bare NF, indicating that the reaction kinetics of the NiFe NSAs-MPs are much quicker than those of the NiFe NSAs and NF, and accordingly the rate-determining steps (RDS) of the three samples are different.43,44 To further confirm that the superior performance of the NiFe NSAs-MPs is derived from the exposed (012) edge plane but not surface area enhancement, the specific catalytic activities of various samples normalized to BET surface area, ECSA, and loading mass were measured, as shown in Fig. 5b, c and S17,† respectively.45,46 The ratio of the BET surface area of the NiFe NSAs-MPs to that of the NiFe NSAs is 1.14 (Fig. S18†), but it is surprising that the BET surface area-normalized OER catalytic activity of the NiFe NSAs-MPs is ∼5 times that of the NiFe MSAs (@100 mA mg cm−4) (Fig. 5b). The ratio of the ECSA of the NiFe NSAs-MPs to that of the NiFe NSAs is only ∼1.05 (Fig. S19 and S20†), but the ECSA-normalized OER catalytic activity of the NiFe NSAs-MPs is also ∼5 times of that of the NiFe NSAs (@40 mA mF−1) (Fig. 5c). In addition, the mass-normalized OER catalytic activity of the NiFe NSAs-MPs is also ∼5 times that of the NiFe MSAs (Fig. S17†). The above results demonstrate that the NiFe NSAs-MPs with rich (012) edge plane have superior OER performance compared with the NiFe MSAs.
 | ||
| Fig. 5 (a) LSVs of NiFe NSAs-MPs, NiFe MSAs and NF measured in 1.0 M KOH solution at 5 mV s−1. (b) LSVs of NiFe NSAs-MPs and NiFe MSAs in (a) normalized by BET. (c) LSVs of NiFe NSAs-MPs and NiFe MSAs in (a) normalized by ECSA. (d) Tafel plots of NiFe NSAs-MPs and NiFe MSAs. (e) Durability tests of NiFe NSAs-MPs and NiFe MSAs measured by chronopotentiometric at 100 mA cm−2 over 100 h. (f) LSVs of NiFe NSAs-MPs before and after 100 h chronopotential test at 100 mA cm−2. (g) Comparisons of the catalytic activities of various NiFe LDH-based electrocatalysts for the OER (The potential is fixed at 1.55 V. The peak ratios of the (012) and (003) crystal planes of other works are calculated by us.). | ||
Electrochemical impedance spectroscopy (EIS) was employed to study the OER kinetics of the NiFe NSAs-MPs. Under the same overpotential (from 200 to 400 mV), the NiFe NSAs-MPs always have lower polarization resistance (Rp) and lower charge relaxing resistance (Rr) than the NiFe MSAs, indicating faster OER kinetics on the NiFe NSAs-MPs than the NiFe MSAs (Fig. S24 and S25, Table S3†).44,47 The chronopotentiometric tests of the NiFe NSAs-MPs and the NiFe MSAs are shown in Fig. 5e, which shows that the NiFe NSAs-MPs exhibit excellent electrocatalytic stability and the overpotential of the NiFe NSAs-MPs at a high current density of 100 mA cm−2 only increases by ∼15 mV after 100 h of OER. On the contrary, the NiFe MSAs show poor electrocatalytic stability, as shown in Fig. 5e. The LSVs of the NiFe NSAs-MPs before and after the 100 h chronopotentiometric test at 100 mA cm−2 are shown in Fig. 5f, which also demonstrates the superior durability of the NiFe NSAs-MPs.
The results of previous work related to the catalytic performance and crystal planes of NiFe LDHs, including the current density, Tafel slope and XRD peak strength ratio of the (012) plane to the (003) plane, were compared with those of the NiFe NSAs-MPs as shown in Fig. 5g,48–58 which shows that the main crystal plane of the NiFe LDHs is (003), and the highest ratio of (012)/(003) planes is ∼0.89 (FeOOH/NiFe LDHs) reported in the literature.53 Compared with most NiFe LDHs, the NiFe NSAs-MPs show much better catalytic performance and smaller Tafel dynamics, as shown in Fig. 5g. Thus, the above results further indicate that a high ratio of (012) to (003) planes is crucial for the superior catalytic activity of the NiFe NSAs-MPs.
Based on the AEM mechanism, the high OER catalytic activity of the (012) plane of NiFe LDHs can be interpreted by the coordination of Fe atoms, as shown in Fig. 6a and b. As we all know, the Fe site in NiFe LDHs is the electroactive site for the OER.21 In oxyhydroxide, the local structure of Fe is very stable with 6 oxygen atoms to form an octahedron structure, respectively. For the (012) plane of the NiFe LDHs, as the Fe atom is 4-O coordinated, it can therefore facilitate the formation of O* with a low barrier (ΔG2 = 1.51 eV) (Fig. 1f), and the formation of HOO* is relatively easy (ΔG3 = 1.56 eV). However, although the Fe atom in the edge (110) plane of the NiFe LDHs is 4-O coordinated, owing to the different tetrahedron structure, in which the Fe atom in the (012) plane is corner-shared with NiO5 and the Fe atom in the (110) plane is edge-shared with NiO6, it makes the formation of O* that is 5-O coordinated with a high energy barrier become very difficult (ΔG2 = 2.11 eV) and is the rate-determining step of the OER on the (110) plane of the NiFe LDHs, leading to poor catalytic activity. As for the basal (003) plane, the Fe atom is fully coordinated (6-O) and the OH− is adsorbed on the active bridge site rather than the top site, and it is difficult to absorb a second OH− to produce HOO* from O* (Fig. S30†), leading to a large energy barrier for the OER (ΔG3 = 2.12 eV). Conversely, when calculating with the LOER, the lattice oxygen vacancies on the surface are beneficial for reducing the coordination of the Fe, making it easier for the catalyst to bind O species. Combining the two mechanisms of AEM and LOER, the overpotentials of the (003), (012) and (110) crystal planes are shown in Fig. 1e, which shows 0.46 V for the (003) plane, 0.33 V for the (012) plane, and 0.41 V for the (110) plane, indicating that the (012) edge plane has the highest electrocatalytic activity for the OER. To further investigate the origin of the OER activity, we calculated the density of states (DOS) of Fe on the surfaces of the (003), (012) and (110) crystal planes. It can be seen from Fig. 6a that the number of electron states of the (012) plane is lower than that of the (110) plane, and the highest energy state of the (003) plane is the t2g orbital. We further studied the electron distribution by Löwdin charge analysis and the results show that the filling degree of (012) is close to 1.0, which indicates that the catalyst bonds easily with the 2p orbital of oxygen.59 Because of the unique 4-coordinated Fe and 5-coordinated Ni, the (012) crystal plane of the NiFe LDHs shows excellent OER performance among the different crystal planes. Finally, we analyzed the surface oxygen states of the different crystal planes, as shown in Fig. 6c. The oxidation of lattice oxygen in the metal–oxygen becomes thermodynamically favorable when the O 2p states at the Fermi level lie above the redox energy of the O2/H2O couple.60 It can be seen that the (110) crystal plane is the most unstable crystal surface and is easily oxidized during the OER, while (003) and (012) both are very stable crystal planes of the NiFe LDHs and they are difficult to oxidize. Therefore, the above results further demonstrate that the (012) edge plane of NiFe LDHs is the ideal crystal surface for the OER, and the high catalytic activity and stability of the NiFe NSAs-MPs mainly come from the highly exposed (012) edge plane.
 | ||
| Fig. 6 (a) DOS projected on the Fe 3d state of NiFe LDHs as a function of the crystal plane in the most stable magnetic state. (b) The coordination of the (012) plane and the orbital state of a surface Fe atom (the electrons were calculated by Löwdin charge analysis). (c) The O 2p band center of different crystal planes (using the surface oxygen in NiO5). | ||
Conclusions
In summary, we have developed a surface engineering strategy to elevate the electrocatalytic activity of NiFe LDHs for the OER. The hierarchical NiFe NSAs-MPs can fully expose the highly active (012) edge plane, which exhibits superior OER catalytic performance compared with the (003) basal plane. The fabricated NiFe NSAs-MPs show a catalytic activity of 100 mA cm−2 at an overpotential of 250 mV, which is 5 times higher than that of the (003) plane-dominated NiFe MSAs at the same overpotential. In addition, the theoretical study demonstrated that the superior electrocatalytic performance of the (012) edge plane of NiFe NSAs-MPs is related to the oxygen coordination of the Fe site. This study provides a new strategy to elevate the electrocatalytic activity of LDHs for the OER.Experimental procedures
Reagents and pretreatments
All chemical reagents were analytical grade (AR, Guangzhou Chemical Reagent Factory) and were used directly without additional purification. A piece of Ni foam (NF, 2.9 × 4.0 cm2, bulk area density: 0.028 g cm−2) was pretreated before the reaction as follows: sequentially treated in ethanol, acetone, 3.0 M HCl and ultrapure water solution ultrasonically, and then washed with ultrapure water.Preparation of the hydrated Ni foam (NF)
The pretreated bare NFs (2.9 × 4.0 × 0.1 cm3 per piece) were put into 80 mL of ultrapure water in a 100 mL beaker (with a 5.0 cm diameter). Then the beaker was put in a cool cupboard away from sunlight and any chemical gas at 25–28 °C for 30 days. Finally, a thin layer of grey film will form on the surface of the NF, and accordingly, the hydrated NF was obtained. The hydrated NF was washed with ultrapure water before use.Synthesis of NiFe NSAs-MPs
1.5 mmol of Fe(NO3)3·9H2O (0.606 mg) was firstly dissolved in 10 mL of ultrapure water, forming a light orange solution. Then 6 mmol of NH4F (0.222 g) was added and the orange solution changed to colorless. Finally, 3.75 mmol of urea (0.225 g) and 20 mL of ultrapure water were added into the above solution, followed by stirring for 5 min. The hydrated NF was submerged in a 50 mL Teflon-lined stainless autoclave containing 30 mL of the above as-prepared colorless solution. The autoclave was sealed and maintained at 120 °C for 5 h. The resulting sample was dark green and was washed with ultrapure water, then finally cleaned ultrasonically in ultrapure water for 5 min. After cleaning, the NiFe NSAs-MPs were heated at 70 °C for 1 h and the sample color changed from dark green to yellow. Finally, in order to exchange the residue intercalated F− and NO3− anions in the sample, the NiFe NSAs-MPs/NF was submerged into 1.0 M KOH at 70 °C for 1 h, and the sample was further washed with ultrapure water.Synthesis of NiFe MSAs
1.0 mmol of Ni(NO3)2·6H2O (0.291 g) and 0.5 mmol of Fe(NO3)3·9H2O (0.202 mg) were firstly dissolved in 10 mL of ultrapure water, forming a blue-green solution. Then 6 mmol of NH4F (0.222 g) was added into the above solution, and the solution color changed from blue-green to light blue. Finally, 3.75 mmol of urea (0.225 g) and 20 mL of ultrapure water were added, followed by stirring for 5 min. The hydrated NF was submerged into a 50 mL Teflon-lined stainless autoclave containing 30 mL of the above as-prepared light blue solution. The autoclave was sealed and maintained at 120 °C for 5 h. The obtained sample was yellow, and it was washed with ultrapure water and then cleaned ultrasonically in ultrapure water for 5 min. After cleaning, the NiFe NSAs were heated at 70 °C for 1 h. To exchange the residue intercalated F− and NO3− anions, the NiFe MSAs were submerged into 1.0 M KOH at 70 °C for 1 h, and the sample was then further washed with ultrapure water.Structural characterization
The surface morphologies of the samples were characterized by thermal field emission scanning electron microscopy (TFE-SEM, Quanta 400F) and transmission electron microscopy (TEM, FEI Tecnai G2 Spirit operating at 120 kV and FEI Tecnai G2 F30 operating at 300 kV). The chemical state of the materials was determined by X-ray photoelectron spectroscopy (XPS, ESCALAB 250) using an ESCALAB 250 X-ray photoelectron spectrometer. All the peaks were corrected by the C 1s line at 284.8 eV as standard, and curve fitting and background subtraction were accomplished. The crystallinity of the samples was characterized by powder X-ray diffraction (XRD, SmartLab) on a Philips X'Pert Pro Super diffractometer using Cu Kα (λ = 1.54178 Å) as the excitation source. The XRD patterns were recorded using background correction. The phase and bond vibration details of the catalysts were also characterized by laser micro-Raman spectrometer (Raman, Renishaw) with the excited wavelength at 514.5 nm. Each sample spectrum was collected in transmission mode for comparison and monochromatic energy calibration. The chemical component analysis was determined by energy dispersive spectrometer (EDS).Electrochemical characterizations
All the electrochemical measurements were made in a three-electrode system connected to an electrochemical station (CHI 760D). For the OER measurement experiments, the prepared sample was utilized as the working electrode (1.0 cm2 geometric area), with a graphite rod and a saturated calomel electrode (SCE) reference electrode served as the counter and reference electrodes, respectively. 1.0 M KOH electrolyte was prepared with ultrapure water (18.2 MΩ cm−1). All potentials used in this study were calibrated to the reversible hydrogen electrode (RHE) using the following equation: ERHE = ESCE + 0.2412 + 0.059pH. The cyclic voltammograms (CVs) were recorded in 1.0 M KOH at a scan rate of 10 mV s−1. To fully activate and stabilize the electrocatalysts, 100 CVs were conducted for every sample. Linear sweep voltammograms (LSVs) were recorded in 1.0 M KOH at a scan rate of 5 mV s−1 after 100 CVs. The IR compensation was done using the positive feedback method with a compensation level of 100% (owing to the low value of Ru). The Ru (range from 1.5 to 3.0 Ω) was measured by the electrochemical impedance spectra fitted by the inset circuit at open circuit potential (around 0.32 V vs. SCE) in a solution of 1.0 M KOH, which was subsequently used to adjust the raw LSVs to the ideal LSVs. The Tafel slopes were calculated using the polarization curves of the OER at 5.0 mV s−1. Electrochemical impedance spectroscopy (EIS) was measured at a sequential series of overpotentials, specifically 200, 250, 300, 350 and 400 mV for comparison. A sinusoidal voltage with an amplitude of 5 mV and scanning frequency values ranging from 100 kHz to 0.1 Hz were applied. The EIS response was fitted by the Armstrong–Henderson model, which is the best description for hydroxide films. Five geometric values of the electronic elements extracted from the electrical equivalent circuit model were listed. The long-term stability tests were performed using chronopotential measurements at 100 mA cm−2 and were recorded as potential–time (E–T) plots. After the 100 hour E–T test, a new LSV was performed for comparison with the LSV before the E–T test. The electrochemical active surface area (ECSA) of each material was measured by cyclic voltammetry in a 1.0 M KOH solution by the principle of estimating the electrochemical double-layer capacitance at non-faradaic potentials. The CVs were conducted from low sweep speed to high sweep speed, and the working electrode was held at each potential for 10 s before the next sweep.Computational methodology
Spin-polarized density functional theory (DFT) calculations were performed in the plane wave and ultrasoft pseudopotential (USPP) as implemented in Quantum ESPRESSO.61 The adsorption energies were calculated using the Grimme-D3 vdw correction with the Perdew–Burke–Ernzerhof (PBE) exchange functional correction.62 The effective U–J terms, from linear response theory, were 3.5 and 6.6 for Fe and Ni, respectively.33 The kinetic energy cutoffs of 25 Ry and 225 Ry were chosen for the wave functions and augmented charge densities, respectively. All the atomic structures for the models were fully relaxed with self-consistency criteria of 10−5 Ry and all atomic coordinates were converged to within 10−3 Ry bohr−1 for the maximal components of the forces. The occupancy of the one-electron states was calculated using an electronic temperature of kBT = 0.01 Ry for surfaces and 10−3 Ry for molecules in a vacuum. All energies were extrapolated to T = 0 K. A vacuum slab of 10 Å was used for surface isolation to prevent interaction between two surfaces (15 Å vacuum slab only change less than 1‰ total energy). All the atoms were relaxed to simulate the bulk structure and alkali metal ion (Na+) and water molecules were fixed in the slab system. Reciprocal space was sampled by the Γ-point-centered Monkhorst–Pack scheme with (lattice parameters × k) ∼30 to compare the energy differences of the crystal faces. The DOS was calculated using a plane wave kinetic energy cutoff of 25 Ry and Γ-point-centered Monkhorst–Pack k-point meshes of (lattice parameters × k) ∼50.Conflicts of interest
There are no conflicts to declare.Author contributions
G.-R. L., J.-W. Z. and Z.-X. S. contributed to overall design and supervision of this project.; J.-W. Z. contributed to theoretical studies; Z.-X. S. contributed to characterizations and materials synthesis; All authors contributed to the manuscript preparation.Acknowledgements
Financial support for this work was provided by the National Basic Research Program of China (2016YFA0202603), NSFC (21821003, 91645104), Guangdong Science and Technology Innovation Leading Talent Fund (2016TX03N187), and the Fundamental Research Fund for the Central Universities.References
- (a) X. Wang, L. Yu, B. Y. Guan, S. Song and X. W. Lou, Adv. Mater., 2018, 30, 1801211 CrossRef; (b) H. Xu, Z. Shi, Y. Tong and G. Li, Adv. Mater., 2018, 30, 1705442 CrossRef; (c) A. Wang, H. Xu and G. Li, ACS Energy Lett., 2016, 1, 445 CrossRef CAS.
- (a) W. T. Hong, M. Risch, K. A. Stoerzinger, A. Grimaud, J. Suntivich and Y. Shao-Horn, Energy Environ. Sci., 2015, 8, 1404–1427 RSC; (b) J. Zhao, C. Li, Z. Shi, J. Guan and G. Li, Research, 2020, 6961578 Search PubMed; (c) J. Guan, C. Li, J. Zhao, Y. Yang, W. Zhou, Y. Wang and G. Li, Appl. Catal., B, 2020, 269, 118600 CrossRef CAS.
- (a) Y. Zhu, H. A. Tahini, Z. Hu, Z. G. Chen, W. Zhou, A. C. Komarek, Q. Lin, H. J. Lin, C. T. Chen and Y. Zhong, Adv. Mater., 2020, 32, 1905025 CrossRef CAS; (b) L. Gu, J. Chen, T. Zhou, X. Lu and G. Li, Nanoscale, 2020, 12, 11201 RSC.
- (a) N.-T. Suen, S.-F. Hung, Q. Quan, N. Zhang, Y.-J. Xu and H. M. Chen, Chem. Soc. Rev., 2017, 46, 337–365 RSC; (b) W. Zhou, J. Zhao, J. Guan, M. Wu and G. Li, ACS Omega, 2019, 4, 20244 CrossRef CAS; (c) W. Zhou, X. Lu, J. Chen, T. Zhou, P. Liao, M. Wu and G. Li, ACS Appl. Mater. Interfaces, 2018, 10, 38906 CrossRef CAS.
- (a) B. M. Hunter, H. B. Gray and A. M. Muller, Chem. Rev., 2016, 116, 14120 CrossRef CAS; (b) J. Wu, C. He, G. Li and J. Zhang, J. Mater. Chem. A, 2018, 6, 19176 RSC; (c) A. Wang, Y. Dong, M. Li, C. Liang and G. Li, ACS Appl. Mater. Interfaces, 2017, 9, 34954 CrossRef CAS.
- (a) Z. P. Wu, X. F. Lu, S. Q. Zang and X. W. D. Lou, Adv. Funct. Mater., 2020, 30, 1910274 CrossRef CAS; (b) Q. Ren, J. Wu, J. Zhao, C. Li, L. Gong, D. Zhou and G. Li, Chem. Commun., 2020, 56, 7722 RSC.
- L. Yu, H. Zhou, J. Sun, I. K. Mishra, D. Luo, F. Yu, Y. Yu, S. Chen and Z. Ren, J. Mater. Chem. A, 2018, 6, 13619 RSC.
- Q. Zhang, T. Li, J. Liang, N. Wang, X. Kong, J. Wang, H. Qian, Y. Zhou, F. Liu and C. Wei, J. Mater. Chem. A, 2018, 6, 7509–7516 RSC.
- E. Fabbri and T. J. Schmidt, ACS Catal., 2018, 10, 9765–9774 CrossRef.
- Y. P. Zhu, C. Guo, Y. Zheng and S.-Z. Qiao, Acc. Chem. Res., 2017, 50, 915–923 CrossRef CAS.
- L. Han, S. Dong and E. Wang, Adv. Mater., 2016, 28, 9266–9291 CrossRef CAS.
- R. Wu, B. Xiao, Q. Gao, Y. R. Zheng, X. S. Zheng, J. F. Zhu, M. R. Gao and S. H. Yu, Angew. Chem., Int. Ed., 2018, 130, 15671–15675 CrossRef.
- D. Chen, C. Chen, Z. M. Baiyee, Z. Shao and F. Ciucci, Chem. Rev., 2015, 115, 9869–9921 CrossRef CAS.
- F. Song, L. Bai, A. Moysiadou, S. Lee, C. Hu, L. Liardet and X. Hu, J. Am. Chem. Soc., 2018, 140, 7748–7759 CrossRef CAS.
- L. C. Seitz, C. F. Dickens, K. Nishio, Y. Hikita, J. Montoya, A. Doyle, C. Kirk, A. Vojvodic, H. Y. Hwang and J. K. Norskov, Science, 2016, 353, 1011–1014 CrossRef CAS.
- A. Grimaud, A. Demortière, M. Saubanère, W. Dachraoui, M. Duchamp, M.-L. Doublet and J.-M. Tarascon, Nat. Energy, 2016, 2, 1–10 Search PubMed.
- Y. Lee, J. Suntivich, K. J. May, E. E. Perry and Y. Shao-Horn, J. Phys. Chem. Lett., 2012, 3, 399–404 CrossRef CAS.
- D. Y. Chung, P. P. Lopes, P. F. B. D. Martins, H. He, T. Kawaguchi, P. Zapol, H. You, D. Tripkovic, D. Strmcnik and Y. Zhu, Nat. Energy, 2020, 5, 222–230 CrossRef.
- C. C. McCrory, S. Jung, J. C. Peters and T. F. Jaramillo, J. Am. Chem. Soc., 2013, 135, 16977–16987 CrossRef CAS.
- F. Dionigi and P. Strasser, Adv. Energy Mater., 2016, 6, 1600621 CrossRef.
- M. Gong and H. Dai, Nano Res., 2015, 8, 23–39 CrossRef CAS.
- L. Trotochaud, S. L. Young, J. K. Ranney and S. W. Boettcher, J. Am. Chem. Soc., 2014, 136, 6744–6753 CrossRef CAS.
- T. F. Jaramillo, K. P. Jørgensen, J. Bonde, J. H. Nielsen, S. Horch and I. Chorkendorff, Science, 2007, 317, 100–102 CrossRef CAS.
- Z. Lu, G. Chen, Y. Li, H. Wang, J. Xie, L. Liao, C. Liu, Y. Liu, T. Wu and Y. Li, J. Am. Chem. Soc., 2017, 139, 6270–6276 CrossRef CAS.
- H. Yin and Z. Tang, Chem. Soc. Rev., 2016, 45, 4873–4891 RSC.
- Y.-F. Li and A. Selloni, ACS Catal., 2014, 4, 1148–1153 CrossRef CAS.
- M. Bajdich, M. García-Mota, A. Vojvodic, J. K. Nørskov and A. T. Bell, J. Am. Chem. Soc., 2013, 135, 13521 CrossRef CAS.
- D. Friebel, M. W. Louie, M. Bajdich, K. E. Sanwald, Y. Cai, A. M. Wise, M.-J. Cheng, D. Sokaras, T.-C. Weng and R. Alonso-Mori, Tech. Ing., Sci. Fondam.: Phys., Chim., 2015, 137, 1305–1313 CrossRef CAS.
- D. G. Evans and R. C. Slade, Structural aspects of layered double hydroxides, Springer, 2006, pp. 1–87 Search PubMed.
- R. Ma and T. Sasaki, Acc. Chem. Res., 2015, 48, 136–143 CrossRef CAS.
- G. Fan, F. Li, D. G. Evans and X. Duan, Chem. Soc. Rev., 2014, 43, 7040–7066 RSC.
- (a) A. Wang, C. Liang, X. Lu, Y. Tong and G. Li, J. Mater. Chem. A, 2016, 4, 1923 RSC; (b) S. Ye, J. Feng, A. Wang, H. Xu and G. Li, J. Mater. Chem. A, 2015, 3, 23201 RSC; (c) X. Lu, A. Wang, H. Xu, X. He, Y. Tong and G. Li, J. Mater. Chem. A, 2015, 3, 16560 RSC; (d) H. Xu, L.-X. Ding, J.-X. Feng and G.-R. Li, Chem. Sci., 2015, 6, 6991 RSC.
- (a) X. Lu, G. Li and Y. Tong, Sci. China: Technol. Sci., 2015, 58, 1799 CrossRef CAS; (b) L. Ding, C. Liang, H. Xu, A. Wang, Y. Tong and G. Li, Adv. Mater. Interfaces, 2014, 1, 1400005 CrossRef; (c) H. Xu, L. Ding, C. Liang, Y. Tong and G. Li, NPG Asia Mater., 2013, 5, e69 CrossRef CAS.
- (a) G. Li, C. Su, and and Y. Tong, J. Phys. Chem. C, 2008, 112, 2927 CrossRef CAS; (b) G. Li, C. Dawa, Q. Bu, Z. Ke, H. Hong, F. Zhen, C. Yao, G. Liu and Y. Tong, J. Phys. Chem. C, 2007, 111, 1919 CrossRef CAS; (c) G. Li, C. Dawa, Q. Bu, F. Zheng, C. Yao, P. Liu and Y. Tong, Electrochem. Commun., 2007, 9, 863 CrossRef CAS; (d) G. Li, D. Qu, C. Yao, F. Zheng, Q. Bu, C. Dawa and Y. Tong, J. Phys. Chem. C, 2007, 111, 6678 CrossRef CAS.
- X. Rong, J. Parolin and A. M. Kolpak, ACS Catal., 2016, 6, 1153–1158 CrossRef CAS.
- M. Cococcioni and S. De Gironcoli, Phys. Rev. B: Condens. Matter Mater. Phys., 2005, 71, 035105 CrossRef.
- J. K. Nørskov, J. Rossmeisl, A. Logadottir, L. Lindqvist, J. R. Kitchin, T. Bligaard and H. Jonsson, J. Phys. Chem. B, 2004, 108, 17886–17892 CrossRef.
- J. Rossmeisl, A. Logadottir and J. K. Nørskov, Chem. Phys., 2005, 319, 178–184 CrossRef CAS.
- S. J. Mills, A. G. Christy, J.-M. Génin, T. Kameda and F. Colombo, Mineral. Mag., 2012, 76, 1289–1336 CrossRef CAS.
- J. Bantignies, S. Deabate, A. Righi, S. Rols, P. Hermet, J. Sauvajol and F. Henn, J. Phys. Chem. C, 2008, 112, 2193–2201 CrossRef CAS.
- R. L. Frost, M. L. Weier and J. T. Kloprogge, J. Raman Spectrosc., 2003, 34, 760–768 CrossRef CAS.
- E. Uzunova, D. Klissurski and S. Kassabov, J. Mater. Chem., 1994, 4, 153–159 RSC.
- Y.-H. Fang and Z.-P. Liu, J. Am. Chem. Soc., 2010, 132, 18214–18222 CrossRef CAS.
- R. L. Doyle and M. E. Lyons, Phys. Chem. Chem. Phys., 2013, 15, 5224–5237 RSC.
- C. G. Morales-Guio, L. Liardet and X. Hu, J. Am. Chem. Soc., 2016, 138, 8946–8957 CrossRef CAS.
- P. Chakthranont, J. Kibsgaard, A. Gallo, J. Park, M. Mitani, D. Sokaras, T. Kroll, R. Sinclair, M. B. Mogensen and T. F. Jaramillo, ACS Catal., 2017, 7, 5399–5409 CrossRef CAS.
- J. R. Swierk, S. Klaus, L. Trotochaud, A. T. Bell and T. D. Tilley, J. Phys. Chem. C, 2015, 119, 19022–19029 CrossRef CAS.
- M. Gong, Y. Li, H. Wang, Y. Liang, J. Z. Wu, J. Zhou, J. Wang, T. Regier, F. Wei and H. Dai, J. Am. Chem. Soc., 2013, 135, 8452–8455 CrossRef CAS.
- W. Ma, R. Ma, C. Wang, J. Liang, X. Liu, K. Zhou and T. Sasaki, ACS Nano, 2015, 9, 1977–1984 CrossRef CAS.
- F. Song and X. Hu, Nat. Commun., 2014, 5, 1–9 Search PubMed.
- Z. Li, M. Shao, H. An, Z. Wang, S. Xu, M. Wei, D. G. Evans and X. Duan, Chem. Sci., 2015, 6, 6624–6631 RSC.
- C. Zhang, M. Shao, L. Zhou, Z. Li, K. Xiao and M. Wei, ACS Appl. Mater. Interfaces, 2016, 8, 33697–33703 CrossRef CAS.
- J. Chi, H. Yu, B. Qin, L. Fu, J. Jia, B. Yi and Z. Shao, ACS Appl. Mater. Interfaces, 2017, 9, 464–471 CrossRef CAS.
- L. Yu, J. F. Yang, B. Y. Guan, Y. Lu and X. W. Lou, Angew. Chem., Int. Ed., 2018, 57, 172–176 CrossRef CAS.
- L. Yu, H. Zhou, J. Sun, F. Qin, F. Yu, J. Bao, Y. Yu, S. Chen and Z. Ren, Energy Environ. Sci., 2017, 10, 1820–1827 RSC.
- J. Zhang, J. Liu, L. Xi, Y. Yu, N. Chen, S. Sun, W. Wang, K. M. Lange and B. Zhang, J. Am. Chem. Soc., 2018, 140, 3876–3879 CrossRef CAS.
- P. Li, X. Duan, Y. Kuang, Y. Li, G. Zhang, W. Liu and X. Sun, Adv. Energy Mater., 2018, 8, 1703341 CrossRef.
- Q. Xie, Z. Cai, P. Li, D. Zhou, Y. Bi, X. Xiong, E. Hu, Y. Li, Y. Kuang and X. Sun, Nano Res., 2018, 11, 4524–4534 CrossRef CAS.
- J. Hwang, R. R. Rao, L. Giordano, Y. Katayama, Y. Yu and Y. Shao-Horn, Science, 2017, 358, 751–756 CrossRef CAS.
- A. Grimaud, O. Diaz-Morales, B. Han, W. T. Hong, Y.-L. Lee, L. Giordano, K. A. Stoerzinger, M. T. Koper and Y. Shao-Horn, Nat. Chem., 2017, 9, 457 CrossRef CAS.
- P. Giannozzi, S. Baroni, N. Bonini, M. Calandra, R. Car, C. Cavazzoni, D. Ceresoli, G. L. Chiarotti, M. Cococcioni and I. Dabo, J. Phys.: Condens. Matter, 2009, 21, 395502 CrossRef.
- J. P. Perdew, K. Burke and M. Ernzerhof, Phys. Rev. Lett., 1996, 77, 3865 CrossRef CAS.
Footnotes |
| † Electronic supplementary information (ESI) available. See DOI: 10.1039/d0sc04196c |
| ‡ These authors contributed equally to this work. |
| This journal is © The Royal Society of Chemistry 2021 |