 Open Access Article
A dual-fluorophore sensor approach for ratiometric fluorescence imaging of potassium in living cells†
Zeming
Wang
a,
Tyler C.
Detomasi
 a and
Christopher J.
Chang
 *abc
*abc
aDepartment of Chemistry, University of California, Berkeley, CA 94720, USA. E-mail: chrischang@berkeley.edu
bDepartment of Molecular and Cell Biology, University of California, Berkeley, CA 94720, USA
cHelen Wills Neuroscience Institute, University of California, Berkeley, CA 94720, USA
First published on 15th December 2020
Abstract
Potassium is the most abundant intracellular metal in the body, playing vital roles in regulating intracellular fluid volume, nutrient transport, and cell-to-cell communication through nerve and muscle contraction. On the other hand, aberrant alterations in K+ homeostasis contribute to a diverse array of diseases spanning cardiovascular and neurological disorders to diabetes to kidney disease to cancer. There is an unmet need for studies of K+ physiology and pathology owing to the large differences in intracellular versus extracellular K+ concentrations ([K+]intra = 150 mM, [K+]extra = 3–5 mM). With a relative dearth of methods to reliably measure dynamic changes in intracellular K+ in biological specimens that meet the dual challenges of low affinity and high selectivity for K+, particularly over Na+, currently available fluorescent K+ sensors are largely optimized with high-affinity receptors that are more amenable for extracellular K+ detection. We report the design, synthesis, and biological evaluation of Ratiometric Potassium Sensor 1 (RPS-1), a dual-fluorophore sensor that enables ratiometric fluorescence imaging of intracellular potassium in living systems. RPS-1 links a potassium-responsive fluorescent sensor fragment (PS525) with a low-affinity, high-selectivity crown ether receptor for K+ to a potassium-insensitive reference fluorophore (Coumarin 343) as an internal calibration standard through ester bonds. Upon intracellular delivery, esterase-directed cleavage splits these two dyes into separate fragments to enable ratiometric detection of K+. RPS-1 responds to K+ in aqueous buffer with high selectivity over competing metal ions and is sensitive to potassium ions at steady-state intracellular levels and can respond to decreases or increases from that basal set point. Moreover, RPS-1 was applied for comparative screening of K+ pools across a panel of different cancer cell lines, revealing elevations in basal intracellular K+ in metastatic breast cancer cell lines vs. normal breast cells. This work provides a unique chemical tool for the study of intracellular potassium dynamics and a starting point for the design of other ratiometric fluorescent sensors based on two-fluorophore approaches that do not rely on FRET or related energy transfer designs.
Introduction
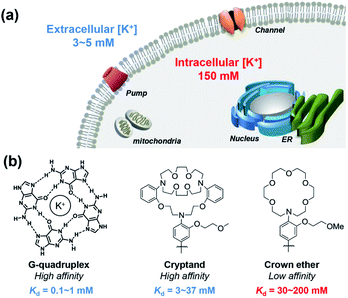
All cells in all living organisms require potassium,1,2 where the abundant K+ cation regulates cellular osmolality, nutrient status, and membrane potential,3–5 contributing to physiological processes including neuron firing, muscle contraction,6,7 and hormone regulation.8–10 Cellular potassium homeostasis is maintained by an intricate network of membrane K+ channels and pumps, giving physiological K+ concentrations ranging from approximately 3–5 mM extracellularly to 150 mM intracellularly.11 Aberrant elevations or depletions of intracellular K+ from these tightly regulated set points, caused largely by malfunction of K+ channels or pumps, can contribute to serious diseases that range from neurodegeneration and epilepsy to kidney failure to diabetes to arrhythmia and heart disorders to cancer.12,13 In one example, a growing body of literature connects K+ channels to cancer through cell motility, which is critical to tumor growth and metastasis.12–21 However, most of these studies have focused on correlations of aberrant expression of K+ channels in various types of cancer and suggest a relationship between altered intracellular K+ level and cell apoptosis,16,22,23 with limited information on direct measurements of K+ pools themselves.These foregoing considerations motivate the development of chemical tools that can enable detection of K+ pools in living biological specimens with higher spatial and temporal resolution compared to conventional methods of detection such as K+-selective microelectrodes and patch clamp techniques.24,25 Notably, recent years have also seen advances in the development of genetically encoded potassium probes and nanosensors.26–31 In this context, small-molecule fluorescent sensors offer an attractive approach to meet this goal, as they are valued as non-invasive, high signal-to-noise reagents that can accurately map a variety of biological analytes, particularly metal ions.32–37 Despite notable advances in the development of small-molecule fluorescent sensors for potassium,38–45 imaging intracellular K+ in biological samples with high selectivity over Na+ remains a significant and insufficiently solved challenge, owing in large part to high resting K+ concentrations within the cell (150 mM), which requires a low-affinity molecular recognition element that still achieves high K+ selectivity. Pioneering work by Tsien and Minta on the first potassium probe, potassium benzofuran isophthalic acid (PBFI), offered an important early solution to this problem, but PBFI is limited by slow cellular uptake kinetics due to its high molecular weight and need for UV excitation, which can trigger background autofluorescence and sample photodamage.46 Likewise, He and colleagues developed a high-affinity fluorescent K+ sensor based on a triaza-cryptand potassium receptor,38 and Verkman and other research teams have successfully developed several useful sensors for monitoring extracellular K+, including stimulated K+ release, based on this ionophore.47–50 Specifically, the Verkman laboratory has demonstrated visualizing K+ waves in brain cortex using a K+ indicator.51 K+ sensors have also been developed using native and engineered nucleic acid G-quadruplex binding motifs.39,40,52,53 As such, the vast majority of available fluorescent K+ sensors for biological use achieve selectivity of K+ over Na+ by high-affinity means. However, the tight-binding nature of these probes does not allow for a dynamic range of detection of K+ in the cytosol without saturation, limiting their utility for studies of intracellular K+ dynamics (Fig. 1).
In addition, currently available small-molecule fluorescent K+ sensors are limited to intensity-based responses. In the best case scenario, such turn-on fluorescence potassium probes can detect dynamic K+ fluxes within the same cell population before and after a stimulation event, but comparing relative K+ levels across different biological samples can be complicated. Proper comparisons can be hindered by variations in: intracellular delivery, uptake, and retention of probes among cell types; sample thickness and other heterogeneities, and both excitation and emission light intensity and power dependency. These issues can be mitigated by ratiometric fluorescence imaging, which enables calibration by an internal standard.54 Along these lines, we have recently reported activity-based sensing probes for iron55 (FRET Iron Probe-1, FIP-1) and copper56 (FRET Copper Probe-1, FCP-1), which feature ratiometric fluorescence detection using a fluorescence resonance energy transfer (FRET) strategy.
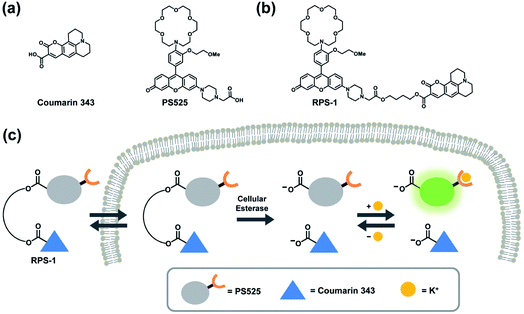
Here we report the design, synthesis, and biological evaluation of a first-generation ratiometric fluorescent sensor for K+ detection, termed Ratiometric Potassium Sensor-1 (RPS-1). RPS-1 is composed of a dual-fluorophore system that combines a K+-responsive rhodol moiety (Potassium Sensor 525, PS525) and a standard fluorophore (Coumarin 343) for more suited sensing to intracellular [K+] levels in the 150 mM range with internal self-calibration. Unlike previously reported FIP-1 and FCP-1 indicators that rely on FRET, the two fluorophores in RPS-1 are spectrally distinct and are not designed to undergo internal energy transfer. Instead, RPS-1 utilizes ester linkers that can be cleaved by intracellular esterases to detach the K+-responsive fluorophore from its internal standard and trap both dyes inside the cell in their carboxylate forms, an approach inspired by previous work by Woodroofe and Lippard on ratiometric zinc sensors.57 As a key design feature to tailor its use for intracellular K+ detection, the PS525 portion of RPS-1 utilizes a lariat-modified crown ether to achieve a Kd value more in line with intracellular K+ levels (Fig. 1).42,58,59 Indeed, despite its low affinity for K+, RPS-1 shows sufficient selectivity for K+ over competing biologically relevant metal ions, including Na+, and is able to monitor intracellular K+ fluxes. Moreover, because ratiometric calibration minimizes interference arising from analyte-independent phenomena such as sample thickness, heterogeneity, variations in light intensity, and dye loading, RPS-1 enables a rapid readout of K+ levels among different cell lines that can be corroborated by ICP-MS. Interestingly, data from these independent measurements reveal that select types of breast cancer cells possess elevated concentrations of K+ relative to normal breast cell counterparts. In addition to providing a unique chemical tool for interrogating intracellular K+ dynamics, this chemical modification strategy of converting a turn-on probe to a ratiometric probe is broadly applicable to a variety of fluorescent probes for different analytes provided each fluorophore has a non-overlapping emission spectrum. Taken together, RPS-1 provides key advances in terms of visible wavelength excitation and emission to minimize background autofluorescence and photodamage to biological samples, a low-affinity K+ receptor that retains high selectivity over Na+ to better match intracellular [K+] levels in the 150 mM range, and a ratiometric response to enable internal self-calibration.
Results and discussion
Design of Ratiometric Potassium Sensor-1 (RPS-1), a dual-fluorophore probe for ratiometric potassium detection
To develop a ratiometric sensing platform for potassium tailored for intracellular use, we envisioned a dual-fluorophore system with two dyes, one being potassium-sensitive and one being potassium-insensitive, which could be delivered in a 1![[thin space (1/6-em)]](https://www.rsc.org/images/entities/char_2009.gif) :
:![[thin space (1/6-em)]](https://www.rsc.org/images/entities/char_2009.gif) 1 ratio to cells. In principle, the potassium-sensitive moiety would possess a low-affinity receptor to better match the high levels of resting intracellular K+ pools in the 150 mM range and respond by an intensity-based turn-on response, whereas the potassium-insensitive dye would exhibit a distinct spectral excitation and emission from the potassium sensor for internal calibration. We chose Coumarin 343 as the internal standard fluorophore owing to its lack of a fluorescence response to K+, and we designed and synthesized the new potassium-responsive dye Potassium Sensor 525 (PS525) for the other portion of the sensor (Scheme 1a). Coumarin 343 is coupled to PS525via two ester-based linkers to yield RPS-1 (Scheme 1b). After RPS-1 is delivered into the cells, cellular esterases will cleave the ester bonds to give two separate fluorophores, PS525 (K+-responsive) and Coumarin 343 (K+-insensitive), in a 1
1 ratio to cells. In principle, the potassium-sensitive moiety would possess a low-affinity receptor to better match the high levels of resting intracellular K+ pools in the 150 mM range and respond by an intensity-based turn-on response, whereas the potassium-insensitive dye would exhibit a distinct spectral excitation and emission from the potassium sensor for internal calibration. We chose Coumarin 343 as the internal standard fluorophore owing to its lack of a fluorescence response to K+, and we designed and synthesized the new potassium-responsive dye Potassium Sensor 525 (PS525) for the other portion of the sensor (Scheme 1a). Coumarin 343 is coupled to PS525via two ester-based linkers to yield RPS-1 (Scheme 1b). After RPS-1 is delivered into the cells, cellular esterases will cleave the ester bonds to give two separate fluorophores, PS525 (K+-responsive) and Coumarin 343 (K+-insensitive), in a 1![[thin space (1/6-em)]](https://www.rsc.org/images/entities/char_2009.gif) :
:![[thin space (1/6-em)]](https://www.rsc.org/images/entities/char_2009.gif) 1 ratio (Scheme 1c). After cleavage, both fluorophores are cell-trappable due to their negatively charged carboxylate groups. As such, the ratio of respective emission profiles for PS525 and Coumarin 343 can determine a readout of intracellular K+ concentrations.
1 ratio (Scheme 1c). After cleavage, both fluorophores are cell-trappable due to their negatively charged carboxylate groups. As such, the ratio of respective emission profiles for PS525 and Coumarin 343 can determine a readout of intracellular K+ concentrations.
Synthesis and characterization of the K+-responsive turn-on probe Potassium Sensor 525 (PS525)
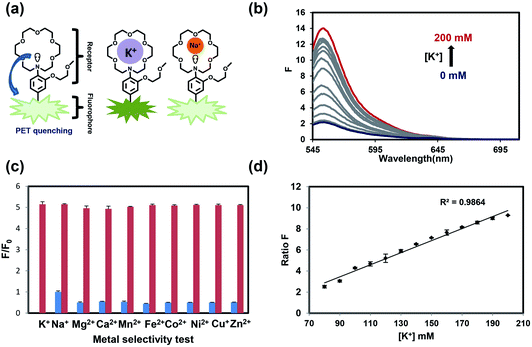
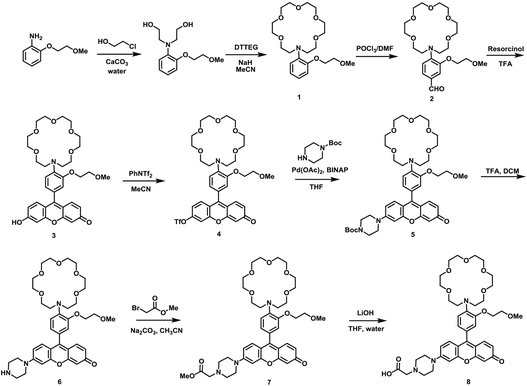
As our design of RPS-1 is comprised of a K+-responsive fluorescent moiety linked to an internal dye standard for ratiometric calibration, we sought to prepare a new turn-on fluorescent sensor that responds selectively to K+ in the high intracellular [K+] range of 150 mM. To achieve this goal, we chose a lariat ether modified aza-crown ether receptor as the K+-responsive moiety, as it retains high selectivity for K+ over Na+ but exhibits a weaker binding affinity for K+ compared to cryptand and G-quadruplex moieties (Fig. 1b and 2a). The probe is designed to operate by a standard photoinduced electron transfer (PET) mechanism where the electron-rich amine receptor will quench fluorescence by PET, which is alleviated by binding of the positively charged cation to the receptor.33,60 We appended this receptor to a rhodol-based structure owing to its spectral separation from Coumarin 343 and attractive imaging properties, including good optical brightness and photostability in one- and two-photon modes, as well as a balance between hydrophilicity and cell-permeability.35,61,62The synthesis of this K+ responsive moiety, Potassium Sensor 525 (PS525), is shown in Scheme 2. Lariat ether modified aza-crown ether 1 was synthesized using published procedures42 and then converted to xanthene 2 through a Vilsmeier–Haack reaction using phosphoryl chloride in N,N-dimethylformamide, followed by resorcinol condensation with trifluoroacetic acid as the solvent. Rhodol 3 was synthesized by converting the hydroxyl group on 2 to a triflate group, followed by Buchwald–Hartwig amination to add tert-butoxycarbonyl(Boc)-protected piperazine group and worked up with a trace amount of trifluoroacetic acid. Finally, PS525 was obtained by reacting 3 with methyl 2-bromoacetate, followed by treatment of lithium hydroxide in tetrahydrofuran and water mixture.
We evaluated the optical properties of PS525 in aqueous solution buffered to physiological pH (50 mM HEPES, pH 7.4). PS525 shows a maximum absorption peak at 525 nm with calculated absorption coefficients of ε = 61![[thin space (1/6-em)]](https://www.rsc.org/images/entities/char_2009.gif) 100 M−1 cm−1 and ε = 65
100 M−1 cm−1 and ε = 65![[thin space (1/6-em)]](https://www.rsc.org/images/entities/char_2009.gif) 000 M−1 cm−1 in the presence of 0 and 200 mM of K+, respectively (Fig. S2†). When exposed to K+, PS525 shows a 7-fold turn-on increase in fluorescence emission centered at 552 nm (Fig. 2b), with a quantum yield increase from 0.03 in the absence of K+ to 0.15 in the presence of K+ (Fig. S2†). The Kd value of the probe was calculated to be 137 mM based on the K+ titration response using a Benesi–Hildebrand plot (Fig. S1†), which is well-matched with intracellular [K+] in the 150 mM range.
000 M−1 cm−1 in the presence of 0 and 200 mM of K+, respectively (Fig. S2†). When exposed to K+, PS525 shows a 7-fold turn-on increase in fluorescence emission centered at 552 nm (Fig. 2b), with a quantum yield increase from 0.03 in the absence of K+ to 0.15 in the presence of K+ (Fig. S2†). The Kd value of the probe was calculated to be 137 mM based on the K+ titration response using a Benesi–Hildebrand plot (Fig. S1†), which is well-matched with intracellular [K+] in the 150 mM range.
We next tested the metal selectivity of PS525 for K+ compared to a panel of biologically relevant alkali, alkaline earth, and transition metals (Fig. 2c). Notably, even with its low affinity for K+, PS525 showed a greater than five-fold selectivity for K+ over Na+ at relevant intracellular levels, presaging that it possesses adequate sensitivity and selectivity for downstream biological applications. We then tested the sensitivity of the ratio responsiveness of PS525 and Coumarin 343 to the K+ level around intracellular K+ concentration (140 mM) (Fig. 2d). Within the range of 80 mM to 120 mM, linear regression analysis was performed to calculate limit of detection at 5.8 mM. Additionally, the pH sensitivity test of both PS525 and Coumarin 343 demonstrated their usability under physiological pH (Fig. S3†).
Synthesis of Ratiometric Potassium Sensor-1 (RPS-1) from PS525 and Coumarin 343 dyes and demonstration of ratiometric fluorescence imaging of K+ levels in living cells
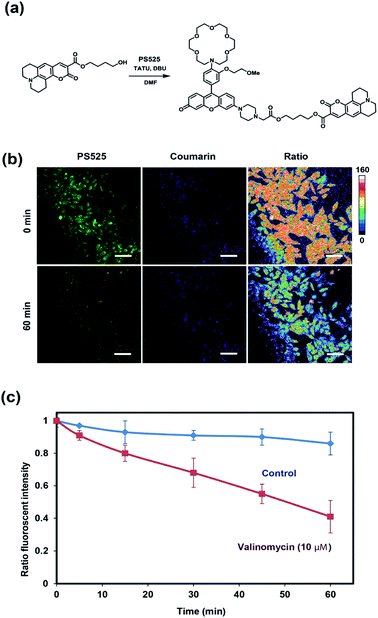
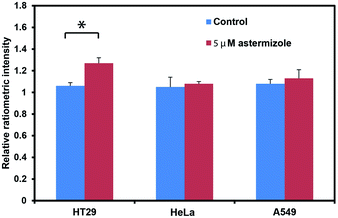
After establishing that PS525 is a selective and sensitive fluorescent K+-sensing dye unit, we synthesized RPS-1 through esterification of PS525 with a previously reported coumarin synthon63 using 2-(3H-[1,2,3]triazolo[4,5-b]pyridine-3-yl)-1,1,3,3-tetramethyluronium tetrafluoroborate (TATU) as a carboxylate activator (Fig. 3a). We tested the fluorescence response and esterase-catalyzed hydrolysis of RPS-1 (Fig. S4 and S5†). We next applied RPS-1 for ratiometric fluorescence imaging of intracellular K+ pools with confocal microscopy, given the ability of the PS525 sensing unit to respond selectively to K+ levels at biologically relevant concentrations in aqueous buffer in vitro. We note that the K+-insensitive Coumarin 343 piece has a quantum yield of 0.02, which is comparable to the PS525 portion, but is excited at a separate 458 nm wavelength (Fig. S2†). HeLa cells were first incubated with 10 μM RPS-1 before imaging to ensure probe uptake and esterase cleavage. Dual-color confocal microscopy images were acquired using 458 nm excitation of the Coumarin 343 unit (blue channel) and 514 nm excitation of the PS525 unit (green channel). A ratio image was then obtained using these two channels (green channel/blue channel, Fig. 3b). To assess whether RPS-1 can respond to changes in intracellular K+ changes through its PS525 unit, HeLa cells were then treated with 5 μM valinomycin, a compound known to chelate and transport potassium selectively through membranes and deplete intracellular pools of K+. Confocal images from both channels were taken at 0, 5, 15, 30, 45, 60 min after valinomycin addition and compared with a vehicle control. We observed a clear decrease in green/blue ratio intensities in the HeLa cells stimulated by valinomycin compared to the cells in the vehicle control group (Fig. 3c). Furthermore, we confirmed that cells treated with valinomycin indeed have decreased levels of intracellular K+ through inductively coupled plasma mass spectrometry measurements (ICP-MS; Fig. S5†). These data suggest that RPS-1 can respond to dynamic changes in intracellular K+ pools and is capable of monitoring decreases in [K+] from basal levels. Moreover, the dual-fluorophore ratio from the vehicle control remains stable throughout the time course of the experiment, consistent with the design in which the two dye components are delivered and trapped upon esterase cleavage. Finally, cell viability was measured through propidium iodide staining and was not significantly different with valinomycin and/or RPS-1 treatments over the course of the experiment (Fig. S6†).We next tested the ability of RPS-1 to detect increases in intracellular K+ levels upon stimulation. HT29 cells are known to selectively express significantly higher levels of the human ether-à-go-go-related gene (HERG) potassium channel relative to other cancer cell lines such as HeLa and A549.64,65 We treated HT29 cells with astemizole, a known HERG potassium channel blocker, to enable expansion of intracellular K+ pools.66 We first incubated all three cell types with 10 μM RPS-1 for 3 hours, followed by media exchange and treatment with 5 μM astemizole and 30 mM K+ or with vehicle control in HEPES buffer for 1 hour. We observed an increase in the ratio of green/blue fluorescence in the HT29 cells compared to vehicle control and Hela and A549 cell lines (Fig. 4). The astermizole-induced increases in intracellular K+ levels were verified by ICP-MS (Fig. S5†). Taken together, these data establish that RPS-1 is indeed able to visualize both increases and decreases in intracellular K+ levels by ratiometric fluorescence imaging.
RPS-1 enables profiling of intracellular K+ levels across a panel of cancer cell lines
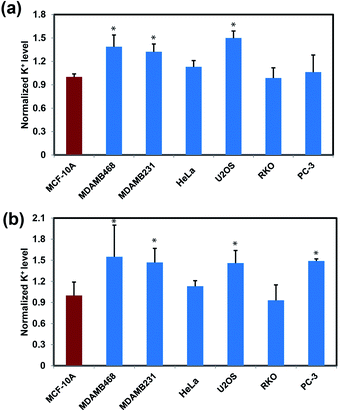
After establishing that RPS-1 is capable of monitoring dynamic changes in intracellular K+ levels upon external stimulation, we sought to expand applications of RPS-1 to profiling relative intracellular K+ levels across different cell types. We became interested in comparative screening of K+ levels between cancer and non-cancer cell models, as many types of tumors are known to exhibit elevated K+ channel expression and elevated K+ has been observed in some cases.18,21,67 We turned our attention to comparing K+ levels in two different types of metastatic breast cancer cell lines, MDA-MB-468 and MDA-MB-231, relative to a normal breast cancer cell control line MCF-10A. Given the ability of RPS-1 to reliably measure the relative intracellular K+ level in multiple types of cell lines, we also screened other cancer cell lines, including U2OS (bone), RKO (colon), and PC-3 (prostate), using HeLa as a comparison. Interestingly, RPS-1 imaging reveals that the breast cancer cell lines MDA-MB-468 and MDA-MB-231 possess higher basal levels of K+ compared to the normal breast cell line MCF-10A (Fig. 5). We speculate that the expansion of K+ pools is due to higher proliferation needs for metastatic tumor cells versus normal ones. In addition, PC-3 and U2OS lines also exhibit higher resting levels of K+ over RKO and HeLa, showing that different cell types can indeed possess different basal K+ pools. Moreover, ICP-MS measurements of bulk intracellular K+ levels validate the RPS-1 assay by providing an independent measure of potassium (Fig. 5 and S8†).Concluding remarks
To summarize, we have presented the design, synthesis, characterization, and biological applications of RPS-1, a first-generation chemical probe for ratiometric imaging of intracellular K+ pools. RPS-1 features a dual-fluorophore approach to ratiometric potassium detection where the two fluorophores operate independently to provide a potassium-sensitive response in one dye with internal calibration from the other dye. RPS-1 is composed of two units: PS525 as a turn-on K+-responsive fluorophore with a lariat crown ether receptor tailored to selective but low-affinity K+ binding, and Coumarin 343 as a K+-insensitive fluorophore. When joined by ester linkages in the full RPS-1 probe, both components are taken up, released, and trapped in cells after cleavage by intracellular esterases. Through the PS525 unit, RPS-1 can sensitively and specifically respond to intracellular K+ as well as report dynamic changes in K+ levels upon stimulation with an external input. Compared to previous potassium probes such as PBFI, which requires high-energy UV excitation, visible light excitation of RPS-1 through the PS525 chromophore minimizes background autofluorescence and photodamage. Moreover, due to its ratiometric response RPS-1 can be used to profile basal intracellular K+ pools across a variety of different cell lines, revealing that breast cancer cells possess higher resting levels than a non-cancerous counterpart. We anticipate that RPS-1 and related fluorescent probes will be of value in providing foundational information about K+ physiology and pathology owing to the broad importance of this abundant metal in biology, as well as promote further investigations into design strategies for ratiometric detection of metals and other important biological analytes.Experimental section
General methods
Reactions using moisture- or air-sensitive reagents were carried out in flame-dried glassware in an inert atmosphere of N2. Solvent was passed over activated alumina and stored over activated 3 Å molecular sieves before use when dry solvent was required. All other commercially purchased chemicals were used as received (without further purification). SiliCycle 60 F254 silica gel pre-coated sheets (0.25 mm thick) were used for analytical thin layer chromatography and visualized by fluorescence quenching under UV light. Silica gel P60 (SiliCycle) was used for column chromatography. 1H and 13C NMR NMR spectra were collected at 298 K in CDCl3 or CD3OD (Cambridge Isotope Laboratories, Cambridge, MA) at 25 °C using Bruker AVQ-400, AVB-400, AV-500, or AV-600 instruments at the College of Chemistry NMR Facility at the University of California, Berkeley or using a Bruker 900 at the QB3 Central California 900 MHz NMR Facility. All chemical shifts are reported in the standard notation of δ parts per million relative to the residual solvent peak at 7.26 (CDCl3) or 3.31 (CD3OD) for 1H and 77.16 (CDCl3) or 49.00 (CD3OD) for 13C as an internal reference. Splitting patterns are indicated as follows: br, broad; s, singlet; d, doublet; t, triplet; m, multiplet; dd, doublet of doublets. Low-resolution electrospray mass spectral analyses were carried out using LC-MS (Agilent Technology 6130, Quadrupole LC/MS and Advion Expression-L Compact Mass Spectrometer). High-resolution mass spectral analyses (ESI-MS) were carried out at the College of Chemistry Mass Spectrometry Facility at the University of California, Berkeley. Compound 1 was synthesized using the published procedure.42 All aqueous solutions were prepared using Milli-Q water, and all spectroscopic experiments were carried out in 50 mM HEPES, pH 7.4, unless otherwise noted. All spectroscopic experiments were prepared using freshly prepared aliquots. Absorption spectra were acquired using a Varian Cary 50 spectrophotometer, and fluorescence spectra were acquired using a Photon Technology International Quanta Master 4 L-format scan spectro-fluorometer equipped with an LPS-220B 75 W xenon lamp and power supply, A-1010B lamp housing with an integrated igniter, switchable 814 photocounting/analog photomultiplier detection unit, and MD5020 motor driver. 1 cm × 1 cm quartz cuvettes (1.4 mL volume, Starna, capped) were used for obtaining absorption and fluorescence spectra. For all fluorescence measurements and K+ studies, aqueous solutions of KCl (Sigma) were used. For metal selectivity studies, aqueous metal solutions of MgCl2·4H2O (EMD Millipore), CaCl2·2H2O (EMD Millipore), NiCl2·6H2O (Sigma), ZnCl2 (Sigma), CuCl2·2H2O (Baker & Adamson), CoCl2·6H2O (Sigma), MgCl2·6H2O (Sigma), NaCl (Sigma), and FeCl2 (Sigma) were used.Synthesis of RPS-1
![[thin space (1/6-em)]](https://www.rsc.org/images/entities/char_2009.gif) :
:![[thin space (1/6-em)]](https://www.rsc.org/images/entities/char_2009.gif) 1) and dried over anhydrous MgSO4. The solvent was evaporated in vacuo and the compound was purified by silica gel flash column chromatography (FCC) using DCM
1) and dried over anhydrous MgSO4. The solvent was evaporated in vacuo and the compound was purified by silica gel flash column chromatography (FCC) using DCM![[thin space (1/6-em)]](https://www.rsc.org/images/entities/char_2009.gif) :
:![[thin space (1/6-em)]](https://www.rsc.org/images/entities/char_2009.gif) MeOH (19
MeOH (19![[thin space (1/6-em)]](https://www.rsc.org/images/entities/char_2009.gif) :
:![[thin space (1/6-em)]](https://www.rsc.org/images/entities/char_2009.gif) 1) as the eluent and aldehyde 2 was obtained as a dark red oil (820 mg, 44% yield) 1H NMR (400 MHz, CDCl3) δ (ppm): 9.48 (s, 1H), 7.38 (d, 2H, J = 7.5 Hz), 7.17 (d, 2H, J = 1.5 Hz), 6.47 (dd, 2H, J = 7.5, 1.5 Hz), 4.31 (t, 2H, J = 8.2 Hz), 3.77 (d, 2H, J = 8.2 Hz), 3.60–3.52 (m, 24H), 3.41 (s, 3H). 13C NMR (101 MHz, CDCl3) δ (ppm): 191.01, 162.72, 148.11, 127.08, 122.39, 115.44, 115.09, 72.21, 69.01, 59.79, 59.12. LCMS calcd for C22H35NO8 [M + H]+ 442.24, found 442.19.
1) as the eluent and aldehyde 2 was obtained as a dark red oil (820 mg, 44% yield) 1H NMR (400 MHz, CDCl3) δ (ppm): 9.48 (s, 1H), 7.38 (d, 2H, J = 7.5 Hz), 7.17 (d, 2H, J = 1.5 Hz), 6.47 (dd, 2H, J = 7.5, 1.5 Hz), 4.31 (t, 2H, J = 8.2 Hz), 3.77 (d, 2H, J = 8.2 Hz), 3.60–3.52 (m, 24H), 3.41 (s, 3H). 13C NMR (101 MHz, CDCl3) δ (ppm): 191.01, 162.72, 148.11, 127.08, 122.39, 115.44, 115.09, 72.21, 69.01, 59.79, 59.12. LCMS calcd for C22H35NO8 [M + H]+ 442.24, found 442.19.
Spectroscopic methods
![[thin space (1/6-em)]](https://www.rsc.org/images/entities/char_2009.gif) :
:![[thin space (1/6-em)]](https://www.rsc.org/images/entities/char_2009.gif) 500 ratio into a 1 cm × 1 cm capped quartz cuvette. The probe solution was incubated at 37 °C for 5 minutes. Emission spectra were collected for PS525 (λex = 525 nm, λem = 545–700 nm).
500 ratio into a 1 cm × 1 cm capped quartz cuvette. The probe solution was incubated at 37 °C for 5 minutes. Emission spectra were collected for PS525 (λex = 525 nm, λem = 545–700 nm).
Conflicts of interest
There are no conflicts to declare.Acknowledgements
This work was supported by the Human Frontiers Science Program Organization (RGP0052/2015) and NIH (GM 79465). T. C. D. was partially supported by a Chemistry–Biology Interface Training Grant from the NIH (T32 GM066698). We thank members of the Chang lab for feedback on the manuscript. Z. W. acknowledges support from Suzhou Industrial Park.Notes and references
- M. C. D'Adamo, L. Catacuzzeno, G. Di Giovanni, F. Franciolini and M. Pessia, Front. Cell. Neurosci., 2013, 7, 1–21 CrossRef PubMed.
- B. F. Palmer, Clin. J. Am. Soc. Nephrol., 2014, 10, 1050–1060 CrossRef PubMed.
- D. A. Baylor and J. G. Nicholls, J. Physiol., 1969, 203, 555–569 CrossRef CAS PubMed.
- A. A. Grace and B. S. Bunney, J. Neurosci., 1984, 4, 2877–2890 CrossRef CAS PubMed.
- D. L. Fortin, M. R. Banghart, T. W. Dunn, K. Borges, D. A. Wagenaar, Q. Gaudry, M. H. Karakossian, T. S. Otis, W. B. Kristan, D. Trauner and R. H. Kramer, Nat. Methods, 2008, 5, 331–338 CrossRef CAS PubMed.
- P. M. Hudgins and G. B. Weiss, J. Pharmacol. Exp. Ther., 1968, 159, 91–97 CAS.
- C. Juel, Pfluegers Arch., 1986, 406, 458–463 CrossRef CAS PubMed.
- M. J. Bia and R. A. DeFronzo, Am. J. Physiol., 1981, 240, F257–F268 CAS.
- E. Féraille and A. Doucet, Physiol. Rev., 2001, 81, 345–418 CrossRef PubMed.
- N. M. Storey, J. P. O'Bryan and D. L. Armstrong, Curr. Biol., 2002, 12, 27–33 CrossRef CAS PubMed.
- J. M. Burnell, B. H. Scribner, B. T. Uyeno and M. F. Villamil, J. Clin. Invest., 1956, 35, 935–939 CrossRef CAS PubMed.
- C. Tian, R. Zhu, L. Zhu, T. Qiu, Z. Cao and T. Kang, Chem. Biol. Drug Des., 2014, 83, 1–26 CrossRef CAS PubMed.
- L. Ge, N. T. Hoa, Z. Wilson, G. Arismendi-Morillo, X. T. Kong, R. B. Tajhya, C. Beeton and M. R. Jadus, Int. Immunopharmacol., 2014, 22, 427–443 CrossRef CAS PubMed.
- A. Felipe, R. Vicente, N. Villalonga, M. Roura-Ferrer, R. Martínez-Mármol, L. Solé, J. C. Ferreres and E. Condom, Cancer Detect. Prev., 2006, 30, 375–385 CrossRef CAS PubMed.
- H. Wulff, N. A. Castle and L. A. Pardo, Nat. Rev. Drug Discovery, 2009, 8, 982–1001 CrossRef CAS PubMed.
- S. A. Salyer, J. R. Olberding, A. A. Distler, E. D. Lederer, B. J. Clark, N. A. Delamere and S. J. Khundmiri, Biochim. Biophys. Acta, Mol. Basis Dis., 2013, 1832, 1734–1743 CrossRef CAS PubMed.
- D. Urrego, A. P. Tomczak, F. Zahed, W. Stühmer, L. A. Pardo and W. Stuehmer, Philos. Trans. R. Soc., B, 2014, 2014, 1–9 Search PubMed.
- X. Huang and L. Y. Jan, J. Cell Biol., 2014, 206, 151–162 CrossRef CAS PubMed.
- L. Leanza, E. Venturini, S. Kadow, A. Carpinteiro, E. Gulbins and K. A. Becker, Cell Calcium, 2015, 58, 1–8 CrossRef PubMed.
- L. Leanza, M. Romio, K. A. Becker, M. Azzolini, L. Trentin, A. Managò, E. Venturini, A. Zaccagnino, A. Mattarei, L. Carraretto, A. Urbani, S. Kadow, L. Biasutto, V. Martini, F. Severin, R. Peruzzo, V. Trimarco, J. H. Egberts, C. Hauser, A. Visentin, G. Semenzato, H. Kalthoff, M. Zoratti, E. Gulbins, C. Paradisi and I. Szabo, Cancer Cell, 2017, 31, 516–531.e10 CrossRef CAS PubMed.
- E. K. Breuer, D. Fukushiro-Lopes, A. Dalheim, M. Burnette, J. Zartman, S. Kaja, C. Wells, L. Campo, K. J. Curtis, R. Romero-Moreno, L. E. Littlepage, G. L. Niebur, K. Hoskins, M. I. Nishimura and S. Gentile, Cell Death Dis., 2019, 10, 1–15 CrossRef PubMed.
- C. D. Bortner, F. M. Hughes and J. A. Cidlowski, A Primary Role for K and Na Efflux in the Activation of Apoptosis, J. Biol. Chem., 1997, 272, 32436–32442 CrossRef CAS PubMed.
- F. M. Hughes, C. D. Bortner, G. D. Purdy and J. A. Cidlowski, J. Biol. Chem., 1997, 272, 30567–30576 CrossRef CAS PubMed.
- U. Fiedler and J. Růžička, Anal. Chim. Acta, 1973, 67, 179–193 CrossRef CAS.
- M. Jospin, M. C. Mariol, L. Ségalat and B. Allard, J. Physiol., 2002, 544, 373–384 CrossRef CAS PubMed.
- H. Bischof, M. Rehberg, S. Stryeck, K. Artinger, E. Eroglu, M. Waldeck-Weiermair, B. Gottschalk, R. Rost, A. T. Deak, T. Niedrist, N. Vujic, H. Lindermuth, R. Prassl, B. Pelzmann, K. Groschner, D. Kratky, K. Eller, A. R. Rosenkranz, T. Madl, N. Plesnila, W. F. Graier and R. Malli, Nat. Commun., 2017, 8, 1–11 CrossRef CAS PubMed.
- T. T. Ruckh, C. G. Skipwith, W. Chang, A. W. Senko, V. Bulovic, P. O. Anikeeva and H. A. Clark, ACS Nano, 2016, 10, 4020–4030 CrossRef CAS PubMed.
- C. H. Lee, J. Folz, W. Zhang, J. Jo, J. W. Y. Tan, X. Wang and R. Kopelman, Anal. Chem., 2017, 89, 7943–7949 CrossRef CAS PubMed.
- R. Wang, X. Du, Y. Wu, J. Zhai and X. Xie, ACS Sens., 2018, 3, 2408–2414 CrossRef CAS PubMed.
- Y. Shen, S. Y. Wu, V. Rancic, A. Aggarwal, Y. Qian, S. I. Miyashita, K. Ballanyi, R. E. Campbell and M. Dong, Commun. Biol., 2019, 2, 1–10 CrossRef CAS PubMed.
- M. P. Jewell, M. D. Greer, A. L. Dailey and K. J. Cash, ACS Sens., 2020, 5, 474–480 CrossRef CAS PubMed.
- R. Y. Tsien, Fluorescent Probes of Cell Signaling, 1989 Search PubMed.
- D. W. Domaille, E. L. Que and C. J. Chang, Nat. Chem. Biol., 2008, 4, 168–175 CrossRef CAS PubMed.
- K. P. Carter, A. M. Young and A. E. Palmer, Chem. Rev., 2014, 114, 4564–4601 CrossRef CAS PubMed.
- S. C. Dodani, A. Firl, J. Chan, C. I. Nam, A. T. Aron, C. S. Onak, K. M. Ramos-Torres, J. Paek, C. M. Webster, M. B. Feller and C. J. Chang, Proc. Natl. Acad. Sci. U. S. A., 2014, 111, 16280–16285 CrossRef CAS PubMed.
- C. M. Ackerman, S. Lee and C. J. Chang, Anal. Chem., 2017, 89, 22–41 CrossRef CAS PubMed.
- J. L. Kolanowski, F. Liu and E. J. New, Chem. Soc. Rev., 2018, 47, 195–208 RSC.
- H. He, M. A. Mortellaro, M. J. P. Leiner, R. J. Fraatz and J. K. Tusa, J. Am. Chem. Soc., 2003, 125, 1468–1469 CrossRef CAS PubMed.
- F. He, Y. Tang, S. Wang, Y. Li and D. Zhu, J. Am. Chem. Soc., 2005, 127, 12343–12346 CrossRef CAS PubMed.
- S. Nagatoishi, T. Nojima, B. Juskowiak and S. Takenaka, Angew. Chem., 2005, 117, 5195–5198 CrossRef.
- X. Fan, H. Li, J. Zhao, F. Lin, L. Zhang, Y. Zhang and S. Yao, Talanta, 2012, 89, 57–62 CrossRef CAS PubMed.
- S. Ast, T. Schwarze, H. Müller, A. Sukhanov, S. Michaelis, J. Wegener, O. S. Wolfbeis, T. Körzdörfer, A. Dürkop and H. J. Holdt, Chem.–Eur. J., 2013, 19, 14911–14917 CrossRef CAS PubMed.
- X. Kong, F. Su, L. Zhang, J. Yaron, F. Lee, Z. Shi, Y. Tian and D. R. Meldrum, Angew. Chem., Int. Ed., 2015, 54, 12053–12057 CrossRef CAS PubMed.
- B. Sui, X. Yue, M. G. Tichy, T. Liu and K. D. Belfield, Eur. J. Org. Chem., 2015, 2015, 1189–1192 CrossRef CAS.
- G. Song, R. Sun, J. Du, M. Chen and Y. Tian, Chem. Commun., 2017, 53, 5602–5605 RSC.
- K. Meuwis, N. Boens, F. C. De Schryver, J. Gallay and M. Vincent, Biophys. J., 1995, 68, 2469–2473 CrossRef CAS.
- P. Padmawar, X. Yao, O. Bloch, G. T. Manley and A. S. Verkman, Nat. Methods, 2005, 2, 825–827 CrossRef CAS PubMed.
- W. Namkung, P. Padmawar, A. D. Mills and A. S. Verkman, J. Am. Chem. Soc., 2008, 130, 7794–7795 CrossRef CAS PubMed.
- R. D. Carpenter and A. S. Verkman, Org. Lett., 2010, 12, 1160–1163 CrossRef CAS PubMed.
- R. D. Carpenter and A. S. Verkman, Eur. J. Org. Chem., 2011, 2011, 1242–1248 CrossRef PubMed.
- C. After, Nat. Methods, 2005, 2, 5–8 CrossRef.
- J. Yu, L. Zhang, X. Xu and S. Liu, Anal. Chem., 2014, 86, 10741–10748 CrossRef CAS PubMed.
- J. Huang, L. Ying, X. Yang, Y. Yang, K. Quan, H. Wang, N. Xie, M. Ou, Q. Zhou and K. Wang, Anal. Chem., 2015, 87, 8724–8731 CrossRef CAS PubMed.
- G. Grynkiewicz, M. Poenie and R. Y. Tsien, J. Biol. Chem., 1985, 260, 3440–3450 CrossRef CAS.
- A. T. Aron, M. O. Loehr, J. Bogena and C. J. Chang, J. Am. Chem. Soc., 2016, 138, 14338–14346 CrossRef CAS PubMed.
- C. Y. S. Chung, J. M. Posimo, S. Lee, T. Tsang, J. M. Davis, D. C. Brady and C. J. Chang, Proc. Natl. Acad. Sci. U. S. A., 2019, 116, 18285–18294 CrossRef PubMed.
- C. C. Woodroofe and S. J. Lippard, J. Am. Chem. Soc., 2003, 125, 11458–11459 CrossRef CAS PubMed.
- R. A. Schultz, B. D. White, D. M. Dishone, K. A. Arnold and G. W. Gokel, J. Am. Chem. Soc., 1985, 107, 6659–6668 CrossRef CAS.
- G. W. Gokel, L. J. Barbour, R. Ferdani and J. Hu, Acc. Chem. Res., 2002, 35, 878–886 CrossRef CAS PubMed.
- A. P. De Silva, H. Q. N. Gunaratne, T. Gunnlaugsson, A. J. M. Huxley, C. P. McCoy, J. T. Rademacher and T. E. Rice, Chem. Rev., 1997, 97, 1515–1566 CrossRef CAS PubMed.
- J. E. Whitaker, R. P. Haugland, D. Ryan, P. C. Hewitt, R. P. Haugland and F. G. Prendergast, Anal. Biochem., 1992, 207, 267–279 CrossRef CAS.
- T. Xiao, C. M. Ackerman, E. C. Carroll, S. Jia, A. Hoagland, J. Chan, B. Thai, C. S. Liu, E. Y. Isacoff and C. J. Chang, Nat. Chem. Biol., 2018, 14, 655–663 CrossRef CAS PubMed.
- C. C. Woodroofe, A. C. Won and S. J. Lippard, Inorg. Chem., 2005, 44, 3112–3120 CrossRef CAS PubMed.
- E. Lastraioli, L. Guasti, O. Crociani, S. Polvani, G. Hofmann, H. Witchel, L. Bencini, M. Calistri, L. Messerini, M. Scatizzi, R. Moretti, E. Wanke, M. Olivotto, G. Mugnai and A. Arcangeli, Cancer Res., 2004, 606–611 CrossRef CAS PubMed.
- S. Z. Chen, M. Jiang and Y. S. Zhen, Cancer Chemother. Pharmacol., 2005, 56, 212–220 CrossRef CAS PubMed.
- Z. Zhou, V. R. Vorperian, Q. Gong, S. Zhang and C. T. January, J. Cardiovasc. Electrophysiol., 1999, 10, 836–843 CrossRef CAS PubMed.
- I. L. Camero, N. K. R. Smith, T. B. Pool and R. L. Sparks, Cancer Res., 1980, 40, 1493–1500 Search PubMed.
Footnote |
| † Electronic supplementary information (ESI) available. See DOI: 10.1039/d0sc03844j |
| This journal is © The Royal Society of Chemistry 2021 |

