
 Open Access Article
 This Open Access Article is licensed under a
 Creative Commons Attribution 3.0 Unported Licence
Correction: Surface reaction kinetics of the methanol synthesis and the water gas shift reaction on Cu/ZnO/Al2O3
Bruno
Lacerda de Oliveira Campos
 a,
Karla
Herrera Delgado
*a,
Stefan
Wild
a,
Felix
Studt
ab,
Stephan
Pitter
a and
Jörg
Sauer
a
a,
Karla
Herrera Delgado
*a,
Stefan
Wild
a,
Felix
Studt
ab,
Stephan
Pitter
a and
Jörg
Sauer
a
aInstitute for Catalysis Research and Technology (IKFT), Karlsruhe Institute of Technology (KIT), Hermann-von-Helmholtz-Platz 1, 76344 Eggenstein-Leopoldshafen, Germany. E-mail: karla.herrera@kit.edu; Tel: +49 721 608 28631
bInstitute for Chemical Technology and Polymer Chemistry (ITCP), Karlsruhe Institute of Technology (KIT), Engesserstr. 18-20, 76131 Karlsruhe, Germany
First published on 15th July 2021
Abstract
Correction for ‘Surface reaction kinetics of the methanol synthesis and the water gas shift reaction on Cu/ZnO/Al2O3’ by Bruno Lacerda de Oliveira Campos et al., React. Chem. Eng., 2021, 6, 868–887; DOI: 10.1039/D1RE00040C
A mistake was found in the Matlab program used for the simulations. That is, a parameter of the Gibbs free energy change of zinc reduction (ΔG0Zn red.) was wrongly typed, which participates in eqn (31) and (37) of the original paper. ΔG0Zn red. is calculated from the thermodynamic data of Goos et al.,1 and the equation with the correct data is as follows.
| ΔG0Zn red. = R·[8411.4 − 8.3237·T + 1.9335 × 10⁻⁴·T2 − 2.2728 × 10⁻⁷·T3−4.3047 × 10⁻¹⁰·T4 + 1.6777 × 10⁻¹³·T5 + 0.9824·T·ln(T)] | (1) |
With the corrected parameter, the zinc solubility in copper (XZn) and, consequently, the zinc coverage (ϕZn) have lower values than the originally published ones, as shown in the revised Fig. 4.
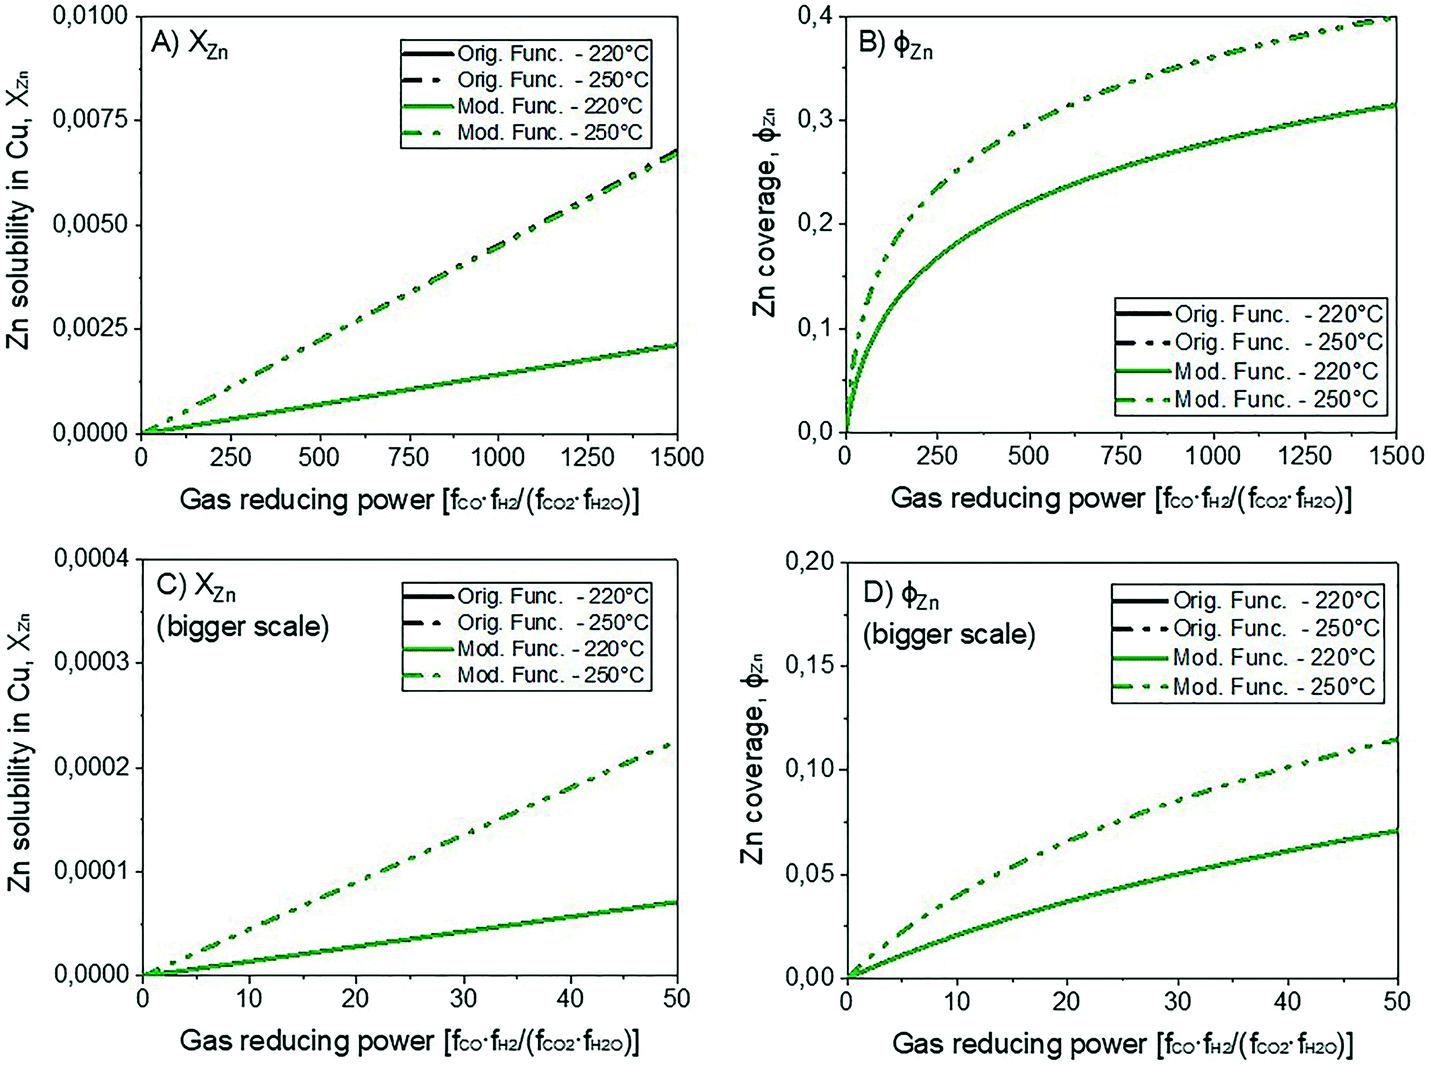 | ||
| Fig. 4 Solubility of zinc in the Cu-bulk (A and C) and zinc coverage (B and D) as functions of the gas reducing power. | ||
With the corrected parameter, new simulations of the experiments were performed, with the normalized residues and statistical indicators shown in the revised Fig. 6 and Table 4, respectively. The deviations after the parameter correction (χ2 = 120.67) are in fact higher than that originally published (χ2 = 74.74).
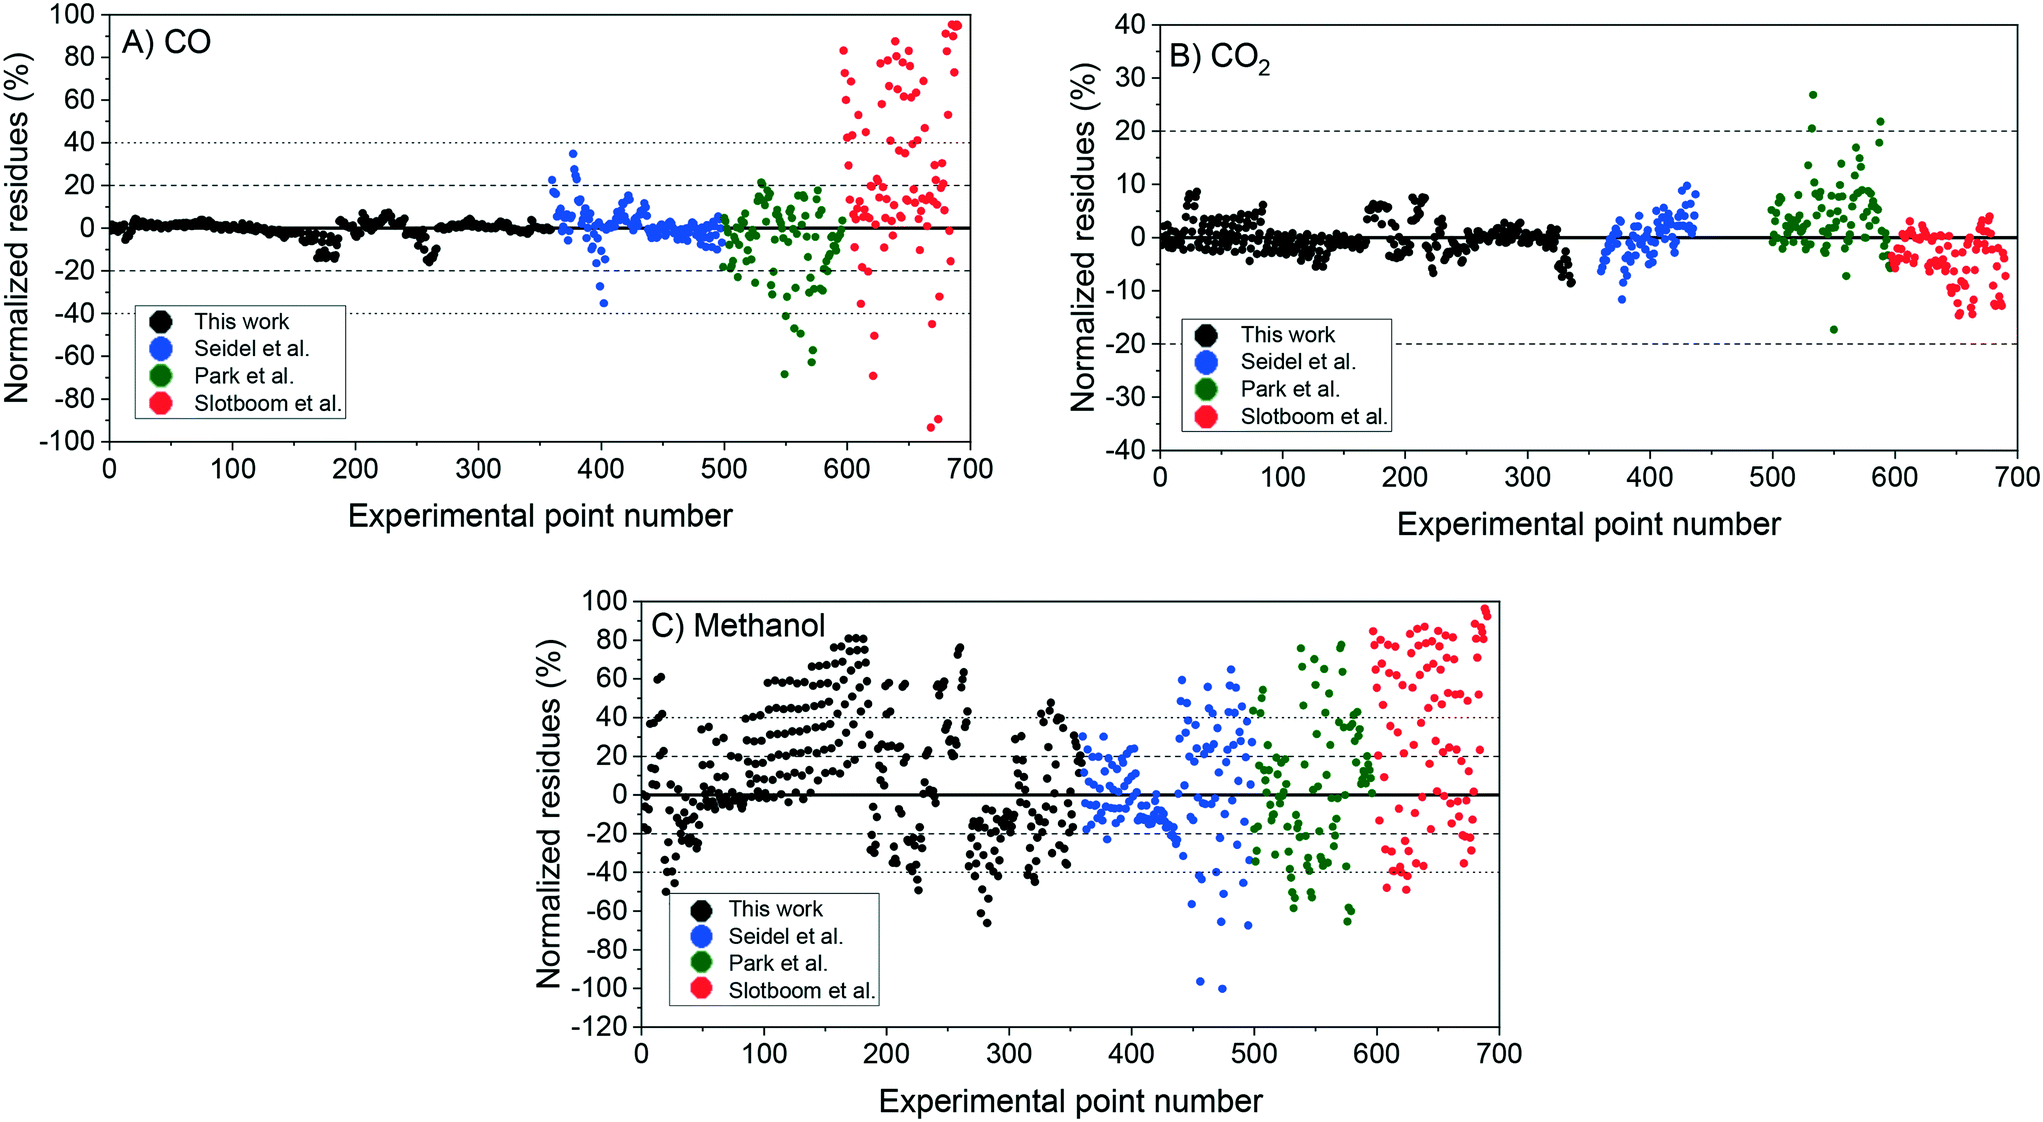 | ||
| Fig. 6 Two-case model simulation: normalized residues of the simulation of the experiments from this work (1–359), from Seidel et al.2 (360–498), from Park et al.3 (499–596), and from Slotboom et al.4 (597–690). A) Carbon monoxide. B) Carbon dioxide. C) Methanol. | ||
| Feed: | H2/CO/CO2 | H2/CO | H2/CO2 | All | |||||
|---|---|---|---|---|---|---|---|---|---|
| Data: | This work | Seidel et al. | Park et al. | This work | Seidel et al. | Seidel et al. | Slotboom et al. | ||
| N° of points | 324 | 46 | 98 | 35 | 61 | 32 | 94 | 690 | |
| χ 2 | 38.63 | 1.45 | 17.62 | 2.44 | 9.29 | 1.26 | 49.98 | 120.67 | |
| CO | ME | 0.0275 | 0.0698 | 0.1481 | 0.0105 | 0.0269 | 0.1010 | 0.3752 | 0.0973 |
| MSE | 0.0017 | 0.0097 | 0.0526 | 0.0002 | 0.0013 | 0.0164 | 0.2324 | 0.0415 | |
| CO2 | ME | 0.0215 | 0.0292 | 0.0537 | 0.0315 | 0.0441 | 0.0315 | ||
| MSE | 0.0008 | 0.0013 | 0.0056 | 0.0016 | 0.0036 | 0.0021 | |||
| CH3OH | ME | 0.2732 | 0.1283 | 0.2831 | 0.2300 | 0.3220 | 0.1198 | 0.4672 | 0.2864 |
| MSE | 0.1167 | 0.0204 | 0.1216 | 0.0698 | 0.1510 | 0.0190 | 0.2957 | 0.1315 | |
By using a constant zinc coverage approach, the model accuracy is improved and the complexity of the model decreases. As it is known that the zinc coverage on the catalyst is reduced by an increase in the CO2/COX ratio  ,5,6 we divide the operating region into three sectors, the 1st with very low CO2 content
 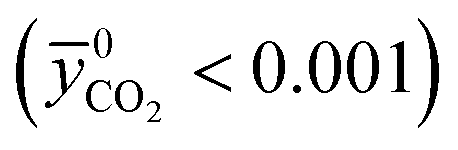 , the 2nd with very high CO2 content
 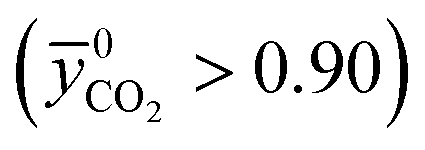 , and the 3rd being an intermediate region
  . For each sector, a separate constant zinc coverage was determined, as shown in Table 5.
| Condition | Zn value |
|---|---|
| CO2/COX ratio < 0.001 | 0.90 (for Campos' data) |
| 0.95 (for Seidel's data) | |
| 0.001 ≤ CO2/COX ratio ≤ 0.90 | 0.50 |
| CO2/COX ratio > 0.90 | 0.10 |
With this approach, corresponding simulations were repeated, and results are shown regarding the normalized residues (Fig. 16), methanol output concentration for selected experiments (Fig. 17), and statistical indicators (Table 6). The overall model performance is thereby improved (χ2 = 75.97 against 120.67 with Kuld's method7), in particular for the intermediate region  .
.
 | ||
| Fig. 16 Two-case model simulation: normalized residues of the simulation of the experiments from this work (1–359), from Seidel et al.2 (360–498), from Park et al.3 (499–596), and from Slotboom et al.4 (597–690). A) Carbon monoxide. B) Carbon dioxide. C) Methanol. | ||
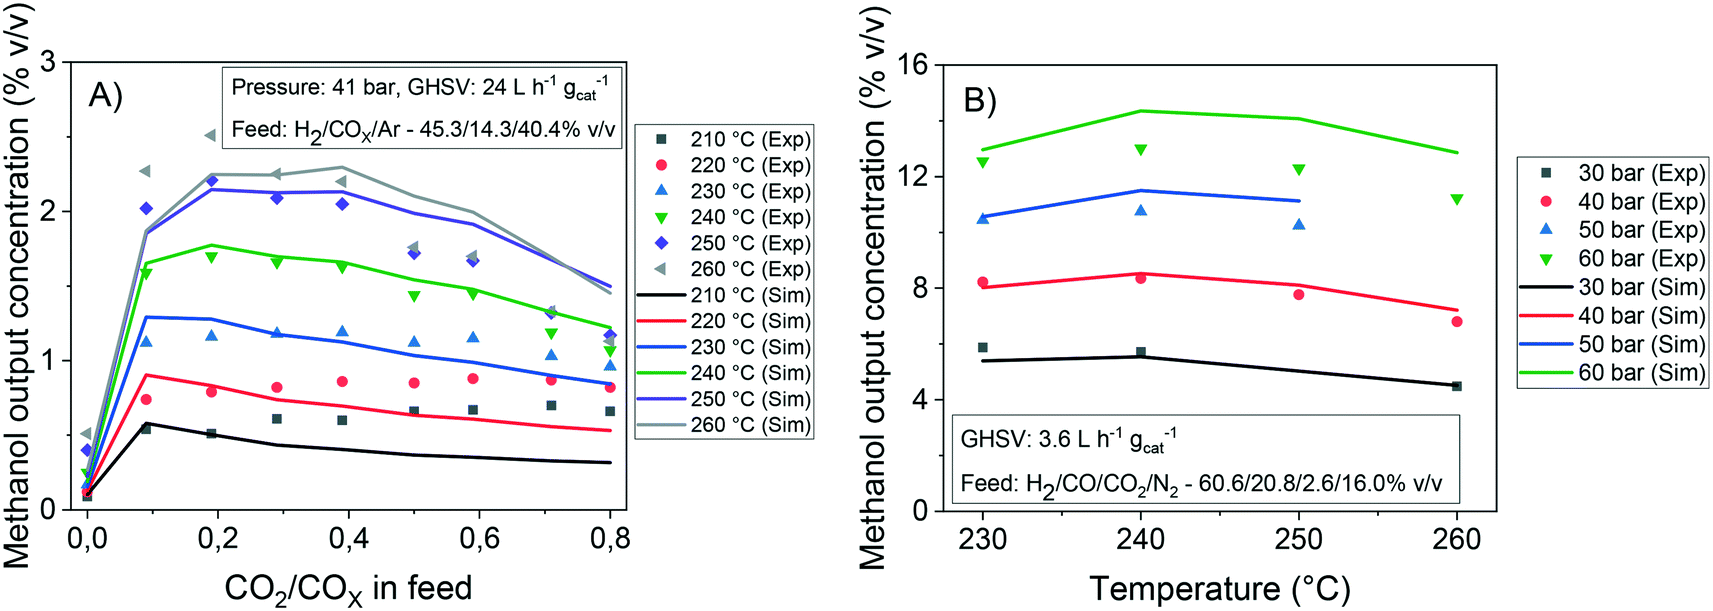 | ||
| Fig. 17 Experimental and simulated values of the methanol output concentration under different conditions. Databases: A) this work, B) Seidel et al.2 | ||
| Feed: | H2/CO/CO2 | H2/CO | H2/CO2 | All | |||||
|---|---|---|---|---|---|---|---|---|---|
| Data: | This work | Seidel et al. | Park et al. | This work | Seidel et al. | Seidel et al. | Slotboom et al. | ||
| N° of points | 324 | 46 | 98 | 35 | 61 | 32 | 94 | 690 | |
| χ 2 | 13.05 | 0.55 | 15.31 | 2.44 | 9.29 | 3.02 | 32.31 | 75.97 | |
| CO | ME | 0.0192 | 0.0431 | 0.1371 | 0.0105 | 0.0269 | 0.1751 | 0.2978 | 0.0830 |
| MSE | 0.0008 | 0.0035 | 0.0444 | 0.0002 | 0.0013 | 0.0342 | 0.1530 | 0.0295 | |
| CO2 | ME | 0.0227 | 0.0430 | 0.0601 | 0.0301 | 0.0309 | 0.0321 | ||
| MSE | 0.0010 | 0.0027 | 0.0067 | 0.0011 | 0.0017 | 0.0022 | |||
| CH3OH | ME | 0.1499 | 0.0643 | 0.2559 | 0.2299 | 0.3220 | 0.2275 | 0.3749 | 0.2128 |
| MSE | 0.0385 | 0.0057 | 0.1051 | 0.0695 | 0.1510 | 0.0535 | 0.1890 | 0.0785 | |
The reaction flow analysis and the sensitivity analysis have no significant changes compared to the originally published ones, with the exception being the zinc coverage profile, which has now constant values. The revised Fig. 11 is given below:
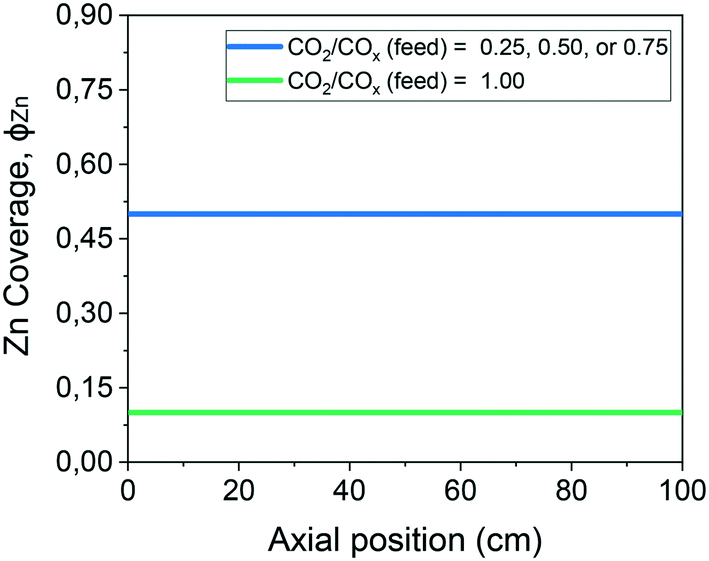 | ||
| Fig. 11 Zinc coverage along the methanol synthesis reactor with a length of 100 cm. Operating conditions: 220 °C, 60 bar, GHSV = 4.8 LS h−1 gcat−1, feed concentration: H2/COx = 80/20% v/v. | ||
The Royal Society of Chemistry apologises for these errors and any consequent inconvenience to authors and readers.
References
- E. B. Goos, A. Burcat and B. Ruscic, New NASA thermodynamic polynomials databasehttp://garfield.chem.elte.hu/Burcat/THERM.DAT Accessed Aug 2020 Search PubMed.
- C. Seidel, A. Jörke, B. Vollbrecht, A. Seidel-Morgenstern and A. Kienle, Kinetic modeling of methanol synthesis from renewable resources, Chem. Eng. Sci., 2018, 175, 130–138, DOI:10.1016/j.ces.2017.09.043.
- N. Park, M.-J. Park, Y.-J. Lee, K.-S. Ha and K.-W. Jun, Kinetic modeling of methanol synthesis over commercial catalysts based on three-site adsorption, Fuel Process. Technol., 2014, 125, 139–147, DOI:10.1016/j.fuproc.2014.03.041.
- Y. Slotboom, M. J. Bos, J. Pieper, V. Vrieswijk, B. Likozar, S. R. A. Kersten and D. W. F. Brilman, Critical assessment of steady-state kinetic models for the synthesis of methanol over an industrial Cu/ZnO/Al2O3 catalyst, Chem. Eng. J., 2020, 389, 124181, DOI:10.1016/j.cej.2020.124181.
- C. V. Ovesen, B. S. Clausen, J. Schiøtz, P. Stoltze, H. Topsøe and J. K. Nørskov, Kinetic Implications of Dynamical Changes in Catalyst Morphology during Methanol Synthesis over Cu/ZnO Catalysts, J. Catal., 1997, 168, 133–142, DOI:10.1006/jcat.1997.1629.
- J. D. Grunwaldt, A. M. Molenbroek, N. Y. Topsøe, H. Topsøe and B. S. Clausen, In Situ Investigations of Structural Changes in Cu/ZnO Catalysts, J. Catal., 2000, 194, 452–460, DOI:10.1006/jcat.2000.2930.
- S. Kuld, M. Thorhauge, H. Falsig, C. F. Elkjær, S. Helveg, I. Chorkendorff and J. Sehested, Quantifying the promotion of Cu catalysts by ZnO for methanol synthesis, Science, 2016, 352, 969–974, DOI:10.1126/science.aaf0718.
| This journal is © The Royal Society of Chemistry 2021 |