
 Open Access Article
 This Open Access Article is licensed under a Creative Commons Attribution-Non Commercial 3.0 Unported Licence
Dynamics of phase transitions in Na2TiO3 and its possible utilization as a CO2 sorbent: a critical analysis
Maria Valeria
Blanco
 *a,
Paula Macarena
Abdala
b,
Fabiana
Gennari
cde and
Federico
Cova
*a
*a,
Paula Macarena
Abdala
b,
Fabiana
Gennari
cde and
Federico
Cova
*a
aEuropean Synchrotron Radiation Facility, 71 Avenue des Martyrs, Grenoble, France. E-mail: federico.cova@csic.es
bDepartment of Mechanical and Process Engineering, ETH Zürich, Leonhardstrasse 21, CH-8092 Zurich, Switzerland
cConsejo Nacional de Investigaciones Científicas y Técnicas (CONICET), R8402AGP, S. C. de Bariloche, Río Negro, Argentina
dCentro Atómico Bariloche (CAB-CNEA), R8402AGP, S.C. de Bariloche, Río Negro, Argentina
eUniversidad Nacional de Cuyo (UNCuyo), Instituto Balseiro, Av. Bustillo 9500, R8402AGP Bariloche, Río Negro, Argentina
First published on 16th July 2021
Abstract
Na-Based materials are emerging as promising high-temperature CO2 sorbents. In this work, we provide a detailed study on the synthesis of Na2TiO3via a solid-state route using NaOH and TiO2 as starting reactants. The CO2 sorption properties of the synthesized Na2TiO3 were evaluated by thermogravimetric analysis. A subsequent comprehensive study on the complex reaction mechanism of Na2TiO3 at high temperatures under carbonation conditions was performed via real time in situ synchrotron X-ray diffraction analysis. In situ experiments performed under different conditions revealed the occurrence of thermally-driven phase transitions derived from the structural instability of the material at high temperatures. These reactions could be differentiated from carbonation processes, allowing the proposal of a reaction mechanism of the material as a CO2 sorbent. The obtained results can explain the abnormal dynamic thermogram displayed by Na2TiO3 in the presence of CO2 within a temperature range that is of interest for practical applications and serve as a basis for evaluating the feasibility of using this material in CO2 capture schemes.
1 Introduction
Global CO2 emissions have increased by about 90% in the last 50 years, with industrial processes and fossil fuel combustion being the two major contributors, and about 78% of the total increment having occurred in the period from 1970 to 2011.1 Since CO2 has been pointed out as mainly responsible for the greenhouse effect that drives global climate change, the development of strategies for mitigating its release to the atmosphere constitutes an essential prerequisite to prevent further global warming. A closer look into anthropogenic CO2 emissions shows that approximately 40% of them are generated by power plants.2 Hence, the design and engineering of materials and processes to capture and retain the CO2 before its release to the atmosphere appear as a viable alternative to tackle climate change, while transitioning to more sustainable and renewable power schemes.Solid sorbents have been proven to efficiently remove CO2 from high-temperature industrial gas streams,3–5 with promising results when implemented at a pilot scale in different coal-fired and cement plants.6,7 Indeed, these materials with the ability to react with CO2 at high temperatures have shown great potential for the separation of CO2 in sorption enhanced reaction processes (SERPs) for hydrogen production, CH4 + 2H2O → CO2 + 4H2,8,9 where the in situ CO2 removal shifts the equilibrium towards high-purity hydrogen production and increased hydrocarbon conversion. In the case of steam reforming processes (SESRs), continuous capture of CO2 can dramatically enhance H2 selectivity and avoid cooling processes.10,11 Therefore, solid sorbents can be applied in either pre-combustion or post-combustion CO2 capture schemes. Ideally, these materials should exhibit high sorption capacities, good regeneration capabilities and long-term stability, together with a low price.
Among proposed high-temperature solid CO2 sorbents,12 alkali and alkaline-earth oxides containing lithium, sodium, potassium, calcium and/or magnesium have shown promising properties towards CO2 capture. When reacting with CO2, these sorbents usually exhibit a temperature-dependent behaviour in which CO2 is first chemisorbed, producing an external shell composed of either Li2CO3, Na2CO3, K2CO3, CaCO3 or MgCO3. Once the temperature is high enough to activate diffusion processes, the reaction proceeds through the bulk of the particles.
Li-Based materials, such as Li4SiO4, Li2ZrO3, Li5AlO4 and Li2CuO2, have been widely studied as CO2 sorbents,13 displaying high sorption capacities within the temperature range of 400–700 °C.14–17 However, from a large-scale application perspective, low cost Na-based captors, such as Na2TiO3, Na2ZrO3, Na2SiO3 and Na4SiO4, are more attractive.18–21 The lower cost is usually associated with the manufacture process since, as a general rule, lithium oxides are more expensive than their sodium counterparts. Given that Na-based sorbents, such as Na2ZrO3, can reach CO2 sorption capacities very close to those of Li-based systems,22,23 it is important to further explore their properties and capabilities towards CO2 capture.
Na2TiO3 is a promising material for positive electrodes in Na-ion batteries24–26 and has also been proposed as a possible CO2 sorbent.22,27 Interestingly, the thermogram displayed by Na2TiO3 when subjected to a CO2 flow differs from those exhibited by other CO2 sorbents. The Na2TiO3 thermogram shows two weight increments, which are then followed by sequential weight decrements. This experimental evidence questions the stability Na2TiO3 at high temperatures and its ability to trap CO2. In addition to this, ex situ XRD characterization of Na2TiO3–CO2 reaction products showed the formation of Na2CO3, Na2O, m-Na4Ti5O12, h-Na4Ti5O12 and Na16Ti10O28 phases.27 The observation of these chemical species, together with the absence of TiO2, is indicative of the partial reaction of Na2TiO3 with CO2, and also suggests a complex temperature-dependent reaction mechanism. Despite the great effort to understand the reaction pathway of Na2TiO3–CO2 at high temperatures,27 the great likelihood of disproportionation of this material and its thermal instability makes standard characterization methods inaccurate. Instead, more sophisticated analysis tools that allow tracking in real time the structural changes occurring at high temperatures in the presence of CO2 need to be employed in order to describe the reaction path and better understand the behavior of the system under operative conditions.
In this work, we present thermodynamic calculations and experimental data on the synthesis of Na2TiO3via a solid-state route. Then, we show the benefits of using high temperature in situ synchrotron X-ray diffraction analysis to gain valuable insights on phase transformations that are difficult to detect by standard ex situ characterization techniques. In situ X-ray diffraction experiments revealed the occurrence of thermally driven structural changes of the material. These phase transformations could be differentiated from carbonation processes, allowing the proposal of a reaction mechanism of Na2TiO3 as a CO2 sorbent. The influence of the surrounding atmosphere on the carbonation kinetics and reaction path of Na2TiO3 at high temperatures is discussed.
2 Experimental
2.1 Material synthesis
Sodium hydroxide (millimeter spheres of NaOH, Biopack, purity 98%) and titanium dioxide (nanopowder of TiO2, Sigma, purity 99%, anatase ≈75 wt% and rutile ≈25 wt%) were used as starting materials. The synthesis of β-Na2TiO3 was performed as follows. A mixture of NaOH–TiO2 with a 2.1![[thin space (1/6-em)]](https://www.rsc.org/images/entities/char_2009.gif) :1 molar ratio was handled in an Ar-filled glove box and introduced into a milling chamber. The powder mixture was then milled in a planetary ball mill (Fritsch Pulverisette P6) for 15 min in an Ar atmosphere. The selected milling conditions included a ball to powder ratio of 40:1 and 400 rpm. After milling, the powders were pressed and heated in air at 800 °C for 5 h.
:1 molar ratio was handled in an Ar-filled glove box and introduced into a milling chamber. The powder mixture was then milled in a planetary ball mill (Fritsch Pulverisette P6) for 15 min in an Ar atmosphere. The selected milling conditions included a ball to powder ratio of 40:1 and 400 rpm. After milling, the powders were pressed and heated in air at 800 °C for 5 h.
2.2 Thermodynamic calculations
The equilibrium composition of the 2NaOH–TiO2 mixture as a function of temperature was calculated by a Gibbs free energy minimization method using HSC software (6.1 version).28 This method determines the equilibrium products at different temperatures and pressures for a heterogeneous system based on an extensive thermochemical database which contains enthalpy, entropy and heat capacity data of chemical compounds. The reaction system was specified in terms of the number of phases, species and the initial amount of reactants. The starting reaction system was composed of 2 kmol NaOH and 1 kmol TiO2 (75% anatase and 25% rutile) in the solid phase, and air (N2 = 78 kmol and O2 = 21 kmol O2) in the gas phase. The presence of H2O(l,g) was also contemplated. Several species were considered as possible in the solid phase: NaOH·H2O; Na2O; Na; NaH; Ti3O2; Ti2O3; Na2O2; Na2TiO3 (beta phase); Na2Ti2O5; Na2Ti3O7; Na2Ti6O13. Some sodium titanates (Na4Ti5O12, Na16Ti10O28) previously reported were not included in the equilibrium composition calculations because of the lack of thermodynamic properties reported in the literature. Calculations were carried out in the temperature range of 0–800 °C and at 1 atm.2.3 Characterization techniques
The structural and thermal properties of the samples were studied using X-ray powder diffraction (XRPD, Bruker D8 Advance) and simultaneous thermogravimetry and differential scanning calorimetry (TG-DSC, Linseis STA PT1600) coupled with mass spectroscopy (MS, ThermoStar Pfeiffer). Ex situ XRPD patterns were collected in the 2θ range of 10–80° with CuKα radiation, a voltage of 40 kV and an electric current of 40 mA. The thermal behaviour of the as-milled 2NaOH–TiO2 mixture was measured with a heating rate of 5 °C min−1 from room temperature to 800 °C under a synthetic air flow (50 cm3 min−1 STP). Dynamic CO2 capture measurements were carried out with a thermogravimetric instrument (TG-HP50, TA Instruments). The as-synthesized β-Na2TiO3 was heated from room temperature to 800 °C at a heating rate of 5 °C min−1 using a CO2 flow rate of 50 cm3 min−1 (STP).In situ synchrotron X-ray diffraction (XRD) measurements were performed at the beamline ID31 of the European Synchrotron Radiation Facility (ESRF). For this, β-Na2TiO3 samples were loaded into 1 mm outer diameter quartz capillaries and then subjected to different treatments: 1) dynamic heating under a N2 gas flow up to a final temperature of 615 °C, and then switching the gas to CO2 and maintaining isothermal conditions for 1 h; 2) heating under a N2 gas flow up to 770 °C and then switching the gas to CO2 and maintaining isothermal conditions for 1 h; 3) heating under a CO2 gas flow up to 770 °C and maintaining isothermal conditions. In all cases, the heating ramp was 5 °C min−1. A sketch of the experimental setup can be found elsewhere.29In situ synchrotron X-ray diffraction data were collected using a PerkinElmer detector, at a wavelength of 0.1771 Å and with a beamsize of 0.6 mm × 0.6 mm (V × H). Each frame was collected with an exposure time of 1 s. Data were processed using the pyFAI package.30 The analysis of selected diffraction peaks representative of different crystallographic phases was performed by curve fitting with the Gaussian function, using Fityk software.31 Rietveld refinements were performed using GSAS II software.32
3 Results and discussion
3.1 Synthesis and CO2 properties of the β-Na2TiO3 system
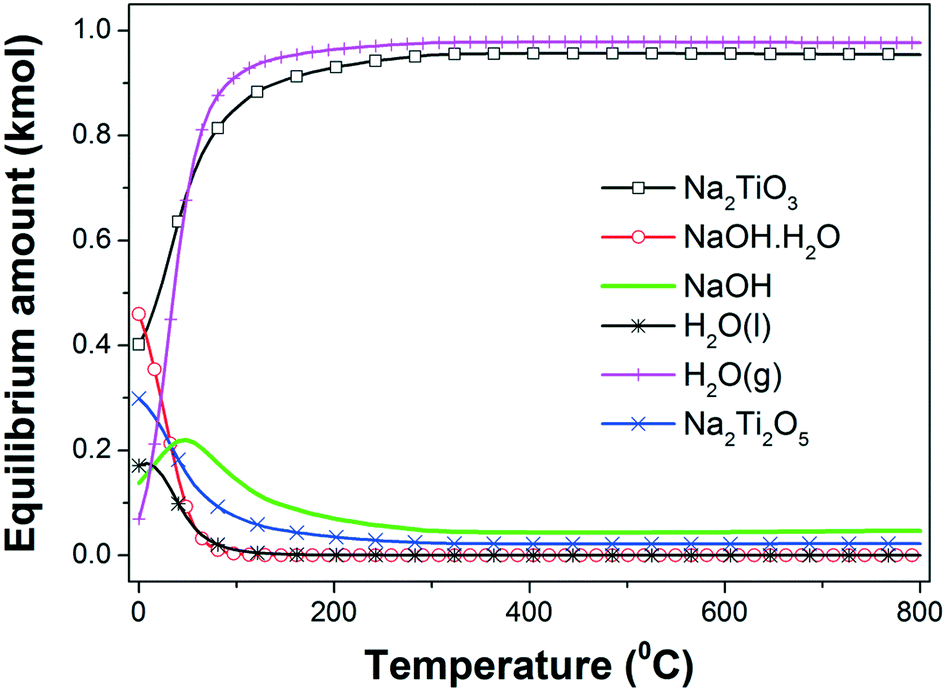 | ||
| Fig. 1 Equilibrium amount (kmol) of different species in the 2NaOH–TiO2 system as a function of temperature at 1 atm. | ||
The hydration of NaOH to NaOH·H2O at temperatures lower than 100 °C is promoted by the H2O formation. A progressive temperature rise to 300 °C increases the amounts of both β-Na2TiO3 and H2O(g), reaching for each phase a maximum amount that remains constant for higher temperatures. From the previous interpretations, it is possible to infer that the formation of β-Na2TiO3 is favored thermodynamically by heating of the starting mixture in air. The expected reaction at room temperature can be expressed as:
| 2NaOH(s) + TiO2(s) → Na2TiO3(s) + H2O(g) | (1) |
From the thermodynamic calculations, it is expected that the both formation of Na2Ti2O5 and β-Na2TiO3 will occur simultaneously from 0 °C; however, the Na2Ti2O5 amount decreases to a minimum value with the temperature rising to 200 °C. A possible formation reaction is:
| 2NaOH(s) + 2TiO2(s) → Na2Ti2O5(s) + H2O(l,g) | (2) |
As the temperature increases from 0 °C, Na2Ti2O5 is the only titanium source to induce the production of an extra amount of β-Na2TiO3, consuming NaOH:
| 2NaOH(s) + Na2Ti2O5(s) → 2Na2TiO3(s) + H2O(g) | (3) |
Reactions (2) and (3) are also thermodynamically favorable above 0 °C and 100 °C, respectively.
Previous thermodynamic analysis determined the on-going reactions in the absence of any restrictions caused by kinetics and/or transport phenomena and can serve as a benchmark to compare with the experimental results. In order to evaluate the reactivity of the 2NaOH–TiO2 mixture for the synthesis of β-Na2TiO3, TG-DSC measurements were combined with MS analysis (Fig. 2). The TG curve of the as-milled 2NaOH–TiO2 powder shows a sharp weight loss of 13% between 50 and 200 °C, which correlates with an endothermic peak in the DSC curve. According to MS analysis, this sharp weight loss can be ascribed mainly to water evolution due to the formation of Na2TiO3 (reaction (1), theoretical value of 11.3%) and also attributable to dehydration from pre-adsorbed water on NaOH. As the temperature increases up to 800 °C, the weight loss progresses to 20% and MS analysis evidences gradual water and CO2 evolution. In the DSC curve, no melting of pure NaOH or melting of the NaOH–Na2CO3 eutectic mixture33 was observed. These events are expected at about 320 °C and 282 °C, respectively. Their absence indicates that NaOH was completely consumed at temperatures lower than 282 °C and/or NaOH partially reacted with CO2 present in the air during handling, forming Na2CO3.34 CO2 detection by MS reveals CO2 release, evidenced by the occurrence of: a small bump at 100 °C, a gradual decline observed in the curve starting from low temperatures, and a peak between 600 and 700 °C. These events indicate that slight CO2 adsorption occurred prior to the thermal analysis run. Additionally, an exothermic peak at 685 °C was identified and is analyzed in the following paragraph.
 | ||
| Fig. 2 Weight loss (in%), heat flow (μ V) and gas evolved (H2O and CO2) during heating of as-milled 2NaOH–TiO2 in synthetic air. | ||
The ex situ XRPD patterns of the products obtained at different reaction temperatures are displayed in Fig. 3. As reference, the XRPD patterns of nano-TiO2 and as-milled 2NaOH–TiO2 powders are also included (Fig. 3a and b). After milling, the anatase and rutile phases of TiO2 remain, while Na2CO3 is formed due to carbonation of NaOH during the XRD measurement in air (Fig. 3b). Thus, milling processes promote a high degree of mixing of the starting reactants, independent of the starting size of the powders. Heating at 650 °C induces the formation of α-Na2TiO3 (Fig. 3c) simultaneous with minor CO2 release, as inferred from the TG curve. The most intense diffraction peaks of Na2CO3 are still detected, with very low intensity. At 800 °C, the main phase obtained is β-Na2TiO3 with Na16Ti10O28 (Fig. 3d). Prolonged heating at 800 °C favors the complete crystallization of β-Na2TiO3 (Fig. 3e). From the XRD and TG-DSC results, it can be speculated that at 685 °C, transformation between α- and β-Na2TiO3 occurred during heating, in agreement with previous studies using fine rutile-TiO2.34
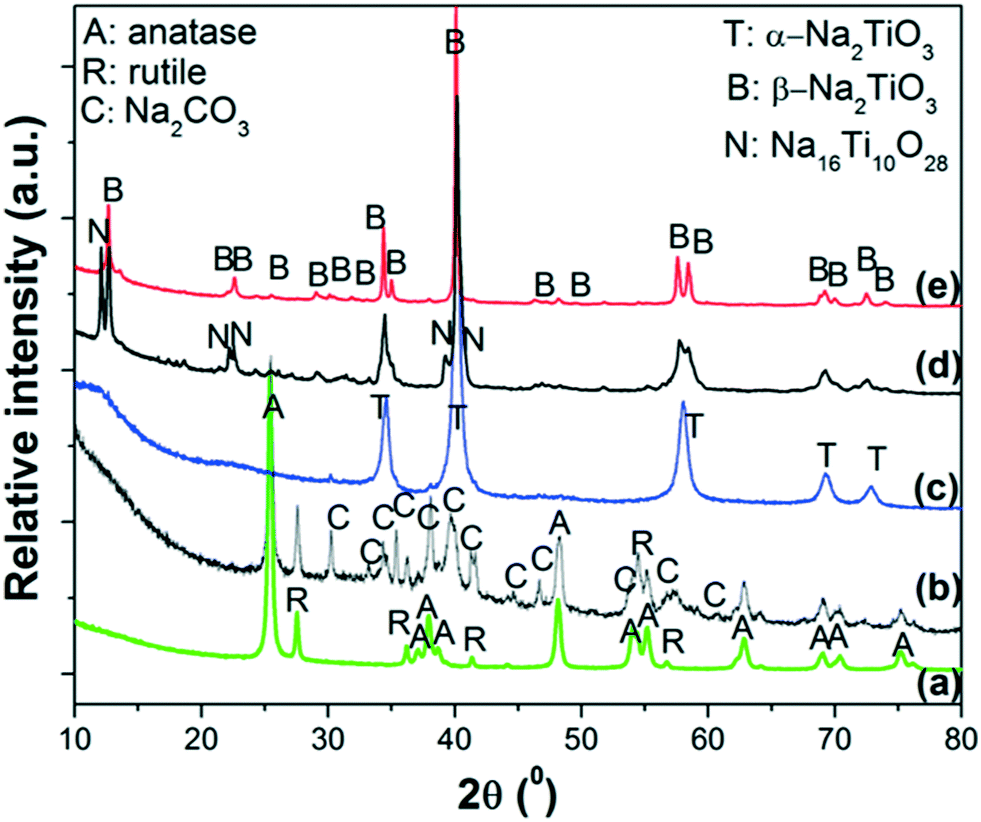 | ||
| Fig. 3 XRPD patterns of: a) starting powders of nano-TiO2; b) as-milled 2NaOH–TiO2 mixture; heating up to c) 650 °C, d) 800 °C and e) 800 °C, 5 h. Heating ramp: 5 °C min−1 in synthetic air. | ||
Some correlations can be made by comparison of the TG-DSC-MS results, XRPD studies and thermodynamic calculations. TG-DSC-MS measurements show the high reactivity between NaOH and TiO2 at temperatures lower than 200 °C, with H2O evolution due to reaction (1) and, as a consequence, NaOH dehydration. This reaction continues as the temperature increases, showing progressive H2O release. Similar predictions were obtained from the thermodynamic calculations up to 200 °C. However, equilibrium calculations anticipate that the reaction between NaOH and TiO2 is almost completed at 300 °C, with the difference from experimental results being ascribed to kinetic factors. The tests show the formation of metastable α-Na2TiO3 at 650 °C, which transforms to β-Na2TiO3 upon heating. The phase transformation towards the formation of β-Na2TiO3 progresses during the temperature ramp up to 800 °C, however upon reaching this temperature the reaction is still incomplete and requires additional time at this temperature to achieve completion. Although α-Na2TiO3 and Na16Ti10O28 were identified at different temperatures, their formation could not be derived from thermodynamic calculations due to the lack of thermochemical data. Heating for 5 h produces β-Na2TiO3 as a single phase. Therefore, nano-TiO2 reacts with NaOH at the beginning of heating, producing water, forming α-Na2TiO3 as an intermediate phase and finally producing β-Na2TiO3 at 800 °C after prolonged heating.
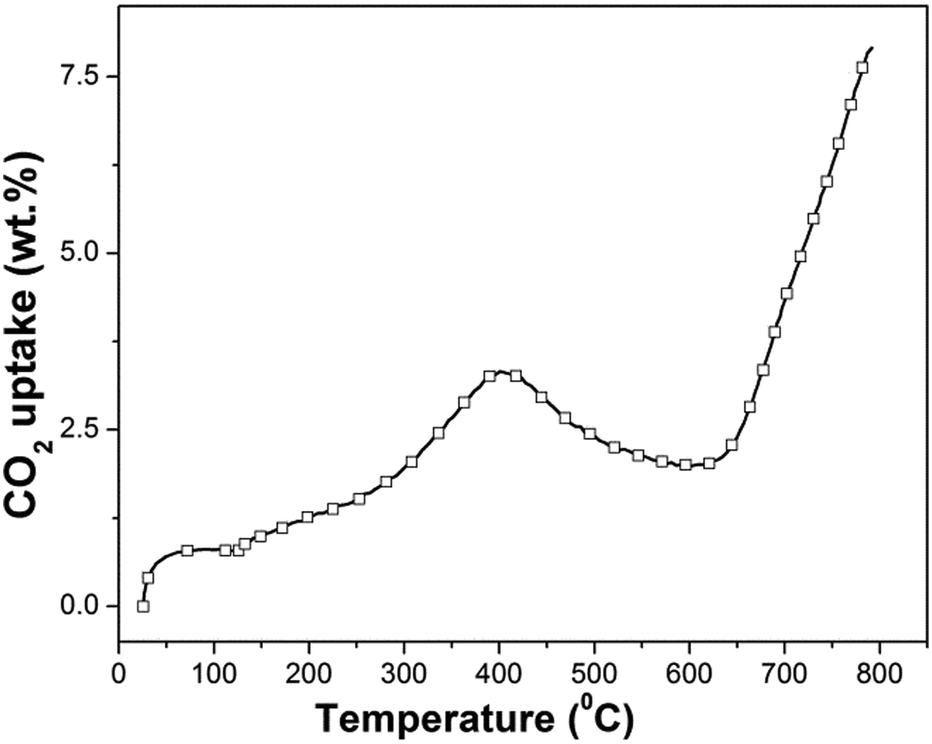 | ||
| Fig. 4 Dynamic thermogravimetric analysis of synthesized β-Na2TiO3. Heating ramp: 5 °C min−1; 50 cm3 min−1 STP of CO2. | ||
The dynamic thermogram showing a weight increment followed by a weight decrement, and a subsequent weight increment, is not in line with previous results reported for other CO2 sorbents, which typically exhibit two consecutive weight increments as a function of increasing temperature (the first one is associated with CO2 chemisorption and the second one is associated with CO2 absorption). However, our results show similarities to the only non-isothermal previous study on Na2TiO3,27 although there are differences in the temperature ranges where the CO2 capture and weight loss were observed. In the above-mentioned report, the authors attribute the abnormal dynamic thermogram of Na2TiO3 to a different temperature-dependent CO2 capture reaction mechanism, and to the poor thermal stability of the ceramic.
3.2 In situ synchrotron X-ray diffraction analysis
Three in situ XRD experiments were carried out with the aim of understanding: 1) the reaction mechanism of Na2TiO3 during high temperature carbonation, and 2) the effect of the initial atmosphere on the reaction path and kinetics.The experiments involved dynamic heating under either a N2 or CO2 flow followed by isothermal conditions at selected temperatures under a CO2 gas flow. The proposed measurements allowed distinguishing structural changes derived from the reaction of Na2TiO3 with CO2 from thermally driven changes that may occur due to the instability of the material. Furthermore, the preheating of the samples under a N2 flow allowed mimicking the procedure commonly used to characterize carbonation reaction products by ex situ methods. In this procedure, samples are first heated to a selected temperature under an inert gas atmosphere and then exposed to CO2 for 1 or 2 hours. Therefore, the obtained results also will serve to visualize the limitations that these procedures might present for obtaining an accurate description of high temperature carbonation reactions. This is essential to relate chemical processes to dynamic TG CO2 sorption curves.
| 5Na2TiO3 → Na4.33Ti5O12 + 2.835Na2O + 0.0825O2 | (4) |
| 5Na2TiO3 → Na4Ti5O12 + 3Na2O | (5) |
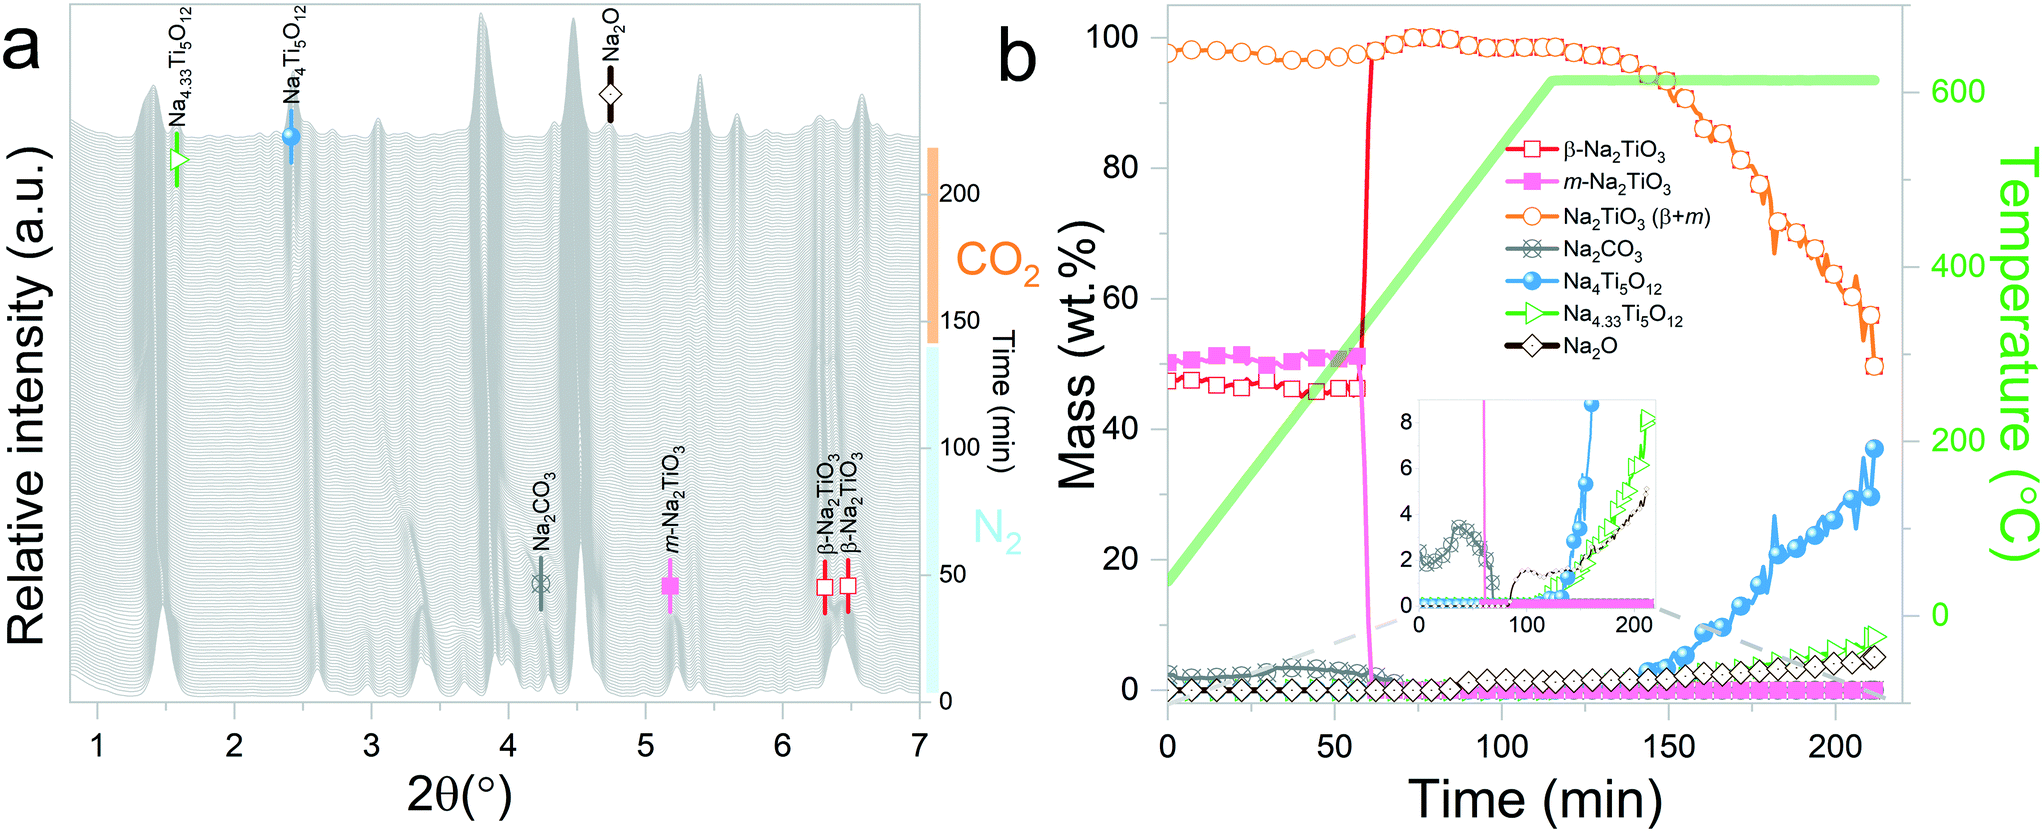 | ||
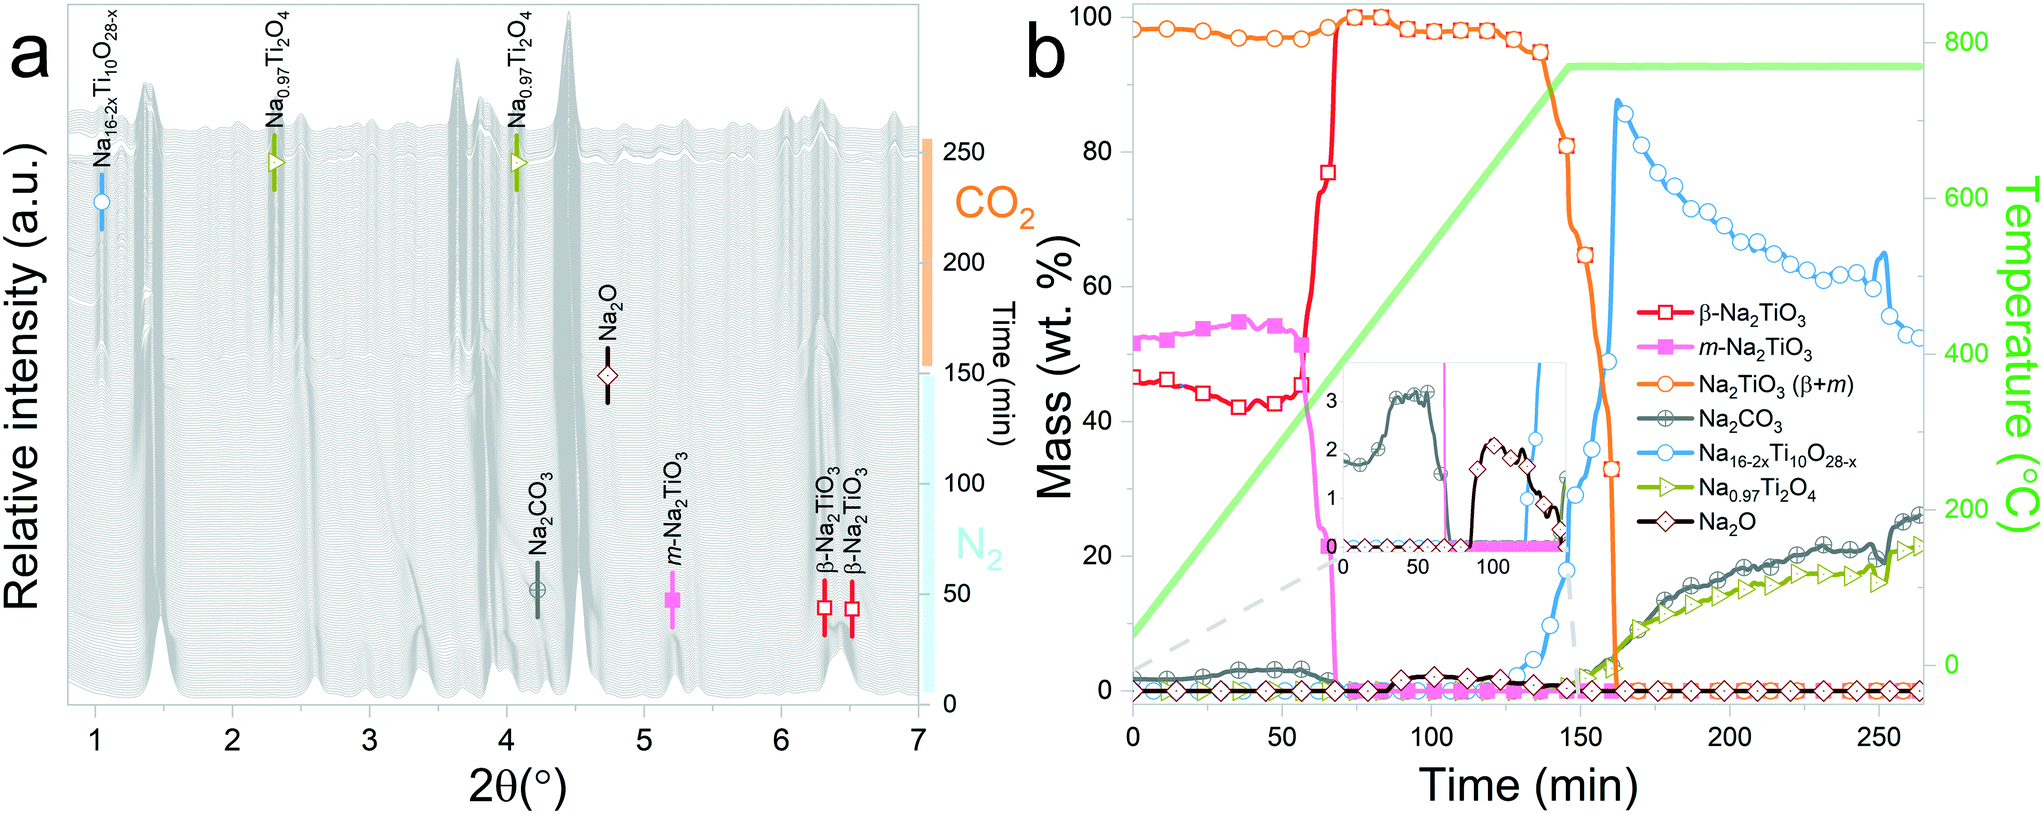
| Fig. 5 Na2TiO3 heating under a N2 flow until 615 °C, followed by isothermal conditions under a CO2 gas flow: a) evolution of X-ray diffraction patterns upon heating; b) phase evolution (wt%) as a function of time and temperature. | ||
Sánchez-Camacho et al.27 propose reaction (6) as an intermediary step for reaction (5), suggesting that Na2CO3 is not observed because it immediately decomposes following reaction (7).
| 5Na2TiO3 + 3CO2 → 3Na2CO3 + Na4Ti5O12 | (6) |
| Na2CO3 → CO2 + Na2O(sub) | (7) |
| 10Na2TiO3 → Na16Ti10O28 + 2Na2O | (8) |
 | ||
| Fig. 6 Na2TiO3 heating under a N2 flow until 770 °C, followed by isothermal conditions under a CO2 gas flow: a) evolution of X-ray diffraction patterns upon heating; b) phase evolution (wt%) as a function of time and temperature. | ||
Interestingly, it should be noticed that in the previously mentioned work, the proposed reaction pathway considers β-Na2TiO3 carbonation as an intermediary step for reaction (8). However, our results show that reaction (8) occurs even in the absence of CO2. The results from these measurements also confirm the proposition of Sánchez-Camacho27 regarding eqn (6) being a required intermediary step for reaction (5), since this decomposition to Na4Ti5O12 is not observed under a N2 flow. Peaks belonging to Na2O can also be observed up to 770 °C, the temperature at which the sample atmosphere is changed to CO2. At this stage, new reflections emerge, indicating the formation of an additional phase. The new peaks were indexed to the Na0.97Ti2O4 phase (04-014-7035 PDF file). Since this transition only occurs in the presence of a CO2 gas flow, it is possible to assume that Na2CO3 plays a role as an intermediate product of this decomposition. A possible reaction path is presented in eqn (9).
| 2Na16Ti10O28 + 11.15CO2 → 10Na0.97Ti2O4 + 11.15Na2CO3 + 2.425O2 | (9) |
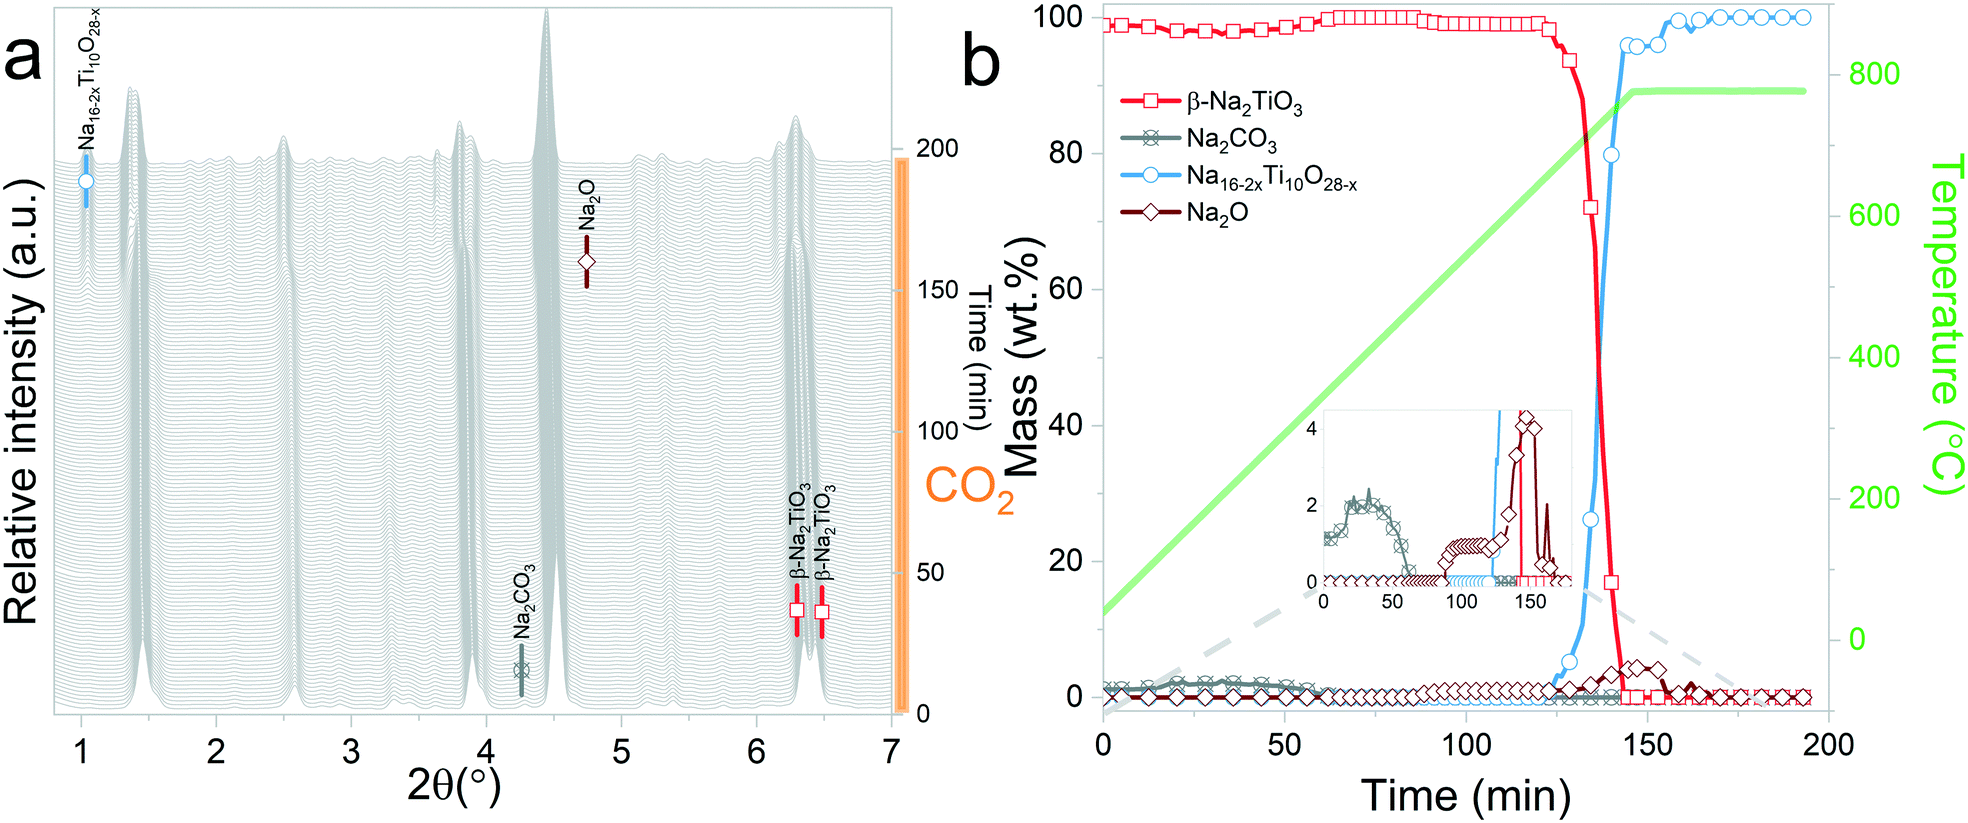 | ||
| Fig. 7 Na2TiO3 heating under a CO2 gas flow, followed by isothermal conditions at 770 °C: a) evolution of X-ray diffraction patterns during heating; b) phase evolution (wt%) as a function of time and temperature. | ||
At the initial stages of heating, the XRD patterns display an almost negligible amount of Na2CO3, which is evidenced by the presence of the two main peaks corresponding to this phase at 2θ = 3.989° (overlapping with a secondary peak of Na2TiO3) and 2θ = 4.289°. During the first stage of the heating process, a slight increment in the amount of carbonate can be observed, but after reaching 300 °C, it starts to diminish. At 350 °C, no trace of Na2CO3 can be detected. Between 350 °C and 660 °C, β-Na2TiO3 is the only phase remaining. This is consistent with the TG results shown in Fig. 4, and also with previously reported curves,27 in which the absorption of CO2 into similar samples is only observed at temperatures starting from 675 °C. At this temperature, a phase change occurs, evidenced by the subtle appearance of new peaks. Some of these new peaks match the ones observed in the previous measurement, indicating the presence of a Na16Ti10O28-like structure. In this case, due to the higher abundance of this phase, it was possible to perform a deeper analysis of the XRD data. A refinement of the final diffractogram (Fig. 8) showed a higher number of sodium and oxygen vacancies compared to the one observed by Sánchez-Camacho et al.,27 indicating a composition more in line with a Na16−2xTi10O28−x formula, with x in the range 0.1–0.25. This leads to a slightly modified eqn (8) as follows:
| 10Na2TiO3 → Na16−2xTi10O28−x + (2 + x)Na2O | (10) |
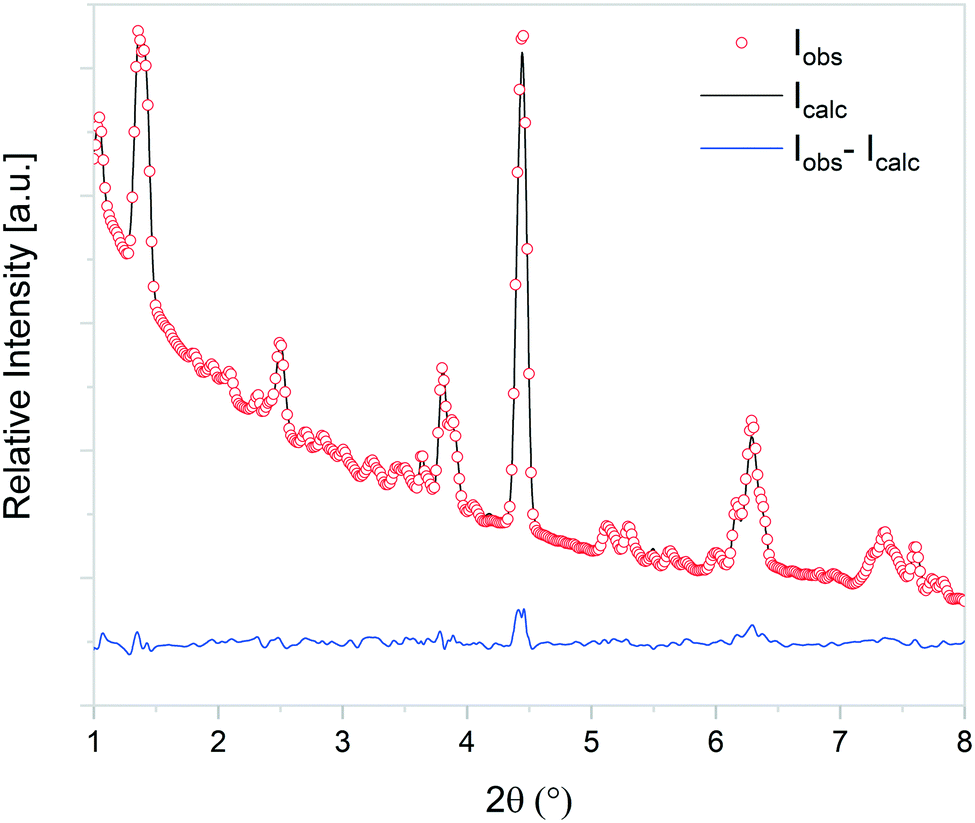 | ||
| Fig. 8 Observed (open circles) and calculated (line) X-ray diffraction patterns of Na16−2xTi10O28−x, with x in the range 0.1–0.25. | ||
By observing Fig. 7, it is clear that a second reaction resulting in the formation of Na0.97Ti2O4 does not occur. This is difficult to understand since at this stage, the temperature and gas flow conditions are comparable to those in the previous experiment. A possible explanation is that the CO2 gas flow generates a change in the morphology of Na2TiO3 by preventing the first transition towards the monoclinic phase. These changes then are transferred to Na16−2xTi10O28−x, inhibiting the further decomposition of the titanate. As it can be observed from Fig. 5, reaction (9) is very slow, so it may be possible that an unfavorable particle morphology, such as larger crystallite sizes33 or larger diffusion paths, could make this reaction impossible to see in the time frame of the experiment. A closer inspection toward the last XRD pattern from these measurements showed a faint hint of the characteristic peak of Na0.97Ti2O4 at 2θ = 1.9°. This different morphology could also be an explanation about why the decomposition into Na4Ti5O12 and Na4.33Ti5O12 is not observed here, since those two reactions are much slower than the decomposition to Na16−2xTi10O28−x, as can be seen by comparing Fig. 5b and 6b.
3.3 Effect of the initial atmosphere on the Na2TiO3–CO2 reaction pathway
In situ X-ray diffraction analysis for real-time monitoring of chemical reactions on CO2 capture materials15,37–40 has been proven to be a useful tool to understand the behaviour of CO2 sorbents at temperatures that are relevant for real applications, allowing the identification of structural changes, to reveal intermediate phases and re-conversion processes occurring during operational conditions29,41 and to investigate the impact of the presence of H2O in the gas stream.42 However, due to the limited access to powerful X-ray probes, many reports have proposed carbonation mechanisms of these materials based on ex situ X-ray diffraction data.27,43 Typically, ex situ samples are obtained after heating different samples under an inert atmosphere, switching the gas flow to CO2 once the desired temperature is reached and then maintaining isothermal conditions for a couple of hours. The results obtained by these procedures can provide valuable insights into the reaction mechanism of CO2 sorbents. However, the results presented in this work indicate that thermal preheating under an inert atmosphere can severely affect the structure of the sorbent prior to its exposure to CO2. In Fig. 9ab and , a selected 2θ region in which Na2TiO3 is heated under a N2 and CO2 gas flow, respectively, is displayed. From Fig. 9a, it can be observed that there is a transition from monoclinic Na2TiO3 to β-Na2TiO3 when the sample is subjected to a N2 flow. As shown in the previous subsection, these structural changes can influence the further dynamic evolution of the material by either slowing or speeding up the next reaction steps. Although these transitions are difficult to observe with traditional methods, they are critical to explain the dynamic CO2 capture thermograms. This further emphasizes the need for in situ tools to obtain an accurate description of the CO2 capture performance of sorbent materials.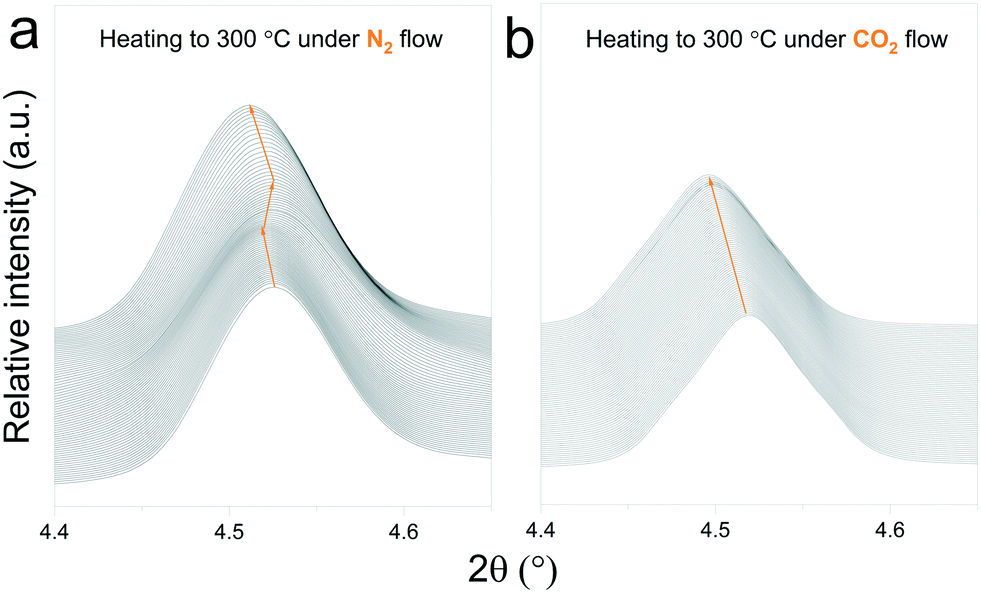 | ||
| Fig. 9 Structural changes of Na2TiO3 under dynamic heating at a ramp of 5 °C min−1 under a N2 flow (a) and CO2 flow (b). | ||
4 Conclusions
Na2TiO3 was successfully synthesized from NaOH and TiO2via a solid state route, where the powder mixture was heat treated at 800 °C for 5 h. The CO2 sorption properties of synthesized Na2TiO3 were analyzed by dynamic thermogravimetric analysis.In situ synchrotron XRD analysis, performed to study the reaction mechanism of Na2TiO3 at high temperatures in the presence of CO2, revealed the complex behaviour of the Na–Ti–O system. With the aim of differentiating phase transformations driven by carbonation processes from those occurring as a consequence of the thermal stability of the ceramic, the high temperature behavior of Na2TiO3 under different gas flows was studied. A careful analysis of Na2TiO3 phase transitions showed that its structure can be strongly influenced by the surrounding atmosphere.
At 40 °C, samples subjected to a N2 flow show the presence of β-Na2TiO3 and monoclinic Na2TiO3 phases, while the sample subjected to a CO2 flow showed no evidence of the latter. This difference in composition disappears upon heating, when the monoclinic phase reverts to β-Na2TiO3. Further heating at temperatures above 650 °C causes β-Na2TiO3 to transition to Na16−2xTi10O28−x. This transition occurs under either a pure N2 or CO2 gas flow. However, at this point, while the samples have reached a similar situation in terms of phase composition and environmental conditions, the previous history of the sample seems to play a role in the kinetic behaviour of the system. In both cases, when subjected to a CO2 flow, Na16−2xTi10O28−x undergoes a carbonation process. However, although both samples showed similar reaction paths, considerable differences in the reaction kinetics between both have been observed. The retardation effect observed for the sample preheated under CO2 is evident in the results, and it can be attributed to morphological differences related to the lack of transition from the monoclinic phase, which could influence the diffusion processes required for the carbonation of Na16−2xTi10O28−x.
The differences found when subjecting Na2TiO3 to different atmospheres upon heating demonstrate that in situ XRD characterization is essential to monitor in real time the structural changes that occur to the system and to correlate them to dynamic TG observations, providing a much reliable insight on the chemical processes that take place during sorption reactions.
Conflicts of interest
“There are no conflicts to declare”.Acknowledgements
The authors thank the European Synchrotron Radiation Facility for in-house beamtime allocation and financial support, and Florian Rusello and Tiago Coutinho for their help with the preparation of the experimental setup. This work was partially supported by CONICET, ANPCyT – (PICT 2018-00606), CNEA and Cuyo University.Notes and references
- O. US EPA, Global Non-CO2 GHG Emissions: 1990–2030, 2016, https://www.epa.gov/global-mitigation-non-co2-greenhouse-gases/global-non-co2-ghg-emissions-1990-2030 Search PubMed.
- A. Alonso, J. Moral-Vico, A. Abo Markeb, M. Busquets-Fité, D. Komilis, V. Puntes, A. Sánchez and X. Font, Sci. Total Environ., 2017, 595, 51–62 CrossRef CAS PubMed.
- Q. Wang, J. Luo, Z. Zhong and A. Borgna, Energy Environ. Sci., 2011, 4, 42–55 RSC.
- A. Samanta, A. Zhao, G. K. H. Shimizu, P. Sarkar and R. Gupta, Ind. Eng. Chem. Res., 2012, 51, 1438–1463 CrossRef CAS.
- J. Wang, L. Huang, R. Yang, Z. Zhang, J. Wu, Y. Gao, Q. Wang, D. O'Hare and Z. Zhong, Energy Environ. Sci., 2014, 7, 3478–3518 RSC.
- M. G. Plaza, S. Martínez and F. Rubiera, Energies, 2020, 13, 5692 CrossRef CAS.
- T. O. Nelson, A. Kataria, P. Mobley, M. Soukri and J. Tanthana, Energy Procedia, 2017, 114, 2506–2524 CrossRef CAS.
- E. R. van Selow, P. D. Cobden, P. A. Verbraeken, J. R. Hufton and R. W. van den Brink, Ind. Eng. Chem. Res., 2009, 48, 4184–4193 CrossRef CAS.
- P. Pecharaumporn, S. Wongsakulphasatch, T. Glinrun, A. Maneedaeng, Z. Hassan and S. Assabumrungrat, Int. J. Hydrogen Energy, 2019, 44, 20663–20677 CrossRef CAS.
- B. Dou, C. Wang, Y. Song, H. Chen, B. Jiang, M. Yang and Y. Xu, Renewable Sustainable Energy Rev., 2016, 53, 536–546 CrossRef CAS.
- C. S. Martavaltzi, E. P. Pampaka, E. S. Korkakaki and A. A. Lemonidou, Energy Fuels, 2010, 24, 2589–2595 CrossRef CAS.
- D. M. D'Alessandro, B. Smit and J. R. Long, Angew. Chem., Int. Ed., 2010, 49, 6058–6082 CrossRef.
- Y. Zhang, Y. Gao, H. Pfeiffer, B. Louis, L. Sun, D. O'Hare and Q. Wang, J. Mater. Chem. A, 2019, 7, 7962–8005 RSC.
- Y. Hu, W. Liu, Y. Yang, M. Qu and H. Li, Chem. Eng. J., 2019, 359, 604–625 CrossRef CAS.
- M. L. Grasso, M. V. Blanco, F. Cova, J. A. González, P. A. Larochette and F. C. Gennari, Phys. Chem. Chem. Phys., 2018, 20, 26570–26579 RSC.
- C. Wang, B. Dou, Y. Song, H. Chen, Y. Xu and B. Xie, Ind. Eng. Chem. Res., 2014, 53, 12744–12752 CrossRef CAS.
- T. Ávalos Rendón, J. Casa-Madrid and H. Pfeiffer, J. Phys. Chem. A, 2009, 113, 6919–6923 CrossRef PubMed.
- Q. Zheng, L. Huang, Z. Zhong, B. Louis and Q. Wang, Chem. Eng. J., 2020, 380, 122444 CrossRef.
- G. Ji, M. Z. Memon, H. Zhuo and M. Zhao, Chem. Eng. J., 2017, 313, 646–654 CrossRef CAS.
- R. Rodríguez-Mosqueda and H. Pfeiffer, J. Phys. Chem. C, 2013, 117, 13452–13461 CrossRef.
- J. Liu, Z. Wang, Z. Wang, J. Song, G. Li, Q. Xu, J. You, H. Cheng and X. Lu, Phys. Chem. Chem. Phys., 2019, 21, 13135–13143 RSC.
- A. López-Ortiz, N. G. P. Rivera, A. R. Rojas and D. L. Gutierrez, Sep. Sci. Technol., 2005, 39, 3559–3572 CrossRef.
- G. Ji, H. Yang, M. Z. Memon, Y. Gao, B. Qu, W. Fu, G. Olguin, M. Zhao and A. Li, Appl. Energy, 2020, 267, 114874 CrossRef CAS.
- S. Song, M. Kotobuki, Y. Chen, S. Manzhos, C. Xu, N. Hu and L. Lu, Sci. Rep., 2017, 7, 373 CrossRef.
- T. Kobayashi, W. Zhao, H. B. Rajendra, K. Yamanaka, T. Ohta and N. Yabuuchi, Small, 2020, 16, 1902462 CrossRef CAS.
- Q. Liu, Z. Hu, W. Li, C. Zou, H. Jin, S. Wang, S. Chou and S.-X. Dou, Energy Environ. Sci., 2021, 14, 158–179 RSC.
- P. Sánchez-Camacho, I. C. Romero-Ibarra, Y. Duan and H. Pfeiffer, J. Phys. Chem. C, 2014, 118, 19822–19832 CrossRef.
- H. Outokumpu, HSC Chemistry For Windows Version 6.1, 2009 Search PubMed.
- F. Cova, G. Amica, K. Kohopää and M. V. Blanco, Inorg. Chem., 2019, 58, 1040–1047 CrossRef CAS.
- J. Kieffer and D. Karkoulis, J. Phys.: Conf. Ser., 2013, 425, 202012 CrossRef.
- M. Wojdyr, J. Appl. Crystallogr., 2010, 43, 1126–1128 CrossRef CAS.
- B. H. Toby and R. B. Von Dreele, J. Appl. Crystallogr., 2013, 46, 544–549 CrossRef CAS.
- F. Meng, Y. Liu, T. Xue, Q. Su, W. Wang and T. Qi, RSC Adv., 2016, 6, 112625–112633 RSC.
- M. L. Grasso, P. Arneodo Larochette and F. C. Gennari, J. CO2 Util., 2020, 38, 232–240 CrossRef CAS.
- A. Boultif and D. Louër, J. Appl. Crystallogr., 2004, 37, 724–731 CrossRef CAS.
- M. Mayer and G. Perez, Rev. Chim. Miner., 1976, 13, 237–242 CAS.
- R. Molinder, T. P. Comyn, N. Hondow, J. E. Parker and V. Dupont, Energy Environ. Sci., 2012, 5, 8958–8969 RSC.
- M. T. Dunstan, S. A. Maugeri, W. Liu, M. G. Tucker, O. O. Taiwo, B. Gonzalez, P. K. Allan, M. W. Gaultois, P. R. Shearing, D. A. Keen, A. E. Phillips, M. T. Dove, S. A. Scott, J. S. Dennis and C. P. Grey, Faraday Discuss., 2016, 192, 217–240 RSC.
- A. Biasin, C. U. Segre and M. Strumendo, Cryst. Growth Des., 2015, 15, 5188–5201 CrossRef CAS.
- J. Manuel Valverde, A. Perejon, S. Medina and L. A. Perez-Maqueda, Phys. Chem. Chem. Phys., 2015, 17, 30162–30176 RSC.
- M. V. Blanco, K. Kohopää, I. Snigireva and F. Cova, Chem. Eng. J., 2018, 354, 370–377 CrossRef CAS.
- J. M. Valverde and S. Medina, Phys. Chem. Chem. Phys., 2017, 19, 7587–7596 RSC.
- F. Durán-Muñoz, I. C. Romero-Ibarra and H. Pfeiffer, J. Mater. Chem. A, 2013, 1, 3919–3925 RSC.
| This journal is © The Royal Society of Chemistry 2021 |