
 Open Access Article
 This Open Access Article is licensed under a
 Creative Commons Attribution 3.0 Unported Licence
Surface reaction kinetics of the methanol synthesis and the water gas shift reaction on Cu/ZnO/Al2O3†
Bruno
Lacerda de Oliveira Campos
 a,
Karla
Herrera Delgado
*a,
Stefan
Wild
a,
Felix
Studt
ab,
Stephan
Pitter
a and
Jörg
Sauer
a
a,
Karla
Herrera Delgado
*a,
Stefan
Wild
a,
Felix
Studt
ab,
Stephan
Pitter
a and
Jörg
Sauer
a
aInstitute for Catalysis Research and Technology (IKFT), Karlsruhe Institute of Technology (KIT), Hermann-von-Helmholtz-Platz 1, 76344 Eggenstein-Leopoldshafen, Germany. E-mail: karla.herrera@kit.edu; Tel: +49 721 608 28631
bInstitute for Chemical Technology and Polymer Chemistry (ITCP), Karlsruhe Institute of Technology (KIT), Engesserstr. 18-20, 76131 Karlsruhe, Germany
First published on 19th March 2021
Abstract
A three-site mean-field extended microkinetic model was developed based on ab initio DFT calculations from the literature, in order to simulate the conversion of syngas (H2/CO/CO2) to methanol on Cu (211) and Cu/Zn (211). The reaction network consists of 25 reversible reactions, including CO and CO2 hydrogenation to methanol and the water-gas shift reaction. Catalyst structural changes are also considered in the model. Experiments were performed in a plug flow reactor on Cu/ZnO/Al2O3 at various gas hourly space velocities (24–40 L h−1 gcat−1), temperatures (210–260 °C), pressures (40–60 bar), hydrogen feed concentrations (35–60% v/v), CO feed concentrations (3–30% v/v), and CO2 feed concentrations (0–20% v/v). These experiments, together with experimental data from the literature, were used for a broad validation of the model (a total of 690 points), which adequately reproduced the measurements. A degree of rate control analysis showed that the hydrogenation of formic acid is the major rate controlling step, and formate is the most sensitive surface species. The developed model contributes to the understanding of the reaction kinetics, and should be applicable for industrial processes (e.g. scale-up and optimization).
1 Introduction
Methanol is a viable high-value energy carrier and a key intermediate in the chemical industry, as it can be used in many energy and chemical production applications.1,2 Methanol is synthesized from syngas (H2/CO/CO2), which is industrially produced from natural gas and coal.3 However, because of concerns regarding CO2 emissions and encouragements to the development of sustainable processes using renewable energy sources, alternatives to the generation of syngas are in the focus of worldwide research. Promising approaches include the gasification of biomass4,5 and the use of green electricity (e.g. from solar and wind power) to generate hydrogen via water electrolysis,6 further mixing it with carbon dioxide (e.g. from the flue gas of a process).7 Thereby, the importance of the methanol synthesis will increase, as the conversion of hydrogen to secondary energy carriers is crucial.8 A scheme with the mentioned process steps is shown in Fig. 1.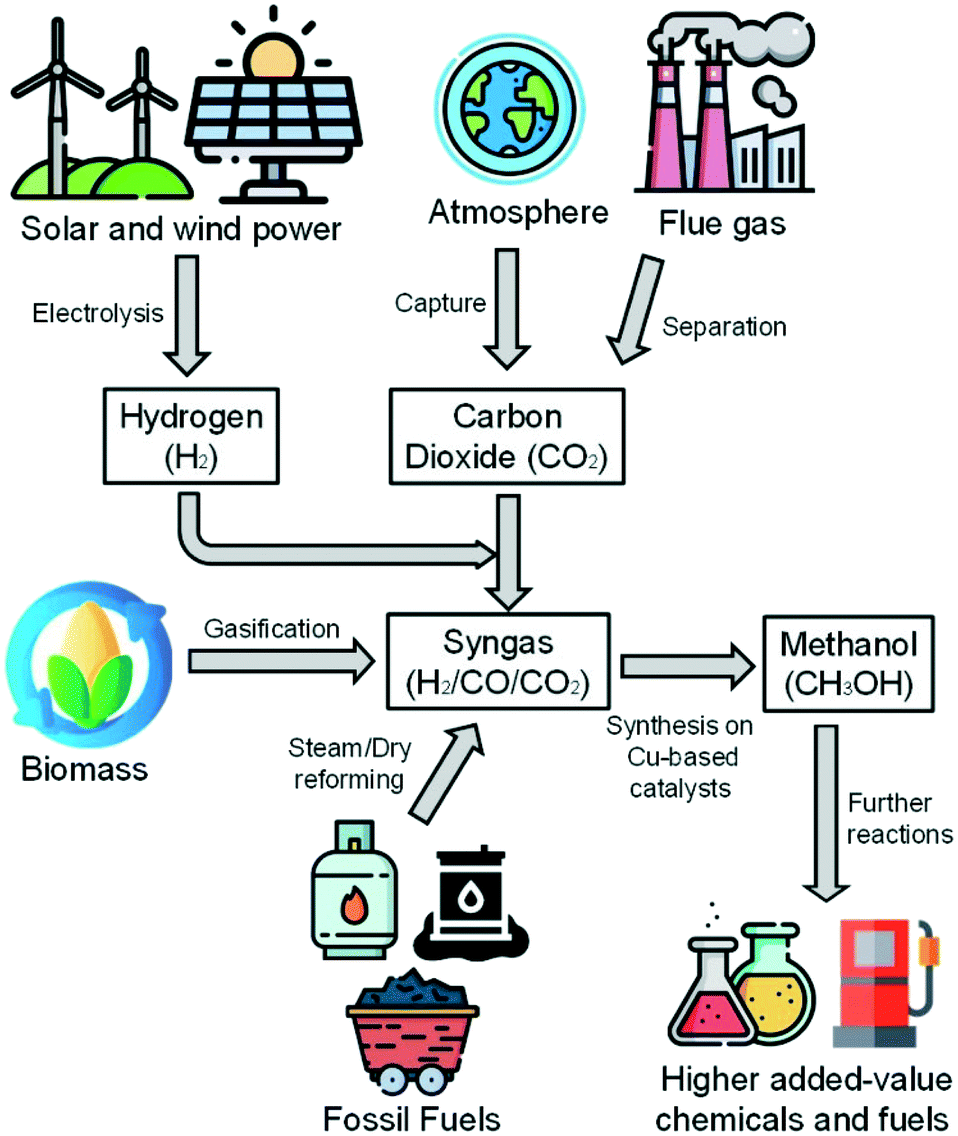 | ||
| Fig. 1 From syngas sources to higher added-value chemicals and fuels via methanol synthesis. Images: Freepik, Flaticon.10 | ||
Typically, industrial methanol production takes place in continuous processes using copper-based catalysts (e.g. Cu/ZnO/Al2O3) at 50–100 bar and 200–300 °C.9
Three main reactions occur: CO hydrogenation (eqn (1)), CO2 hydrogenation (eqn (2)) and the water-gas shift reaction (WGSR) (eqn (3)).
| CO(g) + 2·H2(g) ⇄ CH3OH(g) ΔH0298.15K = −90.6 kJ mol−1 | (1) |
| CO2(g) + 3·H2(g) ⇄ CH3OH(g) + H2O(g) ΔH0298.15K = −49.4 kJ mol−1 | (2) |
| CO(g) + H2O(g) ⇄ CO2(g) + H2(g) H0298.15K = −23.4 kJ mol−1 | (3) |
Several kinetic models have been developed to simulate the methanol synthesis.11–16 Graaf et al.11 proposed a model considering the three global reactions (eqn (1)–(3)), one active site for CO and CO2 adsorption and one for H2 and H2O adsorption. Vanden Bussche and Froment12 proposed a model considering CO2 as the main carbon source of methanol and neglecting CO hydrogenation, but maintained the same active sites as Graaf et al.11 Ovesen et al.13 considered the three global reactions (eqn (1)–(3)), one active site for CO adsorption and another one for CO2 adsorption, and proposed structural changes in the catalyst active sites depending on the gas composition. Park et al.14 considered the three global reactions (eqn (1)–(3)) and three active sites (for CO adsorption, for CO2 adsorption, and for H2/H2O adsorption). Seidel et al.15 considered all three reactions and three active sites, applying the structural changes proposed by Ovesen et al.13 as well. In a recent work, Slotboom et al.16 proposed a model with a reduced amount of parameters (6) to decrease identifiability problems. In their approach, CO hydrogenation (eqn (1)) was neglected, and three active sites were considered.
Although each model has its particular considerations, they all have rate determining steps (RDS) assumptions, which means that groups of parameters are lumped and fitted to experimental data. With this method, different effects may be merged with kinetics and cause the models to diverge outside the training region, which is often narrow.
Microkinetic modeling takes into account the chemistry behind the process,17 being useful for better understanding of the system, for process optimization and for catalyst development. Based on data derived from first principles density functional theory (DFT) during the last decade, detailed microkinetic models have been proposed for methanol synthesis,18–23 in which different surface reaction paths are considered and all reactions are potentially rate limiting. Grabow and Mavrikakis18 proposed a mechanism for CO/CO2 hydrogenation and the WGSR on Cu (111). In the adsorption steps, sticking coefficients equal to one were considered. The authors concluded that a more open surface (e.g. Cu (110), Cu (100), Cu (211)) could better represent the catalyst active area, and that the synergic effect of ZnO has to be taken into account, both conclusions being later demonstrated by Behrens et al.24 Van Rensburg et al.19 used previously reported DFT data24,25 to test microkinetic mechanisms for CO and CO2 hydrogenation on different surfaces (Cu (111), Cu (211), and Cu/Zn (211)), without including a mechanism for the WGSR. Liu et al.20 compared the mechanisms on Cu2O (111) and on Cu (111), and concluded that CO hydrogenation is faster on Cu2O, whereas CO2 hydrogenation is the dominating path on Cu (111). Park et al.21 proposed a mechanism on Cu (211), in which adsorption and activation energies were taken from DFT-derived data, and pre-exponential factors were fitted to experimental data. Xu et al.22 proposed a mechanism on Cu (211) and compared three situations: clean surface, preadsorbed O*, and preadsorbed OH*. The conclusion was that the preadsorbed species create faster reaction paths for the hydrogenation of formate. Huš et al.23 developed a mechanism on Cu (111) for different metal oxides (Zn3O3, Cr3O3, Fe3O3, Mg3O3) combined with copper, and concluded that the Zn3O3/Cu system has a superior performance.
In the aforementioned DFT-based models, single active sites were considered, and thus no structural changes in the catalyst were mentioned, despite being well known that Cu-based catalysts suffer morphology changes depending on gas composition and temperature, affecting the catalyst activity.26–29 To the best of our knowledge, only Huš et al.23 validated their model with own experimental data. The other models cited above were either validated with experiments reported in literature,11 or there was no validation at all.
Summarizing the modeling studies for methanol synthesis in the literature, to our knowledge, yet no published kinetic model exists that accounts for all these key features in methanol synthesis on Cu/ZnO/Al2O3:
• The global mechanism considers reactions (1)–(3).
• All surface reactions are potentially rate limiting (detailed microkinetic approach).
• The facet of Cu (211), a more open and active surface of the catalyst, is considered.
• Three-site approach: besides the Cu (211) active site (site a), the synergy of zinc is taken into account with the assumption of a Cu/Zn or Cu/Znδ+ (211) active center (site b), and a separate site is considered for the adsorption of H2 and H2O (site c) to avoid the adsorption inhibition caused by formate.
• The structural changes of the catalyst, which are dependent on temperature and gas phase composition variations, are quantitatively taken into account.
• An extensive experimental validation is made covering the most important parameters in methanol synthesis: pressure, temperature, gas hourly space velocity (GHSV), and the feed composition (H2, CO and CO2).
In this work, a multiscale kinetic model for the methanol synthesis and the WGSR is presented, in which all these aspects are considered. A wide experimental validation shall allow for simulating the methanol synthesis at different operating conditions.
2 Experimental setup
A total of 359 experiments were conducted in a single fixed-bed plug flow reactor (PFR). The operating conditions were varied in terms of temperature (210–260 °C), pressure (40–60 bar), gas hourly space velocity (GHSV) (24–40 L h−1 gcat.−1), hydrogen feed concentration (35–60% v/v), CO feed concentration (3–30% v/v), and CO2 feed concentration (0–20% v/v). Full experimental data are provided in the ESI† (Table S1).The PFR set-up consisted of a stainless steel tube with 460 mm length, an inner diameter of 12 mm, and an inner concentric tube (2 mm) for temperature measurements in the axial direction. The feed gases were hydrogen (99.999% v/v), carbon monoxide (99.97% v/v), nitrogen (99.9999% v/v), and a mixture of carbon dioxide and nitrogen (50![[thin space (1/6-em)]](https://www.rsc.org/images/entities/char_2009.gif) :50 ± 1.0% v/v) (Air Liquide Germany GmbH). The reactant gases supply was regulated via mass flow controllers (MFCs, Bronkhorst High Tech), by using proportional-integral-derivative (PID) control. The MFCs were calibrated with a flowmeter (Defender 530+, Mesalabs, standard error: 1.0% v/v). Both reactants (via bypass) and products were analyzed with a Fourier transform infrared spectrometer (FTIR, Gasmet CX4000). A flow diagram of the experimental setup is shown in Fig. S1.†
:50 ± 1.0% v/v) (Air Liquide Germany GmbH). The reactant gases supply was regulated via mass flow controllers (MFCs, Bronkhorst High Tech), by using proportional-integral-derivative (PID) control. The MFCs were calibrated with a flowmeter (Defender 530+, Mesalabs, standard error: 1.0% v/v). Both reactants (via bypass) and products were analyzed with a Fourier transform infrared spectrometer (FTIR, Gasmet CX4000). A flow diagram of the experimental setup is shown in Fig. S1.†
The reactor was filled with a commercial CuO/ZnO/Al2O3 catalyst provided by an industrial partner, which was crushed and sieved to a particle size range between 250 and 500 μm. As the methanol synthesis is exothermic, and in order to avoid hot spots and to ensure isothermal operation, five portions of 0.30 g catalyst (in total 1.50 g), were separately mixed, each with 8.18 g of silicon carbide (SiC, Hausen Mineraliengroßhandel GmbH) (in total 40.90 g). Each mixture was then consecutively filled into the reactor, forming a catalytic bed length of 200 mm. Pure SiC completed the upper and lower ends of the bed.
The catalyst was activated as follows: a volume flow of 300 mLS min−1 containing 5% v/v of H2 in N2 was applied to the reactor, and the system was heated from 100 to 200 °C at a heating rate of 20 °C h−1. This temperature was hold for one hour, followed by further heating to 240 °C at a heating rate of 12 °C h−1. Finally, the H2 concentration in the flow was increased to 50% v/v, maintaining the same total flow rate for one more hour.
In order to obtain a stable catalyst in steady-state conditions, the reactor was operated for 320 h at 40 bar, different temperatures (210–260 °C), and different feed gas compositions, before starting the measurements reported here.
The temperature axial profile was measured using a type-K thermocouple (NiCr–Ni) for the two data points with the highest methanol productivity, and thus the highest energy release due to the exothermic reactions. Since the maximum temperature difference was lower than 2 °C, the assumption of isothermal conditions is reasonable. The temperature profiles are presented in Fig. S2.†
3 Kinetic model development and numerical simulation
3.1 Three-site surface reaction mechanism
The developed kinetic model is based on the DFT calculations of Studt et al.30,31 for CO and CO2 hydrogenation to methanol, and the WGSR. The adsorption energies of CO2* and H2O* were taken from Polierer et al.32Studt et al.30,31 applied the calculations on two stepped model surfaces: Cu (211), denoted in the presented mechanism as “site (a)”, and a fully Zn-covered Cu (211), denoted “site (b)”. The (211) facets were chosen, as it was found through experiments and theoretical calculations that they are the most active surfaces for the methanol synthesis.18,22,24,30,31 Since surface defects scale linearly with the overall observed activity, the reactivity of other facets (e.g. 111) can be neglected.24 Besides, from a modeling point of view, the consideration of a most representative (i.e. most active) single facet is desirable, because an additional considered facet would double the amount of reactions and surface species, which makes the model more complex and requires a higher computational effort.
In this work, all reaction paths studied by Studt et al.30,31 were originally implemented and tested for different operating conditions. The initial tests confirmed remarks proposed by Studt et al.,30 that CO hydrogenation on Cu/Zn (211) and CO2 hydrogenation on Cu (211) are negligible. Therefore, CO hydrogenation on Cu/Zn (211) was eliminated from the final microkinetic model. The CO2 hydrogenation on Cu (211), however, was kept in the model, as it describes the accumulation of formate on the Cu (211) surface, which reduces the number of free sites and could therefore slow down other reactions, e.g. CO hydrogenation.
Studt et al.31 made DFT calculations for four WGS reaction pathways on both Cu (211) and Cu/Zn (211) surfaces: the redox mechanism, the water-assisted redox mechanism, the carboxyl mechanism, and the water-assisted carboxyl mechanism (totalizing eight possible reaction routes). After implementing and testing all these eight possible reaction pathways for different conditions, it was confirmed that the water-assisted carboxyl mechanism is dominant, and it is active on both Cu (211) and Cu/Zn (211). Thus, only this WGS reaction pathway (on both surfaces) is taken into account in the final kinetic model. After all, non-relevant reaction paths will only add complexity and increase the computational time of the simulations without contributing to the accuracy of the results.
It is known that formate (HCOO*) is able to cover a significant part of the catalyst surface, being an intermediate for CO2 hydrogenation and inhibiting other reactions, such as CO hydrogenation.30 It is, however, unlikely that formate inhibits hydrogen adsorption, because there should be still enough small sites available between adsorbed formate. A comparable situation is seen in the ammonia synthesis, in which it was shown that the interaction (or inhibition) of nitrogen with hydrogen is not significant.33,34 Another important feature is that, in the CO2 hydrogenation, the decomposition of H2COOH* into H2CO* and OH* would need an additional free site, and could therefore be inhibited by high formate concentrations. On the other hand, this does not seem to be realistic, as H2COOH* is a large molecule that should not need extra space for its decomposition.30 Therefore, a third Cu (211) site is considered in our model, denoted as “site (c)”, which is available for hydrogen and water adsorption. Similar approaches were published by other groups.15,16,30
The final kinetic model takes into account 23 surface species, of which ten are related to Cu (211) [CO(a), HCO(a), HCOO(a), HCOOH(a), H2COOH(a), H2CO(a), H3CO(a), COOH(a), CO2(a), site (a)], nine are related to Cu/Zn (211) [CO(b), HCOO(b), HCOOH(b), H2COOH(b), H2CO(b), H3CO(b), COOH(b), CO2(b), site (b)] and four are related to site (c) [H(c), OH(c), H2O(c), site (c)].
The reaction network of the carbon-containing species is shown in Fig. 2. It consists of five reaction pathways: CO hydrogenation on Cu (211), CO2 hydrogenation on Cu (211), WGSR (water-assisted carboxyl mechanism) on Cu (211), CO2 hydrogenation on Cu/Zn (211), and WGSR (water-assisted carboxyl mechanism) on Cu/Zn (211).
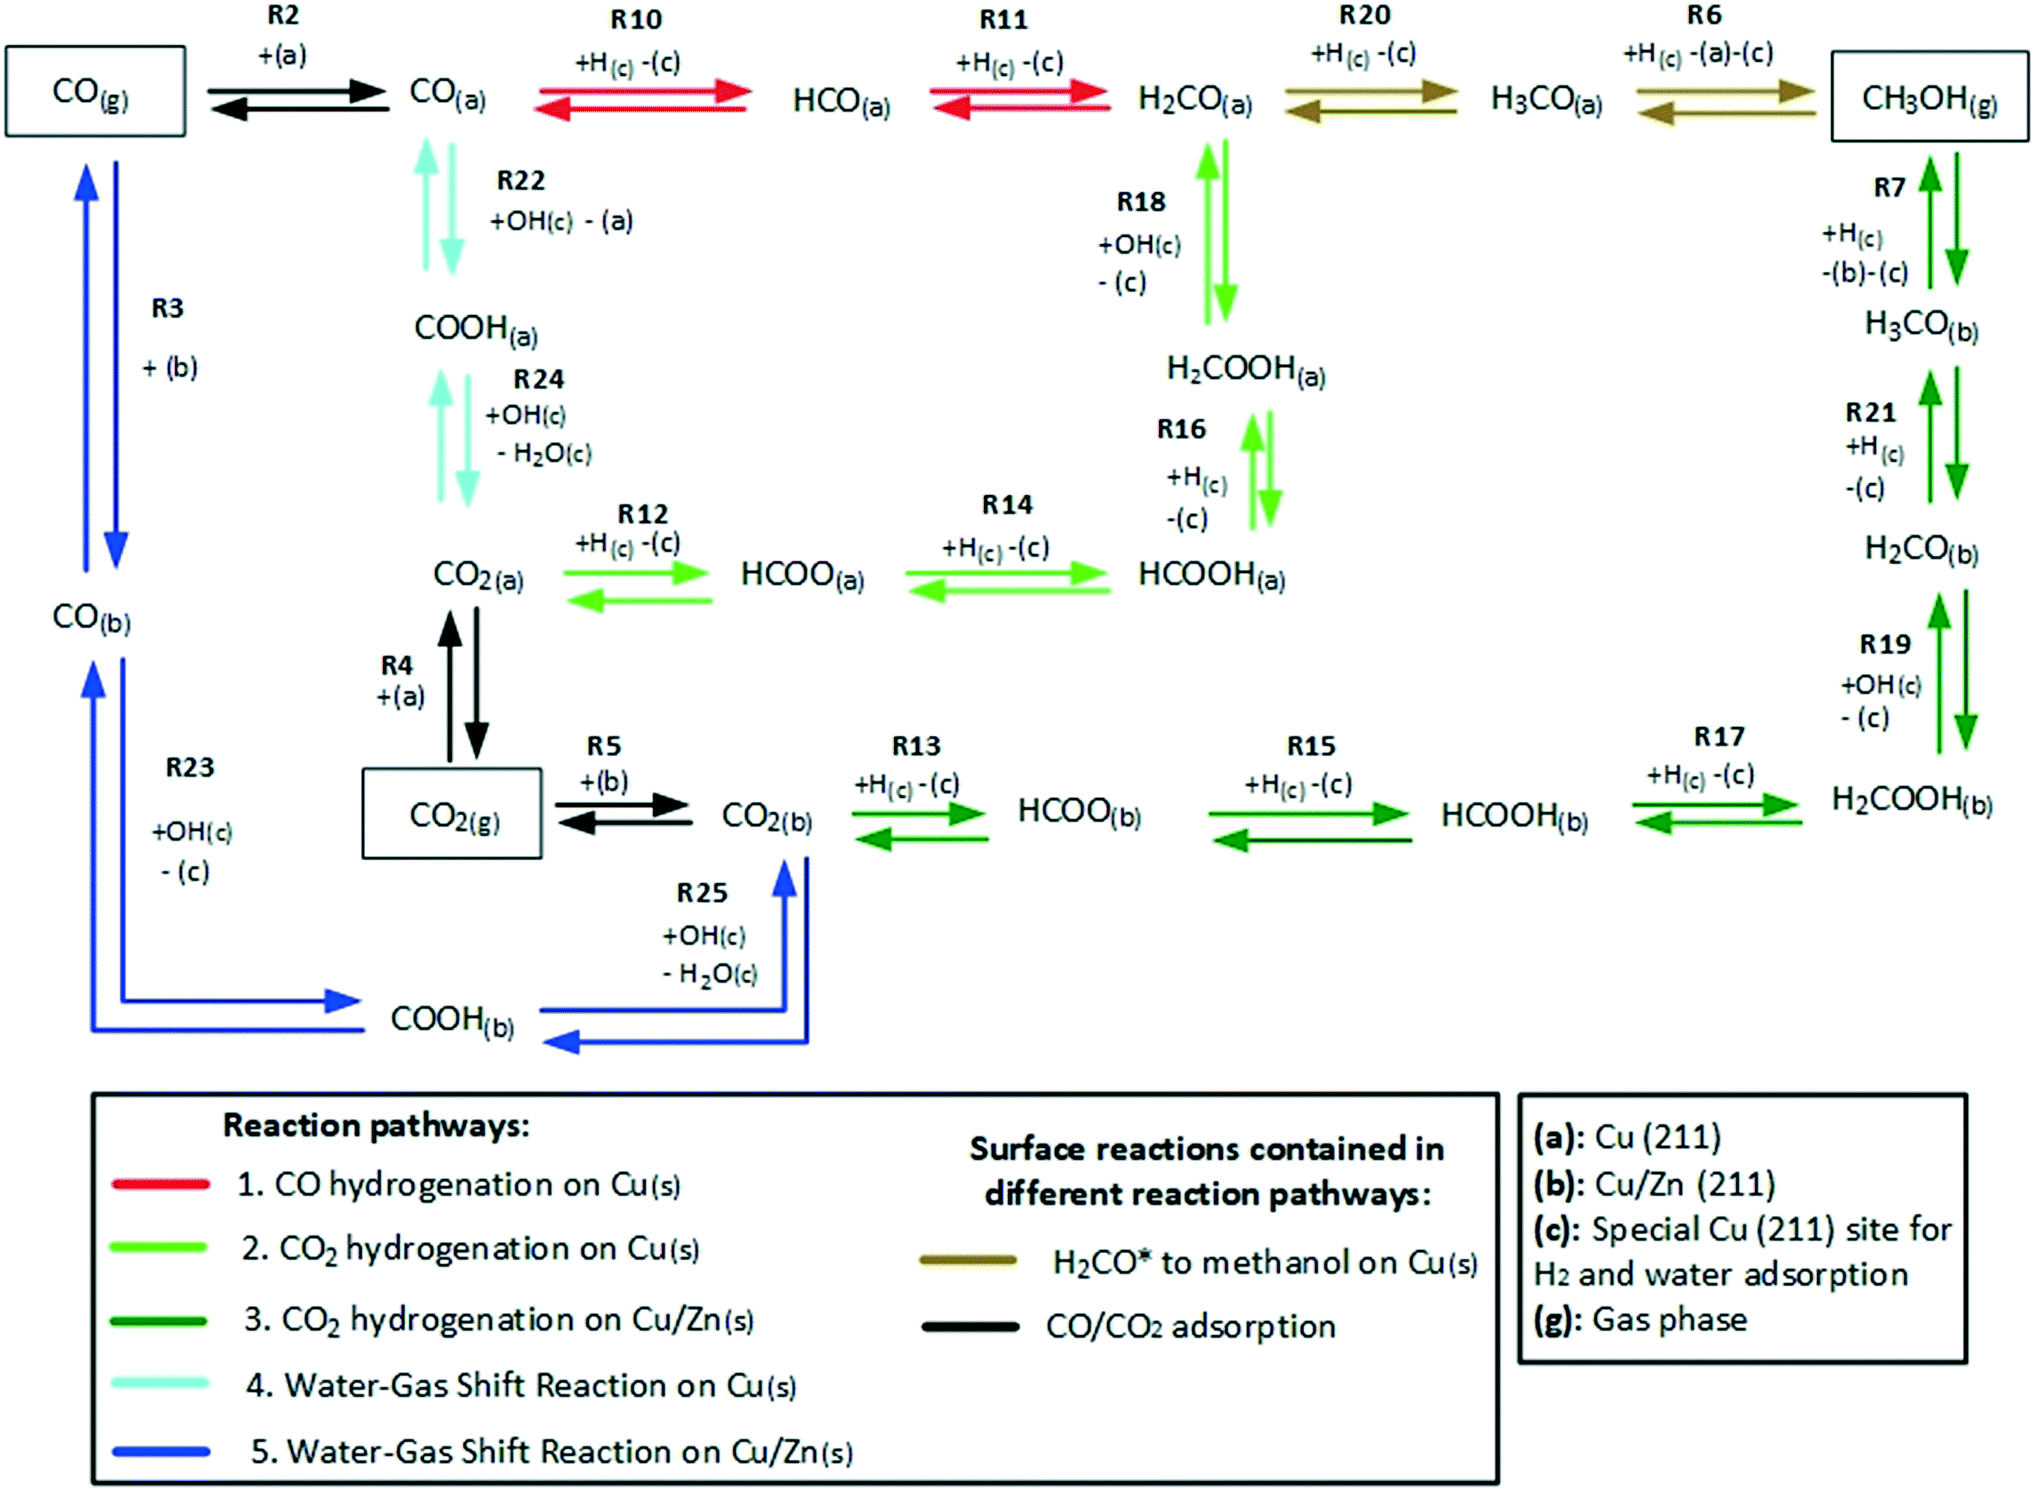 | ||
| Fig. 2 Reaction network of the carbon-containing species in the methanol synthesis and the WGSR. | ||
3.2 Kinetic equations
The catalyst surface is modeled considering a random distribution of the adsorbed species (mean-field approximation). A surface reaction is expressed as: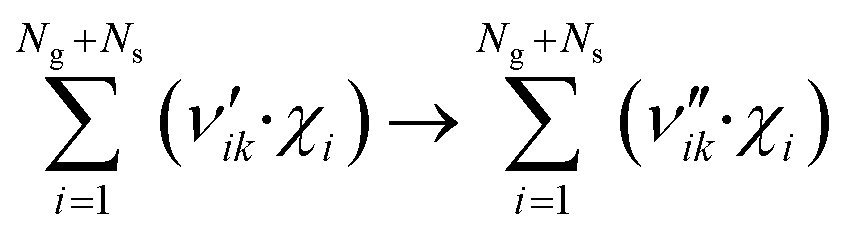 | (4) |
 | (5) |
Here, Ng and Ns are the number of gaseous and surface species, respectively, χi is the respective species i,  and
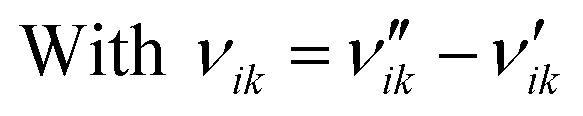
and  are the stoichiometric coefficients of the reactants and the products (species i in reaction k), respectively, and vik is the stoichiometric gain of species i in reaction k.
As the methanol synthesis is typically operated at elevated pressures (50–100 bar),9 the ideal gas consideration may give partial pressures that differ significantly from the actual fugacities of the gases. Slotboom et al.16 reported deviations up to 10% comparing ideal and real gas approaches. Therefore, the Peng–Robinson equation of state35 is used in our model to calculate the fugacities, using binary interaction parameters (kij) and other necessary data reported in literature,36,37 and including an effective hydrogen acentric factor (ω = −0.05).38
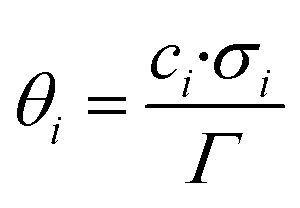
In the present kinetic model, all surface species are considered to occupy a single site (σi = 1 for all species). The surface coverage of a species i (θi) on a specific active site represents the fraction of this site that is occupied by that species. The calculation of the surface coverages is shown in eqn (6), and the sum of all coverages from a specific site must be 1 (eqn (7)).
 | (6) |
| ∑θi(a) = ∑θi(b) = ∑θi(c) = 1 | (7) |
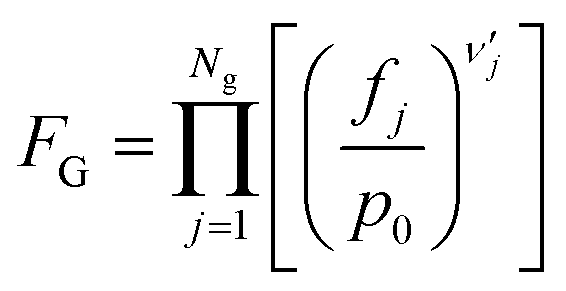
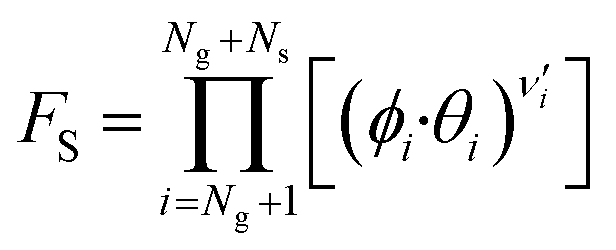
| r = FT·FG·FS | (8) |
 | (9) |
 | (10) |
 | (11) |
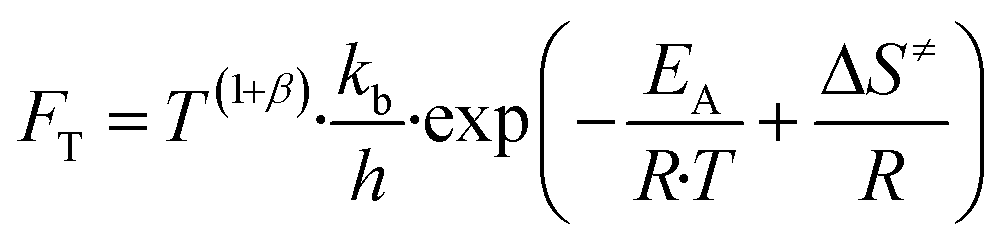
Here, T is the reaction temperature, β is a correction due to the thermodynamic consistency (see section 3.3), kb is the Boltzmann constant, h is the Planck constant, EA is the reaction activation energy, ΔS≠ is the reaction entropy barrier, fj is the fugacity of the gas component j, p0 is the reference pressure (1 bar), R is the universal gas constant, and θi is the surface coverage of species i. ϕi represents the fraction of the site type of surface species i in relation to the total number of sites for carbon-containing compounds (sites a and b). Substituting eqn (9)–(11) into eqn (12), the turnover rate of a reversible reaction k is:
 | (12) |
| ṡk = rk·Γ | (13) |
The dependency of (ϕi) to the site type is shown in Table 1. The estimation of the zinc coverage (ϕZn) is discussed in section 3.3.
| Site type | ϕ i |
|---|---|
| Site (a) | (1 − ϕZn) |
| Site (b) | ϕ Zn |
| Site (c) | 1 |
3.3 Thermodynamic consistency
The microkinetic model has to correctly predict the thermodynamic equilibrium. The objective of the thermodynamic consistency corrections is to ensure reversibility of each elementary step according to the properties of the gas-phase species involved, which are known. The method described here is an adapted version of an approach developed in the Deutschmann's group,41,42 considering a temperature operating range between T1 = 200 °C and T2 = 300 °C.Goos et al.43 reported thermodynamic data of gas species involved in the methanol synthesis. The free Gibbs energy function G0j of each gas species j at the reference pressure of 1 bar is:
 | (14) |
Here, a1−7,j are compound-specific constants.43 The free Gibbs energy variation of the three global reactions (eqn (15)–(17)) is:
 | (15) |
 | (16) |
 | (17) |
The assumption of constant heat capacity (cp) was made for the global reactions in the temperature range of 200 to 300 °C. With this consideration, the Gibbs function was reduced from seven to three parameters (A1−3) (eqn (18) and (19)) with the least square regression method (eqn (20)).
| ΔG0m,3p(T) = (ΔH0Tr,m − Δcp,m·Tr) + (Δcp,m + Δcp,m·lnTr − ΔS0Tr,m)·T + (−Δcp,m)·T·lnT | (18) |
| ΔG0m,3p(T) = A1,m + A2,m·T + A3,m·T·lnT | (19) |
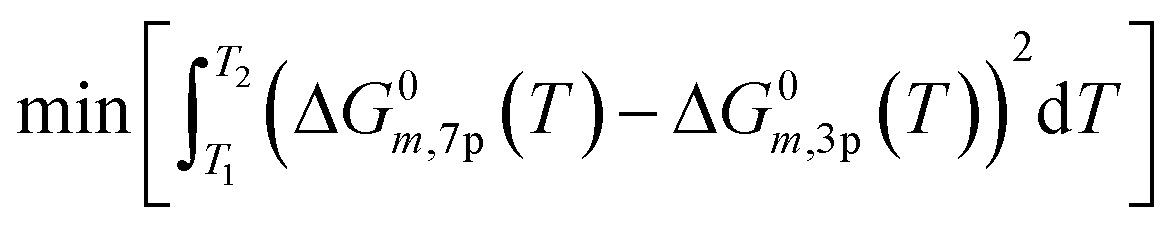 | (20) |
The estimated regression parameters are summarized in Table S2.† When comparing the three-parameter functions with the seven-parameter ones, the average relative error of ΔG0m,3p was below 0.002%, and the maximum relative error was 0.007%. Therefore, a constant heat capacity sufficiently describes the free Gibbs energy change of the reactions involved in the methanol synthesis between 200 and 300 °C.
From DFT calculations, the free Gibbs energy change (ΔG0k,DFT) of a reversible surface reaction k is given in the form:
| ΔG0k,DFT(T) = (E+A,k − E−A,k) − T·(ΔS≠,+k − ΔS≠,−k) | (21) |
The free Gibbs energy change (ΔG0k,DFT) of a global reaction pathway m (described in Fig. 2) is then calculated:
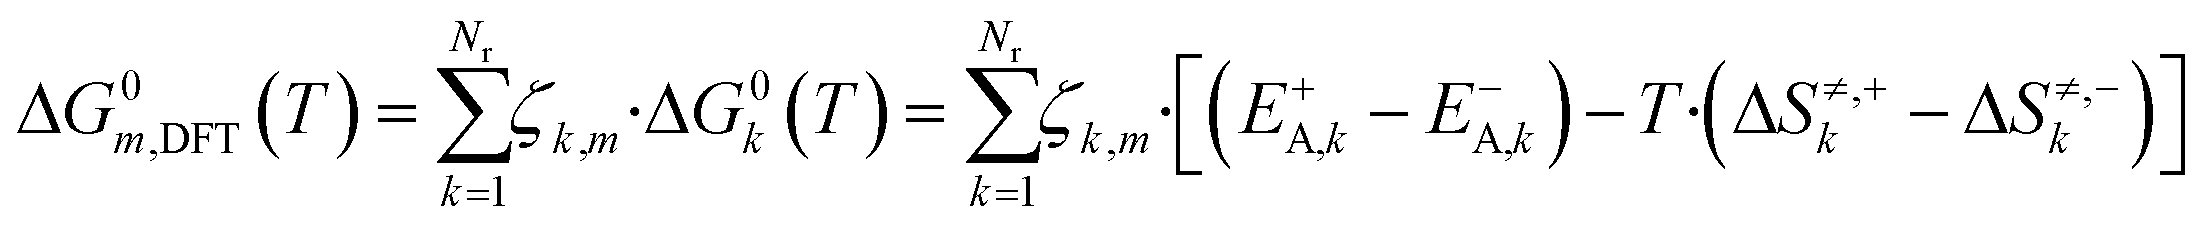 | (22) |
Here, Nr is the number of reactions, ζk,m is the stoichiometric coefficient of a reversible surface reaction k in the global reaction pathway m.
In eqn (21) and (22) there is no term multiplying T·ln(T) for ΔG0m,DFT, like there is in eqn (18) and (19) for ΔG0m,3p. Each ΔG0m,DFT needs to be modified with the addition of parameter β multiplying T·ln(T), so that the equations are able to match. The calculation of β can also be seen in other thermodynamic consistency processes of surface kinetic mechanisms reported in literature.41,42 The new free Gibbs energy change (ΔG0,TCm,DFT) is calculated with the corrected terms (E+,TCA,k, E−,TCA,k, ΔS≠,+,TCk, ΔS≠,−,TCk, β+,TCk, β−,TCk), as shown in eqn (23), and these terms are estimated so that eqn (24) holds for all reaction pathways:
 | (23) |
| ΔG0,TCm,DFT(T) = ΔG0m,3p(T) | (24) |
In eqn (24), the two functions will only be equal for a range of different temperatures (200–300 °C) if their corresponding terms match, namely the independent terms (eqn (25)), the terms accompanying T (eqn (26)), and terms accompanying T·ln(T) (eqn (27)).
 | (25) |
 | (26) |
 | (27) |
T·βTC) and the original DFT-based one (G≠,Orig = EOrigA − T·ΔS≠,Orig), for both forward and reverse reactions. This approach was chosen, because the model is more sensitive to modifications in the ΔG≠ than in its individual parameters. Besides, the model is also sensitive to ΔG changes of all surface reactions (ΔG = ΔG≠,+ − ΔG≠,−), even fast steps usually in equilibrium, as changing the ΔG will alter this equilibrium, which affects the whole mechanism. The constrained objective function is shown in eqn (28). | (28) |
Here, wk are selectable weights, which are chosen to protect the most sensitive reactions against changes. In this work, the weights of reactions R1, R2, R14, R16, and R17 were set to 105 and the other weights were set to one. This minimization problem can be solved with the method of the Lagrange multipliers (further explanation is given in the ESI†).
In Fig. 3, the capability of the model to predict the equilibrium is presented. The methanol concentration of the equilibrium for different operating conditions is calculated with Aspen Plus, using the RGibbs approach. Simulations with the same operating conditions are made with the microkinetic model considering a sufficiently long PFR, in order to achieve the equilibrium. When comparing the values, the conclusion is that the equilibrium is accurately predicted by the model, and the slight overestimations are probably due to rounding numbers and small differences in the thermodynamic data.
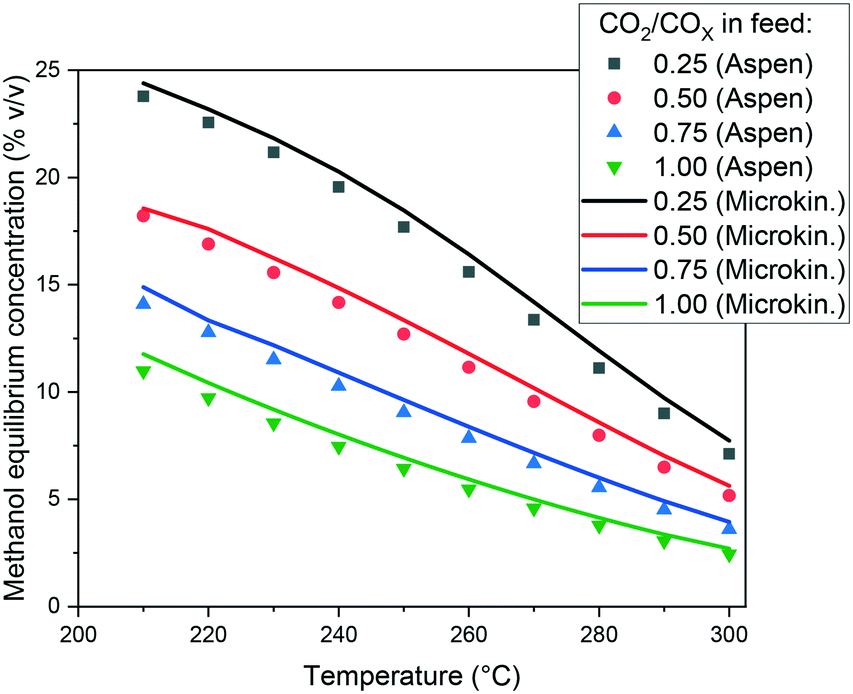 | ||
| Fig. 3 Methanol equilibrium concentration calculated with Aspen Plus and with the microkinetic model. Operating conditions: 60 bar, and a feed concentration of H2/COx = 80/20% v/v. | ||
3.4 Estimation of the active sites distribution
A significant number of experimental observations have shown that the different active sites of the Cu/ZnO-based catalysts are adjusted dynamically to the operating conditions.27,44 It is therefore relevant to correctly model this phenomenon, in order to estimate the fraction of Cu (site a) and Cu/Zn (site b) on the surface for different operating conditions. After all, this quantification has a high impact on the simulation of the methanol synthesis.The formation of a Cu–Zn alloy by reduction of zinc oxide and migration to the copper bulk can be described by the following reactions:13,29
| ZnO(s) + CO(g) ⇄ Zn(s) + CO2(g) ΔG0(220 ° C) = 60.89 kJ mol−1 | (29) |
| ZnO(s) + H2(g) ⇄ Zn(s) + H2O(g) ΔG0(220 ° C) = 81.61 kJ mol−1 | (30) |
Kuld et al.29 proposed a detailed method to estimate the zinc fraction on the surface of the catalyst. First, the solubility of zinc in the Cu-bulk (XZn) is calculated considering the equilibrium of the zinc reduction via carbon monoxide (eqn (29)). The effect of the lower atom coordination in nanoparticles was considered for both, zinc oxide and copper.
 | (31) |
![[small gamma, Greek, macron]](https://www.rsc.org/images/entities/i_char_e0c4.gif) ZnO and Cu represent the respective surface energy of zinc oxide and copper, MZnO and MCu are the molar masses of zinc oxide and copper, dZnO and dCu are the crystallite diameter of zinc oxide and copper, ρZnO and ρCu are the density of zinc oxide and copper, and aZnO is the activity of zinc oxide. The values of activity coefficient, surface energies and crystallite diameters were reported by Kuld et al.29
ZnO and Cu represent the respective surface energy of zinc oxide and copper, MZnO and MCu are the molar masses of zinc oxide and copper, dZnO and dCu are the crystallite diameter of zinc oxide and copper, ρZnO and ρCu are the density of zinc oxide and copper, and aZnO is the activity of zinc oxide. The values of activity coefficient, surface energies and crystallite diameters were reported by Kuld et al.29
The activity of the zinc oxide is assumed to be 1. Although not specifically noted by the authors, this assumption has probably been made considering that the typical quantity of metallic zinc in the copper bulk is not significant compared to the zinc oxide bulk.
In typical industrial methanol production, the WGSR is generally in equilibrium. Therefore, as the free Gibbs energy change of the reduction of zinc via hydrogen (eqn (30)) is significantly higher than via carbon monoxide (eqn (29)), the most probable way that hydrogen and water affect the reduction of zinc is by changing the aCO/aCO2 ratio through the WGSR. Kuld et al.29 proposed an effective aCO/aCO2 ratio to be used in eqn (31) to account for the H2/H2O effect.
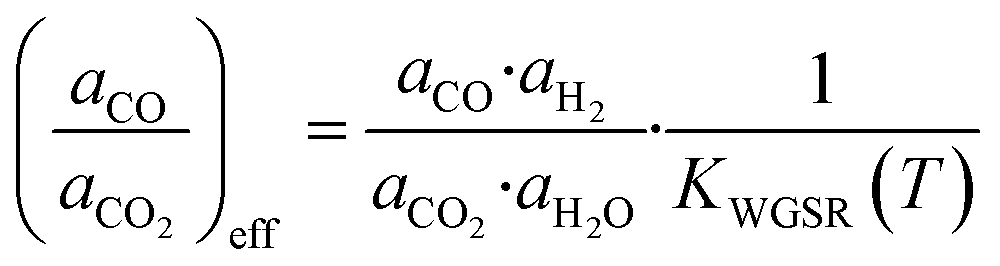 | (32) |
Here, KWGSR is the equilibrium constant of the WGSR. The segregation of metallic zinc from the Cu-bulk into the catalyst surface is then considered (eqn (33)).
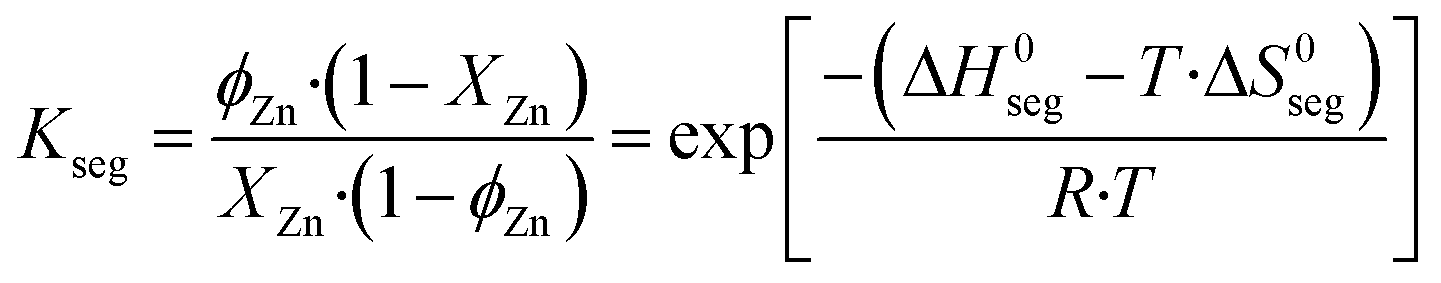
| Zn(Cu-bulk) + Cu(surf.) ⇄ Zn(surf.) + Cu(Cu-bulk) | (33) |
Kuld et al.29 performed DFT calculations of this segregation on different facets, taking into account Zn–Zn interactions. For the facet Cu (211), the authors reported enthalpy variations (ΔH0seg) of −27.01 kJ mol−1 for a Zn-free surface, −18.36 kJ mol−1 for a 0.333 Zn monolayer (ML), and −8.71 kJ mol−1 for a 0.667 Zn monolayer (ML). The ΔH0seg is then calculated (in kJ mol−1) as a function of the zinc coverage on the surface (ϕZn):
| ΔH0seg = −27.01·(1 − ϕZn) | (34) |
The entropy change (ΔS0seg) of the segregation process on a Cu (211) facet was estimated to be 7.1 J mol−1 K−1, and effects of Zn–Zn interactions in the entropy were neglected.29 The zinc coverage on the surface (ϕZn) is calculated by solving eqn (35), in which it is considered that the segregation of zinc to the surface is in equilibrium.
 | (35) |
The activities of the gases can be represented by their fugacities. The ratio aCO·aH2/(aCO2·aH2O), or better fCO·fH2/(fCO2·fH2O), represent the gas reducing power (GRP). Kuld et al.29 showed that the described method agrees well with experimental data in a GRP range between 0 to 15, which roughly corresponds to a ϕZn range between 0 and 0.30 (for a Cu (211) facet), and a XZn range between 0 and 0.003. However, the actual GRP of typical methanol synthesis operations may be higher than 15, especially at a CO-rich syngas condition, in which the amount of water is significantly low. For example, for a synthesis gas containing H2/CO/CO2/CH3OH/H2O/N2 = 60/22/5/1/0.3/11.9% v/v, the GPR would be 880. In this case, it is assumed that the zinc concentration in the copper bulk may be more significant, causing a non-negligible reduction of the zinc oxide bulk, and thus affecting its activity.
Thus, the value for the ZnO activity coefficient is limited by the segregation of zinc to the copper bulk, and a linear relation between aZnO and XZn is made (eqn (36)), in order to extend the application range of the method from Kuld et al.29 for higher GRP.
| aZnO = 1 − α·XZn | (36) |
Here, α express this linear relation, and a value of α = 1.5 is chosen, which roughly correspond to a maximum zinc coverage of 0.90, a limit value proposed elsewhere.15 Substituting eqn (36) into eqn (31), representing the gas activities by their fugacities, and reorganizing the equation, the fraction of zinc in the copper bulk (XZn) is:
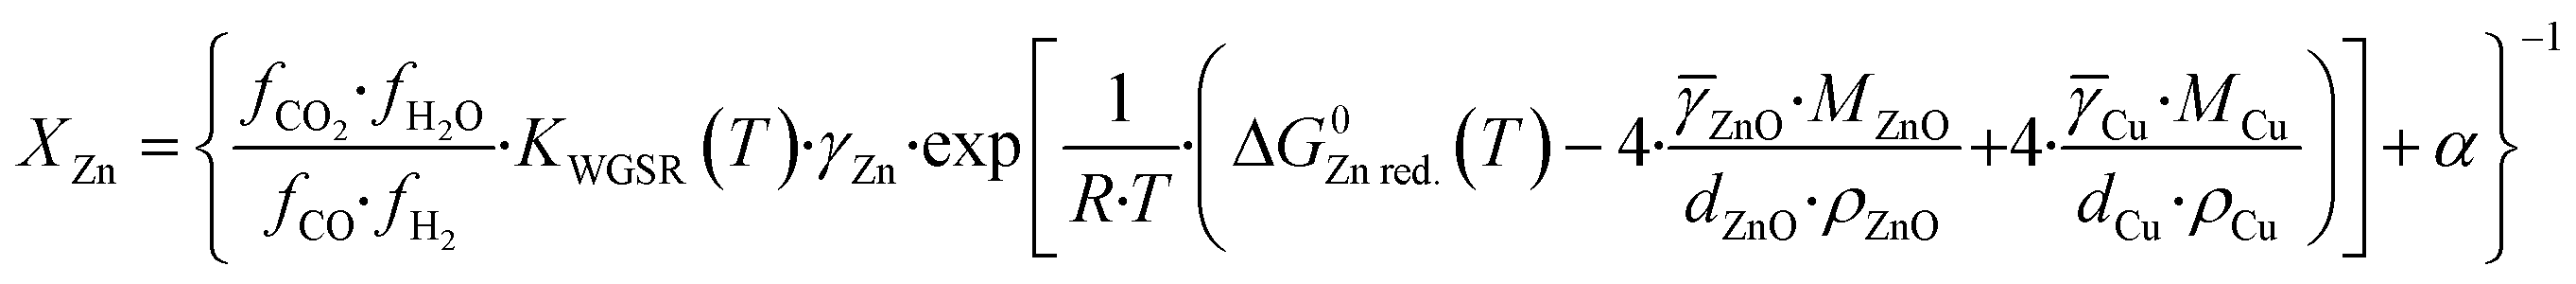 | (37) |
In Fig. 4, the original and the modified functions are compared for different GRP at the temperatures of 220 and 250 °C. In Fig. 4A and C, the solubility of zinc in the Cu-bulk is shown, while in Fig. 4B and D the zinc coverage is presented. It is show that the modified function attenuate XZn and ϕZn at a high GRP, while not influencing XZn and ϕZn significantly at low GRP.
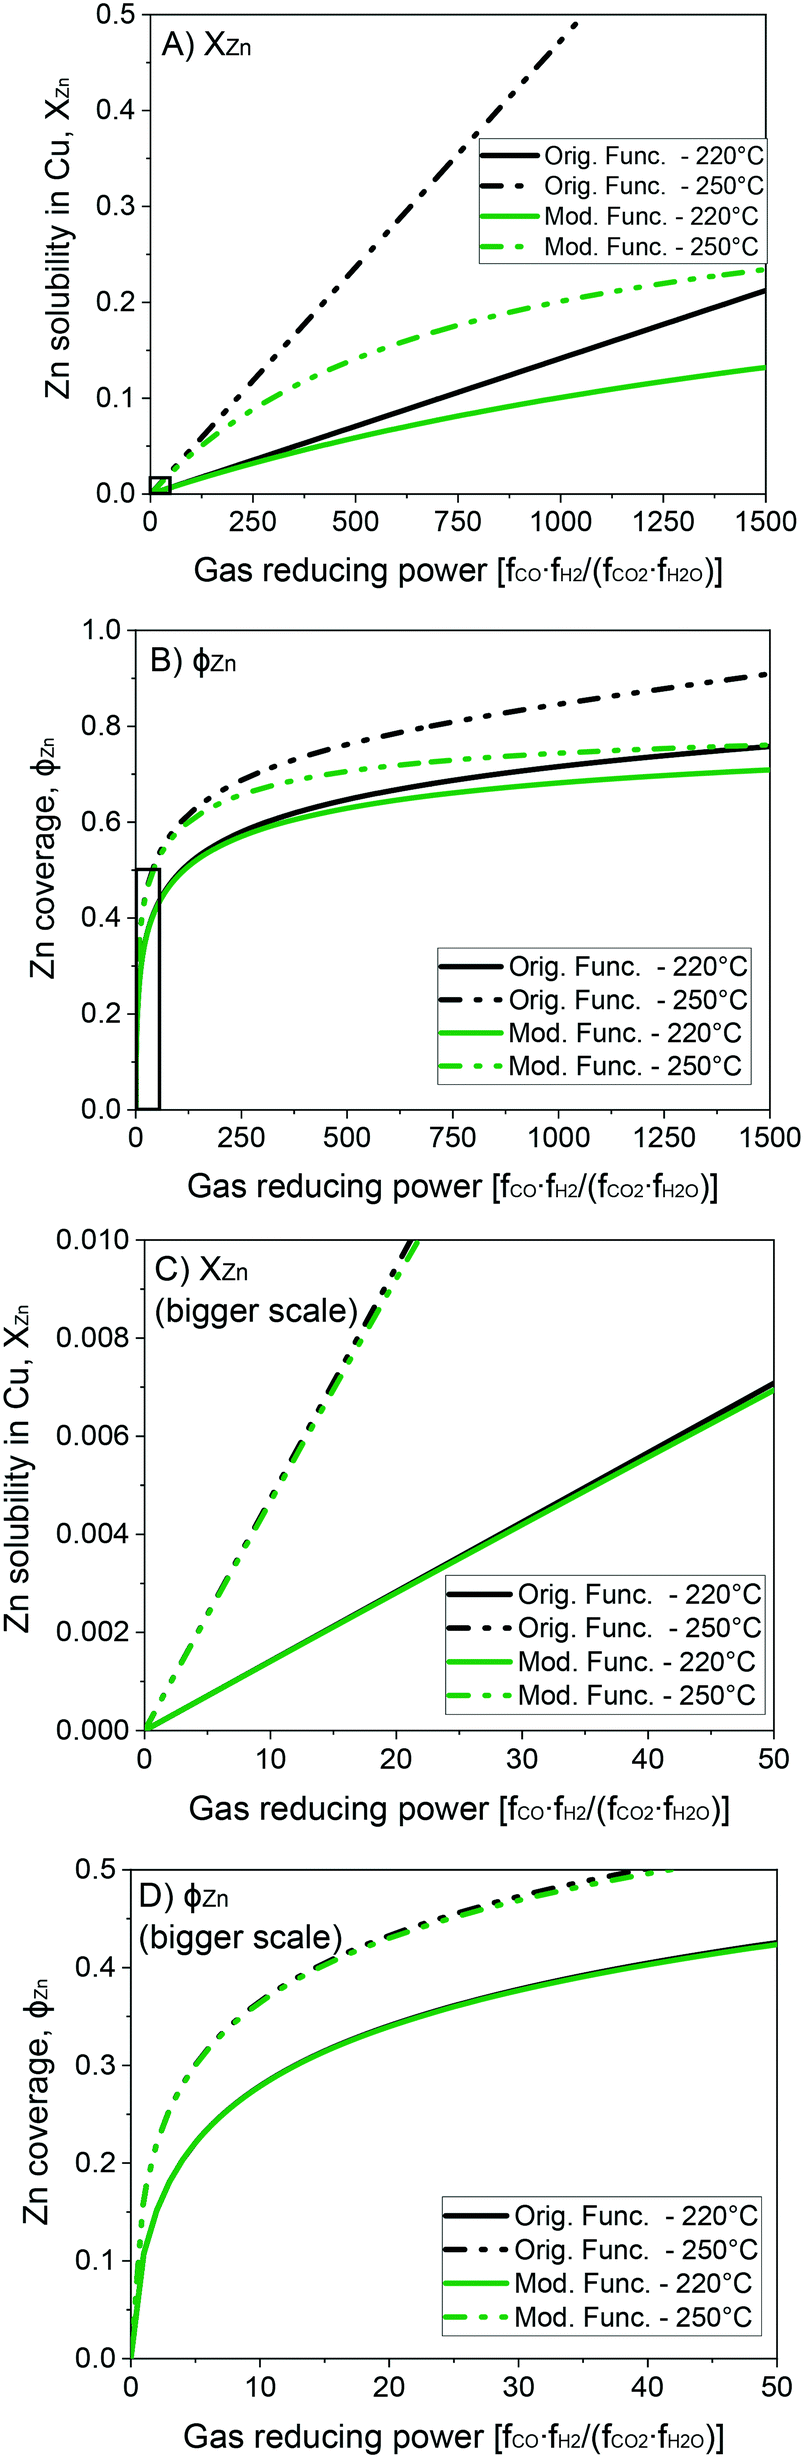 | ||
| Fig. 4 Solubility of zinc in the Cu-bulk (A and C) and zinc coverage (B and D) as functions of the gas reducing power. | ||
Finally, at CO2-rich operating conditions, the reverse water-gas shift reaction (rWGSR) is normally faster than the WGSR, and is usually not in equilibrium. In this case, the contribution of the direct reduction of ZnO by H2 is probably higher, and a more complex analysis must be made.29 In order to keep using the method proposed by Kuld et al.,29 it was chosen to set a minimum zinc coverage of 0.30 to avoid underestimations of zinc coverage by these conditions.
3.5 Estimation of the active catalytic area
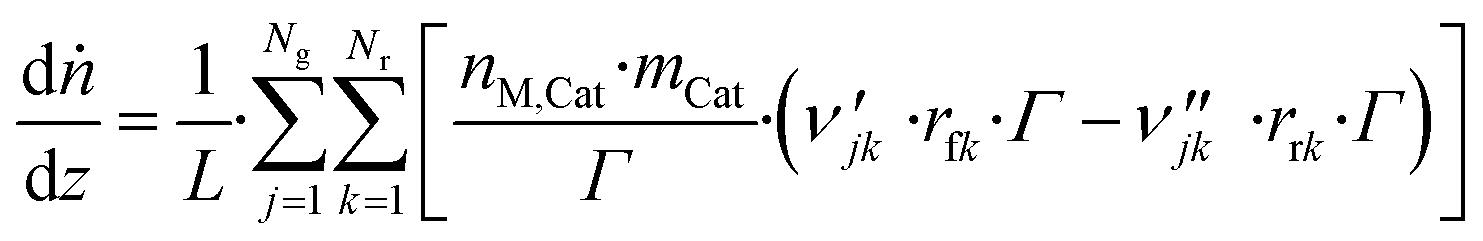
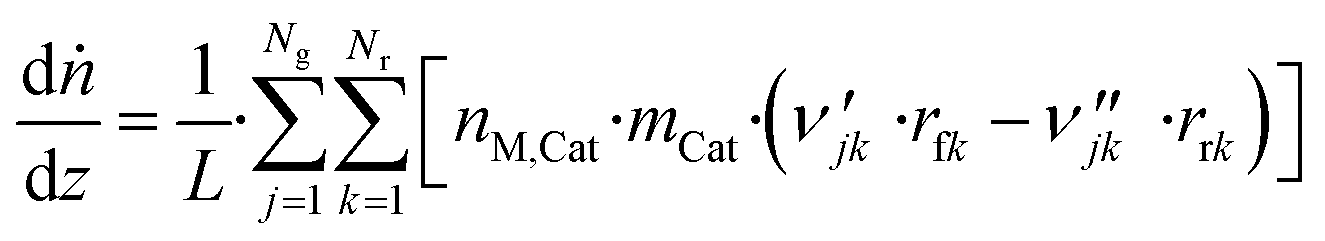
Because of the dynamic behavior of the Cu/ZnO/Al2O3 and the three-site approach, characterization tests (e.g. N2O chemisorption) can just estimate an initial active catalytic area, since it changes depending on the experimental conditions. Still, these estimations serve as a reference in comparing different catalysts. The determination of the surface site density is a challenge for the same reason. Therefore, it was chosen to use the experimental data to estimate a specific catalyst site quantity (nM,Cat) in terms of mol of active sites per catalyst mass unit (eqn (38)). The total active surface area (ACat) is then calculated by eqn (39).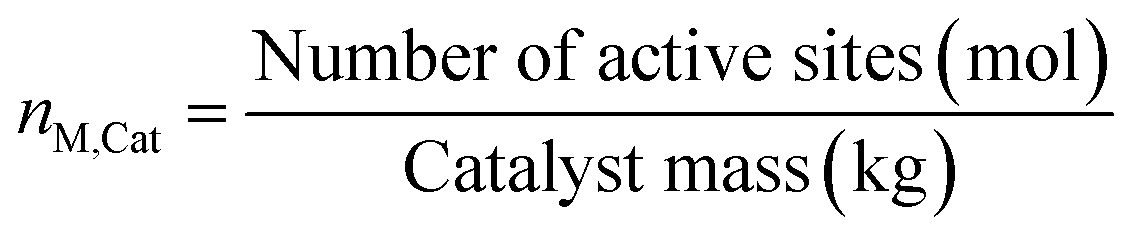 | (38) |
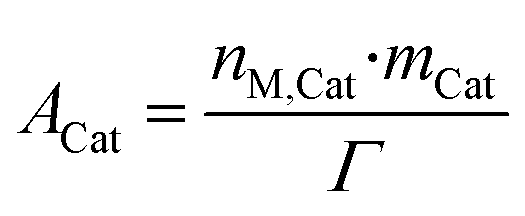 | (39) |
Here, mCat is the mass of the catalyst inside the reactor. By estimating the nM,Cat, the need to quantify the surface site density (Γ) is avoided, as shown in the next section.
The nM,Cat is estimated by minimizing the prediction errors of the methanol output with the experimental data. When the experimental data has values differ significantly (e.g. 0.08% v/v and 12.00% v/v), a better distribution of each point's importance can be made with introducing weights. Common approaches are the inverse of squared experimental value,45,46 the inverse of the squared simulated value,47 or the inverse of experimental multiplied by simulated value.48 Here, the inverse of the squared experimental value was used as weights. The function fminsearch from Matlab was used, and the objective function is shown as follows.
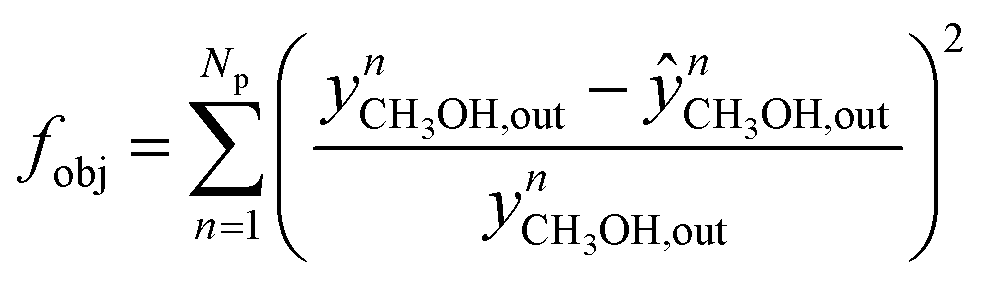 | (40) |
Here, 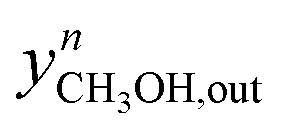 and
and  are the experimental and simulated value of point n, respectively.
3.6 Reactor equations
In this work, the microkinetic model is applied to simulate steady-state operation of two types of reactor: a fixed-bed tube reactor (own experiments and literature data14,16) and a CSTR (literature data15). Isothermal operation was considered in both cases.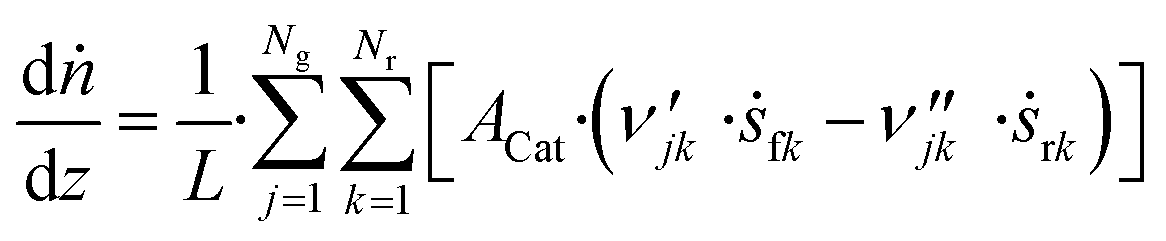 | (41) |
 | (42) |
 | (43) |
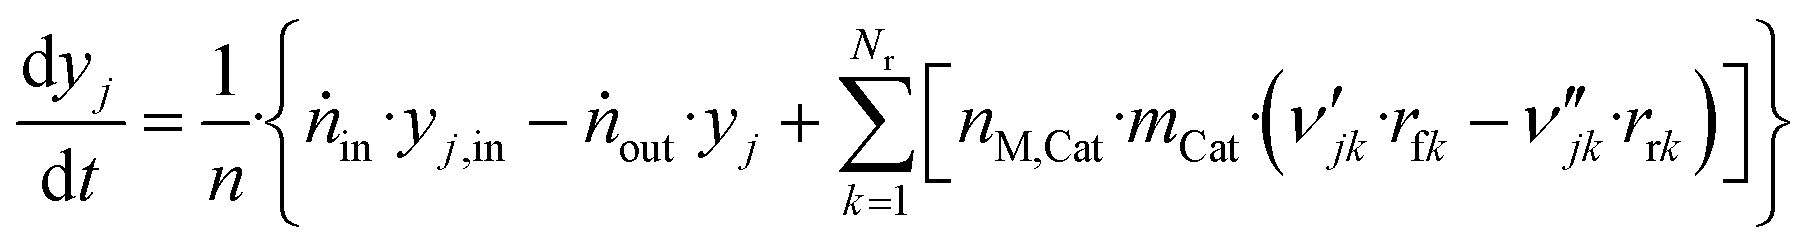
The axial reactor profile of the molar fraction of each gaseous species j (yj) is calculated via a component balance of the gas phase.
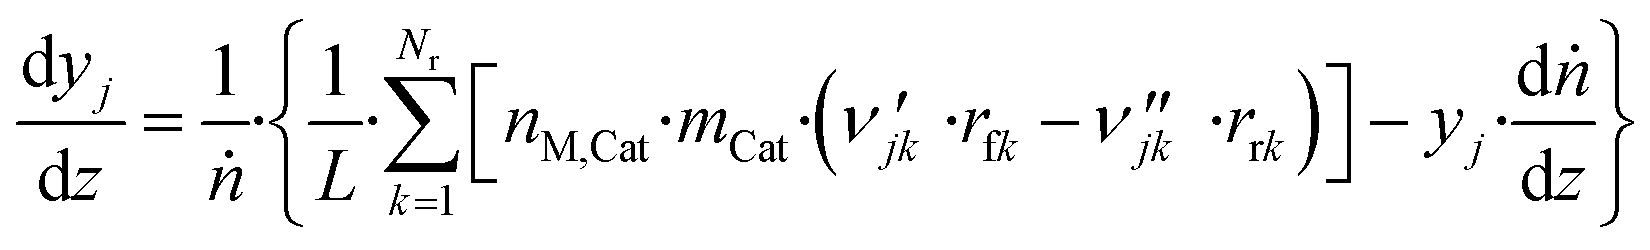 | (44) |
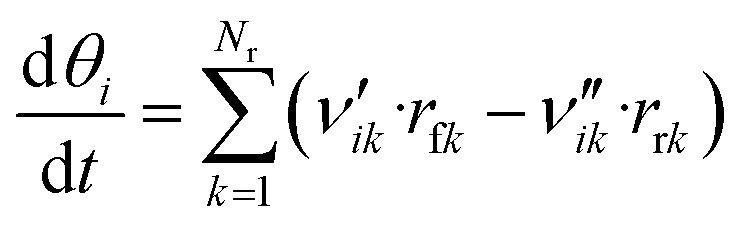
The coverage θi of each surface species i at a certain point in time is calculated via a component balance of the surface.
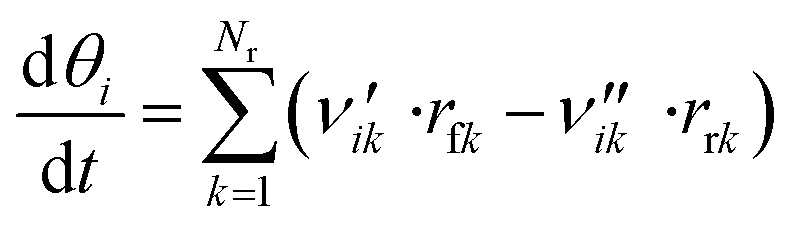 | (45) |
Comments on solving this system of differential equations are given in the ESI.†
 | (46) |
 | (47) |
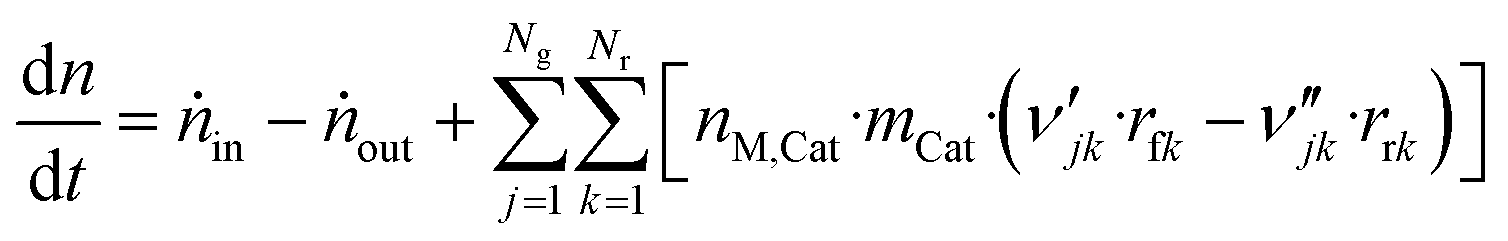
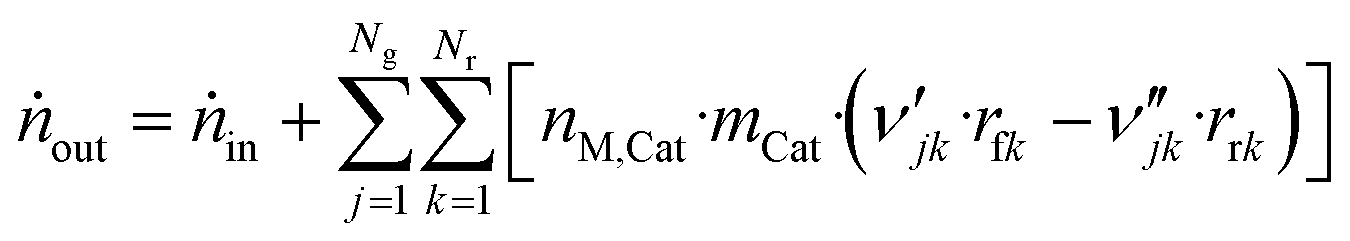
The component mole balance in the reactor is calculated:
 | (48) |
Like in the PFR, the coverages of the surface species are calculated by:
 | (49) |
Comments on solving this system of differential equations are given in the ESI.†
3.7 Sensitivity analysis
In order to evaluate the most sensitive reaction rate parameters in the kinetic model, the Campbell degree of rate control (DRC) method was applied.49,50 This method consists in slightly changing the Gibbs energy (Gi) of a surface intermediate or a transition state, while keeping the Gibbs energy of the other species Gw≠i constant, and it has the advantage of maintaining the thermodynamic consistency of the model. For a set of reversible reactions, the degree of rate control of surface species or a transition state i (DRCi) is defined as: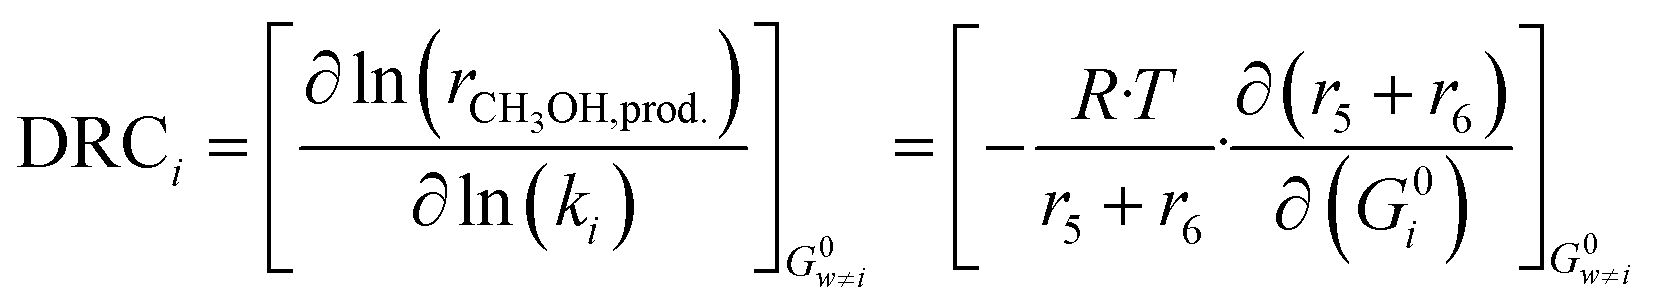 | (50) |
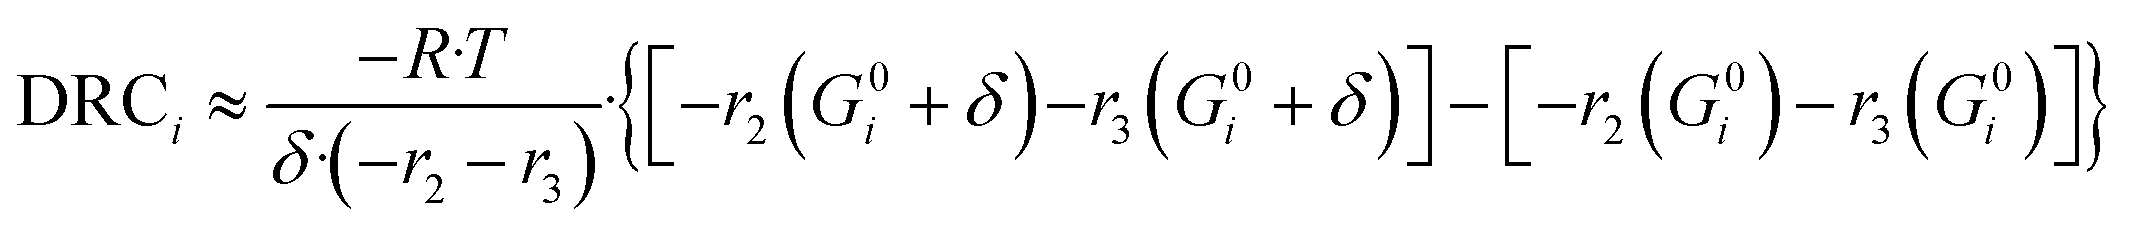
Here, (r5 + r6) is the methanol production rate, and G0i is the free Gibbs energy of species i at the reference pressure (1 bar). The method of finite differences is used as an approximation to solve eqn (50), and a step δ = 0.01 kJ mol−1 was chosen. Eqn (51) is used to calculate the sensitivity of methanol generation, and eqn (52) is used for sensitivity of CO generation, which makes sense at high CO2 content.
 | (51) |
 | (52) |
4 Results and discussion
4.1 Model validation
A microkinetic model for syngas (H2/CO/CO2) conversion to methanol including a three-site approach and structural changes was successfully developed. The complete set of 25 reversible reactions and their respective parameters to calculate the turnover rates are summarized in Table 2. The thermodynamic consistency of the model was ensured (see section 3.3). The estimated value of the catalytic site quantity (nM,cat) is 2.00 mol kgcat.−1.| No. | Reaction | Forward reaction | Reverse reaction | ||||
|---|---|---|---|---|---|---|---|
| ΔS≠f × 103 [kJ mol−1 K−1] | E A,f [kJ mol−1] | β [−] | ΔS≠r × 103 [kJ mol−1 K−1] | E A,r [kJ mol−1] | β [−] | ||
| R1 | H2(g) + 2·(c) ⇄ 2·H(c) | −119.24 | 69.57 | 0.000 | 1.72 | 93.01 | 0.000 |
| R2 | CO(g) + (a) ⇄ CO(a) | −158.23 | 0.00 | 0.000 | 0.00 | 58.37 | 0.000 |
| R3 | CO(g) + (b) ⇄ CO(b) | −151.60 | 8.90 | −0.119 | −6.64 | 0.00 | 0.119 |
| R4 | CO2(g) + (a) ⇄ CO2(a) | −144.74 | 0.00 | −0.129 | −7.22 | 52.29 | 0.129 |
| R5 | CO2(g) + (b) ⇄ CO2(b) | −138.11 | 0.00 | −0.249 | −13.86 | 51.59 | 0.249 |
| R6 | H3CO(a) + H(c) ⇄ CH3OH(g) + (a) + (c) | 56.99 | 81.22 | −0.547 | −181.26 | 32.93 | 0.547 |
| R7 | H3CO(b) + H(c) ⇄ CH3OH(g) + (b) + (c) | 47.03 | 92.56 | −0.368 | −171.30 | 23.61 | 0.368 |
| R8 | H2O(g) + (c) ⇄ H2O(c) | −177.19 | 0.00 | 0.378 | 21.08 | 31.21 | −0.378 |
| R9 | H2O(c) + (c) ⇄ OH(c) + H(c) | 5.99 | 79.84 | 0.140 | 21.60 | 105.17 | −0.140 |
| R10 | CO(a) + H(c) ⇄ HCO(a) + (c) | 25.38 | 84.62 | −0.299 | −21.90 | 20.55 | 0.299 |
| R11 | HCO(a) + H(c) ⇄ H2CO(a) + (c) | 15.73 | 56.26 | −0.299 | −8.10 | 92.81 | 0.299 |
| R12 | CO2(a) + H(c) ⇄ HCOO(a) + (c) | 36.44 | 77.74 | −0.249 | 8.72 | 109.64 | 0.249 |
| R13 | CO2(b) + H(c) ⇄ HCOO(b) + (c) | 43.07 | 60.24 | −0.368 | 2.08 | 105.43 | 0.368 |
| R14 | HCOO(a) + H(c) ⇄ HCOOH(a) + (c) | 10.42 | 128.23 | 0.000 | −153.70 | 29.81 | 0.000 |
| R15 | HCOO(b) + H(c) ⇄ HCOOH(b) + (c) | 10.42 | 136.53 | 0.000 | −153.70 | 7.72 | 0.000 |
| R16 | HCOOH(a) + H(c) ⇄ H2COOH(a) + (c) | −150.42 | 46.89 | 0.000 | −25.96 | 62.43 | 0.000 |
| R17 | HCOOH(b) + H(c) ⇄ H2COOH(b) + (c) | −150.42 | 1.54 | 0.000 | −25.96 | 48.92 | 0.000 |
| R18 | H2COOH(a) + (c) ⇄ H2CO(a) + OH(c) | −20.59 | 20.52 | −0.249 | −15.21 | 38.77 | 0.249 |
| R19 | H2COOH(b) + (c) ⇄ H2CO(b) + OH(c) | −13.95 | 11.22 | −0.368 | −21.85 | 9.96 | 0.368 |
| R20 | H2CO(a) + H(c) ⇄ H3CO(a) + (c) | 42.42 | 52.66 | −0.547 | −13.47 | 107.12 | 0.547 |
| R21 | H2CO(b) + H(c) ⇄ H3CO(b) + (c) | 32.46 | 51.46 | −0.368 | −3.51 | 132.06 | 0.368 |
| R22 | CO(a) + OH(c) ⇄ COOH(a) + (c) | −11.31 | 79.90 | −0.119 | −3.74 | 16.05 | 0.119 |
| R23 | CO(b) + OH(c) ⇄ COOH(b) + (c) | −11.31 | 13.33 | −0.119 | −3.74 | 16.05 | 0.119 |
| R24 | COOH(a) + OH(c) ⇄ CO2(a) + H2O(c) | 9.92 | 17.09 | −0.119 | −22.36 | 60.82 | 0.119 |
| R25 | COOH(b) + OH(c) ⇄ CO2(b) + H2O(c) | 9.92 | 17.09 | −0.119 | −22.37 | 60.82 | 0.119 |
| If the CO2/COX ratio in feed is higher than 0.65, the activation energies of reactions 24 and 25 are adjusted: | |||||||
| R24 | COOH(a) + OH(c) ⇄ CO2(a) + H2O(c) | 9.92 | 32.53 | −0.119 | −22.36 | 76.22 | 0.119 |
| R25 | COOH(b) + OH(c) ⇄ CO2(b) + H2O(c) | 9.92 | 32.53 | −0.119 | −22.37 | 76.22 | 0.119 |
The validation of the model was done using own experiments and data from literature.14–16 The operating conditions in the respective setups are significantly different from ours, which contributes to a broader validation range. In Table 3, the operating conditions of each setup is summarized. For the data from Seidel et al.15 with H2/CO in feed, our model was initially overestimating methanol formation. Feeds with only H2/CO are an extreme case, when looking at the zinc coverage. As the catalyst used is not exactly the same, we assume that in the experiments of Seidel et al.15 zinc is covering more surface, leaving less Cu sites for the CO hydrogenation. By adjusting the value of α to 1.17 (see eqn (36)) in this specific case, roughly corresponding to a maximum of 95% zinc coverage, the measurements from Seidel et al.15 with H2/CO were reasonably predicted.
| Database | No. of points | Reactor | Pressure (bar) | Temperature (°C) | GHSV (L h−1 gcat.−1) | H2 feed (% v/v) | CO feed (% v/v) | CO2 feed (% v/v) | Inert feed (% v/v) | Conversion of COX (%) |
|---|---|---|---|---|---|---|---|---|---|---|
| a Only the experiments containing both CO and CO2 in the feed were considered. | ||||||||||
| This work | 359 | PFR | 40–60 | 210–260 | 24–40 | 35–60 | 3–30 | 0–20 | 20–50 | 0.9–30.9 |
| Seidel | 139 | CSTR | 30–70 | 230–260 | 3.6 | 60–76 | 0–21 | 0–13 | 15–16 | 2.9–52.8 |
| Parka | 98 | PFR | 50–90 | 230–340 | 8–40 | 50–83 | 7–29 | 2–16 | 0–28 | 5.1–56.0 |
| Slotboom | 94 | PFR | 20–50 | 178–260 | 1.3–6.5 | 66–80 | 0 | 12–25 | 0–11 | 0.4–9.6 |
In Fig. 5, the normalized residues of the original model are shown for each carbon-containing species. By comparing simulations with experimental data, it was found that the WGSR is adequately predicted. However, if the operating conditions favor rWGSR, generally for feed ratios of CO2/COX (ȳCO2,0) higher than 0.65 (COX = CO + CO2), the simulation of CO production through the rWGSR was significantly higher than the experimental values, as shown in Fig. 5A. This suggests that the Gibbs energy barrier (ΔG≠ = EA − T·ΔS≠) is influenced by higher concentrations of CO2 and H2O or by surface intermediates derived from them, namely HCOO* and OH*, respectively. Different approaches were tested to improve the simulations in this region, including the addition of coverage dependency terms. The solution found was to add 15.44 kJ mol−1 to the activated complex energies of the most sensitive reactions of the rWGSR (R24 and R25), if the feed ratio of CO2/COX is higher than 0.65 (see Table 2). With this procedure, the model remains thermodynamically consistent.
 | ||
| Fig. 5 Original model simulation: normalized residues of the simulation of the experiments from this work (1–359), from Seidel et al.15 (360–498), from Park et al.14 (499–596), and from Slotboom et al. (597–690).16 A) Carbon monoxide. B) Carbon dioxide. C) Methanol. | ||
In Fig. 6, the normalized residues of the two-case model are shown for each carbon-containing species. The model quantitatively reproduces the 690 measurements, with the majority of the data points being inside the ±20% lines (58% of the methanol points and ≥90% of CO and CO2 points). CO2 simulation error is always smaller than 40%, and only 3.4% of CO data points and 17% of methanol data points are outside the ± 40% lines. The sum of the relative squared errors (χ2), the mean error (MEj) and the mean squared error of the predictions are calculated for CO (j = 1), CO2 (j = 2), and methanol (j = 3), and are shown in Table 4.
 | ||
| Fig. 6 Two-case model simulation: normalized residues of the simulation of the experiments from this work (1–359), from Seidel et al.15 (360–498), from Park et al.14 (499–596), and from Slotboom et al. (597–690).16 A) Carbon monoxide. B) Carbon dioxide. C) Methanol. | ||
| Feed | H2/CO/CO2 | H2/CO | H2/CO2 | All | |||||
|---|---|---|---|---|---|---|---|---|---|
| Data | This work | Seidel et al. | Park et al. | This work | Seidel et al. | Seidel et al. | Slotboom et al. | ||
| N° of points | 324 | 46 | 98 | 35 | 61 | 32 | 94 | 690 | |
| χ 2 | 17.01 | 0.81 | 16.86 | 2.29 | 9.32 | 3.35 | 25.10 | 74.74 | |
| CO | ME | 0.0215 | 0.0528 | 0.1424 | 0.0104 | 0.0265 | 0.1214 | 0.2776 | 0.0802 |
| MSE | 0.0010 | 0.0055 | 0.0488 | 0.0002 | 0.0012 | 0.0171 | 0.1314 | 0.0266 | |
| CO2 | ME | 0.0240 | 0.0444 | 0.0629 | 0.0261 | 0.0263 | 0.0325 | ||
| MSE | 0.0011 | 0.0032 | 0.0081 | 0.0011 | 0.0010 | 0.0024 | |||
| CH3OH | ME | 0.1688 | 0.0834 | 0.2704 | 0.2228 | 0.3212 | 0.2582 | 0.3104 | 0.2172 |
| MSE | 0.0504 | 0.0089 | 0.1151 | 0.0651 | 0.1515 | 0.0804 | 0.1347 | 0.0794 | |
| (53) |
| (54) |
| (55) |
Considering all experiments, the mean error (ME) values of CO, CO2 and methanol concentration are 8.0, 3.3, and 21.7%, respectively. These values are even lower when looking only to mixed feeds (H2/CO/CO2). The mean squared errors (MSE) are also significantly low (see Table 4).
In Fig. 7, it is shown the experimental and simulated values of methanol output concentration for different conditions and setups. It can be seen that the simulations are significantly close to the experiments and the trends are adequately predicted. In Fig. 8, the error of the prediction of the carbon-containing compounds is shown as a function of ȳCO2,0 (x-axis) and temperature (y-axis) for our experiments at the operating conditions of 40 bar, 24 L h−1 gcat−1 and H2/COx/N2 ≈ 45.3/14.3/40.4% v/v. The model simulates CO and CO2 accurately for the entire studied region. The simulation of methanol is also reasonable, with slight underestimations at high temperatures and low ȳCO2,0, and moderate underestimations at low temperatures and high ȳCO2,0. This leads to the conclusion that there is some positive effect on CO2 hydrogenation at low temperature when the concentration of CO2 is increased, which is not reflected in this model. This effect is shown in both our own experiments and experiments from literature.51 Still, the model adequately simulates this region (low temperature and high ȳCO2,0) for lower values of GHSV is lower (which means higher conversion). This is demonstrated in the simulation of the experiments from Slotboom et al.16 which have no CO in feed (ȳCO2,0 = 1) and are reasonably reproduced.
 | ||
| Fig. 7 Experimental and simulated values of methanol output concentration at different conditions. Databases: A) this work. B) Seidel et al.15 | ||
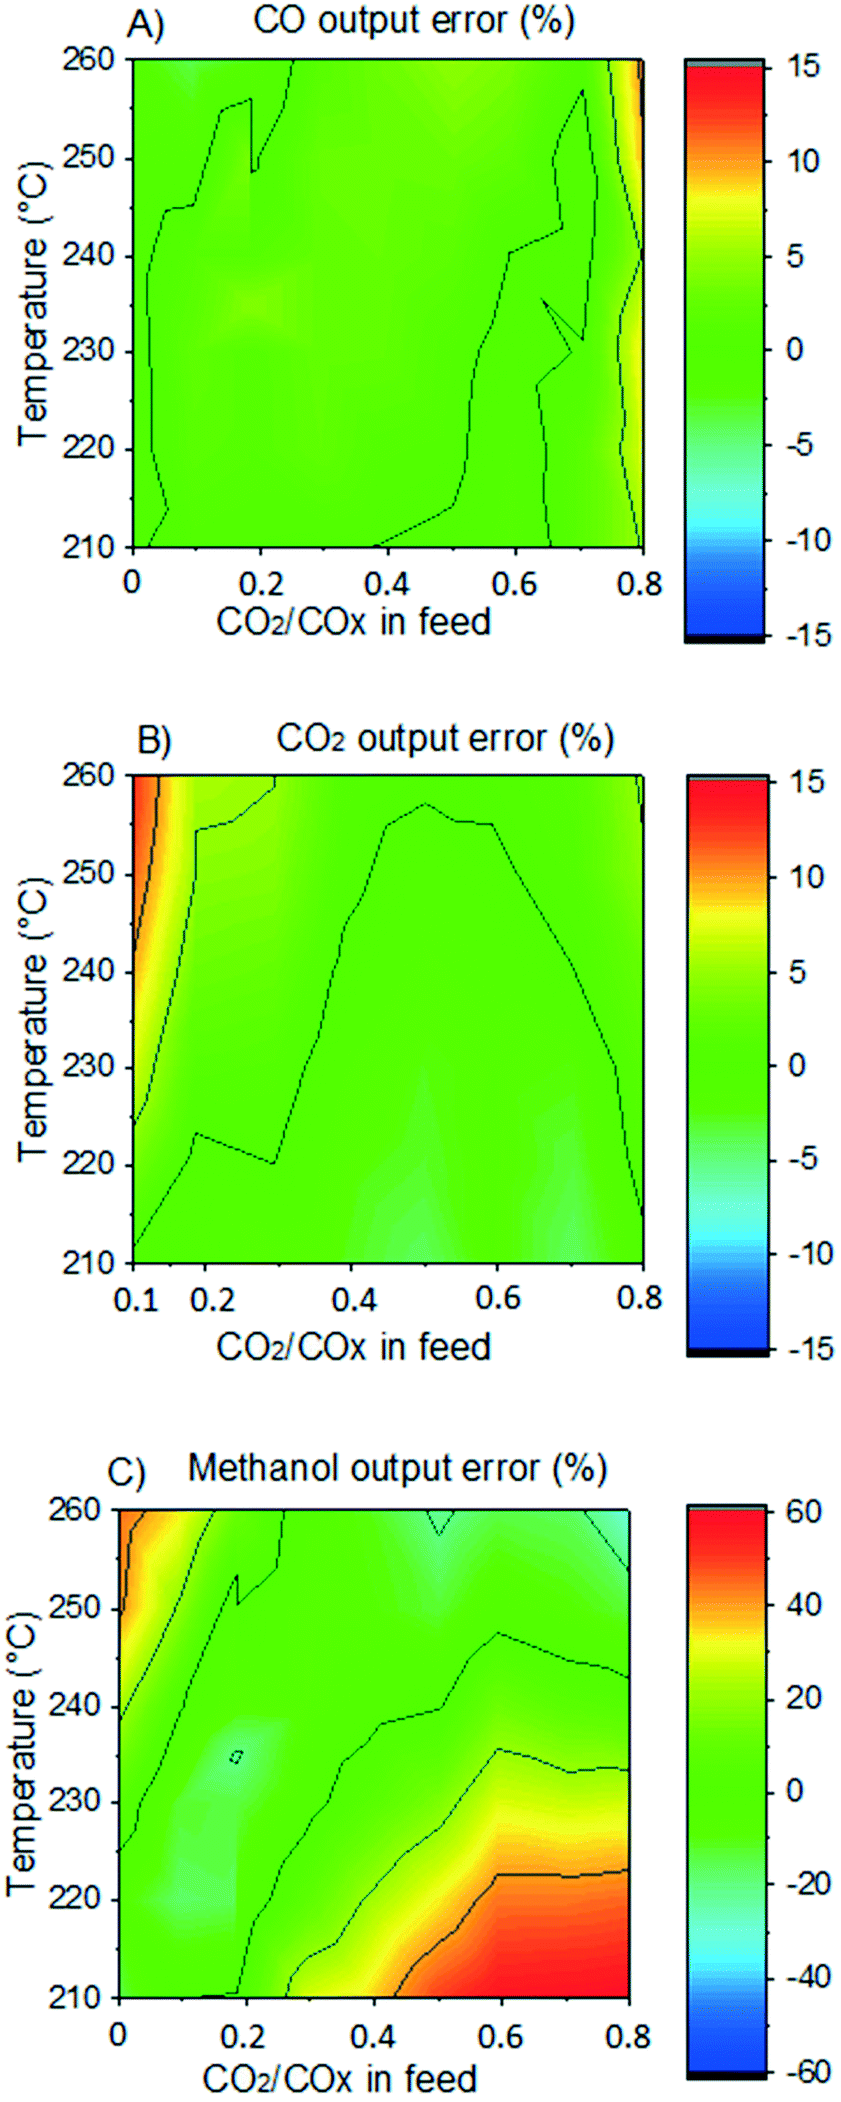 | ||
| Fig. 8 Simulation error (color) as a function of CO2/COx in feed and temperature. Operating conditions: 41 bar, GHSV = 24 LS h−1 gcat−1, feed concentration: H2/COx/N2 = 45.3/14.3/40.4% v/v. A) CO. B) CO2. C) Methanol. | ||
4.2 Reaction flow and sensitivity analysis
The validated model was used to simulate the methanol synthesis at an extended range of conditions. In Fig. 9, it is shown the turnover frequency of the different reaction paths and the COX conversion along the reactor. The operating conditions are 60 bar, 220 °C, 4.8 LS h−1 gcat−1, and a feed concentration of H2/COx = 80/20% v/v. Fig. 9 is complemented by the coverages of the surface species (Fig. 10) and the zinc coverage along the reactor (Fig. 11). In Fig. S6–S8† analogous diagrams are shown for an operating temperature of 250 °C.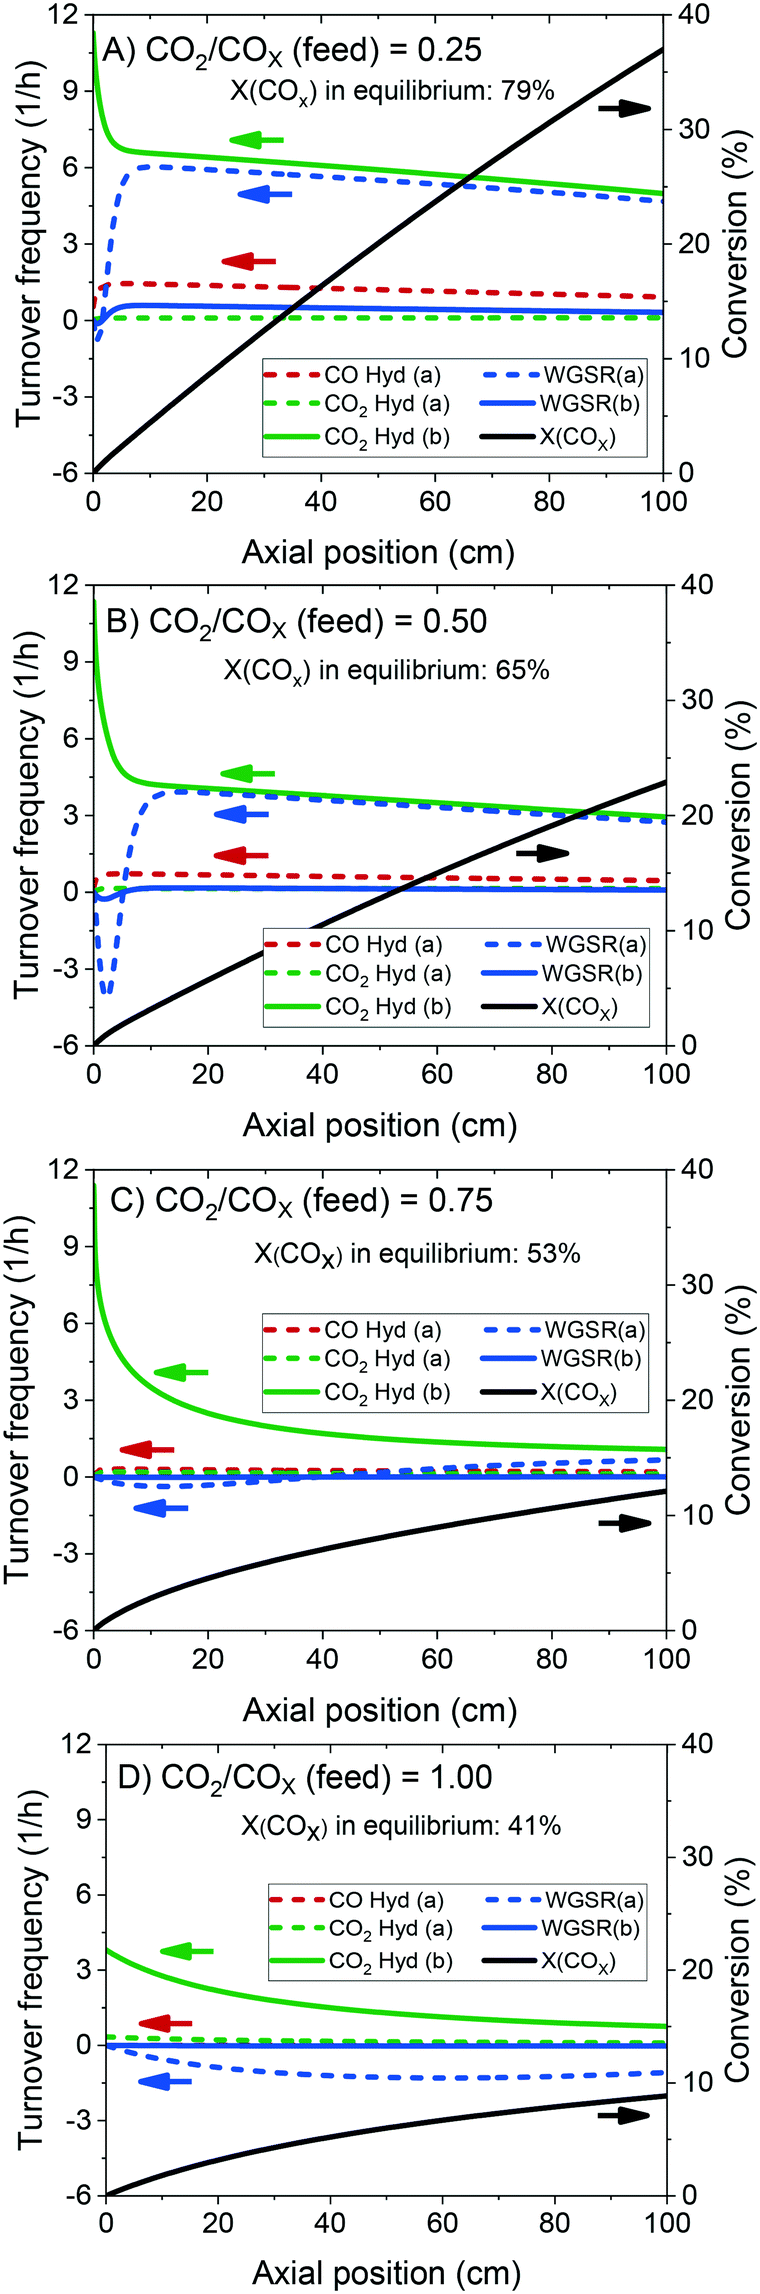 | ||
| Fig. 9 Turnover frequency and conversion of COX (X) along a methanol synthesis reactor with a length of 100 cm, simulated with the kinetic model. The arrows show to which y-axis the curves belong. Operating conditions: 220 °C, 60 bar, GHSV = 4.8 LS h−1 gcat−1, feed concentration: H2/COx = 80/20% v/v. A) CO2/COx = 0.25. B) CO2/COx = 0.50. C) CO2/COx = 0.75. D) CO2/COx = 1.00. | ||
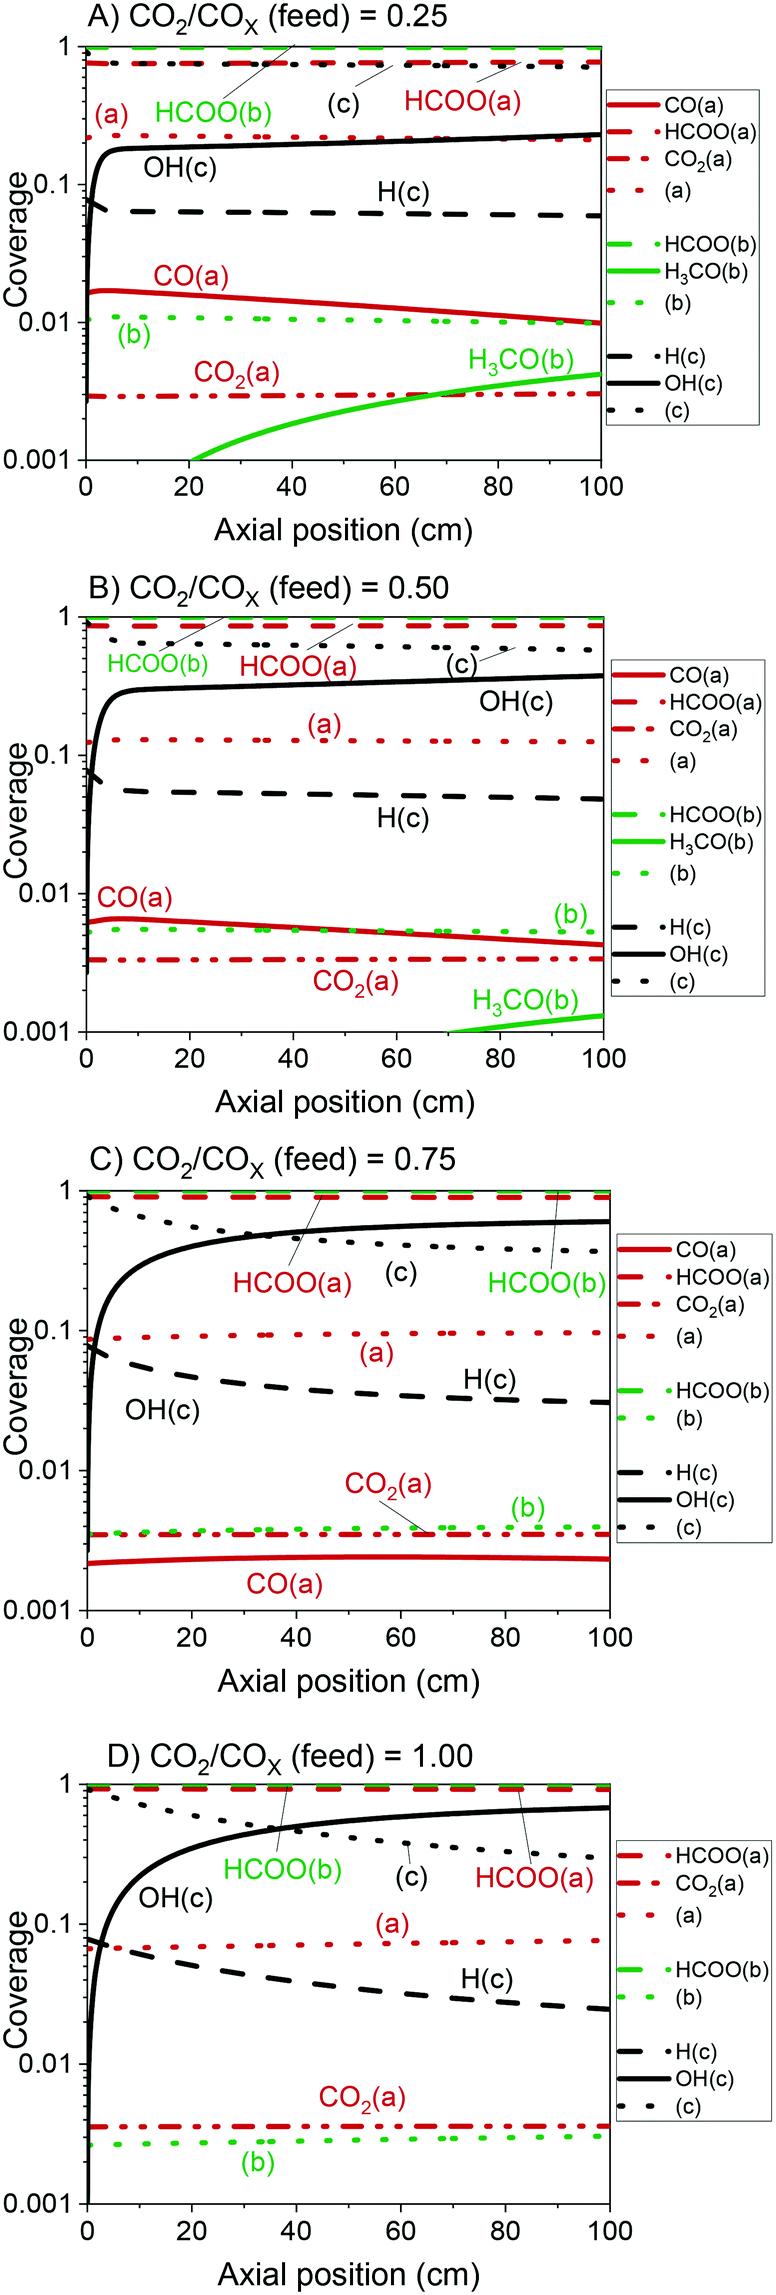 | ||
| Fig. 10 Coverage of the surface species along the reactor with a length of 100 cm. Operating conditions: 220 °C, 60 bar, GHSV = 4.8 LS h−1 gcat−1, feed concentration: H2/COx = 80/20% v/v. A) CO2/COx = 0.25. B) CO2/COx = 0.50. C) CO2/COx = 0.75. D) CO2/COx = 1.00. | ||
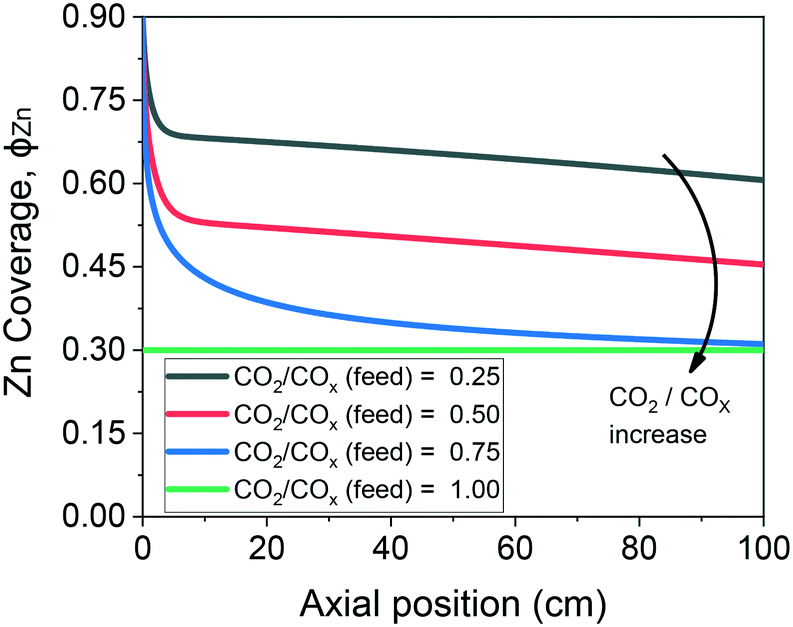 | ||
| Fig. 11 Zinc coverage along the methanol synthesis reactor with a length of 100 cm. Operating conditions: 220 °C, 60 bar, GHSV = 4.8 LS h−1 gcat−1, feed concentration: H2/COx = 80/20% v/v. | ||
According to the simulations, CO hydrogenation on site a (Cu) is only relevant at CO-rich feeds (e.g. 20% of the methanol production at ȳCO2,0 = 0.25), CO2 hydrogenation on site a (Cu) does not occur significantly at any condition, and CO2 hydrogenation on site b (Cu/Zn) is the main reaction path for the production of methanol, in agreement with findings from DFT studies.24,30
At CO-rich conditions (e.g. ȳCO2,0 ≤ 0.50), CO2 conversion and (consequently) water generation are fast within the initial 10 cm of the reactor, mainly due to CO2 hydrogenation, but probably also due to contributing rWGSR (depending on the CO2/COx ratio and the temperature). Furthermore, the WGSR rate increases rapidly along the reactor, and after a certain amount of water has been produced (it is dependent on the operating conditions), the WGSR rate is the approximately equal to the CO2 hydrogenation rate. From this axial position on (ca. 10 cm, Fig. 9A and B), CO2 concentration remains constant, because it is consumed in the CO2 hydrogenation but regenerated in the WGSR. Therefore, from this axial position on, only CO is converted, through the combination of WGSR and CO2 hydrogenation and through direct CO hydrogenation.
With more CO2 content in the feed (e.g. ȳCO2,0 ≥ 0.75), a higher conversion of CO2 is achieved, which implies that higher amounts of water are generated, and the methanol synthesis is severely slowed down. At CO2-rich feeds, there is significant CO production via the rWGSR, increasing with temperature (see Fig. S7†).
At constant temperature and pressure, the decrease of CO2 hydrogenation rate on Cu/Zn, along the reactor length, has three main causes:
• The decrease of H(c) coverage, which is caused by H2(g) consumption;
• The zinc coverage (ϕZn) decrease, caused by the generation of water and consumption of H2 and CO,27,29 which significantly changes the gas reducing power (eqn (32)).
• The product inhibition with the increase of H3CO(b) and OH(b), because of methanol and water accumulation, respectively.
From our simulations, the product inhibition has the highest effect in reducing the reaction rate. This is particularly relevant for CO2-rich feeds, in which a significant water accumulation takes place and, thus, OH(c) reduces the amount of free sites (c), as shown in Fig. 10C and D.
In a recent work,52 a methanol-assisted autocatalytic mechanism was proposed, with water as the only effective inhibitor of the methanol synthesis. If appropriate DFT calculations were accessible, our model could be extended accordingly and this possibility could be investigated further.
In Fig. 12, the positive effects of pressure and CO2 concentration, and the negative effect of temperature on formate coverage on Cu and on Cu/Zn are shown. Formate requires lower temperature, higher pressure, and higher CO2 concentration to block the majority of Cu sites (Fig. 12A and B), but it covers most of the Cu/Zn sites even at mild conditions (Fig. 12C and D). Therefore, moderate consumption of CO2 changes the formate coverage on Cu/Zn only slightly, and therefore the reaction rate of CO2 hydrogenation is not as much affected by CO2 consumption as by the factors previously discussed. This was experimentally demonstrated by varying the feed concentration of CO2 while maintaining the other conditions constant, as shown in Fig. 13.
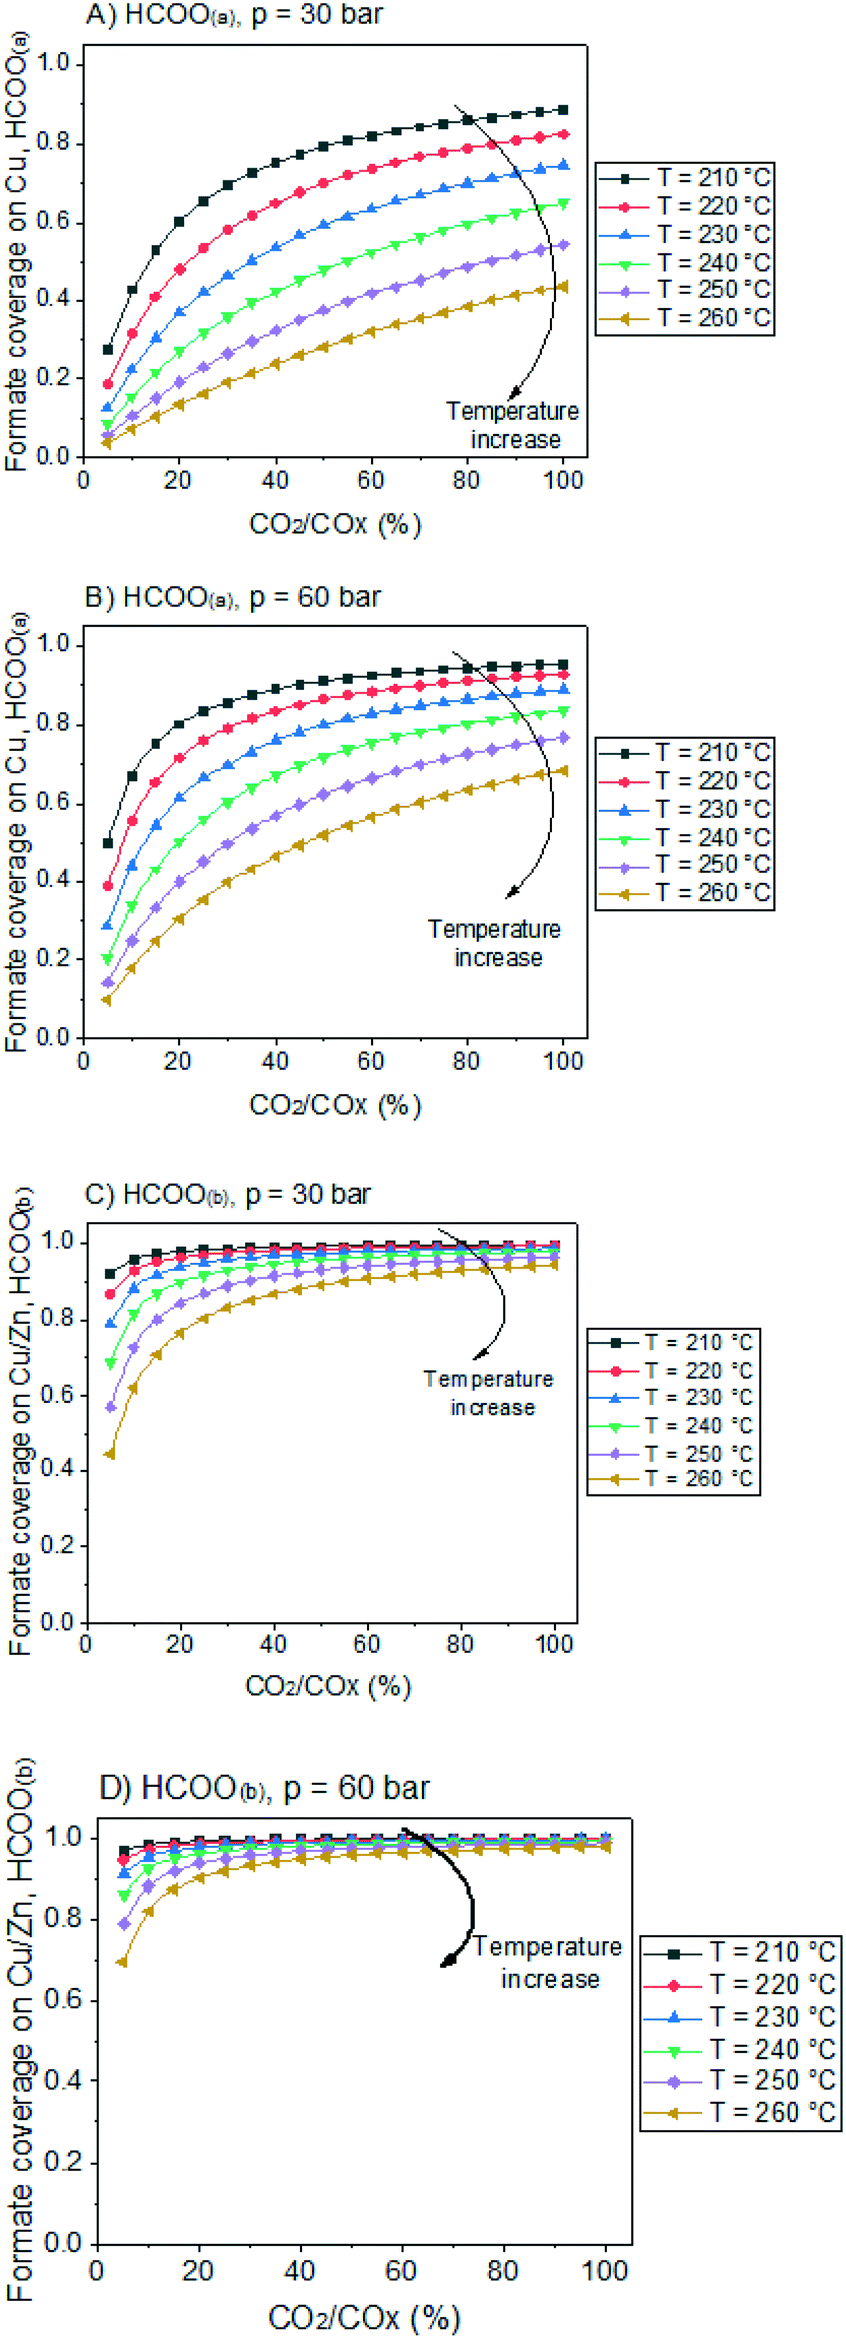 | ||
| Fig. 12 Formate coverage on Cu and Cu/Zn active surfaces, as a function of CO2/COx ratio in the gas phase. The gas phase concentration correspond to a typical low conversion condition: H2/COx/CH3OH/H2O = 79.8/19.8/0.2/0.2% v/v. The curves correspond to different temperatures. A) HCOO(a), 30 bar. B) HCOO(a), 60 bar. C) HCOO(b), 30 bar. D) HCOO(b), 60 bar. | ||
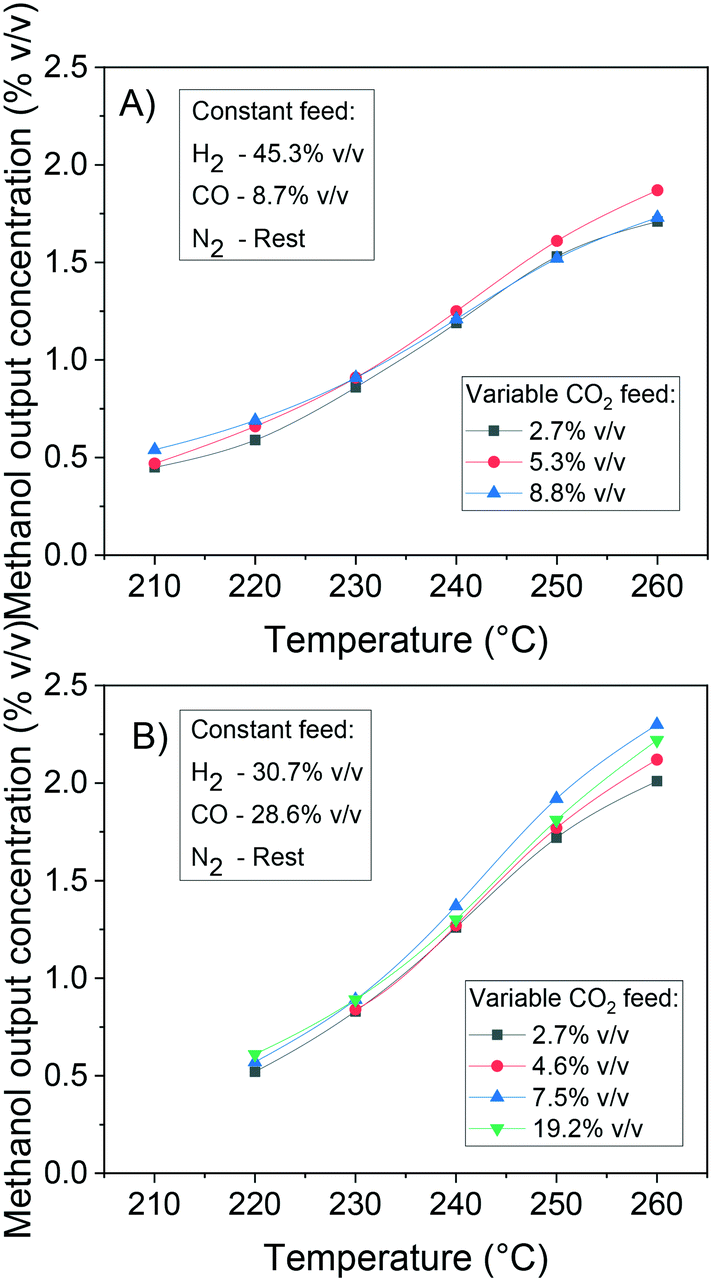 | ||
| Fig. 13 Effect of CO2 feed concentration on the methanol production at 41 bar, 220–260 °C and 32 LS h−1 gcat−1. A) Constant feed H2/CO = 45.3/8.7% v/v. B) Constant feed H2/CO = 30.7/28.6% v/v. | ||
The method of degree of rate control (DRC) is applied to investigate the sensitivity of the methanol production in relation to the free Gibbs energy of each surface intermediate and of each transition state of the reversible reactions. This analysis is shown at 60 bar (Fig. 14) and different temperatures considering a gas phase concentration at low conversion: H2/COx/CH3OH/H2O = 79.8/19.8/0.2/0.2% v/v. A separate analysis is made for the case of little CO content in the gas (Fig. 15), which includes the sensitivity of both CO and methanol generation. The DRC was also applied to a pressure of 30 bar, and similar results to the ones at 60 bar were found (see Fig. S9 and S10†).
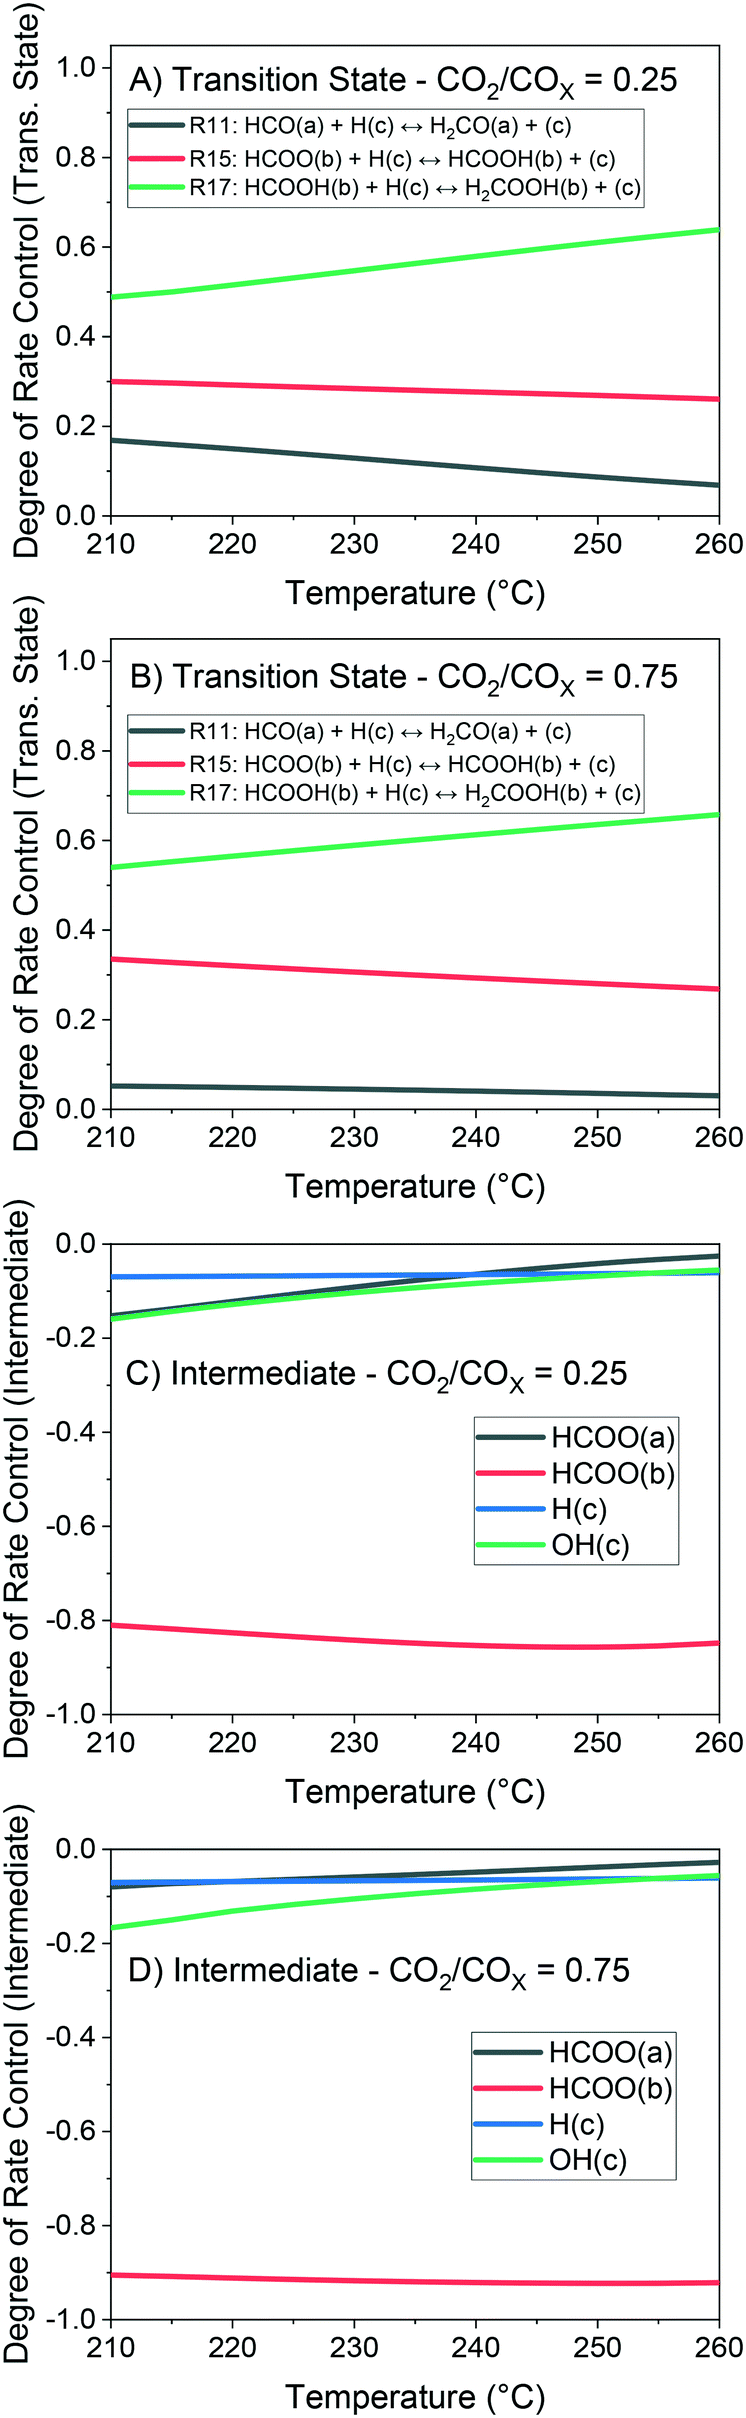 | ||
| Fig. 14 Degree of rate control (DRC) analysis of the methanol production at 60 bar and 210–260 °C. Gas concentration: H2/COx/CH3OH/H2O = 79.8/19.8/0.2/0.2% v/v. A) Trans. state – CO2/COx = 0.25. B) Trans. state – CO2/COx = 0.75. C) Intermediate – CO2/COx = 0.25. D) Intermediate – CO2/COx = 0.75. | ||
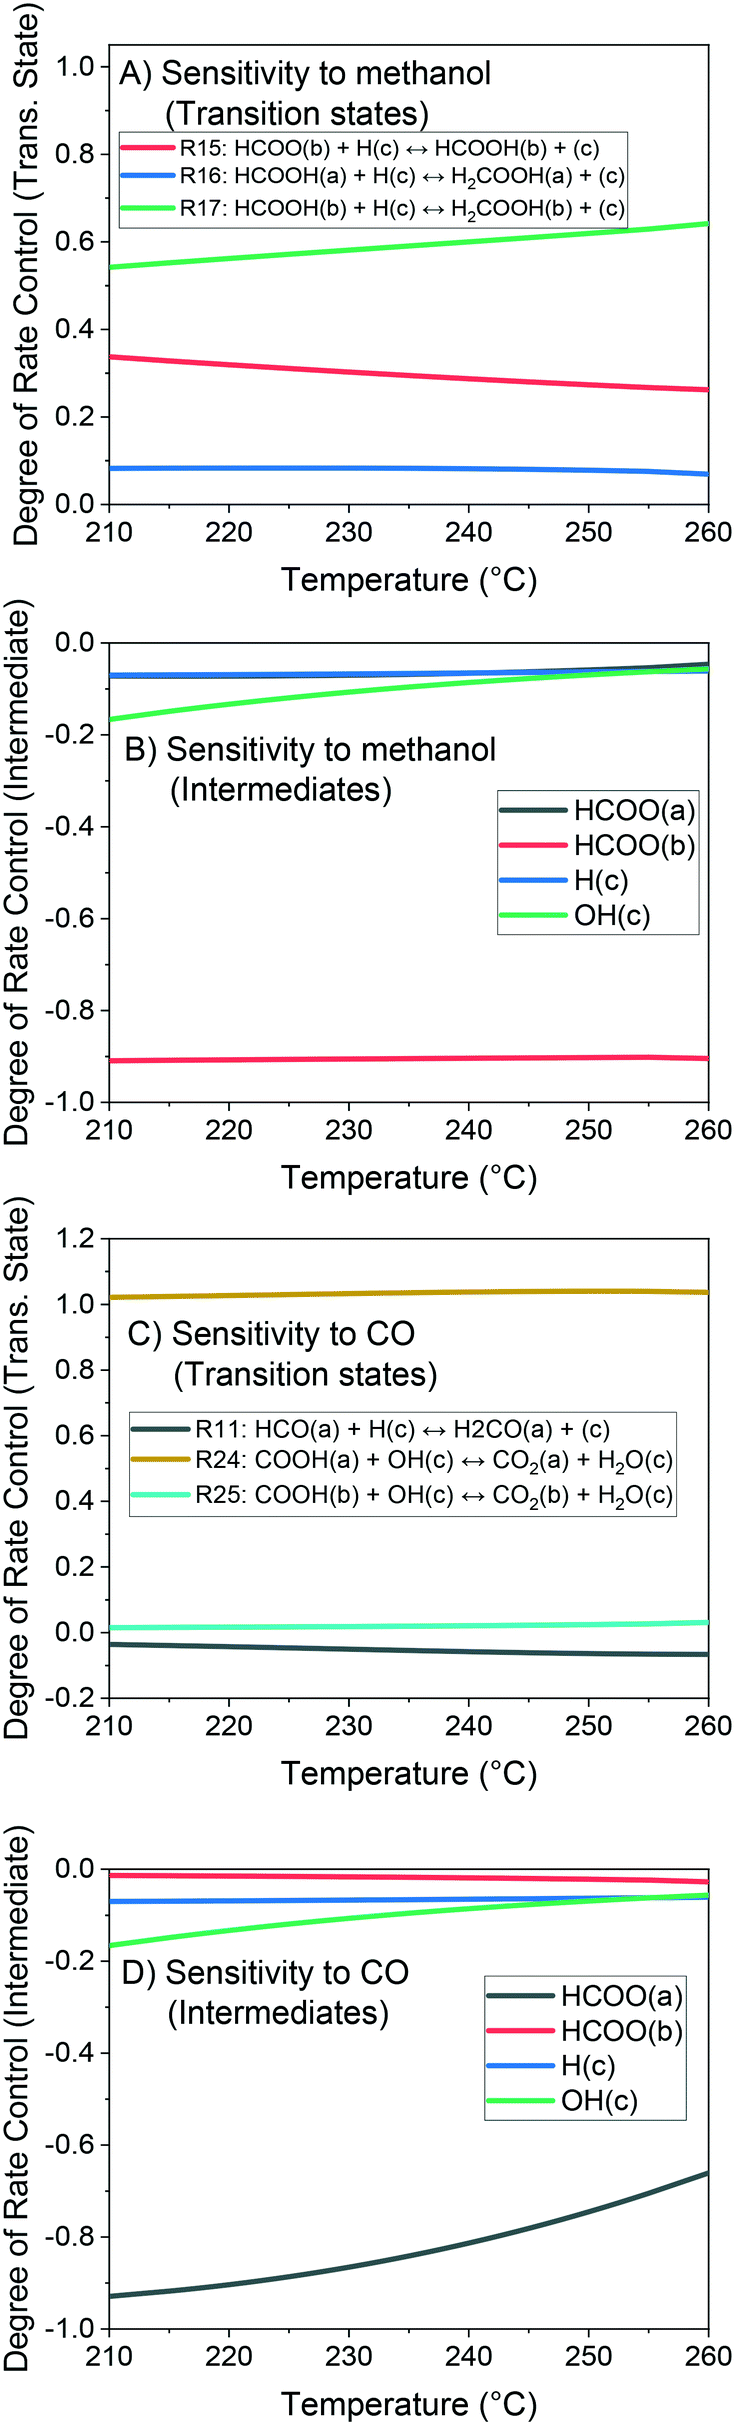 | ||
| Fig. 15 Degree of rate control (DRC) analysis at 210–260 °C, 60 bar, and a gas concentration of H2/CO/CO2/CH3OH/H2O = 79.8/0.2/19.6/0.2/0.2% v/v. A) Sensitivity to methanol, transition states. B) Sensitivity to methanol, intermediates. C) Sensitivity to CO, transition states. D) Sensitivity to CO, intermediates. | ||
The most sensitive reaction according to our microkinetic model is the hydrogenation of formic acid (HCOOH(b)) on Cu/Zn (R17, Table 2) for the entire operating region under study, which is in agreement with other DFT-derived models19,53 and lumped kinetic models.11,16 Xu et al.22 concluded that the hydrogenation of formic acid is the RDS for the CO2 hydrogenation at lower formate coverages, and the H2COOH* association (R19, Table 2) is the RDS for high formate coverages, the latter conclusion being a result of the one-site approach made by the authors (see section 3.1). Grabow et al.18 and Park et al.21 found the hydrogenation of H2CO* to be the RDS on Cu (111) without considering the zinc influence. Finally, the model presented here shows that the hydrogenation of formate (R15), a typically assumed RDS in formal kinetic models,12,15 has a reasonable sensitivity in our model (0.20–0.35), but still far behind the sensitivity of R17 (0.50–0.70).
In the CO hydrogenation on Cu, the most sensible reaction of this microkinetic model is the hydrogenation of HCO(a) (R11), which is in agreement with findings of Van Rensburg et al.19 In formal kinetic modeling studies, Graaf et al.11 proposed the hydrogenation of H2CO* (R20) to be the RDS, while Seidel et al.15 assumed that the RDS is the hydrogenation of H3CO* (R6).
From our DRC analysis of CO generation sensitivity at CO2/COx = 0.987 (Fig. 15), the reaction between CO2* and H2O* on Cu (R24) is the RDS of the rWGSR. Other reported models that include the WGSR usually consider the redox mechanism12,15 or the carboxyl mechanism without water assistance16 to be the RDS, which have been tested here with DFT data and also evaluated elsewhere as not significant if compared to the water-assisted carboxyl mechanism.31
Regarding the participating intermediates, our findings suggest that formate on Cu/Zn (HCOO(b)) is the most sensitive species, as it is the most abundant species, and participates on the second most sensitive reaction (formate hydrogenation), which produces the formic acid (HCOOH(b)).
The rWGSR is mostly sensitive to formate adsorbed on Cu, although formate itself is a spectator of this reaction path, suggesting that formate may inhibit the rWGSR at a certain level. This hypothesis is further supported by the argument that the rWGSR is much slower on Cu/Zn, which has a formate coverage close to 1.
Summary and conclusions
A thermodynamically consistent microkinetic model was successfully developed, based on first principles DFT derived kinetic data for the methanol synthesis and the WGSR on Cu (211) and Cu/Zn (211). A method for the quantification of the zinc coverage dependent on the operating conditions, proposed in the literature, is applied here, and is slightly modified to improve the estimation for gas compositions rich in H2 and CO.With an extensive validation consisting in 359 own experiments (available in the ESI†) and experiments from three different sources in literature (i.e. 139 data points from Seidel et al.,15 98 data points from Park et al.,14 and 94 data points from Slotboom et al.16), the model reproduces the system quantitatively in a broad range of relevant conditions, showing discrepancies only for the combination of low temperature, high CO2/COx concentration in feed and high GHSV. The proposed model is based on theoretical calculations, and we believe it has a high change of accurately predicting the methanol synthesis outside the validation region.
The reaction flow analysis showed that methanol is mainly formed from CO2 hydrogenation on site b (Cu/Zn), and that CO conversion is mostly due to the WGSR on site a (Cu). At CO-rich conditions, direct CO hydrogenation is responsible for some of the methanol generation (e.g. 20% of the methanol production for CO2/COX = 0.25). On the other hand, this reaction pathway is strongly inhibited by formate accumulation on Cu surface at higher CO2 concentrations.
The model suggests that formation of methanol and water leads to an accumulation of H3CO(b) and OH(c), respectively, with both slowing down the overall reaction. This is particularly significant in the case of CO2-rich feeds, as high amounts of water are generated in the process. We assume that the productivity should be increased by using reactor designs that enable product extraction in situ, such as using membranes, or integrating reaction and product condensation steps. This is especially encouraged for the conversion of CO2 to methanol.
The sensitivity analysis, using the method of the degree of rate control (DRC), pointed out that the formic acid hydrogenation on site b (Cu/Zn) (HCOOH(b)) is the most sensitive step (DRC around 0.60). Formate (HCOO(a)) was found to be the most sensitive intermediate in the rWGSR, although it does not participate in this reaction, which suggests that the rWGSR is slowed down due to formate blocking of free sites. With this finding and based on the premise that formate only reacts further to produce methanol, we formulate the following hypothesis: If a modification on the Cu/Zn-based catalysts is realized, in which formate binds stronger on the Cu site and achieves coverages closer to 1, the rWGSR might be more effectively inhibited, and CO2 conversion at CO2-rich systems should be enhanced.
The presented microkinetic model can be further extended with additional reactions paths if DFT calculations are available (e.g. methanol dehydration to DME or methanol-assisted autocatalytic reaction paths).
The quantification of the zinc coverage may be improved by an approach on a higher level of theory for the zinc oxide activity, by an operando analysis to check which is the maximum zinc coverage on the surface at a H2/CO feed, and with an approach for non-equilibrated WGSR and domination of zinc reduction via hydrogen (e.g. for high CO2/COX ratio in feed).
Nomenclature
| A Cat | Active surface area (m2) |
| A n,m | Coefficient n of the Gibbs term of reaction path m (eqn (19)) |
| a n,j | Coefficient n of the Gibbs term of gas species j (eqn (14)) |
| a j | Activity of gas component j |
| Δcp,m | Heat capacity change of global reaction m (kJ mol−1 K−1) |
| d i | Crystallite diameter of species i (m) |
| DRCi | Degree of rate control of a transition state or surface intermediate i |
| E A,k | Activation energy of reaction k (kJ mol−1) |
| f j | Fugacity of gas component j (Pa) |
| G 0 j (T) | Free Gibbs energy at 1 bar and temperature T (kJ mol−1) |
| ΔG 0R(T) | Free Gibbs energy of (global/surface) reaction R at 1 bar and temperature T (kJ mol−1) |
| ΔH 0298.15K | Standard reaction enthalpy (kJ mol−1) |
| ΔH 0seg | Segregation enthalpy at 1 bar (kJ mol−1) (see eqn (33) and (34)) |
| h | Planck constant (6.62607 × 10⁻³⁴ J s) |
| K R | Equilibrium constant of reversible reaction R |
| k b | Boltzmann constant (1.38065 × 10⁻²³ J K−1) |
| L | Catalyst bed length (m) |
| M i | Molar mass of species i (kg mol−1) |
| m Cat | Catalyst mass (kg) |
| N g | Number of gas components (—) |
| N r | Number of surface reactions (—) |
| N s | Number of surface intermediates (—) |
| n M,Cat | Specific catalyst site quantity (mol kg−1) |
| ṅ | Total mole flow (mol s−1) |
| p 0 | Reference pressure (1 × 10⁵ Pa) |
| q n,m | Thermodynamic constraint n of reaction pathway m |
| R | Universal gas constant (8.31446 × 10⁻³ kJ mol−1 K−1) |
| r k | Turnover rate of reversible reaction k (s−1) |
| ΔS ≠ k | Entropy barrier of reaction k (kJ mol−1 K−1) |
| ṡ k | Rate of reaction k (mol m−2 s−1) |
| T | Temperature (K) |
| w k | Selectable weight of reaction k (—) |
| y j | Mole fraction of gas component j (mol/mol) |
| y n j,out | Experimental value (point n) of mole fraction of gas component j of point n in the reactor outlet (mol/mol) |
| ŷ n j,out | Simulated value (point n) of mole fraction of gas component j of point n in the reactor outlet (mol/mol) |
| X Zn | Solubility of zinc in the copper bulk (mol/mol) |
Greek
| α | Proposed linear relation parameter between the zinc oxide activity and the zinc solubility in the Cu bulk (—) |
| β k | Correction term of reaction k because of the thermodynamic consistency (—) |
| Γ | Surface site density (mol m−2) |
| δ | Step size of the finite differences method (kJ mol−1) |
| γ Zn | Activity coefficient of metallic zinc (—) |
|
i
| Surface energy of species i (kJ m−2) |
| ξ k,m | Stoichiometric coefficient of a reversible surface reaction k in the global reaction pathway m |
| θ i | Surface coverage of species i (—) |
| ρ i | Density of species i (kg m3) |
| σ i | Number of surface sites occupied by species i (—) |
| Stoichiometric coefficient of reactant i in reaction k (—) |
| Stoichiometric coefficient of product i in reaction k (—) |
| ν ik | Stoichiometric gain of species i in reaction k (—) |
| ϕ i | Fraction of the site type of surface species i in relation to the total number of sites for carbon-containing compounds (sites a and b) |
| χ i | Species i |
Subscription
| 3p | Related to the three-parameter Gibbs function (eqn (19)) |
| 7p | Related to the seven-parameter Gibbs function (eqn (14)) |
| DFT | Values from DFT calculations |
| in | Species entering the reactor |
| m | Reaction path number (see Fig. 2) |
| out | Species leaving the reactor |
Superscription
| + | Related to the forward reaction |
| − | Related to the reverse reaction |
| Orig. | Original DFT value from Studt et al.30,31 |
| TC | Thermodynamically consistent value |
Conflicts of interest
There are no conflicts to declare.Acknowledgements
The authors thank Coordenação de Aperfeiçoamento de Pessoal de Nível Superior (CAPES) for financing the PhD scholarship of B. L. O. Campos (Process Number: 88881.174609/2018-01). The authors acknowledge the financial support from the Helmholtz Research Program “Storage and Cross-linked Infrastructures”. Dr. Steffen Tischer and Prof. Olaf Deutschmann (ITCP-KIT) are acknowledged for fruitful discussions regarding the thermodynamic consistency.References
- N. Dahmen, E. Henrich, E. Dinjus and F. Weirich, Energy Sustain. Soc., 2012, 2, 3 CrossRef.
- J.-K. Lee, I.-B. Lee and J. Han, J. Ind. Eng. Chem., 2019, 75, 77–85 CrossRef.
- J. R. Rostrup-Nielsen, Catal. Today, 2000, 63, 159–164 CrossRef.
- P. Lv, Z. Yuan, C. Wu, L. Ma, Y. Chen and N. Tsubaki, Energy Convers. Manage., 2007, 48, 1132–1139 CrossRef.
- N. Dahmen, U. Arnold, N. Djordjevic, T. Henrich, T. Kolb, H. Leibold and J. Sauer, J. Supercrit. Fluids, 2015, 96, 124–132 CrossRef.
- M. Kopp, D. Coleman, C. Stiller, K. Scheffer, J. Aichinger and B. Scheppat, Int. J. Hydrogen Energy, 2017, 42, 13311–13320 CrossRef.
- G. A. Olah, A. Goeppert and G. K. S. Prakash, J. Org. Chem., 2009, 74, 487–498 CrossRef.
- J. Artz, T. E. Müller, K. Thenert, J. Kleinekorte, R. Meys, A. Sternberg, A. Bardow and W. Leitner, Chem. Rev., 2018, 118, 434–504 CrossRef.
- J. B. Hansen and P. E. H. Nielsen, in Handbook of Heterogeneous Catalysis, ed. E. H. G. Knözinger, F. Schüth and J. Weitkamp, 2nd edn, 2008, pp. 2920–2949, DOI:10.1002/9783527610044.hetcat0148.
- Flaticon Icons, Freepik, https://www.flaticon.com/authors/freepik, (accessed August/ 2020) Search PubMed.
- G. H. Graaf, E. J. Stamhuis and A. A. C. M. Beenackers, Chem. Eng. Sci., 1988, 43, 3185–3195 CrossRef.
- K. M. V. Bussche and G. F. Froment, J. Catal., 1996, 161, 1–10 CrossRef.
- C. V. Ovesen, B. S. Clausen, J. Schiøtz, P. Stoltze, H. Topsøe and J. K. Nørskov, J. Catal., 1997, 168, 133–142 CrossRef.
- N. Park, M.-J. Park, Y.-J. Lee, K.-S. Ha and K.-W. Jun, Fuel Process. Technol., 2014, 125, 139–147 CrossRef.
- C. Seidel, A. Jörke, B. Vollbrecht, A. Seidel-Morgenstern and A. Kienle, Chem. Eng. Sci., 2018, 175, 130–138 CrossRef.
- Y. Slotboom, M. J. Bos, J. Pieper, V. Vrieswijk, B. Likozar, S. R. A. Kersten and D. W. F. Brilman, Chem. Eng. J., 2020, 389, 124181 CrossRef.
- L. P. de Oliveira, D. Hudebine, D. Guillaume and J. J. Verstraete, Oil Gas Sci. Technol., 2016, 71, 45 CrossRef.
- L. C. Grabow and M. Mavrikakis, ACS Catal., 2011, 1, 365–384 CrossRef.
- W. J. van Rensburg, M. A. Petersen, M. S. Datt, J.-A. van den Berg and P. van Helden, Catal. Lett., 2015, 145, 559–568 CrossRef.
- Y.-M. Liu, J.-T. Liu, S.-Z. Liu, J. Li, Z.-H. Gao, Z.-J. Zuo and W. Huang, J. CO2 Util., 2017, 20, 59–65 CrossRef.
- J. Park, J. Cho, Y. Lee, M.-J. Park and W. B. Lee, Ind. Eng. Chem. Res., 2019, 58, 8663–8673 CAS.
- D. Xu, P. Wu and B. Yang, J. Phys. Chem. C, 2019, 123, 8959–8966 CrossRef CAS.
- M. Huš, D. Kopač, N. S. Štefančič, D. L. Jurković, V. D. B. C. Dasireddy and B. Likozar, Catal. Sci. Technol., 2017, 7, 5900–5913 RSC.
- M. Behrens, F. Studt, I. Kasatkin, S. Kühl, M. Hävecker, F. Abild-Pedersen, S. Zander, F. Girgsdies, P. Kurr, B.-L. Kniep, M. Tovar, R. W. Fischer, J. K. Nørskov and R. Schlögl, Science, 2012, 336, 893–897 CrossRef CAS PubMed.
- F. Studt, F. Abild-Pedersen, J. B. Varley and J. K. Nørskov, Catal. Lett., 2013, 143, 71–73 CrossRef CAS.
- Y. Morikawa, K. Iwata, J. Nakamura, T. Fujitani and K. Terakura, Chem. Phys. Lett., 1999, 304, 91–97 CrossRef CAS.
- J. D. Grunwaldt, A. M. Molenbroek, N. Y. Topsøe, H. Topsøe and B. S. Clausen, J. Catal., 2000, 194, 452–460 CrossRef CAS.
- R. van den Berg, G. Prieto, G. Korpershoek, L. I. van der Wal, A. J. van Bunningen, S. Lægsgaard-Jørgensen, P. E. de Jongh and K. P. de Jong, Nat. Commun., 2016, 7, 13057 CrossRef CAS.
- S. Kuld, M. Thorhauge, H. Falsig, C. F. Elkjær, S. Helveg, I. Chorkendorff and J. Sehested, Science, 2016, 352, 969–974 CrossRef CAS PubMed.
- F. Studt, M. Behrens, E. L. Kunkes, N. Thomas, S. Zander, A. Tarasov, J. Schumann, E. Frei, J. B. Varley, F. Abild-Pedersen, J. K. Nørskov and R. Schlögl, ChemCatChem, 2015, 7, 1105–1111 CrossRef CAS.
- F. Studt, M. Behrens and F. Abild-Pedersen, Catal. Lett., 2014, 144, 1973–1977 CrossRef CAS.
- S. Polierer, J. Jelic, S. Pitter and F. Studt, J. Phys. Chem. C, 2019, 123, 26904–26911 CrossRef CAS.
- B. Hammer, Phys. Rev. B: Condens. Matter Mater. Phys., 2001, 63, 205423 CrossRef.
- A. B. Mhadeshwar, J. R. Kitchin, M. A. Barteau and D. G. Vlachos, Catal. Lett., 2004, 96, 13–22 CrossRef CAS.
- D.-Y. Peng and D. B. Robinson, Ind. Eng. Chem. Fundam., 1976, 15, 59–64 CrossRef CAS.
- L. Meng and Y.-Y. Duan, Fluid Phase Equilib., 2005, 238, 229–238 CrossRef CAS.
- L. Meng, Y.-Y. Duan and X.-D. Wang, Fluid Phase Equilib., 2007, 260, 354–358 CrossRef CAS.
- U. K. Deiters, Fluid Phase Equilib., 2013, 352, 93–96 CrossRef CAS.
- M. G. Evans and M. Polanyi, Trans. Faraday Soc., 1935, 31, 875–894 RSC.
- H. Eyring, J. Chem. Phys., 1935, 3, 107–115 CrossRef CAS.
- H. Stotz, L. Maier, A. Boubnov, A. T. Gremminger, J. D. Grunwaldt and O. Deutschmann, J. Catal., 2019, 370, 152–175 CrossRef CAS.
- K. H. Delgado, L. Maier, S. Tischer, A. Zellner, H. Stotz and O. Deutschmann, Catalysis, 2015, 5, 871–904 CAS.
- E. Goos, A. Burcat and B. Ruscic, New NASA thermodynamic polynomials databasehttp://garfield.chem.elte.hu/Burcat/THERM.DAT Acess: Aug/ 2020 Search PubMed.
- R. Schlögl, Angew. Chem., Int. Ed., 2015, 54, 3465–3520 CrossRef PubMed.
- B. L. D. O. Campos, A. O. S. D. Costa and E. F. D. Costa Junior, Sol. Energy, 2017, 157, 321–327 CrossRef.
- B. L. D. O. Campos, A. O. S. D. Costa, K. C. de Souza Figueiredo and E. F. D. Costa Junior, Desalination, 2018, 437, 184–194 CrossRef CAS.
- R. C. Kohberger, Anal. Biochem., 1980, 101, 1–6 CrossRef CAS.
- B. Leite, T. Croguennec, A. Halabi and E. F. D. Costa Junior, J. Food Eng., 2021, 292, 110272 CrossRef CAS.
- C. Stegelmann, A. Andreasen and C. T. Campbell, J. Am. Chem. Soc., 2009, 131, 8077–8082 CrossRef CAS.
- C. T. Campbell, ACS Catal., 2017, 7, 2770–2779 CrossRef CAS.
- H. Ruland, H. Song, D. Laudenschleger, S. Stürmer, S. Schmidt, J. He, K. Kähler, M. Muhler and R. Schlögl, ChemCatChem, 2020, 12, 3216–3222 CrossRef CAS.
- J. Thrane, S. Kuld, N. D. Nielsen, A. D. Jensen, J. Sehested and J. M. Christensen, Angew. Chem., Int. Ed., 2020, 59, 18189–18193 CrossRef CAS PubMed.
- M. S. Tameh, A. K. Dearden and C. Huang, J. Phys. Chem. C, 2018, 122, 17942–17953 CrossRef CAS.
Footnote |
| † Electronic supplementary information (ESI) available. See DOI: 10.1039/d1re00040c |
| This journal is © The Royal Society of Chemistry 2021 |