Fast microflow kinetics and acid catalyst deactivation in glucose conversion to 5-hydroxymethylfurfural†
Tai-Ying
Chen
 a,
Ziwei
Cheng
 a,
Pierre
Desir
a,
Basudeb
Saha‡
a,
Pierre
Desir
a,
Basudeb
Saha‡
 b and
Dionisios G.
Vlachos
 *ab
*ab
aDepartment of Chemical and Biomolecular Engineering, University of Delaware, 150 Academy Street, Newark, Delaware 19716, USA. E-mail: vlachos@udel.edu
bCatalysis Center for Energy Innovation, 221 Academy Street, Newark, Delaware 19716, USA
First published on 2nd November 2020
Abstract
5-Hydroxymethyl furfural (HMF) is an important platform chemical because it can be upgraded to various drop-in and performance-advantaged products. The cascade reaction of HMF production from glucose over a Lewis acid (CrCl3) and a Brønsted acid (HCl) catalyst in aqueous media is investigated in a microreactor at short residence times and high temperatures. We study the formation of various chromium species using UV-visible spectrophotometry and elucidate the Cr(III) speciation. The catalyst reactivity increases sharply at short residence times, and then drops at long times. This indicates that the catalyst treatment plays a vital role in getting optimal reactivity, and recording the catalyst history is necessary. We develop a kinetic model to describe the catalyst speciation as well as the Lewis and Brønsted acid-catalyzed reaction kinetics using a hierarchical approach. The model is in good agreement with experiments. We demonstrate the benefits of tandem Lewis-external added Brønsted acid catalysis in processing time, productivity, and catalyst stability. We apply this model to optimize the HMF yield and obtain ∼36% yield at 200 °C in 7 min and report the highest productivity of ∼15% yield per min, demonstrating the opportunity of reaching high productivity at short residence times.
Introduction
Due to the growing environmental concerns, replacing fossil fuel-derived products with molecules derived from renewable lignocellulosic biomass has received increased attention.1–6 As such, the conversion of biomass-derived carbohydrates, such as glucose and fructose, to platform molecules, including 5-hydroxymethyl furfural (HMF), has been studied extensively.1–3,7 A wide variety of catalysts,8–10 solvents and solvent mixtures,11–13 phase modifiers,14 reaction conditions as well as reactor designs15,16 have been investigated to optimize the production of HMF. Recently, the application of microreactors to biomass processing, in particular the conversion of sugars to HMF, is receiving growing attention. This stems from their unique advantages, such as fast heat and mass transfer, precise temperature control, and the ability to study reaction kinetics under differential conversions where short residence times and precise process control render collection of large amounts of data feasible.17–19 However, most microfluidic studies have used fructose as the substrate.20–22 In comparison to fructose, glucose is an abundant and cheaper feedstock. However, achieving high HMF yield from glucose at short residence times with only Brønsted acid-catalyzed dehydration is challenging.3,23 Therefore, it is common to isomerize the glucose to fructose first and then dehydrate fructose into HMF.1,9,24 The isomerization of glucose to fructose is an equilibrium-limited reaction with approximately unity equilibrium constant at room temperature.25 Consequently, glucose conversion is modest.To mitigate the limited conversion, combined Lewis/Brønsted acid catalysts are effective. The Lewis acid is active for isomerization of glucose to fructose26,27 and tolerates Brønsted acidity as well at high temperatures.9 The fructose is simultaneously dehydrated to HMF in a single reactor. Various tandem Lewis/Brønsted acid catalysts, including both homogeneous and heterogeneous, have been applied to the production of HMF.11,28–34 While heterogeneous catalysts are easily separated from reaction solutions, the formation of undesired products, such as soluble polymers and humins can deposit in and block the catalyst pores, which requires frequent regeneration.24 In this context, homogeneous catalysts for HMF production are meritorious. Moreover, homogeneous catalysts allow better mixing with the glucose reactant and are easier to use in the narrow micro-scale channels. Various metal salts catalyze the conversion of glucose to HMF. Zhang et al.30 have tested different Brønsted acids and obtained 33% HMF yield using maleic acid and AlCl3 catalyst in a single phase. Wrigstedt et al.29 have investigated different salts and achieved 47% HMF yield using KBr and CrCl3 catalyst in a biphasic system. Swift et al.31 have obtained HMF yield over 50% using CrCl3 and HCl catalyst in a biphasic system and developed a kinetic model. Moreover, the role of different metal salts, such as CrCl3 and AlCl3, in the production of HMF has also been investigated.24,35–39 Norton et al.38 have investigated the speciation of Al(III) species and found that the soluble Al(III) ions form quickly, while the Al(OH)3 solids form after extended heating, leading to a drop in catalytic activity due to the active species being removed from solution. Choudhary et al.24 have investigated the speciation of Cr(III) ions and identified [Cr(H2O)5(OH)]2+ as the catalytically active species for glucose isomerization. They also proposed that preheating of the catalyst is important to establish equilibration among species. However, little is known about the dynamic of Cr-related species forming under reaction conditions. Understanding the Cr(III) speciation and the impact on catalytic activity becomes even more important at short residence times where reaction and catalyst speciation time scales can be comparable. Moreover, these changes have not been taken into account in the previous kinetic models.31
In this work, we characterize the chromium species formed under reaction conditions using UV-visible spectrophotometry (UV-vis) and perform reactivity measurements in a flow microreactor at nearly isothermal conditions and short residence times. Then, we develop a kinetic model to describe the dynamics of Lewis and Brønsted acid catalyst speciation under reaction conditions and build a kinetic model that couples catalyst speciation with Lewis and Brønsted acid-catalyzed reactions using a hierarchical approach. Finally, we apply this model to maximize the yield of HMF.
Methods
Materials
Glucose (≥99% purity, Sigma Aldrich), fructose (≥99% purity, Sigma Aldrich), mannose (≥99% purity, Sigma Aldrich), chromium chloride hexahydrate (≥99% purity, Sigma Aldrich), hydrochloric acid (37 wt%, Fisher Scientific), and sulfuric acid (5 M, Fluka), were used without further purification. All aqueous solutions were prepared using deionized (DI) water obtained using a Millipore water purification system (model: Direct-Q3 UV R).Experimental setup
To carry out kinetic study of glucose conversion, reactions are conducted in a flow microreactor built in our laboratory as described by Desir et al.17 The configuration of the reactor is provided in the ESI.† Due to the much shorter heating time compared to the reaction time, no preheating of the catalyst was used for experiments with residence times longer than or equal to five min. On the other hand, the catalyst was preheated for the experiments with residence times less than five min.In the former case, a mixture of sugars and catalyst was prepared in one feed reservoir. A Teledyne SSI MX reciprocating pump with poly ether ether ketone (PEEK) wetted internal parts was used to deliver the feed into a 1.5 m PEEK tube with 0.02 cm2 cross-sectional area placed in an oven with temperature control (accuracy: ±1 °C). This PEEK tubing maximum working temperature of 250 °C and the pressure rating of 5000 psi are sufficient for this work. In the latter case, two pumps were used. One pump (Teledyne SSI-MX) is connected to a reservoir containing a 2 wt% aqueous glucose feed. The other pump (Teledyne SSI-LS) is connected to the catalyst feed where the catalyst concentration is twice that used for the reaction. The catalyst feed enters a preheating coil of 1.5 m in length and a total volume of 3 mL. The sugars' feed is preheated for 30 seconds in a PEEK tube of 0.02 cm2 cross-sectional area and variable-length to keep the preheating time constant. Control experiments showed that the conversion of 1 wt% glucose at 200 °C and 1 min of residence time without catalysts is minimal (less than 2%). Therefore, reactions of glucose in the preheating section can be neglected. This preheated glucose stream is mixed with the preheated catalyst feed at a T-junction. The flow rate ratio of the two streams is 1![[thin space (1/6-em)]](https://www.rsc.org/images/entities/char_2009.gif) :
:![[thin space (1/6-em)]](https://www.rsc.org/images/entities/char_2009.gif) 1 so that the combined stream contains 1 wt% of glucose and the target catalyst concentration. The combined stream enters a coiled PEEK tube of 1 m length and 0.2 mL in total volume.
1 so that the combined stream contains 1 wt% of glucose and the target catalyst concentration. The combined stream enters a coiled PEEK tube of 1 m length and 0.2 mL in total volume.
The reaction mixture exits the tube and immediately enters a coiled, thin PEEK tube with 0.002 cm2 cross-sectional area placed in an ice-water bath to rapidly quench the chemistry. A stainless-steel 316 pressure gauge in the range of 0–1000 psi was installed after the quenching section to indicate the system pressure, and the product mixture was quenched to room temperature before entering the pressure gauge. The pressure gauge was the only stainless-steel part in the flow path, and the internals were coated with molybdenum to prevent corrosion. A PEEK back-pressure regulator (BPR) was connected further downstream to pressurize the system and prevent vaporization. The back pressure used in the experiments was 250 psi, which is greater than the bubble point pressure of the water/HCl mixture at 200 °C and sufficient to maintain it in the subcooled phase. The eluents from the BPR were filtered and collected for high-performance liquid chromatography (HPLC) analysis. The experimental conditions for kinetic study are listed in Table 1.
| Experiment | Temperature [°C] | Substrate | Catalyst |
|---|---|---|---|
| 1 | 140 | Glucose (1 wt%) | 1.7 mM CrCl3 |
| 2 | 160 | Glucose (1 wt%) | 1.7 mM CrCl3 |
| 3 | 180 | Glucose (1 wt%) | 1.7 mM CrCl3 |
| 4 | 180 | Mannose (1 wt%) | 1.7 mM CrCl3 |
| 5 | 200 | Mannose (1 wt%) | 1.7 mM CrCl3 |
| 6 | 180 | Fructose (1 wt%) | 1.7 mM CrCl3 |
| 7 | 200 | Fructose (1 wt%) | 1.7 mM CrCl3 |
| 8 | 160 | HMF (1 wt%) | 1.7 mM CrCl3 |
| 9 | 180 | HMF (1 wt%) | 1.7 mM CrCl3 |
| 10 | 140 | Glucose (1 wt%) | 0.02 M HCl |
| 11 | 160 | Glucose (1 wt%) | 0.02 M HCl |
| 12 | 140 | Glucose (1 wt%) | 0.1 M HCl |
| 13 | 160 | Glucose (1 wt%) | 0.1 M HCl |
| 14 | 180 | Glucose (1 wt%) | 0.1 M HCl |
| 15 | 160 | Glucose (1 wt%) | 0.056 M HCl |
| 16 | 180 | Glucose (1 wt%) | 0.056 M HCl |
| 17 | 160 | Glucose (1 wt%) | 0.03 M HCl |
| 18 | 180 | Glucose (1 wt%) | 0.03 M HCl |
| 19 | 180 | Glucose (1 wt%) | 0.01 M HCl |
| 20 | 200 | Glucose (1 wt%) | 0.01 M HCl |
| 21 | 180 | Glucose (1 wt%) | 1.7 mM CrCl3 + 0.01 M HCl |
| 22 | 200 | Glucose (1 wt%) | 1.7 mM CrCl3 + 0.01 M HCl |
| 23 | 180 | Glucose (1 wt%) | 1.7 mM CrCl3 + 0.1 M HCl |
| 24 | 200 | Glucose (1 wt%) | 1.7 mM CrCl3 + 0.1 M HCl |
| 25 | 200 | Glucose (1 wt%) | 1.7 mM CrCl3 + 0.056 M HCl |
| 26 | 200 | Glucose (1 wt%) | 1.7 mM CrCl3 + 0.071 M HCl |
Aside from the experiments in Table 1 that are used for kinetics, experiments with varying catalyst heating times are also conducted. The catalyst heating experiments are first conducted in the absence of a substrate to investigate the effect of heating on catalyst speciation. Then, the glucose conversion experiments are conducted using catalyst with different heating times to investigate the effect of heating on catalyst reactivity. Experiments with heating time less than 1 hour were conducted in the continuous flow reactor as described previously, and those with heating time longer than 1 hour were done in thick-walled glass vial reactors (Sigma-Aldrich) 5 mL in volume. 2 mL of reacting mixture and a stir bar were placed in each vial. Then each vial was sealed with a crimp cap. To prevent water vapor leakage, a stainless-steel shim was inserted between each aluminum cap and the rubber septum. Then the vials were immersed in an aluminum heating block with individual vial slots filled with mineral oil pre-heated to the set point temperature. A thermocouple inserted into a vial filled with mineral oil sitting in the bath was used to monitor the actual temperature. The stirring rate was 500 rpm. Time zero was defined at the time when the vial was put into the oil bath. At each desired time point, a vial was taken out of the oil bath and immediately immersed in an ice-water bath to quench the reaction.
Product analysis
A Waters 2695 HPLC equipped with a RID and an Aminex Biorad 87C column heated at 75 °C was used for the determination of the glucose, mannose, and fructose concentrations. The mobile phase was deionized (DI) water at 0.5 mL min−1 flow rate. The same samples were also run on a Waters 2695 HPLC equipped with a RID and an Aminex Biorad 87H column heated at 50 °C for determination of the acids and HMF concentration. The mobile phase was 0.005 mM of aqueous H2SO4 solution at 0.5 mL min−1 flow rate. External calibration standards were used in both cases. Reactant conversion and yields of identified products were calculated as follows:Characterization of Cr(III) species
UV-vis analysis was conducted on a Cary 600 UV-visible spectrophotometer. All scans were performed in the 200–800 nm range. DI water was used for 100% transmission baseline reference and zero absorbance calibrations. All samples were directly put into a 1 cm pathlength cuvette and inserted into the sample holder for analysis.Kinetic models, experimental conditions, and parameter estimation
We use a hierarchical approach, proposed years ago,40–42 to develop a complex kinetic model for glucose conversion over tandem Brønsted/Lewis-acid catalysts. In this method, we develop kinetic submodels, which usually consist of different building blocks, and integrate them together to build a full kinetic model. A building block typically describes the sub-network starting from a different substrate. Each building block is often described by a set of coupled ordinary differential equations (ODEs) describing the change of species involved in that building block with reaction time in a batch reactor or location in a plug flow reactor. Networks that involve a single substrate are modeled first, and their parameters are used as initial estimates (priors) for networks involving two or more substrates. Additional reactions are often needed to couple these building blocks. Rate constants are described via the Arrhenius equation to include temperature dependence. The temperature dependence of the equilibrium constant is described using the van't Hoff equation. All the reaction rates are first order on catalyst activity and substrate concentration.31There are three main submodels in the reaction network: the Lewis acid-catalyzed reaction model, the Brønsted acid-catalyzed reaction model, and the catalyst speciation model, which affects the reaction kinetics. In the Lewis and Brønsted acid-catalyzed reaction model, there are multiple building blocks, namely the glucose, fructose, mannose, and HMF conversion sub-networks. All of them are developed separately using different datasets, as shown in Table 1. The catalyst speciation model describes the real-time Brønsted and Lewis acid species concentration vs. time and temperature, and the species considered in this model are discussed in detail in the Results and discussion. The catalytically active Lewis species ([Cr(H2O)5(OH)]2+) activity is determined from the [Cr(H2O)5(OH)]2+ concentration obtained from the catalyst speciation model with an empirical representation developed by Swift et al.31 The Brønsted acid catalyst activity is determined from the pH. Then, the catalyst speciation model is integrated with each reaction building block, as shown in Scheme 1, to calculate the concentrations of catalysts, reactants and products.
Experimental data is used to estimate kinetic parameters. There are two kinetic parameters for each reaction, namely the pre-exponential factor and the activation energy. To determine the parameters for each model, the normalized sum of the squared error between the estimated and the observed outlet concentration for different conditions in the training dataset is minimized. The open-source package, SciPy,43 in Python is used to estimate the kinetic parameters. In Table 1, experiments 1–16 are used for parameter estimation (training set), and experiments 17–26 are reserved for model assessment (testing set). Specifically, the parameters of Brønsted acid-catalyzed mannose conversion and fructose dehydration are obtained from previous literature,31,44 and that of direct glucose conversion are estimated using experiments 10–16 (Table 1). The parameters of the catalyst speciation and Lewis acid-catalyzed reactions are estimated simultaneously using experiments 1–9 (Table 1).
Results and discussion
Catalyst speciation and dynamics
It is important to understand the change of Cr(III) speciation and catalyst reactivity under different conditions, especially at short residence times and high temperatures, which are needed for process intensification. It is known that the chromium(III) hexaaquo complex [Cr(H2O)6]3+ (referred to hereafter as Cr3+) forms after CrCl3 is dissolved in water (R1).45–47 Hydrolysis of Cr3+ forms [Cr(H2O)5(OH)]2+ (referred to hereafter as Cr(OH)2+), which is believed to be the catalytically active species for glucose isomerization24(R2). Then, the Cr(OH)2+ is further hydrolyzed and forms Cr(OH)3 solids (R3). During hydrolysis, protons that catalyze the dehydration reaction are also released. These reactions control the Lewis and Brønsted acid catalyst concentrations. In Fig. 1, the key Cr(III)-related species equilibrium distribution at different temperatures in aqueous media is obtained from the OLI software, which is a commercial software based on an aqueous electrolyte model (OLI, 2018).48 The Cr3+, Cr(OH)2+, and Cr(OH)3 species account for most of the Cr (>98%). The species distribution greatly depends on the temperature. As the temperature increases, formation of the solids becomes more pronounce, at the expense of Cr(OH)2+ leading to catalyst deactivation. Therefore, it's important to understand the Cr(III) speciation under different heating times.| CrCl3 + 6H2O ↔ [Cr(H2O)6]3+ + 3Cl− | (R1) |
 | (R2) |
 | (R3) |
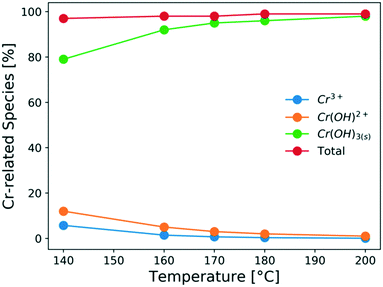 | ||
| Fig. 1 Effect of temperature on the species distribution at equilibrium of 1.7 mM CrCl3 solution (calculated using the OLI software) in aqueous media. | ||
The catalyst is heated for various times in the absence of a substrate to understand the Cr(III) speciation. To qualitatively follow the progress of Cr(III) speciation in water, we employ UV-vis. A 3.4 mM CrCl3 solution, which is chosen to increase the sample absorption for detection by UV-vis, is heated for different times. The UV-vis spectra of the freshly prepared CrCl3 solution shown in Fig. 2 agree well with those by Onjia et al.46 The spectra exhibit three peaks: a broad and intense peak between 200 and 300 nm (peak 1), which corresponds to at least one pair of negative ligands coordinated in trans-positions,49 and two much less intense peaks centers at 443 (peak 2) and 633 nm (peak 3), which correspond to the d–d transitions between different levels split from the d-orbital set of Cr3+.50,51 Additionally, the shoulder at 692 nm is assigned to [Cr(H2O)2Cl4]− by Elving et al.50 After just 0.6 min of heating at 140 °C, a blue shift (i.e., a shift of peak positions to lower wavelengths) is observed for peaks 2 and 3. This is consistent with the color of the solution turning from bright green due to [CrCl4]2− to a more bluish color associated with [Cr(H2O)6]3+.52 At the same time, the intensity of peak 1 reduces significantly. According to Tsuchida et al.,49 the [Cr(H2O)6]3+ does not have any pairs of negatively charged coordinated ligands and therefore should not show an absorption peak in the ultraviolet region. The disappearance of peak 1 and of the shoulder at 692 nm after 0.6 min of heating is consistent with the complete replacement of coordinated Cl− ions by water molecules (R3). As the heating time becomes longer, peak 1 regrows in intensity with a different shape than that of the freshly prepared solution. This points to the formation of new electronic transitions arising from most likely an [Cr(H2O)4(OH)2]+ ion. We are not able to predict changes in the concentration of the catalytically active [Cr(H2O)5(OH)]2+ species (R3) using the UV-vis technique since this ion does not have any pairs of coordinated negative ions associated with peak 1. However, we postulate that [Cr(H2O)5(OH)]2+ ions form earlier and are transformed into [Cr(H2O)4(OH)2]+ ions, as the amount of [Cr(H2O)4(OH)2]+ ions increases, and are finally transformed into solids (R3). On the other hand, the positions of peaks 2 and 3 are overall very similar for heating times longer than 0.6 min. Peaks 2 and 3 red-shift by 11 nm and 16 nm upon heating for 0.6 min and 24 hours, respectively, pointing to the formation of Cr species coordinated with more OH− ions. According to studies on the effect of anion coordination in the UV-vis spectra of transition metal complexes,49 replacing a H2O ligand with an OH− could cause a slight red shift of the UV-vis peak in the 350–800 nm region. This again indicates that the hydrolysis of [Cr(H2O)6]3+ is happening. Apart from peak-position changes, the intensity of peaks 2 and 3 decreases from 0 to 0.6 min of preheating and increases at longer heating times. The change in absorbance also implies a change in Cr speciation, which needs to be considered while developing the kinetic model. Overall, the qualitative analysis of UV-vis data supports the dynamic nature of the catalyst speciation, consistent with the mechanism ((R3)–(R3)) described above.
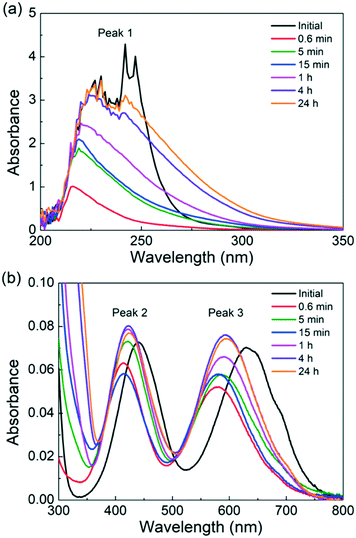 | ||
| Fig. 2 UV-vis spectra of a freshly prepared 3.4 mM CrCl3 solution and of the same solution heated at 140 °C at different times. (a) Low wavelengths (200–350 nm) and (b) high wavelengths (300–800 nm). | ||
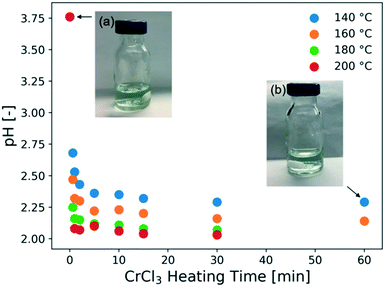
The catalyst solution in the absence of a substrate is also heated for various times, and the pH under different conditions is measured, as shown in Fig. 3. This data is used to assess the catalyst speciation model in a later section. At all temperatures, the pH drops rapidly within the first 10 min and decreases gradually at longer residence times, indicating that there are two time scales. A shorter one, which controls speciation of small ions and the pH, pointing to the hydrolysis of Cr3+ ions following (R2), and consistent with the UV-vis data (Fig. 2), and a longer one that is controlled by the growth of solid particles accordingly to (R3). The two time scales for CrCl3 are reminiscent of the AlCl3 findings.38 The color of the solution is light green at the beginning but becomes slightly bluish after an hour of preheating (Fig. 3). After ultracentrifugation at 10![[thin space (1/6-em)]](https://www.rsc.org/images/entities/char_2009.gif) 000 rpm for 10 min, the permeate became almost colorless but the retentate kept the green-bluish color. It can be concluded that green colloidal particles form upon heating the CrCl3 solution, consistent with prior literature findings.24,46 Dynamic light scattering (DLS) experiments were attempted aiming at measuring the size of these particles, but due to the sample absorbing visible light at 532 nm, which is the wavelength of the laser of the DLS instrument, the Cr ions gave artifact background signals and unreliable autocorrelation functions.
000 rpm for 10 min, the permeate became almost colorless but the retentate kept the green-bluish color. It can be concluded that green colloidal particles form upon heating the CrCl3 solution, consistent with prior literature findings.24,46 Dynamic light scattering (DLS) experiments were attempted aiming at measuring the size of these particles, but due to the sample absorbing visible light at 532 nm, which is the wavelength of the laser of the DLS instrument, the Cr ions gave artifact background signals and unreliable autocorrelation functions.
Effect of heating on catalyst deactivation and reactivity
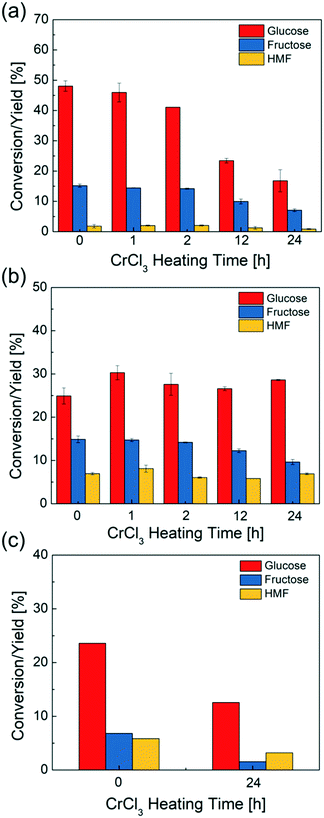
CrCl3 solutions preheated from 0 to 24 hours are used for glucose conversion to probe the effect of speciation on reactivity. In Fig. 4a, the glucose conversion decreases when increasing catalyst preheating time, up to 3 times upon 24 h catalyst preheating, indicating that the catalyst reactivity continues dropping despite the change in pH being slight. The HMF yield slightly decreases as well. These findings indicate gradual removal of the catalytically active species from solution due to formation of solids. When the reaction time (45 min in these experiments) is around the same or longer than the catalyst preheating time, the catalytically active species change noticeably during reaction.To further investigate the effect of externally added Brønsted acidity, the HCl is added into the CrCl3 solutions and preheated together. In Fig. 4b, preheating a mixture of HCl and CrCl3 with a pH = 1 for various times does not appreciably affect either the glucose conversion or the HMF yield, indicating that there is no significant change in reactivity. This is attributed to the Brønsted acid reducing the CrOH2+ concentration via(R2) and suppressing the formation of solids, i.e., by eliminating (R2). Consequently, the reactivity of glucose in the presence of HCl is reduced to about half of that of the fresh CrCl3 catalyst without added HCl and is double of the one when the CrCl3 catalyst alone is heated for 24 hours (Fig. 4a), i.e., the effect of HCl on glucose conversion can be detrimental, compared to using Lewis acid catalyst alone, or beneficial, due to avoiding catalyst solid formation. Further, the amount of HCl would play a role due to modifying the extent of reactions (R2) and (R3). We return to this point by optimizing the ratio of Lewis and Bronsted acids below.
To understand the reversibility of forming solids according to the reverse reaction of (R3), we preheated a 3.4 mM CrCl3 solution for 24 hours at 140 °C. After cooling down this solution to room temperature, HCl was added to bring the solution pH to 1. Then, glucose was added in a 1![[thin space (1/6-em)]](https://www.rsc.org/images/entities/char_2009.gif) :
:![[thin space (1/6-em)]](https://www.rsc.org/images/entities/char_2009.gif) 100 mass ratio (glucose
100 mass ratio (glucose![[thin space (1/6-em)]](https://www.rsc.org/images/entities/char_2009.gif) :
:![[thin space (1/6-em)]](https://www.rsc.org/images/entities/char_2009.gif) catalyst solution) and transferred to a temperature-controlled oil bath kept at 140 °C for 45 min. Compared to using a freshly prepared/non-preheated CrCl3/HCl catalyst mixture, this CrCl3/HCl catalyst gives significantly lower glucose conversion and HMF yield (Fig. 4c). When HCl is added prior to catalyst heating (Fig. 4b), the reactivity is higher as HCl prevents the formation of solids according to (R3). This suggests that upon CrCl3 preheating, solids likely form by condensation of the [Cr(H2O)x(OH)y]3−y species.45,53,54 Once formed, the dissolution of the solids is slow, i.e., the process appears to be irreversible under typical reaction conditions and laboratory operation times.
catalyst solution) and transferred to a temperature-controlled oil bath kept at 140 °C for 45 min. Compared to using a freshly prepared/non-preheated CrCl3/HCl catalyst mixture, this CrCl3/HCl catalyst gives significantly lower glucose conversion and HMF yield (Fig. 4c). When HCl is added prior to catalyst heating (Fig. 4b), the reactivity is higher as HCl prevents the formation of solids according to (R3). This suggests that upon CrCl3 preheating, solids likely form by condensation of the [Cr(H2O)x(OH)y]3−y species.45,53,54 Once formed, the dissolution of the solids is slow, i.e., the process appears to be irreversible under typical reaction conditions and laboratory operation times.
Our results indicate that the catalyst treatment plays a vital role in getting optimal reactivity. While typical batch experiments are conducted over long reaction times, the residence time of continuous processes operating at high temperature can be orders of magnitude shorter, necessitating understanding of catalyst treatment or more commonly time in use because the catalyst changes rapidly. Moreover, since a catalyst in a continuous process is used for long times, catalyst deactivation, analogous to sintering of heterogeneous catalysts, is unavoidable and requires recording of the catalyst history.
Kinetic studies on catalyst speciation and glucose conversion
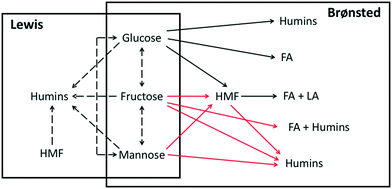
Even though it is difficult to directly measure the active species concentration, it is important to model how they change during pretreatment and reaction of glucose to HMF. Therefore, we develop a simple kinetic model to account for the observed effect of heating on catalyst speciation. The catalyst speciation model is composed of two key reactions: the hydrolysis reaction (R2) of Cr3+ to form the main catalytic active species Cr(OH)2+, and the formation of solids Cr(OH)3(R3), where formation of solids mostly happens at low H+ concentration55 and is greatly suppressed at high H+ concentration. For simplicity, we assume that HCl fully dissociates in solution and Cr3+ ions form immediately upon dissolving CrCl3 in water, with complete replacement of coordinated Cl− ions by water molecules happening shortly, as observed in the UV-vis spectra. The equations of the model are provided in the ESI.†The catalyst speciation kinetic model is integrated with Lewis and Brønsted acid-catalyzed reactions to establish the full reaction network. The tandem kinetic model is developed based on the network proposed by Swift et al.,31 as shown in Scheme 1. The direct Brønsted acid-catalyzed pathway conversion of glucose to HMF has recently been studied56–58 and is responsible for the ratio of formic acid (FA) to levulinic acid (LA) being greater than unity, compared to 1 when HMF rehydration occurs alone. Yang et al.23 proposed that the additional FA stems from glucose retro-aldol reaction at high temperatures. This direct pathway along with the catalyst speciation are included in a new kinetic model herein for the first time.
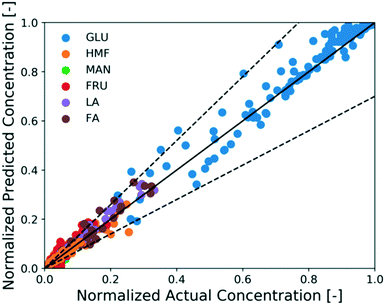
The full reaction network is developed hierarchically. When only Brønsted acid catalyst (HCl) is present, the H+ concentration is determined from the concentration of the acid (unaffected by Cr speciation). Therefore, first the unknown kinetic parameters of the Brønsted acid-catalyzed reaction model (black solid lines in Scheme 1) are estimated using experiments 10–16 in Table 1. On the other hand, since direct measurement of catalytically active Lewis species and solids is infeasible, we use glucose kinetics data to model both the sugar chemistry and the catalyst Cr speciation at once, i.e., the kinetic parameters of both models are estimated simultaneously. The procedure is iterative: the ODEs of four key species concentrations based on (R3) and (R3), namely Cr3+, Cr(OH)2+, Cr(OH)3, and H+, are first formulated and solved in a plug flow reactor with respect to residence time. Then, the concentrations of catalytically active species, Cr(OH)2+ and H+, are passed into the glucose kinetics model as Lewis and Brønsted acid catalyst concentrations, respectively, and used to solve the concentration profiles for glucose, fructose, mannose, HMF, FA, and LA. The calculated concentration profiles of aforementioned species are compared with experiments 1–9 (Table 1) to estimate the kinetic parameters of both catalyst speciation model ((R3) and (R3)) and Lewis-acid catalyzed reaction model (dashed solid lines in Scheme 1) and the approach is iterated until numerical convergence in kinetic parameters is achieved. The method of estimating the kinetic parameters is mentioned in the Methods section. The model can account for preheating by simulating the catalyst speciation without a substrate and also for the coupled catalyst and reaction dynamics. The estimated parameters of the catalyst speciation model are shown in Table 2, and that of Brønsted- and Lewis-acid catalyzed reaction model are shown in Table 3. Fig. 5 shows a parity plot using the data reserved for model assessment (experiments 17–26 in Table 1). The model predictions are in good agreement with experiments for most cases, and the relative error is at most 30%, indicating the catalyst speciation model is adequate.
| Activation energy Ea [kJ mol−1] | Pre-exponential factor log10 [A0, 1/min] | |
|---|---|---|
| a Reverse reactions are modeled using the equilibrium constants obtained from the OLI software. The equilibrium constants are provided in the ESI.† | ||
| k 2 | 96 ± 4 | 12.2 |
| k 3 | 85 ± 6 | 8.9 |
| Reaction | Catalyst | Activation energy Ea [kJ mol−1] | Pre-exponential factor log10 [A0, 1/min] |
|---|---|---|---|
| a Parameters of reverse reactions are calculated using literature equilibrium constants.59 b Parameters are obtained from literature as cited. | |||
| Glucose → fructosea | CrCl3 | 73 ± 6 | 8.1 |
| Fructose → mannosea | CrCl3 | 75 ± 3 | 7.8 |
| Mannose → glucosea | CrCl3 | 80 ± 9 | 8.1 |
| Fructose → humins | CrCl3 | 71 ± 8 | 8.1 |
| Mannose → humins | CrCl3 | 110 ± 8 | 11.1 |
| Glucose → humins | CrCl3 | 73 ± 10 | 6.8 |
| HMF → humins | CrCl3 | 55 ± 8 | 4.2 |
| Mannose → HMFb,31 | HCl | 17 ± 3 | 20.5 |
| Mannose → huminsb,31 | HCl | 58 ± 12 | 5.6 |
| Fructose → HMFb,44 | HCl | 127 ± 2 | 18.1 |
| Fructose → huminsb,44 | HCl | 133 ± 7 | 16.4 |
| HMF → huminsb,44 | HCl | 64 ± 8 | 6.6 |
| Fructose → FA/huminsb,44 | HCl | 129 ± 10 | 15.5 |
| HMF → LA/FA | HCl | 92 ± 5 | 11.0 |
| Glucose → HMF | HCl | 139 ± 4 | 15.6 |
| Glucose → FA | HCl | 180 ± 10 | 17.7 |
| Glucose → humins | HCl | 183 ± 3 | 20.3 |
The predicted catalyst speciation is shown in Fig. 6. The model-predicted proton concentration is compared with the measured pH, previously shown in Fig. 3. The rapid increase in the H+ concentration (or drop in pH) is correctly captured by the model. A sharp peak in the Cr(OH)2+ concentration is observed at very short times. An additional set of experiments (not listed in Table 1) is conducted at short residence times (3–20 s) so that the catalyst changes and the glucose conversion are low. In Fig. 7, the resulting simulations agree well with experiments, indicating that the catalyst speciation model can adequately describe the dynamics of Lewis and Brønsted acid active species at short reaction times. A non-monotonic variation of initial glucose reaction rate vs. the CrCl3 preheating time is observed in both simulations and experiments with an overall variation in reaction rate up to 3–4 times at these conditions. The initial glucose reaction rate reaches a maximum at ∼1 min and then decreases. This behavior can be explained by the interplay between the hydrolysis of Cr3+(R2) and the formation of the Cr(OH)3 solids (R3). At short heating times (∼3 min), Cr3+ is rapidly hydrolyzed to form Cr(OH)2+ releasing protons, which is consistent with the pH rapidly dropping (Fig. 3). At longer preheating times, the Cr3+ hydrolysis is either complete and/or the Cr(OH)2+ starts forming solids, which lower the concentration of the active species and consequently the glucose reaction rate.
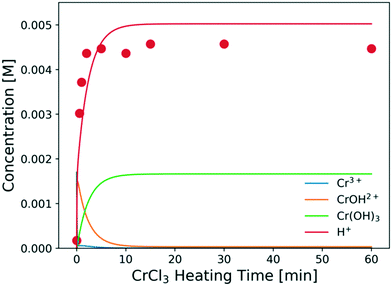 | ||
| Fig. 6 Concentrations of key catalyst species vs. preheating time at 180 °C. Circles are experimental data; lines represent model predictions. Conditions are those of Fig. 3. | ||
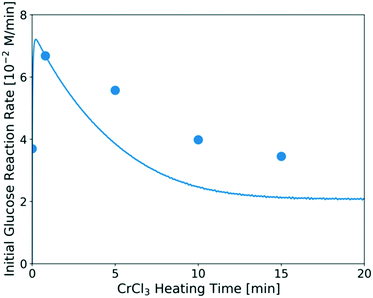 | ||
| Fig. 7 Glucose initial reaction rate over catalysts heated for different preheating times. Reaction conditions: 1 wt% glucose with 1.7 mM CrCl3 at 180 °C. The catalyst was preheated in the flow reactor at the same temperature as that used for the glucose reaction. Circles are experimental data; line represents model prediction. The method for calculating the initial experimental glucose reaction rate at short times is provided in the ESI.† | ||
This indicates that one should carefully consider catalyst pretreatment compared to the operating time since the catalyst speciation happens rapidly in the first ∼10 min of heating at 180 °C (Fig. 6 and 7). Specifically, if one performs the reaction at very short residence times (≪10 min), preheating the catalyst for ∼1 min can provide higher reaction rate. On the other hand, if the reaction is carried out at much longer residence times (≫10 min), the effect of preheating catalyst is less significant since catalyst deactivation happens already during reaction. The catalyst dynamics can also affect reproducibility among different reports.
Fig. 8a shows the experimental conversion/yields (circles) and model predictions (lines) of the direct Brønsted acid-catalyzed reaction. The excess of FA becomes more pronounced as the glucose conversion increases but under these conditions the ratio of FA to LA is close to 1. While no literature is available for direct comparison, the estimated activation energy (180 kJ mol−1) is high as expected for the retro-aldol reaction.23 The other estimated activation energies are comparable to literature reported values.56–58Fig. 8b shows conversion and yields of typical Lewis-acid catalyzed reactions. The activation energies of glucose–fructose and fructose–mannose isomerization are similar, which may be attributed to that both reactions proceed via 1,2 intramolecular hydride transfer.33,60 Besides, the mannose-glucose isomerization activation energy is similar to the literature reported value,31 while the activation energies of glucose–fructose and fructose–mannose are slightly lower, possibly due to the catalyst speciation.
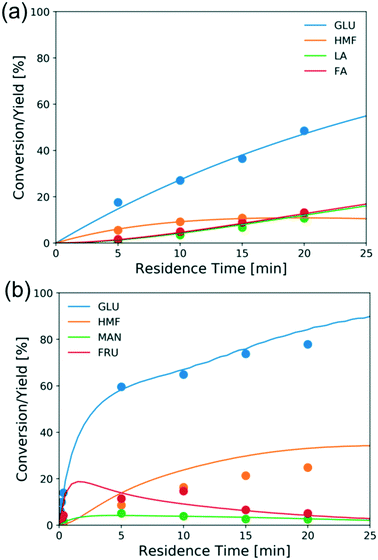 | ||
| Fig. 8 Conversion and yield of 1 wt% glucose vs. residence time in (a) aqueous HCl (pH = 2) at 200 °C and (b) 1.7 mM CrCl3 at 180 °C from experiments (circles) and model predictions (lines). | ||
The model is also assessed using the tandem Lewis/Brønsted-acid catalyst. Fig. 9 shows the experimental conversion/yields (circles) and model predictions (lines). The conversion of glucose and the HMF yield increase much faster using the tandem Lewis/Brønsted-acid catalyst compared to using only the Lewis-acid catalyst. This is attributed to that the additional Brønsted-acidity, provided by HCl, promotes the fructose dehydration reaction and drives the equilibrium-limited glucose–fructose isomerization to high conversions by converting fructose. Besides, the formation of solids is suppressed by the addition of HCl. However, the additional HCl also shifts the hydrolysis reaction backward reducing the amount of catalytically active species Cr(OH)2+31 and thus decreasing the Lewis-acid catalyst activity. Given these tradeoffs, tuning the ratio of the two catalysts is important to determine the optimal reaction conditions.
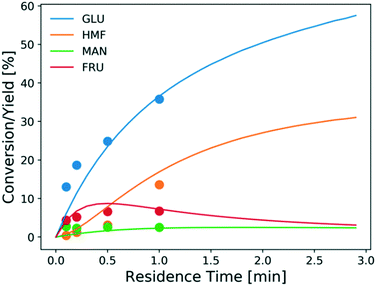 | ||
| Fig. 9 Conversion and yield of 1 wt% glucose vs. residence time using 1.7 mM CrCl3 in aqueous HCl (pH = 2) at 200 °C from experiments (circles) and model predictions (lines). | ||
Optimal HMF yield at short contact time using tandem CrCl3/HCl catalyst
To find out the optimal reaction conditions for HMF production, first, parametric studies are carried out to investigate the effect of CrCl3 concentration on HMF yield at 160 and 180 °C (Fig. 10). The maximum HMF yield depends mainly on temperature and does not change with CrCl3 concentration. It first increases and then decreases with increasing HCl concentration. This is attributed to the rate-limiting step changing from dehydration at low HCl concentrations to isomerization at high HCl concentrations,31 indicating that the optimum happens by balancing the dehydration and isomerization rates. The optimal HCl concentration increases when the CrCl3 concentration increases. Then, the model is applied to find out the operating window under various conditions. Fig. 11 shows the heatmap of predicted HMF yield vs. the residence time and HCl concentration with 1.7 mM CrCl3 at different temperatures. The maximum HMF yield is ∼36% at 200 °C in ∼7 min and ∼33% at 180 °C in ∼15 min. These stand among the highest yields in single aqueous phase starting from glucose over CrCl3 catalyst. There are very few literature works that use flow reactors at high temperature, and only Muranaka et al.21 obtained ∼40% HMF yield in 22 min at 180 °C using a PBS buffer (pH = 2) in a flow reactor (buffers often have catalytic activity themselves). Other relatively high yields have been obtained in a batch reactor by Siqueira et al.61 (47% yield in 100 min at 200 °C using TiO2–P) and Watanabe et al.62 (20% HMF yield in 5 min using anatase TiO2 at 200 °C), but batch systems suffer from long preheating times. More detailed comparison is not possible as catalysts have been different.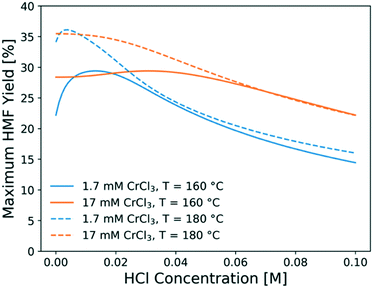 | ||
| Fig. 10 Maximum HMF yield obtained at optimal residence time as a function of HCl concentration at different CrCl3 concentrations and temperatures. | ||
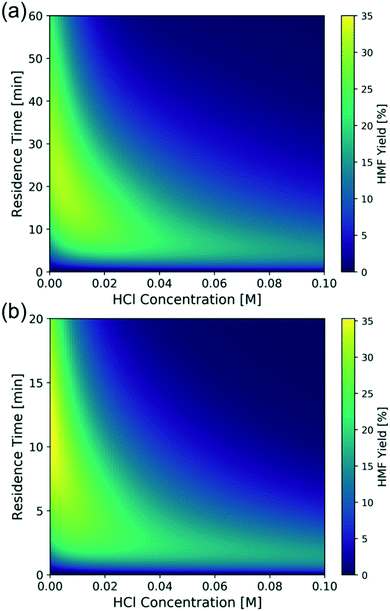 | ||
| Fig. 11 Model-predicted contour plot of HMF yield vs. residence time and HCl concentration of 1 wt% glucose over 1.7 mM CrCl3 at (a) 180 °C and (b) 200 °C. | ||
In comparison to literature, this study shows that moderately high HMF yields can be reached using a microreactor operating at short residence times and high temperatures. While a moderate HCl concentration gives a higher yield and a larger operating window, which is desirable from a control viewpoint, the optimal residence time greatly decreases when the HCl concentration increases with only a slight decrease in the optimal HMF yield. This results in more compact reactors with less capital cost for small scale operation. When considering both product yield and operation time, the productivity, defined as the HMF yield per time, increases using higher HCl concentrations. In this context, an additional experiment is carried out using 1.7 mM CrCl3 and 0.056 M HCl as catalyst at 200 °C at 2 min. A HMF productivity of 15.2% yield per min is achieved, which is slightly higher than the model-predicted productivity, as shown in Fig. 12. This is the highest productivity among all studies21,30,61–63 using flow reactors with single aqueous phase and the same initial glucose concentration (1 wt%). This high productivity at short contact times is attributed to both fast heat transfer of the microreactor and the effectiveness of the tandem CrCl3/HCl catalysts.
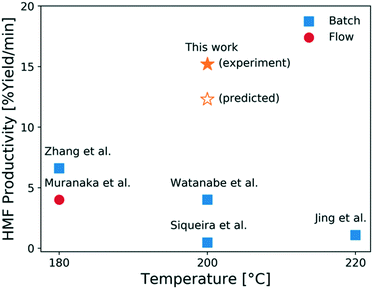 | ||
| Fig. 12 HMF productivity vs. temperature from this work and relevant literature.21,30,61–63 All literature works used 1 wt% glucose solutions in single (aqueous) phase only. | ||
Conclusions
HMF production from glucose via cascade reactions using Lewis acid (CrCl3) and Brønsted acid (HCl) catalysts in aqueous media was investigated experimentally and computationally in a continuous flow microreactor at short residence times and high temperatures. We studied the chromium species formation at reaction-relevant conditions using UV-visible spectrophotometry and elucidated the effect of Cr(III) speciation on glucose isomerization. A kinetic model for catalyst speciation was also developed via a hierarchical approach using experimental data and was coupled with a revised glucose isomerization and dehydration model that accounts for the varying catalyst speciation. The model is in good agreement with experiments at various reaction conditions.It is found that there are two overall time-scales in Lewis acid catalyst speciation. At short heating times, Cr3+ is rapidly hydrolyzed to form Cr(OH)2+ releasing protons, consistent with rapid drop of pH within minutes. At longer preheating times, the Cr3+ hydrolysis is either complete and/or the Cr(OH)2+ starts forming solids and oligomers, which lower the concentration of the active species and consequently the glucose consumption rate. The catalyst reactivity changes sharply at short residence times; specifically, it goes through a maximum and eventually decreases at long heating or reaction times, fully rationalized by the varying catalyst speciation. The resulting catalyst activity changes with time by a factor of 3–4 (depending on conditions). Our results indicate that the Lewis acid catalyst treatment plays a vital role in getting optimal reactivity. Since a catalyst in a continuous process is used over long times, catalyst deactivation due to formation of particles is unavoidable. This behavior is analogous to sintering of heterogeneous catalysts. It appears that solid formation is irreversible by HCl treatment. Developing efficient catalyst regeneration methods should be pursued in future work. Adding Brønsted acids, e.g., HCl, reduces the Lewis acid active species at short times by reversing the hydrolysis reaction but prevents solids' formation at longer times and thus provides stable tandem catalyst speciation. It is clear that tandem catalysis has multiple benefits given that Brønsted acids shift the glucose–fructose equilibrium by accelerating fructose dehydration, reduce processing times, and increase HMF yield.
Finally, the model was applied to optimize the HMF yield and understand the interplay of processing conditions. The HMF yield is insensitive to the CrCl3 concentration and depends primarily on temperature once residence time and HCl concentration are properly engineered. One of the highest yields (∼36% at 200 °C in ∼7 min) was predicted for a single-phase (aqueous) system, and the higher HMF productivity of 15.2% yield per min was experimentally demonstrated at short times (2 min). While the yield in a monophasic system is relatively low, the developed kinetics model can be applied directly to model and design a biphasic system for glucose conversion to HMF to further promote the product yield. The simplicity of the monophasic system studied herein enabled us to focus on catalyst speciation without complications arising from using an organic solvent. Moreover, the applied approach of modeling catalyst speciation and glucose conversion simultaneously can be extended to other homogeneous tandem catalyst systems. Changes in catalyst speciation may occur also in heterogeneous catalysts. The short contact times and good temperature control of the microfluidic enable studies of such changes. Continuous flow microreactors operating at short residence times and high temperatures can give high HMF productivity and contribute to process intensification of biorefineries. The combination of the developed kinetics model and computational fluid dynamics (CFD) simulation can further guide the design of compact microreactor modules for HMF production and open up the possibility for small-scale and distributed biorefineries.
Conflicts of interest
There are no conflicts to declare.Acknowledgements
Funding from the RAPID manufacturing institute, supported by the Department of Energy (DOE) Advanced Manufacturing Office (AMO), award numbers DE-EE0007888-7.6 is gratefully acknowledged. RAPID projects at the University of Delaware are also made possible in part by funding provided by the State of Delaware. The Delaware Energy Institute gratefully acknowledges the support and partnership of the State of Delaware in furthering the essential scientific research being conducted through the RAPID projects.References
- S. Caratzoulas, M. E. Davis, R. J. Gorte, R. Gounder, R. F. Lobo, V. Nikolakis, S. I. Sandler, M. A. Snyder, M. Tsapatsis and D. G. Vlachos, J. Phys. Chem. C, 2014, 118, 22815–22833 CrossRef CAS.
- B. J. Nikolau, M. A. D. N. Perera, L. Brachova and B. Shanks, Plant J., 2008, 54, 536–545 CrossRef CAS.
- R. J. van Putten, J. N. M. Soetedjo, E. A. Pidko, J. C. van der Waal, E. J. M. Hensen, E. de Jong and H. J. Heeres, ChemSusChem, 2013, 6, 1681–1687 CrossRef CAS.
- J. Q. Bond, D. M. Alonso and J. A. Dumesic, Aqueous Pretreatment of Plant Biomass for Biological and Chemical Conversion to Fuels and Chemicals, 2013, pp. 61–102 Search PubMed.
- O. A. Abdelrahman, H. Y. Luo, A. Heyden, Y. Román-Leshkov and J. Q. Bond, J. Catal., 2015, 329, 10–21 CrossRef CAS.
- D. M. Alonso, J. Q. Bond and J. A. Dumesic, Green Chem., 2010, 12, 1493–1513 RSC.
- H. Xia, S. Xu, H. Hu, J. An and C. Li, RSC Adv., 2018, 8, 30875–30886 RSC.
- T. Ennaert, J. Van Aelst, J. Dijkmans, R. De Clercq, W. Schutyser, M. Dusselier, D. Verboekend and B. F. Sels, Chem. Soc. Rev., 2016, 45, 584–611 RSC.
- E. Nikolla, Y. Román-Leshkov, M. Moliner and M. E. Davis, ACS Catal., 2011, 1, 408–410 CrossRef CAS.
- R. Otomo, T. Yokoi, J. N. Kondo and T. Tatsumi, Appl. Catal., A, 2014, 470, 318–326 CrossRef CAS.
- Y. J. Pagan-Torres, T. Wang, J. M. R. Gallo, B. H. Shanks and J. A. Dumesic, ACS Catal., 2012, 2, 930–934 CrossRef CAS.
- Y. Román-Leshkov and J. A. Dumesic, Top. Catal., 2009, 52, 297–303 CrossRef.
- H. Kimura, M. Nakahara and N. Matubayasi, J. Phys. Chem. A, 2013, 117, 2102–2113 CrossRef CAS.
- Y. Román-Leshkov, J. N. Chheda and J. A. Dumesic, Science, 2006, 312, 1933–1937 CrossRef.
- A. Hommes, H. J. Heeres and J. Yue, ChemCatChem, 2019, 11, 4671–4708 CrossRef CAS.
- W. Guo, H. J. Heeres and J. Yue, Chem. Eng. J., 2020, 381, 122754 CrossRef CAS.
- P. Desir, B. Saha and D. G. Vlachos, Energy Environ. Sci., 2019, 12, 2463–2475 RSC.
- P. Desir, T.-Y. Chen, M. Bracconi, B. Saha, M. Maestri and D. G. Vlachos, React. Chem. Eng., 2020, 5, 39–50 RSC.
- T.-Y. Chen, M. Baker-Fales and D. G. Vlachos, Industrial & Engineering Chemistry Research, 2020 Search PubMed.
- T. Tuercke, S. Panic and S. Loebbecke, Chem. Eng. Technol., 2009, 32, 1815–1822 CrossRef CAS.
- Y. Muranaka, H. Nakagawa, R. Masaki, T. Maki and K. Mae, Ind. Eng. Chem. Res., 2017, 56, 10998–11005 CrossRef CAS.
- F. Salak Asghari and H. Yoshida, Ind. Eng. Chem. Res., 2006, 45, 2163–2173 CrossRef.
- L. Yang, G. Tsilomelekis, S. Caratzoulas and D. G. Vlachos, ChemSusChem, 2015, 8, 1334–1341 CrossRef CAS.
- V. Choudhary, S. H. Mushrif, C. Ho, A. Anderko, V. Nikolakis, N. S. Marinkovic, A. I. Frenkel, S. I. Sandler and D. G. Vlachos, J. Am. Chem. Soc., 2013, 135, 3997–4006 CrossRef CAS.
- R. N. Goldberg and Y. B. Tewari, J. Phys. Chem. Ref. Data, 1995, 24, 1765–1801 CrossRef CAS.
- R. Bermejo-Deval, R. S. Assary, E. Nikolla, M. Moliner, Y. Román-Leshkov, S.-J. Hwang, A. Palsdottir, D. Silverman, R. F. Lobo and L. A. Curtiss, Proc. Natl. Acad. Sci. U. S. A., 2012, 109, 9727–9732 CrossRef CAS.
- H. Y. Luo, J. D. Lewis and Y. Román-Leshkov, Annu. Rev. Chem. Biomol. Eng., 2016, 7, 663–692 CrossRef CAS.
- C. Loerbroks, J. van Rijn, M. P. Ruby, Q. Tong, F. Schüth and W. Thiel, Chem. – Eur. J., 2014, 20, 12298–12309 CrossRef CAS.
- P. Wrigstedt, J. Keskiväli, M. Leskelä and T. Repo, ChemCatChem, 2015, 7, 501–507 CrossRef CAS.
- X. Zhang, B. B. Hewetson and N. S. Mosier, Energy Fuels, 2015, 29, 2387–2393 CrossRef CAS.
- T. D. Swift, H. Nguyen, A. Anderko, V. Nikolakis and D. G. Vlachos, Green Chem., 2015, 17, 4725–4735 RSC.
- T. D. Swift, H. Nguyen, Z. Erdman, J. S. Kruger, V. Nikolakis and D. G. Vlachos, J. Catal., 2016, 333, 149–161 CrossRef CAS.
- Y. Román-Leshkov, M. Moliner, J. A. Labinger and M. E. Davis, Angew. Chem., Int. Ed., 2010, 49, 8954–8957 CrossRef.
- S. Xu, D. Pan, F. Hu, Y. Wu, H. Wang, Y. Chen, H. Yuan, L. Gao and G. Xiao, Fuel Process. Technol., 2019, 190, 38–46 CrossRef CAS.
- C. B. Rasrendra, I. Makertihartha, S. Adisasmito and H. J. Heeres, Top. Catal., 2010, 53, 1241–1247 CrossRef CAS.
- L. Peng, L. Lin, J. Zhang, J. Zhuang, B. Zhang and Y. Gong, Molecules, 2010, 15, 5258–5272 CrossRef CAS.
- S. De, S. Dutta and B. Saha, Green Chem., 2011, 13, 2859–2868 RSC.
- A. M. Norton, H. Nguyen, N. L. Xiao and D. G. Vlachos, RSC Adv., 2018, 8, 17101–17109 RSC.
- N. Rodriguez Quiroz, A. M. Norton, H. Nguyen, E. Vasileiadou and D. G. Vlachos, ACS Catal., 2019, 9, 9923–9952 CrossRef CAS.
- A. B. Mhadeshwar and D. G. Vlachos, J. Phys. Chem. B, 2005, 109, 16819–16835 CrossRef CAS.
- A. B. Mhadeshwar and D. G. Vlachos, J. Catal., 2005, 234, 48–63 CrossRef CAS.
- D. G. Vlachos, A. B. Mhadeshwar and N. S. Kaisare, Comput. Chem. Eng., 2006, 30, 1712–1724 CrossRef CAS.
- P. Virtanen, R. Gommers, T. E. Oliphant, M. Haberland, T. Reddy, D. Cournapeau, E. Burovski, P. Peterson, W. Weckesser, J. Bright, S. J. van der Walt, M. Brett, J. Wilson, K. J. Millman, N. Mayorov, A. R. J. Nelson, E. Jones, R. Kern, E. Larson, C. J. Carey, İ. Polat, Y. Feng, E. W. Moore, J. VanderPlas, D. Laxalde, J. Perktold, R. Cimrman, I. Henriksen, E. A. Quintero, C. R. Harris, A. M. Archibald, A. H. Ribeiro, F. Pedregosa, P. van Mulbregt, A. Vijaykumar, A. P. Bardelli, A. Rothberg, A. Hilboll, A. Kloeckner, A. Scopatz, A. Lee, A. Rokem, C. N. Woods, C. Fulton, C. Masson, C. Häggström, C. Fitzgerald, D. A. Nicholson, D. R. Hagen, D. V. Pasechnik, E. Olivetti, E. Martin, E. Wieser, F. Silva, F. Lenders, F. Wilhelm, G. Young, G. A. Price, G.-L. Ingold, G. E. Allen, G. R. Lee, H. Audren, I. Probst, J. P. Dietrich, J. Silterra, J. T. Webber, J. Slavič, J. Nothman, J. Buchner, J. Kulick, J. L. Schönberger, J. V. de Miranda Cardoso, J. Reimer, J. Harrington, J. L. C. Rodríguez, J. Nunez-Iglesias, J. Kuczynski, K. Tritz, M. Thoma, M. Newville, M. Kümmerer, M. Bolingbroke, M. Tartre, M. Pak, N. J. Smith, N. Nowaczyk, N. Shebanov, O. Pavlyk, P. A. Brodtkorb, P. Lee, R. T. McGibbon, R. Feldbauer, S. Lewis, S. Tygier, S. Sievert, S. Vigna, S. Peterson, S. More, T. Pudlik, T. Oshima, T. J. Pingel, T. P. Robitaille, T. Spura, T. R. Jones, T. Cera, T. Leslie, T. Zito, T. Krauss, U. Upadhyay, Y. O. Halchenko, Y. Vázquez-Baeza and C. SciPy, Nat. Methods, 2020, 17, 261–272 CrossRef CAS.
- T. D. Swift, C. Bagia, V. Choudhary, G. Peklaris, V. Nikolakis and D. G. Vlachos, ACS Catal., 2014, 4, 259–267 CrossRef CAS.
- H. Stuenzi and W. Marty, Inorg. Chem., 1983, 22, 2145–2150 CrossRef CAS.
- A. E. Onjia, S. K. Milonjić, D. Čokeša, M. Čomor and N. Miljević, Mater. Res. Bull., 2003, 38, 1329–1339 CrossRef CAS.
- A. Bell and E. Matijević, J. Inorg. Nucl. Chem., 1975, 37, 907–912 CrossRef CAS.
- P. Wang, A. Anderko and R. D. Young, Fluid Phase Equilib., 2002, 203, 141–176 CrossRef CAS.
- R. Tsuchida, Bull. Chem. Soc. Jpn., 1938, 13, 388–400 CrossRef CAS.
- P. J. Elving and B. Zemel, J. Am. Chem. Soc., 1957, 79, 1281–1285 CrossRef CAS.
- S. Jia, K. Liu, Z. Xu, P. Yan, W. Xu, X. Liu and Z. C. Zhang, Catal. Today, 2014, 234, 83–90 CrossRef CAS.
- A. Lennartson, Nat. Chem., 2014, 6, 942–942 CrossRef CAS.
- F. P. Rotzinger, H. Stuenzi and W. Marty, Inorg. Chem., 1986, 25, 489–495 CrossRef CAS.
- M. J. Avena, C. E. Giacomelli and C. P. De Pauli, J. Colloid Interface Sci., 1996, 180, 428–435 CrossRef CAS.
- D. Rai, B. M. Sass and D. A. Moore, Inorg. Chem., 1987, 26, 345–349 CrossRef CAS.
- R. Weingarten, J. Cho, R. Xing, W. C. Conner Jr and G. W. Huber, ChemSusChem, 2012, 5, 1280–1290 CrossRef CAS.
- B. Girisuta, L. Janssen and H. J. Heeres, Green Chem., 2006, 8, 701–709 RSC.
- B. Girisuta, L. Janssen and H. J. Heeres, Chem. Eng. Res. Des., 2006, 84, 339–349 CrossRef CAS.
- N. Rajabbeigi, A. I. Torres, C. M. Lew, B. Elyassi, L. Ren, Z. Wang, H. J. Cho, W. Fan, P. Daoutidis and M. Tsapatsis, Chem. Eng. Sci., 2014, 116, 235–242 CrossRef CAS.
- R. Bermejo-Deval, R. Gounder and M. E. Davis, ACS Catal., 2012, 2, 2705–2713 CrossRef CAS.
- B. G. Siqueira, M. A. P. Silva and C. Moraes, Brazilian Journal of Petroleum and Gas, 2013, 7, 71–82 CrossRef.
- M. Watanabe, Y. Aizawa, T. Iida, T. M. Aida, C. Levy, K. Sue and H. Inomata, Carbohydr. Res., 2005, 340, 1925–1930 CrossRef CAS.
- Q. Jing and X. Lü, Chin. J. Chem. Eng., 2008, 16, 890–894 CrossRef CAS.
Footnotes |
| † Electronic supplementary information (ESI) available. See DOI: 10.1039/d0re00391c |
| ‡ Current affiliation: RiKarbon Inc, 550 S. College Ave, Newark, Delaware 19 716, USA. |
| This journal is © The Royal Society of Chemistry 2021 |


