High-temperature CO2 perm-selectivity of yttrium-doped SDC ceramic–carbonate dual-phase membranes
Daniela
González-Varela
a,
Oscar
Ovalle-Encinia
a,
J. Francisco
Gómez-García
b,
Gustavo
Tavizon
b and
Heriberto
Pfeiffer
 *a
*a
aLaboratorio de Fisicoquímica y Reactividad de Superficies (LaFReS), Instituto de Investigaciones en Materiales, Universidad Nacional Autónoma de México, Circuito Exterior S/N, CU, Del. Coyoacán, CP 04510, Ciudad de México, Mexico. E-mail: pfeiffer@materiales.unam.mx; Tel: +52 (55) 5622 4627
bDepartamento de Física y Química Teórica, Facultad de Química, Universidad Nacional Autónoma de México, Ciudad Universitaria, Del. Coyoacán, CP 04510 Ciudad de México, Mexico
First published on 13th November 2020
Abstract
This work presents the synthesis and evaluation of ceramic supports made of yttrium and samarium co-doped CeO2 (Y-SDC) for synthesizing ceramic–carbonate dual-phase membranes. Their Y![[thin space (1/6-em)]](https://www.rsc.org/images/entities/char_2009.gif) :
:![[thin space (1/6-em)]](https://www.rsc.org/images/entities/char_2009.gif) Sm atomic concentration ratio was varied, using a total dopant content of 20 mol%. The Y-SDC supports were characterized by X-ray diffraction, scanning electron microscopy, thermogravimetric analysis, and electrical conductivity under different atmospheres, for determining the chemical and thermal stability and the intrinsic properties of the ceramic supports. The supports were infiltrated with molten carbonates for making dense dual-phase membranes, and CO2 permeation tests were conducted using a feed gas mixture of CO2/N2 between 700 and 900 °C at 1 bar. This study establishes that Y-SDC supports are thermally and chemically stable at high temperatures in acid environments. The ionic conductivity of Y-SDC depends on the O2 partial pressure and yttrium content. The CO2 permeation flux results of the dense ceramic–carbonate dual-phase membrane are correlated to the ionic conductivity of Y-SDC. Moreover, the CO2 permeation is improved by tailoring the membrane microstructure.
Sm atomic concentration ratio was varied, using a total dopant content of 20 mol%. The Y-SDC supports were characterized by X-ray diffraction, scanning electron microscopy, thermogravimetric analysis, and electrical conductivity under different atmospheres, for determining the chemical and thermal stability and the intrinsic properties of the ceramic supports. The supports were infiltrated with molten carbonates for making dense dual-phase membranes, and CO2 permeation tests were conducted using a feed gas mixture of CO2/N2 between 700 and 900 °C at 1 bar. This study establishes that Y-SDC supports are thermally and chemically stable at high temperatures in acid environments. The ionic conductivity of Y-SDC depends on the O2 partial pressure and yttrium content. The CO2 permeation flux results of the dense ceramic–carbonate dual-phase membrane are correlated to the ionic conductivity of Y-SDC. Moreover, the CO2 permeation is improved by tailoring the membrane microstructure.
Introduction
Nowadays, there is not any doubt that CO2 emissions are one of the most critical problems around the world, from environmental and energetic points of view.1 The anthropogenic CO2 concentration is increasing in the atmosphere, so does the greenhouse effect. Based on this threatening problem, in the last three decades, different research groups have studied and implemented different ideas, developing new materials and designing efficient and eco-friendly systems and processes for reducing CO2 emissions.2–5 Within this context, CO2 carbon capture and sequestration (CCS) technology has gained lots of interest in the last few years, as it seems to be a promising contribution to the whole solution.6–8 CCS is a technology able to trap up to 90% of the CO2 emitted to the atmosphere from different industrial sources such as those involved in electricity generation, among other industrial processes.4,6,7In fact, among different CO2 capture processes, pre-combustion capture has attracted the attention of several research groups for mitigating CO2 emissions at the industrial scale.9,10 In this case, the gasification of fossil fuels is performed to produce synthesis gas (syngas), which is a CO and H2 mixture. Syngas reacts with steam to produce a stream of CO2 and H2 through the water gas shift reaction (WGSR). The CO2 and H2 formed are separated using perm-selective membranes. Extensive efforts have been made to develop porous membranes for CO2 separation, but these systems work at low temperatures.11–13 Recently, dense ceramic–carbonate dual-phase (CCDP) membranes were proposed as an alternative for pre-combustion CO2 capture in the integrated gasification combined cycle (IGCC) process at high-temperature,14 where these membranes can work as reactors for H2 production and CO2 separation/capture. Furthermore, CCDP membranes have theoretically infinite CO2 selectivity, making the whole process mentioned above more efficient.
Several research groups15–23 have reported this type of inorganic membrane. The CCDP membranes are composed of a porous ceramic phase infiltrated with an alkaline molten carbonate mixture. Each part has specific purposes: i) the ceramic phase works as a support, but it also works as an oxygen ion conductor, and ii) the molten carbonate phase drives the carbonate ions from the upstream to the downstream side due to a CO2 partial pressure gradient.15,16,19,20,24–28 On the feed side of the membrane, the CO2 is chemically incorporated into the molten carbonate phase, by reacting with one oxygen ion from the ceramic phase, forming carbonate anions (CO32−), as shown in reaction (1). The carbonate ions are diffused through the molten phase, to the downstream side of the membrane. On the permeate side, the CO32− anions are decomposed, releasing CO2, whereas the oxygen anions are reincorporated into the ceramic phase.15,20,29,30–33
| CO2 + O2− ↔ CO32− | (1) |
In recent years, cerium-based CCDP membranes have been studied for CO2 separation due to their high oxygen ion conductivity at high temperatures,32–35 in addition to other ceramic materials.36 For instance, samarium- and gadolinium-containing ceria compositions have shown some of the best oxygen conductivity values at 900 °C: 0.177 S cm−1 and 0.125 S cm−1,37 respectively. Correspondingly, the CCDP membranes made of these ceramics showed CO2 permeation fluxes of 3.6 × 10⁻³ mol s−1 m−2 for Sm–CeO2 and 1.6 × 10⁻³ mol s−1 m−2 for Gd–CeO2 cases.18,20 Another system with high oxygen conductivity is Y-doped ceria (YCO), in which the ionic conductivity value is around 0.1 S cm−1.37 Moreover, it must be pointed out that these results are in agreement with the total conductivity of the ceramics, although the microstructural properties are also involved in membrane performance.
In order to develop new cerium-based materials containing different cations as dopants and co-dopants their heterogeneity and mobility must be enhanced. Based on this, in the present work, the utilization of yttrium as a co-dopant element in the samarium doped ceria (Y-SDC) system for acquiring high oxygen ion conductivity and obtaining relatively high CO2 permeation fluxes for CCDP membranes is proposed. Hence, Y-SDC with different yttrium molar contents was characterized by different structural and microstructural techniques to determine their chemical stability. Moreover, Y-SDC conductivity measurements were obtained, analyzed and correlated with the CO2 permeation results obtained from the Y-SDC–molten carbonate membranes. Thus, the synthesis and analysis of this new ceramic–carbonate dual-phase membrane represents an innovation for the future implementation of this kind of system at an industrial level.
Experimental section
Yttrium and samarium co-doped CeO2 samples, with compositions of Ce0.8Y0.2O2−δ (20YCO), Ce0.8Y0.15Sm0.05O2−δ (15Y-5SDC), Ce0.8Y0.1Sm0.1O2−δ (10Y-10SDC) and Ce0.8Y0.05Sm0.15O2−δ (5Y-15SDC) were synthesized via the EDTA–citrate complex method.38,39 Additionally, the Sm-doped CeO2 (Ce0.8Sm0.2O2−δ, 20SDC) sample was synthesized using the same chemical procedure for comparison purposes. The corresponding stoichiometric amounts of metal nitrate precursors Ce(NO3)3·6H2O (99.0%, Sigma-Aldrich), Sm(NO3)3·6H2O (99.9%, Sigma-Aldrich), Y(NO3)3·6H2O (99.8%, Sigma-Aldrich) and anhydrous citric acid (99.0%, Sigma-Aldrich) were fully dissolved in deionized water, followed by addition of EDTA (98.5%, Baker A.C.S. Reagent), which was previously dissolved in ammonium hydroxide (28.0–30.0%, Baker A.C.S. Reagent). In all cases, the EDTA![[thin space (1/6-em)]](https://www.rsc.org/images/entities/char_2009.gif) :
:![[thin space (1/6-em)]](https://www.rsc.org/images/entities/char_2009.gif) citric-acid
citric-acid![[thin space (1/6-em)]](https://www.rsc.org/images/entities/char_2009.gif) :
:![[thin space (1/6-em)]](https://www.rsc.org/images/entities/char_2009.gif) total metal cation molar ratio was established as 1
total metal cation molar ratio was established as 1![[thin space (1/6-em)]](https://www.rsc.org/images/entities/char_2009.gif) :
:![[thin space (1/6-em)]](https://www.rsc.org/images/entities/char_2009.gif) 1
1![[thin space (1/6-em)]](https://www.rsc.org/images/entities/char_2009.gif) :
:![[thin space (1/6-em)]](https://www.rsc.org/images/entities/char_2009.gif) 1. Then, the pH was set around 7–8 by adding ammonium hydroxide. The solution was heated to 90 °C to form a gel, which was heat-treated at 300 °C. At this temperature, the gel self-ignited, removing all organic matter by combustion. The resulting powders were further calcined at 600 °C for 10 h.
1. Then, the pH was set around 7–8 by adding ammonium hydroxide. The solution was heated to 90 °C to form a gel, which was heat-treated at 300 °C. At this temperature, the gel self-ignited, removing all organic matter by combustion. The resulting powders were further calcined at 600 °C for 10 h.
The porous supports were manufactured by uniaxial pressing and subsequent incipient sintering of the different calcined powder samples. Each sample was mixed with polyvinyl alcohol (PVA, 1 wt%) and pressed at 55 MPa for 20YCO and 10Y-10SDC and 97 MPa for 15Y-5SDC and 5Y-15SDC. The green-disk samples of 15Y-5SDC, 10Y-10SDC and 5Y-15SDC were sintered at 1100 °C for 10 h, while the 20YCO support was sintered at 1000 °C for 10 h. The sintered supports with a 20 mm diameter and a thickness of 2 mm presented an average porosity of 35% and showed good mechanical strength. Finally, CCDP membranes were prepared by direct infiltration of the porous support with the eutectic molten carbonate mixture of Li2CO3/Na2CO3/K2CO3 (42.5/32.5/25.0) at 600 °C.40 After the membrane infiltration and cooling down processes, residual carbonate in both membrane surfaces was removed using different SiC polishing papers.
The crystal phase identification of the sintered porous supports and CCDP membranes was performed by X-ray diffraction using a D5000 diffractometer, from SIEMENS, with a Co-Kα (1.7903 Å) radiation source operating at 34 kV and 30 mA. Each sample was measured in the 2-theta (2θ) range of 15–80°. The average crystallite size and lattice parameters of all the prepared samples were calculated using the full width at half maximum (FWHM) and 2θ of the most prominent X-ray diffraction peaks by means of the Scherrer equation and Bragg's law, respectively. The membrane morphology was analyzed using scanning electron microscopy (SEM), which was performed on a JEOL JMS-7600F equipment. The porosity of the ceramic supports was measured by the Archimedes method using liquid nitrogen.41 Helium permeance was used to calculate the ratio of porosity to tortuosity for interconnected pores of the porous supports.30 Additionally, dynamic and isothermal thermogravimetric analyses (TGA) were performed to elucidate the thermal stability of the ceramic–carbonate membranes. These analyses were produced using Q500HR equipment (TA Instruments). Initially, samples were heat-treated with a heating rate of 5 °C min−1 from room temperature to 900 °C. These analyses were carried out using a gas mixture stream of 60 mL min−1 CO2 (Praxair, grade 3.0) or 40 mL min−1 N2 (Praxair grade 4.8). Then, isothermal analyses were performed at 900 °C for 20 h under a saturated CO2 atmosphere.
High-temperature CO2 permeation measurements were performed between 700 and 900 °C using a homemade permeation set-up reported elsewhere.38 Gas-tight sealing at high temperatures was attained using a ceramic paste.42 The seal was made by grinding 40 wt% Y-SDC powder, 50 wt% Pyrex powder, and 10 wt% Al2O3·Na2O with deionized water. The ceramic paste was applied on the edge of the upper side of an alumina tube, and the membrane was slightly pressed to join it to the alumina tube. Then, the gas-tight system was obtained by installing a larger alumina tube. The set-up was heated to 900 °C at 1 °C min−1 to achieve gas-tight sealing. Gas-tightness was achieved by measuring the N2 amount in the permeate side; all the CO2 permeation experiments were carried if leakage was not detected or was negligible. The feed gas mixture was CO2/N2/Ar (15/15/70 mL min−1) at 1 atm, and argon gas was used as sweep gas in the downstream side of the membrane. A nitrogen leak of at least 7 × 10⁻⁵ mol s−1 m−2 was attributed to defects in the ceramic seal (data not shown), which can be considered as a viscous flow through a microporous media, described by the Knudsen mechanism. Based on this, the CO2 permeation fluxes were corrected due to the leakage through these defects. The permeated gases were analyzed with a GC-2014 gas chromatograph (Shimadzu) equipped with a Carboxen-1000 column.
The electrical properties of the different supports (before the carbonate infiltration process) were measured using the two-point technique in DC and AC modes. These experiments were performed in order to mainly elucidate the oxygen conduction modifications present on the Y-containing samples, as part of the characterization process. Colloidal platinum electrodes (Tanaka Kikinzogu Kogyo K. K.) were deposited over both support surfaces, then were dried and annealed at 600 °C for 3 hours. Measurements were performed between 800 and 600 °C inside a quartz cell using a vacuum, and different oxygen-containing atmospheres (dry air and oxygen), in order to promote the oxygen conductivity analysis. The temperature of the samples was monitored with a K-type thermocouple. A steady-state of 1 h was achieved before every measurement. The DC resistance was measured with a 6514 system electrometer (Keithley), while the impedance data were collected with a precision impedance analyzer 6500B (Wayne Kerr Electronics). Impedance spectra were measured in the 40–10 MHz range and modeled with the Zview® software using RC models. The electrical conductivity was fitted to an Arrhenius type model to calculate the activation energy for electrical transport.
Results and discussion
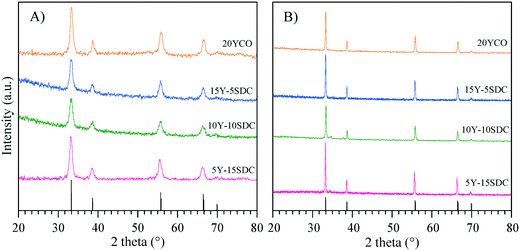
Fig. 1A shows the XRD patterns of the Y-containing sample powders calcined at 600 °C, and the supports sintered at high-temperature (Fig. 1B). The single CeO2 (04-0593 PDF file) of the fluorite type-structure was identified in all the X-ray diffraction patterns. Considering the XRD equipment resolution, no secondary phases containing samarium or yttrium were detected. It must be mentioned that there are several Y-containing CeO2 crystal structures reported in the literature,43–48 all of them exhibit the same crystalline cubic system of CeO2, with slight changes in cell parameters due to cation substitution. A similar XRD pattern was obtained for the SDC sample (data not shown). Moreover, two specific points must be noticed. i) After the sintering process, the crystallite size increased ∼300% in comparison to the green bodies. These values were calculated using the Scherrer equation. It is evidenced by the sharp diffraction peaks presented by the sintered samples (supports) as shown in Table 1. ii) The lattice parameter a was determined for the Y-Sm-containing CeO2 samples, obtaining similar results to those reported for CeO2 (5.4113 Å).| Composition | Average crystal size (Å) | Lattice parameter a (Å) | |
|---|---|---|---|
| Synthetized powder | Sintered sample | Synthetized powder | |
| 20YCO | 114 | 377 | 5.3977 |
| 15Y-5SDC | 112 | 412 | 5.4198 |
| 10Y-10SDC | 88 | 391 | 5.3914 |
| 5Y-15SDC | 103 | 465 | 5.4293 |
The CeO2 cubic cell parameter decreased by adding pure yttrium, while samarium doping slightly increased the cell volume (only the 10Y-10SDC sample did not follow this trend). The ionic radius difference can explain the crystal cell behavior; Ce4+ has an ionic radius of 0.97 Å, while the ionic radii of Sm3+ and Y3+ are 1.08 and 1.02 Å, respectively. Thus, the increase of the samarium radius causes an increase of the cell parameter. Moreover, yttrium and samarium co-doping produces anionic vacancies, as the CeO2 crystal electron-neutrality is compensated by oxygen release, modifying the unit cell size as well (reaction (2), where M = Sm or Y). Thus, the magnitude of the unit cell volume changes due to the expansion mainly produced by samarium atoms combined with the spatial contraction produced by oxygen vacancies.
 | (2) |
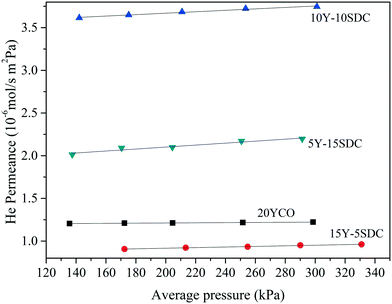
The ceramic supports were fabricated at different temperatures and pressures to achieve similarities in the pore distribution, as it is a critical issue on this kind of system. The porosity (ε) and porosity to tortuosity ratio (defined as the microstructural geometric factor, (ε/τ)pore) were calculated using the Archimedean principle in liquid nitrogen and helium permeation test at room temperature, respectively. Table 2 presents the sintering temperature and pressure used for making the disk-shaped supports. Also, the ε and the (ε/τ)pore ratio for all the samples are shown. The geometrical factor of pores was calculated using the helium permeance vs. average pressure shown in Fig. 2. Considering that helium gas permeation through macroporous ceramic support can be modeled as a viscous flow and Knudsen diffusion mechanism, as reported elsewhere,26 (ε/τ)pore was estimated by computing the slope and intercept of the linear regression in Fig. 2. As can be seen, the 20YCO ceramic support was thermally treated at 1000 °C, while all the co-doped samples were thermally treated at 1100 °C. In other words, it seems that Y but mainly Sm doping processes seem to be the limiting factor in the sintering behavior of Y-SDC samples and correlated to different preparation conditions, such as temperature and pressure. All the samples presented porosities of around 35 ± 4.5%.
| Composition | Temp. (°C) | Pressure (MPa) | R 2 | d pore (nm) | Porosity ε (%) | (ε/τ)pore | τ |
|---|---|---|---|---|---|---|---|
| 20YCO | 1000 | 55 | 0.99 | 23 | 38.6 | 0.31 | 1.25 |
| 15Y-5SDC | 1100 | 97 | 0.99 | 108 | 30.4 | 0.04 | 7.60 |
| 10Y-10SDC | 1100 | 55 | 0.98 | 63 | 39.5 | 0.33 | 1.20 |
| 5Y-15SDC | 1100 | 97 | 0.95 | 162 | 34.2 | 0.06 | 5.70 |
Besides the different Y and Sm compositions, the pressure and sintering temperature used for making the disk supports produced different densification behavior. Also, pore structure distribution as a function of dopants is a more complex process due to the differences in the activation energy for the sintering process. So, the results in Table 2 are presented as a function of porosity. As shown in Fig. 2, helium permeance increases as the porosity increases for the samples doped with Sm. Also, the (ε/τ)pore ratio increases with porosity. Unlike the geometrical factor of pores, the tortuosity, estimated using the porosity and (ε/τ)pore ratio, decreases as porosity increases. Lower tortuosity means better pore interconnection and more effective molten carbonate infiltration for making a dense membrane. Moreover, a higher (ε/τ)pore ratio implies higher effective molten carbonate conductivity, in other words, higher carbonate ion transport, as reported elsewhere.19 In regard to the 20YCO sample, it presents a similar porosity to 10Y-10SDC, and according to our previous analysis, this sample also shows such (ε/τ)pore and τ of 10Y-10SDC. However, helium permeance is slightly lower for 20YCO than that for 10Y-10SDC. This result involves more variables related to the average pore size and the sintering stage of the supports. The lower helium permeance means smaller average pore size, which does not affect the (ε/τ)pore ratio, but it does affect the resistance of gas permeation through macroporous media.
The microstructure of the sintered supports was analyzed by SEM. Fig. 3 shows the secondary-electron cross-section images of all sintered ceramics. For all these cases, the microstructures showed agglomerated polyhedral particles with a macroporous structure. The average particle size of 20YCO and Y-SDC supports was around 0.1 and 0.2 μm, respectively, due to the different sintering temperatures discussed above. Also, the images show similarities in the pore distribution between samples. Between 20YCO and 10Y-10SDC, there is a slight difference in average pore size, where the last one has a bigger average pore size than the first one. This qualitative comparison proves the differences of helium permeance for these samples, as discussed above.
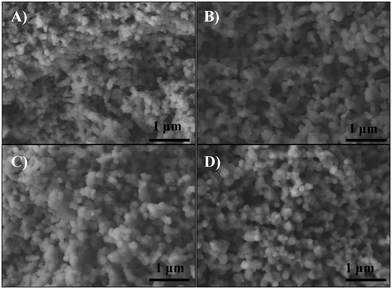 | ||
| Fig. 3 SEM images of the cross-section of (A) 20YCO, (B) 15Y-5SDC, (C) 10Y-10SDC and (D) 5Y-15SDC ceramic supports. | ||
Additionally, a semi-quantitative energy dispersive spectroscopy (EDS) analysis was performed on these samples to corroborate the average elemental composition and atomic distribution (Table 3). The results show that the obtained atomic percentage values are similar to the nominal values, confirming homogeneity of the phase. The characteristic X-ray emission from samarium was undetected for the 15Y-5SDC sample, because of the correlation and detection limits of this technique, as the corresponding EDS spectrum did show its energy band presence (data not shown). Moreover, the thermal stability of all the ceramic supports was evaluated by thermogravimetric analysis using N2 and CO2 saturated atmospheres (data not shown). It must be pointed out that none of the ceramic supports presented a weight loss higher than 0.6 wt% between 30 and 900 °C, in both atmospheres, showing high stabilities.
| Composition | Ce (at%) | Sm (at%) | Y (at%) | O (at%) | ||||
|---|---|---|---|---|---|---|---|---|
| EDS | Nominal | EDS | Nominal | EDS | Nominal | EDS | Nominal | |
| 20YCO | 29.1 | 26.7 | — | — | 7.1 | 6.7 | 63.8 | 66.7 |
| 15Y-5SDC | 30.5 | 26.7 | 0.00 | 1.7 | 6.0 | 5.0 | 63.5 | 66.7 |
| 10Y-10SDC | 29.3 | 26.7 | 4.7 | 3.3 | 3.6 | 3.3 | 62.4 | 66.7 |
| 5Y-15SDC | 25.6 | 26.7 | 4.6 | 5.0 | 1.8 | 1.7 | 67.9 | 66.7 |
The DC electrical conductivity, for all the supports including the SDC sample for comparison purposes, was measured using different environments, air, oxygen, and vacuum, between 800 and 600 °C, in order to elucidate the oxygen conduction modifications present on the Y-containing samples. The obtained results are shown in Fig. 4, where several Arrhenius-type plots are represented. The electrical conductivity in air and oxygen atmospheres was measured in order to promote the oxygen ionic conduction processes. The Y addition seems to stabilize the oxygen ionic conductivity in the whole temperature range, something not totally depicted by the 20SDC sample. In the last case, the oxygen ionic conductivity importantly decreases as a function of temperature when the oxygen concentration is low. Among the Y-containing samples, the results displayed similar values in most of the samples, where only the 10Y-10SDC sample behaved differently. This inconsistency can be attributed to the microstructural differences presented by this specific sample. There is a significant increase in the sample's conductivity in oxygen-rich atmospheres (air and oxygen) in comparison to that obtained in a vacuum (650 Pa). These results suggest a significant ionic contribution to electrical transport. According to the ionic transport equation, the behavior depicted in these plots must be linear (eqn (3)). In contrast, another complex electrical transport process should be involved.
 | (3) |
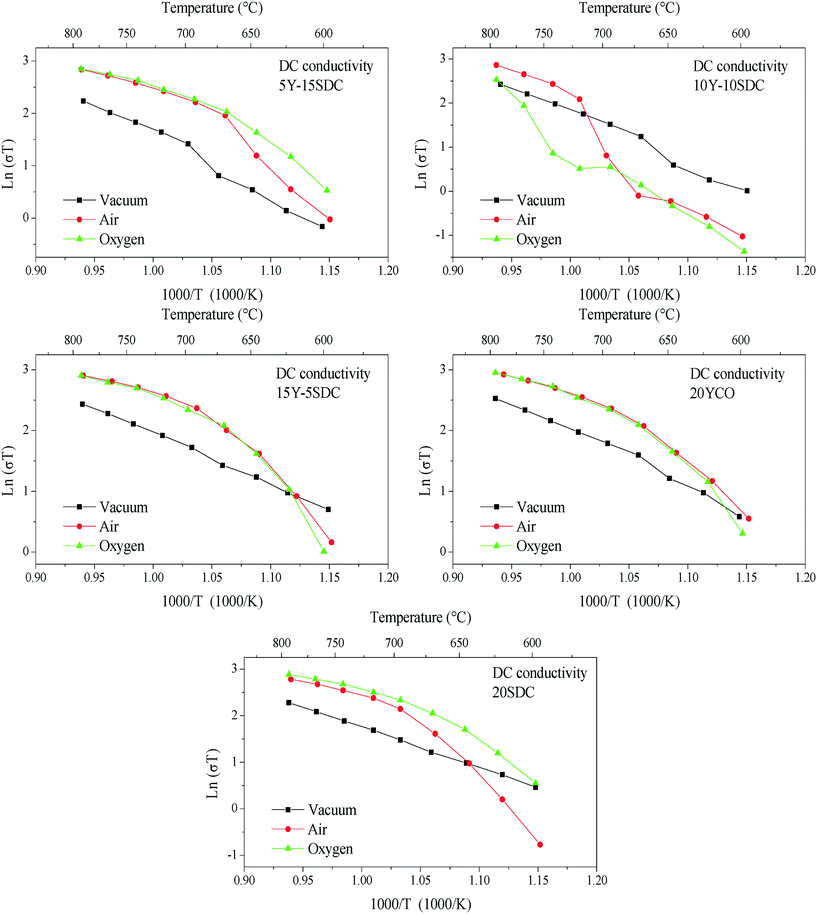 | ||
| Fig. 4 DC electrical conductivity of all the support samples measured between 800 and 600 °C using different atmospheres (vacuum, air and oxygen). | ||
Despite DC results, it is well known that yttrium-containing ceria displays mixed electrical properties,43–45 and it must be considered that this feature is present on these compounds. Thus, in order to elucidate the electrical transport mechanism, AC impedance measurements were performed under the same DC conditions. The impedance spectra displayed both resistive and capacitive behaviors, as it can be observed in Fig. 5, where the Nyquist plots are shown for the experiments performed under vacuum as an example of all the systems analyzed.
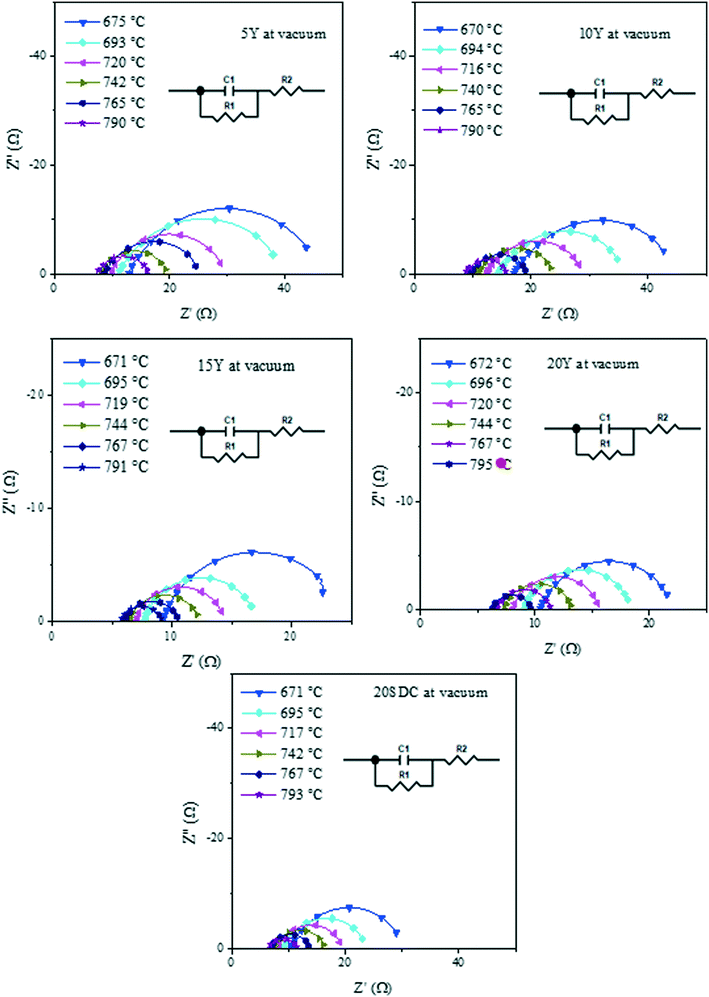 | ||
| Fig. 5 Impedance spectra in Nyquist plots of all the support samples measured in a vacuum within the 800–600 °C range. | ||
In the Nyquist plots in Fig. 5, it is possible to appreciate a lower AC impedance for the samples with high yttrium content (15Y-5SDC and 20YCO samples). Moreover, the R-RC model was used to determine the electronic and ionic contributions according to a mixed conductor model.48,49 In this scenario, the electronic resistance (Rele) can be reached by DC resistance or by Z′ at ω = 0 limit, which is R1 + R2 from R-RC equivalent circuit used by fitting the AC impedance spectra. Additionally, R2 is related to Rele and ionic resistance (Rion), according to eqn (4), the R2 value is Z′ at ω = ∞ limit, which represents mixed electrical conduction. The grain boundary contribution in ionic resistance was neglected due to the particle size (0.1–0.2 μm), and only bulk ionic contribution was considered in ionic resistance.
 | (4) |
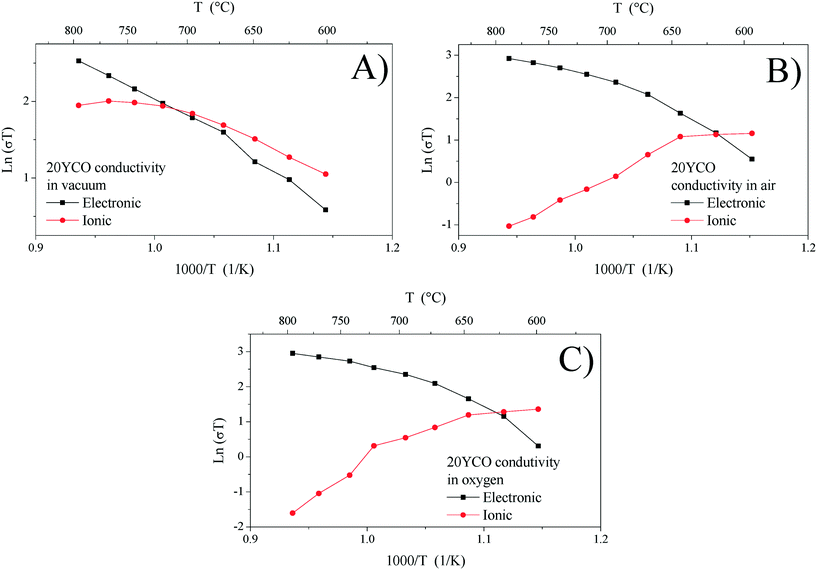
Ionic and electronic conductivities were calculated from Rele and Rion values for each electrical measurement. Fig. 6 shows each electrical conductivity measurement in an Arrhenius-type plot for the 20YCO sample performed in a vacuum, and air and oxygen atmospheres. It can be seen that 20YCO behaved as a mixed conductor regardless of the atmosphere used. However, ionic and electronic contributions are similar only under vacuum conditions (Fig. 6A), whereas the sample showed a significant electronic contribution in an oxygen containing atmosphere (Fig. 6B and C). In consequence, at high temperatures (T > 700 °C), total conductivity is limited by the electronic conductivity. Although a high oxygen-containing atmosphere triggers the ionic conductivity in the 20YCO sample, the electronic contribution controlled the electrical transport at high temperatures. It is worth mentioning that all the samples showed similar behaviors.
Fig. 7A and B show the ionic conductivity for all samples studied in a vacuum and an oxygen atmosphere, respectively. It can be seen as a thermally activated transport only under vacuum conditions, in which the activation energy (Ea) lies between 0.46 and 0.75 eV (see Table 3). In an oxygen atmosphere, this contribution decreased as the temperature increased, and it was not suitable to calculate any Ea. This behavior could be the consequence of oxygen vacancy reaction with O2, resulting in fewer charge carriers for this kind of transport. Thus, in samples studied, ionic transport is significant only in a vacuum and at low temperatures (T < 700 °C). Additionally, the electronic conductivity is shown in Fig. 7C and D under vacuum and oxygen conditions, respectively. It can be seen as a thermally activated transport in all cases.
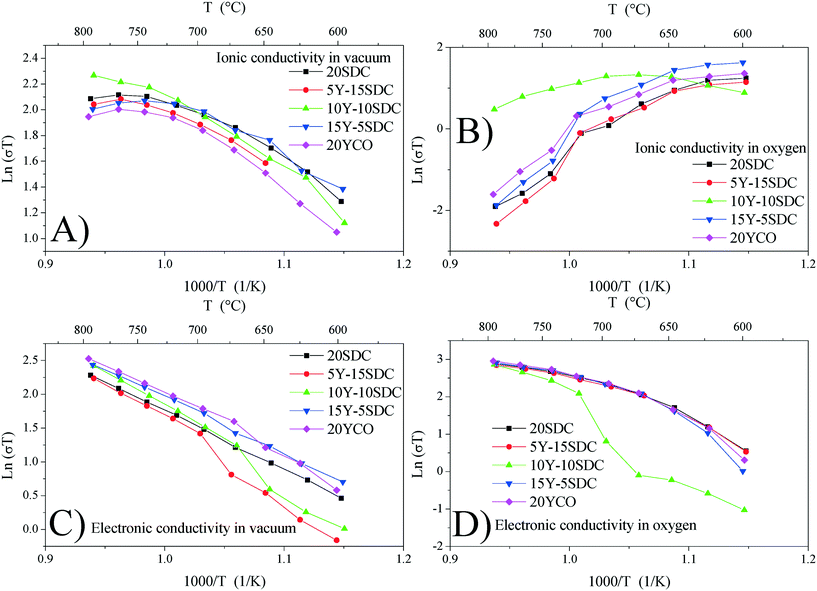 | ||
| Fig. 7 Ionic conductivity in a vacuum (A) and oxygen (B) and electronic conductivity in a vacuum (C) and oxygen (D) calculated for all support samples. | ||
However, Ea (calculated at T > 700 °C, where the electronic contributions dominate) displayed lower values in an oxygen atmosphere than in a vacuum (see Table 4). This indicates that electronic transport must be modified when chemical conditions are switched from vacuum to oxygen atmospheres. In this scenario, under vacuum conditions, electrical transport is the result of mixed ionic and electronic conduction. The electronic carriers could be the result of partial reduction of samples under sintering conditions, whereas ionic carriers are due to the chemical composition according to reaction (2). Under oxygen and air conditions, O2 could react with oxygen vacancies according to reaction (5), yielding electronic carriers as a result of material oxidation.
 | (5) |
| Sample | Ionic Ea (eV) in vacuum | Electronic Ea (eV) | |
|---|---|---|---|
| Vacuum | Oxygen | ||
| 5Y-15SDC | 0.75 | 0.75 | 0.47 |
| 10Y-10SDC | 0.58 | 0.82 | 0.93 |
| 15Y-5SDC | 0.46 | 0.66 | 0.45 |
| 20YCO | 0.65 | 0.68 | 0.49 |
| 20SDC | 0.55 | 0.75 | 0.50 |
The oxidation-type electronic carriers must attenuate the reduction-type ones, and then they govern the electronic transport in an oxygen-rich atmosphere and at high temperatures (T > 700 °C). The aforementioned is congruent with Fig. 7C and D, where the ln(σT) value at 800 °C of 2.95 for 20YCO in oxygen is shown, while in a vacuum it was reduced to 2.52. The sample oxidation reduces the oxygen vacancies resulting in lower ionic transport, as can be seen in Fig. 7D.
The temperature where the electronic and ionic conductivities reached the same magnitude (T*) is another interesting property of these ceramics. Around 100 °C above T*, the limiting-factor of the total conductivity is the electronic conductivity. Otherwise, the ceramics displayed mixed electronic–ionic properties. In the studied systems, T* shifts to a higher value in the non-oxygen containing atmosphere, and it decreases as a function of yttrium content (Fig. 8). The break-of-tendency observed in the 10Y-10SDC sample must be attributed to the microstructural differences found in this composition. In the oxygen-rich atmosphere, T* is below 650 °C (in most of the cases), while under vacuum conditions, T* shifts above 700 °C. This feature can result in significant customized material design for ion and/or electronic transport.
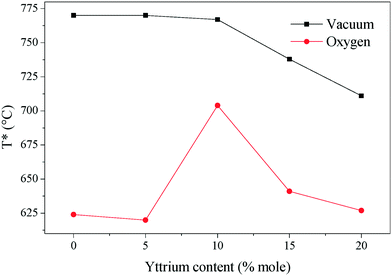 | ||
| Fig. 8 The temperature in which the electronic and ionic conductivities share values. Around 100 °C above each plotted temperature, the sample behaves as an electronic conductor. | ||
After the support characterization, CCDP membranes were prepared by molten carbonate infiltration in the porous supports. Fig. 9 shows a backscattered electron micrograph of the 10Y-10SDC-MC membrane cross-section. The bright zones correspond to the Y-SDC ceramic, while the dark zones are the alkaline carbonates. This image also confirms the effective infiltration and formation of a dense CCDP membrane.
The thermal stability of the ternary composition of molten carbonates was studied by dynamic and isothermal thermogravimetric analyses using saturated N2 and CO2 atmospheres (Fig. 10). When thermogravimetric experiments were performed using N2 (Fig. 10A), all membranes presented a weight loss of around 2.5 ± 1 wt% at a temperature higher than 730 °C. It must be attributed to the partial decomposition of the molten carbonates. This assumption is confirmed when the same thermal experiments were performed in a CO2 atmosphere. In the second case (CO2), the chemical stability of the ternary eutectic molten carbonate mixture increases, as using this atmosphere, the weight losses were notably reduced to <1.0 wt%, in all the membrane compositions (Fig. 10B). The change observed on the weight loss can be associated with a reduction of the chemical species activity in the electrolyte solution. So, the vapor pressure of this ternary mixture of molten carbonates is reduced as well. In other words, if the CO2 vapor pressure in the feed gas stream is higher than the predicted decomposition pressure, the carbonates should be stable, as demonstrated for single alkali carbonate phases.46 The ternary mixture of carbonates melts at 400 °C.47 This property suggests that the carbonate vaporize and decompose afterwards. However, they are stable under saturated CO2 atmospheres.46
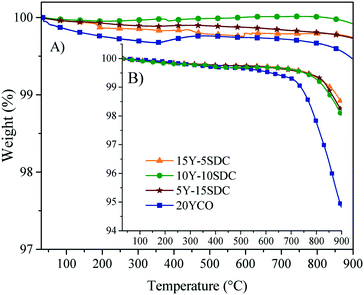 | ||
| Fig. 10 Dynamic thermogravimetric analysis in (A) CO2 and (B) N2 atmospheres of all the ceramic–carbonate membranes. | ||
Based on all these thermal results, a long-term stability isothermal analysis was performed at 900 °C for 20 hours, using a CO2 atmosphere (Fig. 11). A couple of samples presented a weight loss (1–1.5 wt%) in the first 200 min, suggesting a large amount of carbonates over the membrane surface. Nevertheless, after that initial weight loss presented by the superficial equilibrium of some samples, none of the samples presented a weight loss higher than 1 wt%, during the whole isothermal process. Moreover, the XRD patterns of the isothermal products did not show the formation of any secondary phase (Fig. 11B). Thus, the alkaline carbonate phase does not change the CeO2 crystal phase or any of the doping elements. These results confirm high thermal and structural stabilities for the Y-SDC-MC membranes, making these membranes suitable for CO2 permeation tests at high temperatures. Thus, the membrane systems evidence high thermal stability under a CO2 atmosphere.
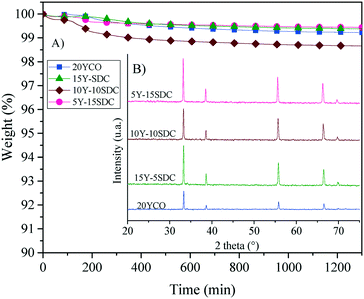 | ||
| Fig. 11 Isothermal analysis in a CO2 atmosphere (A) and XRD patterns obtained after the thermogravimetric tests (B) of the different ceramic–carbonate membranes. | ||
CO2 permeation tests were performed between 700 and 900 °C, using a mixture of CO2/N2/Ar (15/15/70 vol%), as feed gas, with a sweep gas stream of argon (100 sccm). The CO2 permeation flux equation for CCDP membranes is correlated to the CO2 partial pressure gradient across the membrane as the driving force, the ionic conductivities in the MC and ceramic phases, and the microstructure properties of the membrane as follows (eqn (6)):29
 | (6) |
 and
and  are the CO2 partial pressure on upstream and downstream sides, respectively, and k is the total conductance. Herein, the CO2 permeation flux (JCO2) is presented as a function of temperature for the CCDP membranes with different amounts of yttrium. Fig. 12A shows that the CO2 permeation flux increases with the temperature, which is also slightly different among the different Y-containing membranes, between 700 and 850 °C. The 20YCO and 10Y-10SDC samples present the highest JCO2 values. However, at 900 °C, the 10Y-10SDC membrane shows the highest CO2 permeation results.
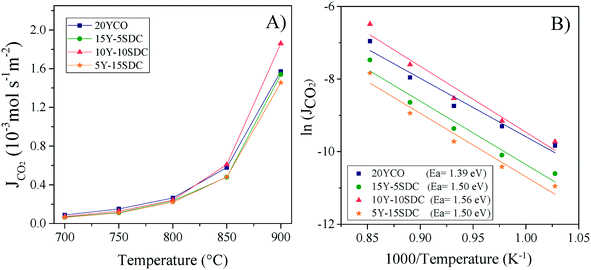 | ||
| Fig. 12 High-temperature CO2 permeation at different temperatures of the ceramic–carbonate membranes (A) and Arrhenius plots of the CO2 permeation processes including the Ea values (B). | ||
At 900 °C, the CO2 permeation flux increases as a function of the yttrium content, except for the 10Y-10SDC membrane, which presents the highest total conductivity, due to an improved microstructure of the ceramic phase and molten carbonate interconnection. The 10Y-10SDC and 20YCO membranes show the highest CO2 permeation fluxes at 900 °C, 1.86, and 1.57 × 10⁻³mol s−1 m−2, respectively. These values are similar to those obtained for the CGO-MC and YSZ-MC membranes reported in the literature20 and around 35% lower than the permeation flux of SDC-MC.18 However, the performance of Y-containing SDC systems would be enhanced by increasing the CO2 partial pressure in the feed side, tailoring the membrane microstructure (see the 10Y-10SDC membrane), and making asymmetric membranes with thin layers of Y-SDC-MC.
The CO2 separation mechanism for these membranes shows apparent activation energies between 1.39 and 1.56 eV, calculated from the Arrhenius plot of the natural logarithm of JCO2versus the inverse of temperature (Fig. 12B). These activation energies can be correlated to the total conductance of the CCDP membrane, defined as:26
 | (7) |
In this equation (eqn (7)), σC and σi are the intrinsic carbonate ionic conductivity in the carbonate phase and oxygen ionic conductivity in the ceramic phase, respectively. For ion conduction in dual-phase membranes, the intrinsic conductivity for each phase is modified by a geometrical factor defined as the volume fraction to tortuosity ratio of the carbonate or ceramic phase: (ϕ/τ)C and (ϕ/τ)S, respectively. The terms (ϕ/τ)CσC and (ϕ/τ)Sσi are referred to as the effective conductivity of the molten carbonate and ceramic phase in the membrane, respectively. The effective conductivities change with the membrane microstructure. When the effective conductivity of molten carbonates is higher than the effective conductivity of the ceramic phase, the limiting-factor for the CO2 separation mechanism is the ionic conductivity in the ceramic phase.
Analyzing the energy activation data (Fig. 12B), it is evident that the Ea values (eqn (8)) tend to decrease as a function of the yttrium content, being 1.39 and 1.5 eV for the 20YCO and 5Y-15SDC systems, respectively. The 10Y-10SDC case, with an Ea of 1.56 eV, should be treated separately, due to the microstructural differences. The observed trend is similar to that obtained for the ionic conductivity in the ceramic supports under vacuum conditions (see Table 3). These results mean that the CO2 permeation flux is mainly related to the oxygen ion conductivity of the ceramic supports. However, the microstructural parameters of the membrane supports are decisive for improving the permeation properties. For instance, as the molten carbonates fill the pores of the ceramic phase, the porosity to tortuosity ratio in Table 1 is equal to the volume fraction to tortuosity of molten carbonate in the membrane. As this ratio increases, the molten carbonate conductivity increases, as the highest magnitude was obtained in the 10Y-10SDC membrane. However, the volume fraction to tortuosity of the ceramic phase affects the effective conductivity of the Y-SDC compositions in the CCDP membrane, thus the total ionic conductivity and CO2 permeation flux as well (Fig. 13).
 | (8) |
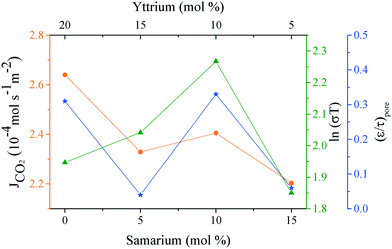 | ||
| Fig. 13 CO2 permeation and ionic conductivity obtained at 800 °C in a vacuum and the porosity to tortuosity ratio (ε/τ)poreversus the amount of co-dopants in all the samples. | ||
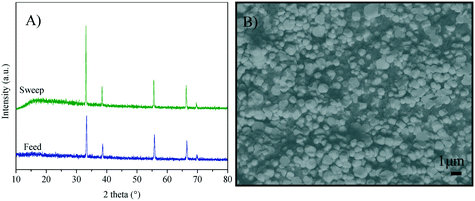
The crystal structure and microstructure of Y-SDC-MC membranes were analyzed by XRD and SEM techniques (Fig. 14) after the CO2 permeation tests. Fig. 14A shows the XRD patterns of the feed and permeate sides of the 10Y-10SDC sample as an example. For all the samples, the X-ray diffraction patterns only showed the presence of the CeO2 crystalline phase with a fluorite-type structure, without the formation of any other secondary phase. These results confirm the chemical stability of all the Y-SDC membranes.
From the microstructural point of view, Fig. 14B shows the cross-section image of one of the Y-containing systems, where two different contrasts are observed. As explained above, the membrane compositions produce different contrasts, bright for the Y-SDC ceramics and dark for the mixture of infiltrated carbonates. Thus, membrane pores remained filled with the carbonate phase, but the particles grew from 0.2 μm, at the beginning of the membrane preparation, to 1 μm after the CO2 permeation process. Thus, the temperature applied during the permeation keep sintering the samples, without modifying their crystal phase compositions, as already reported.50 Moreover, the carbonate phase can be seen in Fig. 14, although the pore size seems to be reduced, or at least modified, due to the sintering process already described.
Conclusions
Yttrium and samarium co-doped CeO2 ceramic supports are chemically and thermally stable under oxidative and acid atmospheres. They show high electrical conductivity at high temperatures. In addition, these supports present good molten carbonate wettability and chemical stability. The Y-SDC supports behave like mixed conductors, in which ionic and electronic conductivities showed similar contributions, but the ionic conductivity decreases as a function of the yttrium content in the samples. These findings allow to establishing prevailing conditions of conductivity (ionic or electronic) based on the composition and temperature, very important issues on ceramic–carbonate dual-phase membrane systems. Then, these conduction properties were correlated to the subsequent CO2 permeation results, based on the fact that CO2 permeation is mostly limited by the oxygen-ion conductivity of the ceramic supports. The CO2 permeation results for these Y-SDC membranes are promising outcomes as they are similar to or higher than those for other CCDP membranes reported in the literature at 900 °C. The 10Y-10SDC and 20YCO membranes show the highest CO2 permeation fluxes of 1.86 and 1.57 × 10⁻³ mol s−1 m−2, respectively, with the advantage of reducing the amount of samarium as a dopant. Optimization of the support microstructure and electrical properties of these membranes plays an essential role in improving the CO2 permeation flux. Thus, Y-SDC membranes show potential applications for CO2 separation in industrial combustion processes.Conflicts of interest
The are no conflicts to declare.Acknowledgements
This work was financially supported by the project SENER-CONACYT 251801. The authors thank Adriana Tejeda and Omar Novelo for their technical assistance. D. González-Varela thanks CONACYT for her Ph D scholarship.References
- O. S. Bushuyev, P. De Luna, C. T. Dinh, L. Tao, G. Saur, J. van de Lagemaat, S. O. Kelley and E. H. Sargent, Joule, 2018, 2, 1–8 CrossRef
.
- V. S. Sikarwar, M. Zhao, P. Clough, J. Yao, X. Zhong, M. Z. Memon, N. Shah, E. J. Anthony and P. S. Fennell, Energy Environ. Sci., 2016, 9, 2939–2977 RSC
.
- M. C. Iliuta, Adv. Chem. Eng., 2017, 51, 97–205 CAS
.
- F. Wu, M. D. Argyle, P. A. Dellenback and M. Fan, Prog. Energy Combust. Sci., 2018, 67, 188–205 CrossRef
.
- S. Morais, A. Cario, N. Liu, D. Bernard, C. Lecoutre, Y. Garrabos, A. Ranchou-Peyruse, S. Dupraz, M. Azaroual, R. L. Hartman and S. Marre, React. Chem. Eng., 2020, 5, 1156–1185 RSC
.
- S. Budinis, S. Krevor, N. Mac Dowell, N. Brandon and A. Hawkes, Energy Strategy Rev., 2018, 22, 61–81 CrossRef
.
- J. H. Zhou and Y. W. Zhang, React. Chem. Eng., 2018, 3, 591–625 RSC
.
- M. Bui, C. S. Adjiman, A. Bardow, E. J. Anthony, A. Boston, S. Brown, P. S. Fennell, S. Fuss, A. Galindo, L. A. Hackett, J. P. Hallett, H. J. Herzog, G. Jackson, J. Kemper, S. Krevor, G. C. Maitland, M. Matuszewski, I. S. Metcalfe, C. Petit, G. Puxty, J. Reimer, D. M. Reiner, E. S. Rubin, S. A. Scott, N. Shah, B. Smit, J. P. M. Trusler, P. Webley, J. Wilcox and N. Mac Dowell, Energy Environ. Sci., 2018, 11, 1062–1176 RSC
.
- R. Currie, M. W. Fowler and D. S. A. Simakov, Chem. Eng. J., 2019, 372, 1240–1252 CrossRef CAS
.
- R. Steeneveldt, B. Berger and T. A. Torp, Chem. Eng. Res. Des., 2006, 84, 739–763 CrossRef CAS
.
- L. Lei, L. Bai, A. Lindbråthen, F. Pan, X. Zhang and X. He, Chem. Eng. J., 2020, 401, 126084 CrossRef CAS
.
- M. A. Aroon, A. F. Ismail, T. Matsuura and M. M. Montazer-Rahmati, Sep. Purif. Technol., 2010, 75, 229–242 CrossRef CAS
.
- D. F. Sanders, Z. P. Smith, R. Guo, L. M. Robeson, J. E. McGrath, D. R. Paul and B. D. Freeman, Polymer, 2013, 54, 4729–4761 CrossRef CAS
.
- X. Dong and Y. S. Lin, J. Membr. Sci., 2016, 520, 907–913 CrossRef CAS
.
- M. Anderson and Y. S. Lin, J. Membr. Sci., 2010, 357, 122–129 CrossRef CAS
.
- Z. Wang, T. Chen, N. Dewangan, Z. Li, S. Das, S. Pati, Z. Li, J. Y. S. Lin and S. Kawi, React. Chem. Eng., 2020, 5, 1868–1891 RSC
.
- J. Xue, L. Chen, Y. Wei and H. Wang, Chem. Eng. J., 2017, 327, 202–209 CrossRef CAS
.
- T. Norton, B. Lu and Y. S. Lin, J. Membr. Sci., 2014, 467, 244–252 CrossRef CAS
.
- C. Dannesboe, J. B. Hansen and I. Johannsen, React. Chem. Eng., 2020, 5, 183–189 RSC
.
- J. L. Wade, C. Lee, A. C. West and K. S. Lackner, J. Membr. Sci., 2011, 369, 20–29 CrossRef CAS
.
- L. Zhang, Z. Mao, J. D. Thomason, S. Wang and K. Huang, J. Am. Ceram. Soc., 2012, 95, 1832–1837 CrossRef CAS
.
- L. Zhang, X. Li, S. Wang, K. G. Romito and K. Huang, Electrochem. Commun., 2011, 13, 554–557 CrossRef CAS
.
- T. Chen, Z. Wang, L. Liu, S. Pati, M. H. Wai and S. Kawi, Chem. Eng. J., 2020, 379, 122182 CrossRef CAS
.
- L. Zhang, N. Xu, X. Li, S. Wang, K. Huang, W. H. Harris and W. K. S. Chiu, Energy Environ. Sci., 2012, 5, 8310–8317 RSC
.
- T. T. Norton and Y. S. Lin, Solid State Ionics, 2014, 263, 172–179 CrossRef CAS
.
- J. Ortiz-Landeros, T. T. Norton and Y. S. Lin, Chem. Eng. Sci., 2013, 104, 891–898 CrossRef CAS
.
- J. Kim and Y. S. Lin, J. Am. Ceram. Soc., 1999, 82, 2641–2646 CrossRef CAS
.
- H. Ahna, D. Kima, V. M. A. Melgar, J. Kima, M. R. Othman, H. V. P. Nguyen, J. Han and S. P. Yoon, J. Ind. Eng. Chem., 2014, 20, 3703–3708 CrossRef
.
- Z. Rui, M. Anderson, Y. S. Lin and Y. Lin, J. Membr. Sci., 2009, 345, 110–118 CrossRef CAS
.
- S. J. Chung, J. H. Park, D. Li, J. I. Ida, I. Kumakiri and Y. S. Lin, Ind. Eng. Chem. Res., 2005, 44, 7999–8006 CrossRef CAS
.
- J. L. Wade, K. S. Lackner and A. C. West, Solid State Ionics, 2007, 178, 1530–1540 CrossRef CAS
.
- Y. C. Wu and C. C. Lin, Int. J. Hydrogen Energy, 2014, 39, 7988–8001 CrossRef CAS
.
- X. Dong and W. Jin, Curr. Opin. Chem. Eng., 2012, 1, 163–170 CrossRef CAS
.
- M. L. Fontaine, T. A. Peters, M. T. P. McCann, I. Kumakiri and R. Bredesen, Energy Procedia, 2013, 37, 941–951 CrossRef CAS
.
- B. Xu, H. Yang, Q. Zhang, S. Yuan, A. Xie, M. Zhang and T. Ohno, ChemCatChem, 2020, 12, 2638–2646 CrossRef CAS
.
- M. Ezbiri, A. Reinhart, B. Huber, K. M. Allen, A. Steinfeld, B. Bulfin and R. Michalsky, React. Chem. Eng., 2020, 5, 685–695 RSC
.
- V. V. Kharton, F. M. B. Marques and A. Atkinson, Solid State Ionics, 2004, 174, 135–149 CrossRef CAS
.
- O. Ovalle-Encinia, H. Pfeiffer and J. Ortiz-Landeros, J. Membr. Sci., 2018, 547, 11–18 CrossRef CAS
.
- W. C. Wu, J. T. Huang and A. Chiba, J. Power Sources, 2010, 195, 5868–5874 CrossRef CAS
.
- Y. Li, Z. Rui, M. Anderson and Y. S. Lin, Catal. Today, 2009, 148, 303–309 CrossRef CAS
.
- K. G. Harry and A. Johnson, J. Archaeol. Sci., 2004, 31, 1567–1575 CrossRef
.
- X. Qi, F. T. Akin and Y. S. Lin, J. Membr. Sci., 2001, 193, 185–193 CrossRef CAS
.
- S. K. Tadokoro, T. C. Porfírio, R. Muccillo and E. N. S. Muccillo, J. Power Sources, 2004, 130, 15–21 CrossRef CAS
.
- J. Koettgen, S. Grieshammer, P. Hein, B. O. H. Grope, M. Nakayama and M. Martin, Phys. Chem. Chem. Phys., 2018, 20, 14291–14321 RSC
.
- T. S. Zhang, J. Ma, L. B. Kong, S. H. Chan and J. A. Kilner, Solid State Ionics, 2004, 170, 209–217 CrossRef CAS
.
- U. Gude, S. Baumann, W. A. Meulenberg and M. Müller, Sep. Purif. Technol., 2019, 215, 378–383 CrossRef CAS
.
-
J. Janz, C. Allen, P. Bansal, R. Murphy, R. Tomkins, Physical properties data compilations relevant to energy storage. II. Molten salts: data on single and multi-component salt systems, National Bureau of Standards, Washington, DC, 1979 Search PubMed
.
- R. A. Huggins, Ionics, 2002, 8, 300–313 CrossRef CAS
.
- J. Jamnik and J. Maier, J. Electrochem. Soc., 1999, 146, 4183–4188 CrossRef CAS
.
- R. Yan, F. Chu, Q. Ma, X. Liu and G. Meng, Mater. Lett., 2006, 60, 3605–3609 CrossRef CAS
.
| This journal is © The Royal Society of Chemistry 2021 |


