 Open Access Article
Structural evolution and dielectric properties of biaxially oriented polyethylene/multiwalled carbon nanotube composite films†
Meihan Li,
Guangsheng Shi,
Qiang Feng,
Jiang Li *,
Jie Zhang* and
Shaoyun Guo
State Key Laboratory of Polymer Materials Engineering, Polymer Research Institute of Sichuan University, Chengdu 610065, China. E-mail: li_jiang@scu.edu.cn; zh.receive@gmail.com
First published on 3rd December 2021
Abstract
In modern power systems, polymer nanocomposite films have been more frequently used as dielectric materials for capacitors. However, the low energy storage density limits its application in more areas. It is a very challenging task to prepare dielectric films with high dielectric constant (ε), high energy storage density, and low dielectric loss (tan![[thin space (1/6-em)]](https://www.rsc.org/images/entities/char_2009.gif) δ) at the same time. In this study, one kind of BOPE (biaxially oriented polyethylene) nanocomposite dielectric films with a very small amount of MWCNTs (multiwalled carbon nanotubes) was reported. MWCNTs with a high aspect ratio were used for conductive filler, and the formation of more micro capacitors and interfacial polarization were caused by better dispersibility of MWCNTs in polyethylene matrix by biaxial stretching. The BOPE/MWCNT composite films with high-performance were successfully prepared by achieving the requirements of low content, high dielectric constant and high energy storage density while maintaining the advantages of low dielectric loss of the polymer matrix. The dielectric constant of the BOPE/MWCNT composite films increased from 2.26 to 4.68 with the drawing ratio was 4 × 4 and the content of MWCNTs was 0.6 wt% and the energy storage density was also increased from 1.01 J cm−3 to 1.29 J cm−3. From our work, the achievement of low thickness, high energy density and low loss at the same time implied BOPE/MWCNT composite films were promising materials for next-generation film capacitors.
δ) at the same time. In this study, one kind of BOPE (biaxially oriented polyethylene) nanocomposite dielectric films with a very small amount of MWCNTs (multiwalled carbon nanotubes) was reported. MWCNTs with a high aspect ratio were used for conductive filler, and the formation of more micro capacitors and interfacial polarization were caused by better dispersibility of MWCNTs in polyethylene matrix by biaxial stretching. The BOPE/MWCNT composite films with high-performance were successfully prepared by achieving the requirements of low content, high dielectric constant and high energy storage density while maintaining the advantages of low dielectric loss of the polymer matrix. The dielectric constant of the BOPE/MWCNT composite films increased from 2.26 to 4.68 with the drawing ratio was 4 × 4 and the content of MWCNTs was 0.6 wt% and the energy storage density was also increased from 1.01 J cm−3 to 1.29 J cm−3. From our work, the achievement of low thickness, high energy density and low loss at the same time implied BOPE/MWCNT composite films were promising materials for next-generation film capacitors.
Introduction
High-performance polymeric dielectric films are an important component of dielectric capacitors.1–3 Dielectric capacitors with the highest power density, wide operating temperature range and long-life cycle now are widely used in electric vehicles, wind power generation, pulsed power supplies and many other fields.4–6 The composite films prepared by polymer and high dielectric constant filler have become a popular direction for the development of dielectric films. Generally the dielectric constant increased with the adding of filler content, unfortunately, the dielectric loss of the composites also increased.7,8 Obviously, it did not meet the requirement of developing high-performance polymeric dielectric films with high dielectric constant, low dielectric loss, and high energy storage density which were adapted to the rapid development of the energy and electronics industries.9,10 Therefore, how to prepare high-performance polymer nanocomposite films at low filler content has become a popular research direction.Currently, it is still common to use traditional polymers as the matrix and ceramic particles or conductive particles are added for performance modification.11 The difference in dielectric constant between the matrix and filler is used to cause interfacial polarization, which enhances the polarization ability of the material. A variety of ceramic nanofibers with high aspect ratios by electrostatic spinning were investigated and the effects of the filler structure and phase morphology on the dielectric constant and energy density of the composites were thoroughly studied.12 Most of the ceramic materials as inorganic oxide with high dielectric constants have poor adhesion to the polymer matrix and are prone to be agglomerated.13–16 Only when the amount is high enough (up to 30% (vol) or more) can the dielectric properties be effectively improved. But such a high amount of filler is bound to deteriorate the mechanical properties of the material. The conductive filler could greatly increase the dielectric constant of materials with a very small amount of addition and has a less negative impact on the processing performance.8 The large filler particles would aggregate causing defects such as micro cracks and interface weakening, resulting in lower breakdown field strength and the increase of dielectric loss when the three-dimensional metal particles17–19 or two-dimensional carbon materials such as graphene20–23 are used as fillers.24 As nano conductive fillers with a high aspect ratio, MWCNTs are one of the ideal fillers for the preparation of high-performance composite materials with excellent mechanical and dielectric properties.25,26 In past work, MWCNTs were incorporated into PVDF to make composite materials with high dielectric properties27 or used to decorate ultrahigh molecular weight polyethylene powder particles to produce electrically conductive porous filtration membranes.28
However, the dielectric loss would be extremely high because MWCNTs are highly prone to be agglomerated which leads to the formation of conductive pathways in the matrix.29 In previous studies, people used methods such as ultrasonic dispersion in solution or surface treatment of MWCNTs.30–32 Self-polymerization of dopamine hydrochloride was used to generate polydopamine (PDA) to coat CNTs and prevent direct contact between adjacent conductive particles, thus achieving a balance between the dielectric constant and dielectric loss.33 But these methods have disadvantages like complex processes and low efficiency. Xiang D et al.34 investigated the effect of carbon nanomaterials on the processability of HDPE and the effect of biaxially oriented on the dispersion of carbon nanoparticles. But due to the low crystallinity of HDPE resin, poor stretchability led to a low drawing ratio. Recently, Dow had developed LDPE resins that could be biaxially stretched in a wide temperature window. The biaxially oriented polyethylene (BOPE) films formed by commercial scale tenter frame lines have higher modulus and puncture impact strength, easier tear and better optical properties than the blown films. Polyethylene nanocomposites not only have good tensile strength and low conductivity, but also can improve electric field distribution and inhibit electric dendrite growth, which are expected to become a new generation of electrical dielectric material after BOPP capacitive film.35–37 Moreover, BOPE films could even exceed the performance of other PE films while the thickness is reduced, adapting to the green and low-carbon trend.
The use of functional fillers with low content and the improvement of filler dispersion by changing the processing method are the main directions of composites research.10,38 In this report, the effect of biaxial orientation on the morphology and dielectric properties of and BOPE/MWCNT composite films at high drawing ratios were investigated. As the content of MWCNTs increased from 0 to 0.6 wt%, the films had an increase in dielectric constant but a decrease in breakdown strength while maintaining the low dielectric loss, resulting in an overall increase in energy storage density. Moreover, the energy storage density of the samples with a drawing ratio of 5 × 5 was slightly lower.
Experimental
Materials
The experimental low-density polyethylene (LDPE) resin with a density of 0.926 g cm−3 used in this study for BOPE application, XUS 59![[thin space (1/6-em)]](https://www.rsc.org/images/entities/char_2009.gif) 910.08, was purchased from DOW, with a melt index 1.7 g (10 min)−1 (190 °C, 2.16 kg). Multiwalled carbon nanotubes (NC7000) were kindly supplied by Nanocyl SA (Belgium). The MWCNTs have a nominal average length of 1.5 μm and a nominal diameter of 9.5 nm. The density of the MWCNTs is 1.85 g cm−3. All resins were thoroughly dried under vacuum before melt processing.
910.08, was purchased from DOW, with a melt index 1.7 g (10 min)−1 (190 °C, 2.16 kg). Multiwalled carbon nanotubes (NC7000) were kindly supplied by Nanocyl SA (Belgium). The MWCNTs have a nominal average length of 1.5 μm and a nominal diameter of 9.5 nm. The density of the MWCNTs is 1.85 g cm−3. All resins were thoroughly dried under vacuum before melt processing.
Sample preparation
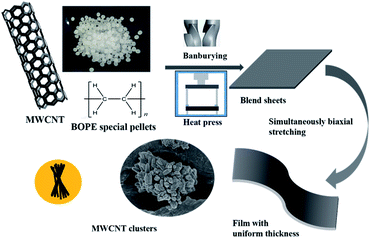
Firstly, pre-mixed BOPE/MWCNT blends with 0.2 wt%, 0.4 wt%, 0.6 wt% and 0.8 wt% MWCNTs were densely mixed at 170 °C for 20 min using an internal mixer. The homogeneously mixed blends were hot-pressed between two polyester films into sheets (100 mm × 100 mm) at 180 °C with a thickness between 200–230 μm.The film stretching and forming was performed by the Karo IV film biaxial stretching laboratory from Bruckner, Germany. Firstly, it was preheated for 100 s at a certain temperature (110 °C) and simultaneously biaxial stretching was performed approximately at 115 °C with drawing ratios of 2 × 2, 3 × 3, 4 × 4 and 5 × 5, respectively. Then it was cooled at room temperature and the stretching rate was 50% s−1 in all cases. When the drawing ratio was 4 × 4, the simultaneously biaxially oriented films with 0.2 wt% MWCNTs and the original films were called S-0.4-4 and S-0-4, respectively. The preparation process of BOPE/MWCNT composite films is shown in Fig. 1 and specific parameters are shown in Table 1.
| Samples | ωMWCNT (wt%) | Sheet thickness (μm) | T (°C) | λ | Film thickness (μm) |
|---|---|---|---|---|---|
| a Only the parameters of the highlighted samples are listed here due to a large number of samples. In the following various tests, the same thickness of the same sample was taken. | |||||
| S-0-4 | 0 | 200–230 | 112 | 4 × 4 | 25 ± 2 |
| S-0.2-4 | 0.2 | 200–230 | 114 | 4 × 4 | 25 ± 2 |
| S-0.4-4 | 0.4 | 200–230 | 114 | 4 × 4 | 25 ± 2 |
| S-0.6-4 | 0.6 | 200–230 | 115 | 4 × 4 | 25 ± 2 |
| S-0-5 | 0 | 200–230 | 112 | 5 × 5 | 19 ± 2 |
| S-0.2-5 | 0.2 | 200–230 | 114 | 5 × 5 | 19 ± 2 |
| S-0.4-5 | 0.4 | 200–230 | 114 | 5 × 5 | 19 ± 2 |
| S-0.6-5 | 0.6 | 200–230 | 115 | 5 × 5 | 20 ± 2 |
Characterization methods and instrumentation
 | (1) |
Results and discussion
Dielectric properties
The dielectric constant is an important criterion for evaluating the performance of capacitive films. As shown in Fig. 2(a) and (b), the unstretched BOPE/MWCNT0.2% composites and the films with 0.8 wt% filler content and drawing ratio of 5 × 5 both had excessive dielectric loss which did not meet the requirements for high dielectric properties of the material. At the same time, the breakdown strength of the films with drawing ratios of 2 × 2 and 3 × 3 was too low (<300 MV m−1), therefore the properties of the composite films which the content of MWCNTs was 0–0.6 wt% with drawing ratios of 4 × 4 and 5 × 5 were focused on in the next section.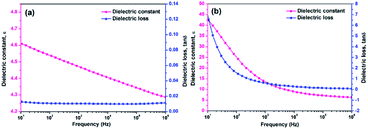 | ||
| Fig. 2 Dielectric properties of (a) un-stretched BOPE/MWCNT film with 0.2 wt% MWCNTs and (b) BOPE/MWCNT film with 0.8 wt% MWCNTs and drawing ratio was 5 × 5. | ||
From Fig. 3(c) and (d), the relationship of dielectric constant and the mass fraction of MWCNTs was revealed. It indicated that the ε of the BOPE/MWCNT composite films all increased with the adding of MWCNT content at different drawing ratios. Especially when the drawing ratio was 4 × 4 and the content of MWCNTs was increased to 0.6 wt%, the dielectric constant increased to 4.68 (frequency ∼ 103 Hz), which was approximately twice that of pure BOPE.
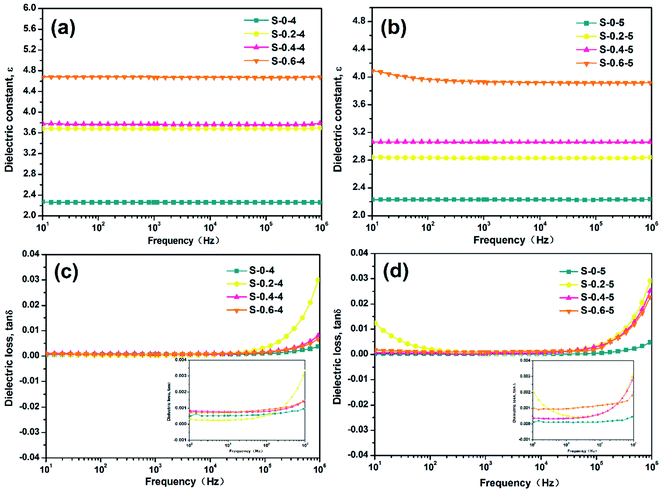 | ||
| Fig. 3 Effect of the different MWCNTs contents and different drawing ratios on the dielectric properties: (a) and (b) dielectric constant; (c) and (d) loss tangent. | ||
In addition, the ε of the films with the same MWCNTs content decreased with the increasing drawing ratio. When the mass fraction of MWCNTs was 0.6%, the dielectric constant decreased from 4.68 to 3.92 with the increase of the drawing ratio from 4 × 4 to 5 × 5 (frequency ∼ 1 kHz). The dielectric loss of the composite material is another important factor affecting the energy storage properties of the capacitor. As shown in Fig. 3(c) and (d), the tan![[thin space (1/6-em)]](https://www.rsc.org/images/entities/char_2009.gif) δ of BOPE and BOPE/MWCNT composite films were all in the range of 10−4 to 10−3 at 103 Hz.
δ of BOPE and BOPE/MWCNT composite films were all in the range of 10−4 to 10−3 at 103 Hz.
It is clear that the addition of MWCNTs in the matrix mainly has a large effect on the dielectric properties from the data analysis. There is only weak electron polarization inside and no relaxation polarization loss with frequency of PE since it is a non-polar polymer with a relatively regular structure. Therefore, the dielectric constant of PE is only 2.2–2.3 and the dielectric loss is less than 0.005 in the entire test frequency range. Filling with trace amounts of multiwalled carbon nanotubes could substantially increase the dielectric constant of the film materials. On the one hand, the addition of MWCNTs causes the formation of micro capacitors inside the film. The number of micro capacitors increases with the increase of fillers and the strength of the micro capacitors becomes larger as the distance between the fillers becomes smaller, thus increasing the dielectric constant of the film. On the other hand, interfaces are created between the filler and the matrix due to the addition of conductive particles. The interfacial polarization and dielectric constant would increase when the more the interfaces between fillers and matrix. Therefore, the addition of MWCNTs conductive filler is an effective means to improve the dielectric properties of polymer-based composite films. The conductive network formed in the matrix is stronger because MWCNTs are one-dimensional material with a large aspect ratio and more entanglement. Biaxial orientation could increase the distance between nanoparticles and destroy the nanoparticle network to block the conductive pathway of the nanoparticles. In addition, the dielectric constant of air is 1 and tiny defects like micro-cracks were generated in the biaxially stretched films due to the poor compatibility between polymer matrix and nano-fillers. Therefore, the ε of films decreased with the increase of drawing ratio.
From the analysis of formula (2), it can be seen that the dielectric loss can be regarded as composed of two parts. One part originates from the conductivity loss generated by the slight conductive carriers inside the dielectric when the motion occurs under the action of external electric field in order to overcome the frictional force. The other part is the relaxation loss of the dielectric due to the dipole polarization of the dielectric material. The dielectric loss angle tangent value (tan![[thin space (1/6-em)]](https://www.rsc.org/images/entities/char_2009.gif) δ) tends to infinity and the dielectric loss gradually decreases with the increase of frequency when ω → 0. However, the tan
δ) tends to infinity and the dielectric loss gradually decreases with the increase of frequency when ω → 0. However, the tan![[thin space (1/6-em)]](https://www.rsc.org/images/entities/char_2009.gif) δ again appears to increase with frequency because the relaxation loss gradually increases in the process of the establishment of the relaxation polarization.
δ again appears to increase with frequency because the relaxation loss gradually increases in the process of the establishment of the relaxation polarization.
The equation for the loss angle tangent of a dielectric under an alternating electric field is:
 | (2) |
For more details, the dielectric loss in the low frequency range is mainly conductivity loss but the contribution of relaxation loss is large in the high frequency range. The dielectric loss is mainly caused by current leakage for polymer composite materials filled with conductive particles such as MWCNTs. The more conductive paths are formed with more content of conductive filler so that the leakage of current is more severe and the dielectric loss is higher. As shown in Fig. 3(c) and (d), the tan![[thin space (1/6-em)]](https://www.rsc.org/images/entities/char_2009.gif) δ of the BOPE/MWCNT composite films increased with frequency after about 104 Hz. Because the various polarizations of the dielectric materials could be established in time in the low frequency region and the loss is all conductivity loss caused by a conductance which is close to it under a constant electric field.
δ of the BOPE/MWCNT composite films increased with frequency after about 104 Hz. Because the various polarizations of the dielectric materials could be established in time in the low frequency region and the loss is all conductivity loss caused by a conductance which is close to it under a constant electric field.
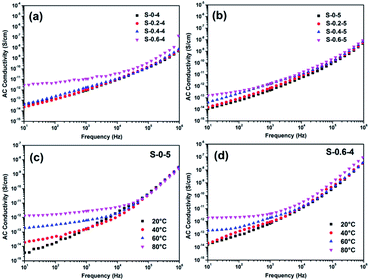
For conductive particle-filled composites, the conductivity is not only related to the volume of the conductive particles, but also to the properties of the matrix and the conductive particles. As seen in Fig. 4(a) and (b), the conductivity of the pure BOPE films was 1.57 × 10⁻¹² S cm−1 (frequency ∼ 1 kHz), and the AC conductivities of the composites increased with the increase of MWCNTs content. As the filler content increased, electrons could cross the barrier and conduct through the quantum tunneling effect although the MWCNTs did not form a conductive path through contact with each other. This difference in conductivity was particularly pronounced in the low frequency range, indicating that the difference in space charge motion due to polarization was most obvious at low frequencies. The content of MWCNTs used in this experiment was very small, and the conductivities of all samples were below 10−6 S cm−1 at frequencies from 10 to 106. The AC conductivities of these BOPE/MWCNT composite films were completely frequency-dependent, which indicates that the MWCNTs did not form a good interconnected network due to the homogeneous dispersion in the polymer matrix after biaxial stretching. It is beneficial to achieve high dielectric properties without high dielectric loss.40 The conductivities for the BOPE and BOPE/MWCNT films increased as the temperature increased (Fig. 4(c) and (d)), which indicates that the concentration and/or mobility of free electrons in thermally activated BOPE/MWCNT films were increased.
Morphology for BOPE/MWCNT composite films
The morphology of BOPE/MWCNT composite films was observed by SEM, and the graphs were given in Fig. 5 and 6. The diameter of multiwalled carbon nanotubes is generally a few nanometers to tens of nanometers, while their length is in the micron range, with a very large aspect ratio. Since they are nanoscale fillers, MWCNTs tend to agglomerate. The variation of the dispersion state of MWCNTs in the matrix with increasing mass fraction was shown in Fig. 5. The small protrusions on the cross section of the films were judged to be the ends of MWCNTs aggregate clusters by shape and size. The multiwalled carbon nanotubes were more uniformly dispersed in the BOPE matrix due to the low filling amount. However, because MWCNTs are highly agglomerated, the aggregated clusters became larger and denser with the mass fraction of MWCNTs increasing, indicating that the dispersibility of the filler in the matrix decreased. It can also be clearly seen that the interface between MWCNTs and the polymer matrix was not obvious, indicating that the filler was well compatible with the matrix. The shear force in materials during biaxial stretching could improve the dispersion of nano-fillers in the polymer matrix.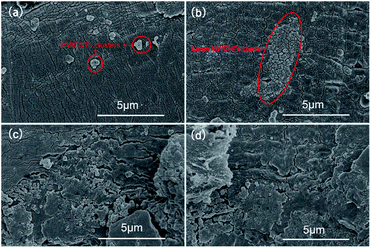 | ||
| Fig. 5 SEM images for BOPE/MWCNT composite films with different MWCNTs content at drawing ratio was 5 × 5: (a) S-0.2-5; (b) S-0.4-5; (c) and (d) S-0.6-5. | ||
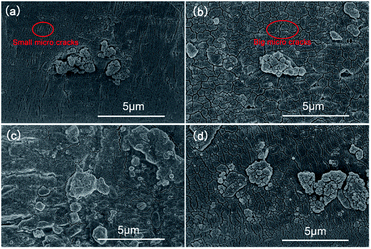 | ||
| Fig. 6 SEM images for BOPE/MWCNT composite films with different drawing ratios: (a) and (b) S-0.2-4 and S-0.2-5; (c) and (d) S-0.6-4 and S-0.6-5, respectively. | ||
As shown in Fig. 6, the MWCNTs aggregated clusters were better dispersed when the drawing ratio was increased to 5 × 5 for the same filler content. By observing the cross-section through SEM (Fig. S1†), not only the aggregated cluster ends of MWCNTs but also the lateral morphology of MWCNTs could be observed, indicating that the MWCNTs were randomly oriented in the BOPE matrix after simultaneous biaxial stretching. Unfortunately, the micro-cracks circled in the figure formed due to biaxial stretching also increased correspondingly with the increase of the drawing ratio, which would have an impact on the performance of the composite films.
Thermal analyses
The melting and crystallization behavior of the BOPE/MWCNT composite films were investigated by DSC. The relevant thermal parameters obtained from the heating and cooling stages are given in Fig. 7 and Table 2. As shown in Table 2, it is that with the addition of MWCNTs, the crystallization temperature, crystallinity, and melting point of the films were increased compared to pure BOPE. However, the crystallinity of the composite decreased as the mass fraction of MWCNTs increased. MWCNTs as nano-fillers usually have heterogeneous nucleation effects on BOPE during crystallization. Therefore, the addition of certain content of MWCNTs could improve the crystallization temperature and crystallinity of the composites. However, new interactions between BOPE and MWCNTs may arise during the growth process of BOPE molecular chain movement and regular exclusion into the lattice. For example, BOPE has a repulsive effect on MWCNTs, a new interface is formed between MWCNTs and BOPE, resulting in the BOPE chain segment engulfing MWCNTs. Therefore, when the MWCNTs content reaches a certain value, the crystallization rate and crystallinity of the composites may be reduced. In general, the change in melting point follows the same trend as the change in crystallinity. Both the melting point and the crystallinity of the composites tended to increase first and then decrease, which is the same as the above analysis.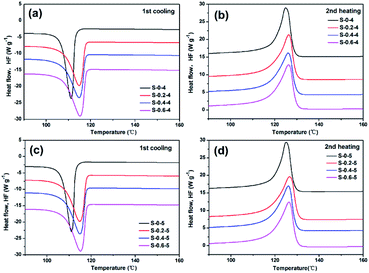 | ||
| Fig. 7 Thermal analysis of the BOPE/MWCNT composite films with different MWCNTs contents at different drawing ratios from DSC: (a) and (c) endothermic flow; (b) and (d) exothermic flow. | ||
| Samples | Tm (°C) | Tc (°C) | ΔHm (J g−1) | Xc (%) |
|---|---|---|---|---|
| S-0-4 | 125.04 | 111.25 | 73.95 | 25.19 |
| S-0.2-4 | 126.37 | 114.88 | 76.16 | 25.99 |
| S-0.4-4 | 126.06 | 114.89 | 73.78 | 25.23 |
| S-0.6-4 | 126.28 | 115.26 | 74.42 | 25.50 |
| S-0-5 | 125.11 | 111.15 | 73.28 | 24.96 |
| S-0.2-5 | 126.59 | 114.88 | 77.26 | 26.37 |
| S-0.4-5 | 126.10 | 115.00 | 74.36 | 25.43 |
| S-0.6-5 | 126.34 | 115.23 | 74.90 | 25.66 |
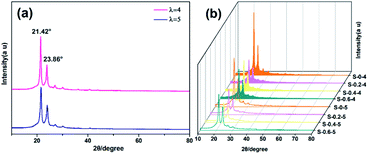
As shown in Fig. 8(a), there were two obvious diffraction peaks at 21.42° and 23.86° respectively, which were corresponding to the (110) and (200) crystal plane diffraction of LDPE crystals.41 The intensities decreased with the increase of drawing ratio, which indicated that the crystal content becomes less. The results were agreed with the DSC measurements, as shown in Table 2. For the immiscible blend systems, the drawing ratio, drawing speed and applied temperature are treated as the three dominant factors affecting the performance improvement of biaxial stretching. The diffraction peak intensity decreased with the increase of drawing ratio, which implied a decreased degree of the crystal grain. An overview of the XRD patterns for all the samples was illustrated in Fig. 8(b). It could be seen from the figure that the positions of the two peaks have not been changed, indicating that the addition of MWCNTs filler did not change the crystalline shape of BOPE. Due to the generally low intensity of the MWCNTs (002) diffraction peak and the relatively high crystallinity of BOPE, as well as the relatively low MWCNTs addition content, no peak presence was observed at its XRD characteristic diffraction peak position (2θ = 26°).
The structure of BOPE films and BOPE/MWCNT blend films was further confirmed by FTIR, as given in Fig. 9(a) and (b). The peaks at 2925 cm−1, 2847 cm−1, 1472 cm−1, 716 cm−1, and 732 cm−1 were –CH2– vibrations, indicating that the material is BOPE. The peaks at 2925 cm−1 and 2847 cm−1 corresponded to –CH2– asymmetric stretching vibration and –CH2– symmetric stretching vibration. Meanwhile, the peaks at 1472 cm−1 corresponded to –CH2– bending vibration. In crystalline polyethylene, the absorption peak at 720 cm−1 splits into double peaks, which were at 732 cm−1 and 716 cm−1 in Fig. 9(a). As shown in Fig. 9(b), the position and intensity of the infrared peaks do not change significantly due to the increase of the drawing ratio.
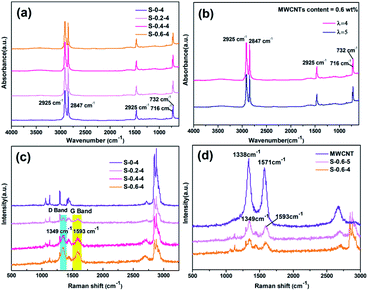 | ||
| Fig. 9 (a) and (b) FTIR and (c) and (d) Raman spectra for BOPE/MWCNT composite films with different MWCNTs contents and drawing ratios. | ||
In order to identify MWCNTs nano-fillers, evaluate their dispersion in polymers and polymer/nano-filler interactions, Raman spectroscopy was used for the characterization of polymer nanocomposites.42 The Raman spectra of the biaxially oriented composite films with increasing mass fraction of MWCNTs were shown in Fig. 9(c) and (d). It was clearly observed in Fig. 9(c) that for the BOPE/MWCNT composite films with increased MWCNTs content, the D band (1349 cm−1) obtained from the disordered graphite structure and the G band (1593 cm−1) obtained from the in-plane vibration of the C–C bond were significantly enhanced. Furthermore, the G band shifted from 1571 cm−1 to a higher wavenumber (1593 cm−1) after stretching. The Raman comparison plots of pure MWCNTs and BOPE/MWCNT composites with different drawing ratios were shown in Fig. 9(d) which indicated that the interfacial interaction between the polymer matrix and MWCNTs was improved due to the stronger compressive forces associated with the polymer chains or microcrystals on MWCNTs.43 Moreover, it could be seen in Fig. 9(d), the D band (1349 cm−1) obtained from the disordered graphite structure and the G band (1593 cm−1) obtained from the in-plane vibration of the C–C bond were slightly enhanced as the drawing ratio of the BOPE/MWCNT composite film increased. The increase in the intensity of these two peaks may be attributed to the increase in the drawing ratio as the stretching process proceeds, the more uniform dispersion of MWCNTs in the matrix, and the increase in the degree of separation of the formed network structure, which was consistent with the SEM results.
Breakdown strength and energy storage performances
Breakdown strength is used as an important parameter of dielectric materials to avoid short circuits during the use of the material. The dielectric breakdown strength for the BOPE and BOPE/MWCNT composite films were studied using Weibull analysis according to following formula:| P(E) = 1 − exp(−Ei/Eb)β | (3) |
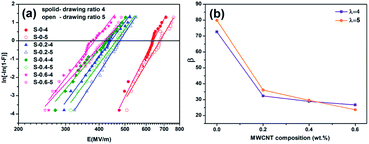
From the Weibull plots in Fig. 10, both breakdown strength (Eb) at 63.2% failure probability (Fig. 10(a)) and slope β (Fig. 10(b)) could be obtained. The Eb were 635, 438, 426 and 380 MV m−1 at 0%, 0.2%, 0.4% and 0.6% MWCNT filler mass fraction when the drawing ratio was 4 × 4, respectively. And Eb were 679, 479, 466 and 423 MV m−1 at filler mass fractions of 0%, 0.2%, 0.4% and 0.6% when the drawing ratio was increased to 5 × 5. The breakdown strength was higher for films with larger drawing ratio for the same MWCNTs content. The reason for the energy loss was the increase of dielectric loss of the composite films due to the formation of small aggregated clusters when the fillers were not well dispersed, and the loss of part of the electrical energy into heat due to the heating of the material under the action of the applied electric field. The breakdown strength was reduced because the stable state of heat generation and the heat dissipation balance was broken as heat was generated to increase the temperature. And the micro cracks, cavities and other defects were formed after biaxial stretching between the fillers and the polymer matrix. The corresponding conductive channel was formed and breakdown which also decreased the breakdown strength under the action of certain applied voltage. Therefore, the breakdown strength of BOPE/MWCNT composite films decreases with the increase of MWCNTs content. Although the defects of the film increased when the drawing ratio increased, the dispersion of the filler became significantly better, and the overall deformation was a slight increase in breakdown strength.
The shape parameter β in the Weibull analysis is related to the quality of the sample and the preparation process conditions. The higher the stability of the material with the dispersion of the measured breakdown field strength data is smaller when the value of the shape parameter is larger. As can be seen from Fig. 10(b) that a gradually decreasing trend was shown with the filler content increased to 0.6 wt% which indicated that the stability of the material was reduced.
The dielectric loss is extremely low and the charge–discharge efficiency is high for polyethylene because of its extremely regular structure as the a non-polar polymer. The theoretical energy storage density of linear polymer dielectrics can be calculated by the following eqn (4) because their dielectric constant is stable in the frequency variation range of the external electric field:
 | (4) |
 | (5) |
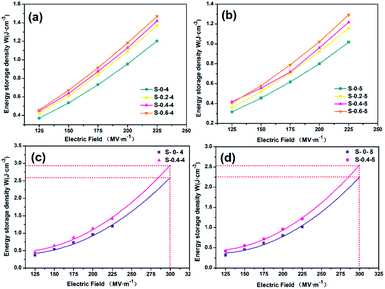
The actual values of the energy storage density of the materials in this paper were calculated based on the integration of the D–E loops measured by the experimental apparatus, and the energy storage density curves of BOPE and BOPE/MWCNT composite films were shown in Fig. 11(a) and (b). The energy storage density of the composite films increased from 1.20 J cm−3 to 1.41 J cm−3 under 225 MV m−1 electric fields at an MWCNTs content of 0.6 wt% and a drawing ratio of 4 × 4. When the drawing ratio increased to 5 × 5, the energy storage density increased from 1.01 J cm−3 to 1.29 J cm−3 with an increase of 27.7%. Also, the energy storage density of the composite films with different MWCNTs content was lower than that of the drawing ratio of 4 × 4 at a drawing ratio of 5 × 5 due to the decrease in dielectric constant with increasing drawing ratio. The energy storage density could not be measured at the subsequent electric field strength due to the range of the instrument. Therefore, the results were obtained by estimating the original values. As shown in Fig. 11(c) and (d), the actual measured energy storage density curves were fitted and extended to calculate the energy storage density at the corresponding electric field strength. Under an electric field of 300 MV m−1, the energy storage density of the composite film with a drawing ratio of 4 × 4 and MWCNT content of 0.4% was 2.90 J cm−3, which was a great improvement over the 2.57 J cm−3 of the BOPE film. The energy storage density of the composite film was also increased from 2.22 J cm−3 to 2.54 J cm−3 at a tensile ratio of 5 × 5. The larger the dielectric constant, the larger the capacitance and the more energy it can store. The breakdown strength is also an important factor in determining the magnitude of the energy storage density. To improve the energy storage density of film materials, the dielectric constant and breakdown strength should be considered together.
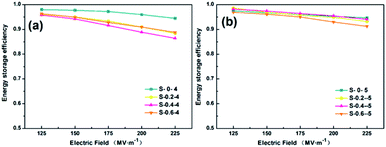
The high energy storage efficiency of the dielectric means less energy loss, better reliability and longer capacitor life. Comparing the energy storage efficiency of the films in Fig. 12(a) and (b), the energy storage efficiency of the materials was around 90% which was slightly reduced after adding MWCNTs. The high energy storage efficiency of the composite film also leads to a fast charging and discharging rate of the dielectric capacitor, thus ensuring the instantaneous high power of the capacitor. In conclusion, the BOPE films modified by adding MWCNTs not only further improve the energy storage density but also maintain high energy storage efficiency.
Conclusions
In this paper, a series of BOPE/MWCNT composite films were prepared using biaxially oriented technique to solve the problems of non-uniform nano-filler dispersion and low dielectric constant of PE films. The thin and uniform thickness BOPE/MWCNT composite films were prepared by biaxially stretching and were obtained high dielectric constant and energy storage density. Meanwhile, the relationship between filler dispersion and dielectric energy storage properties in the BOPE/MWCNT system was revealed. The incorporation of trace amounts of MWCNTs led to an increase in the dielectric constant of the material. The dispersion of the filler became better with an increased drawing ratio leading to a relatively higher Eb. However, defects such as micro-cracks due to biaxial orientation caused a slight decrease in the dielectric constant. Therefore, the energy storage density of BOPE/MWCNT films had a significant advantage over other PE films. This work is expected to deepen the understanding of the relationship between filler dispersion and energy storage properties in biaxially oriented dielectric films. Also note that although this work provided a scalable approach to fabricate high-performance capacitive material, the effect of breakdown properties of nanocomposites remained an issue. In future work, we will try to modify BOPE films using methods such as plasma and other surface treatments to improve the dielectric properties while maintaining high breakdown strength.Author contributions
Meihan Li: writing – original draft, review & editing, investigation, visualization. Guangsheng Shi: writing – conceptualization, methodology. Qiang Feng: investigation. Jiang Li: supervision, project administration. Jie Zhang: writing – review & editing. Shaoyun Guo: project administration, funding acquisition.Conflicts of interest
There are no conflicts to declare.Acknowledgements
The authors are grateful to the National Natural Science Foundation of China (51873112) for financial support of this work. It was also supported by DOW.References
- S. A. Sherrill, P. Banerjee, G. W. Rubloff and S. B. Lee, Phys. Chem. Chem. Phys., 2011, 13, 20714–20723 RSC.
- Z.-M. Dang, J.-K. Yuan, J.-W. Zha, T. Zhou, S.-T. Li and G.-H. Hu, Prog. Mater. Sci., 2012, 57, 660–723 CrossRef CAS.
- Z. Yao, Z. Song, H. Hao, Z. Yu, M. Cao, S. Zhang, M. T. Lanagan and H. Liu, Adv. Mater., 2017, 29(20), 1601727 CrossRef.
- Q. Li, F.-Z. Yao, Y. Liu, G. Zhang, H. Wang and Q. Wang, in Annual Review of Materials Research, ed. D. R. Clarke, 2018, vol. 48, pp. 219–243 Search PubMed.
- W. J. Sarjeant, I. W. Clelland and R. A. Price, Proc. IEEE, 2001, 89, 846–855 CrossRef CAS.
- H. Bluhm and D. Rusch, Pulsed Power Systems: Principles and Applications, Springer, Berlin, 2006 Search PubMed.
- J.-K. Yuan, S.-H. Yao, Z.-M. Dang, A. Sylvestre, M. Genestoux and J. Bai, J. Phys. Chem. C, 2011, 115, 5515–5521 CrossRef CAS.
- H.-P. Xu and Z.-M. Dang, Chem. Phys. Lett., 2007, 438, 196–202 CrossRef CAS.
- L. Zhu and Q. Wang, Macromolecules, 2012, 45, 2937–2954 CrossRef CAS.
- Prateek, V. K. Thakur and R. K. Gupta, Chem. Rev., 2016, 116, 4260–4317 CrossRef CAS PubMed.
- T.-I. Yang and P. Kofinas, Polymer, 2007, 48, 791–798 CrossRef CAS.
- Q. Chi, T. Ma, Y. Zhang, Y. Cui, C. Zhang, J. Lin, X. Wang and Q. Lei, J. Mater. Chem. A, 2017, 5, 16757–16766 RSC.
- M. Fang, K. Wang, H. Lu, Y. Yang and S. Nutt, J. Mater. Chem., 2009, 19, 7098–7105 RSC.
- X. Yang, Y. Zeng, T. Cai and Z. Hu, Appl. Surf. Sci., 2012, 258, 7365–7371 CrossRef.
- L. Liu, J. Qu, A. Gu and B. Wang, J. Mater. Chem. A, 2020, 8, 18515–18537 RSC.
- K. Suematsu, M. Arimura, N. Uchiyama, S. Saita and T. Makino, Composites, Part B, 2016, 104, 80–86 CrossRef CAS.
- X. Kuang, Z. Liu and H. Zhu, J. Appl. Polym. Sci., 2013, 129, 3411–3416 CrossRef CAS.
- Z.-M. Dang, H.-P. Xu, D. Xie and L. Li, Mater. Lett., 2007, 61, 511–515 CrossRef CAS.
- Z.-M. Dang, B. Peng, D. Xie, S.-H. Yao, M.-J. Jiang and J. Bai, Appl. Phys. Lett., 2008, 92, 112910 CrossRef.
- L. Chu, Q. Xue, J. Sun, F. Xia, W. Xing, D. Xia and M. Dong, Compos. Sci. Technol., 2013, 86, 70–75 CrossRef CAS.
- Y. Yao, N. Ning, L. Zhang, T. Nishi and M. Tian, RSC Adv., 2015, 5, 23719–23726 RSC.
- X.-l. Xu, C.-j. Yang, J.-h. Yang, T. Huang, N. Zhang, Y. Wang and Z.-w. Zhou, Composites, Part B, 2017, 109, 91–100 CrossRef CAS.
- F. Chen, Y. Zhou, J. Guo, S. Sun, Y. Zhao, Y. Yang and J. Xu, RSC Adv., 2020, 10, 2295–2302 RSC.
- M. Panda, V. Srinivas and A. K. Thakur, Appl. Phys. Lett., 2008, 93(24), 072902 CrossRef.
- J. Tao and S.-a. Cao, RSC Adv., 2020, 10, 10799–10805 RSC.
- Z.-M. Dang, L. Wang, Y. Yin, Q. Zhang and Q.-Q. Lei, Adv. Mater., 2010, 19(6), 852–857 CrossRef.
- L. Wang and Z. M. Dang, Appl. Phys. Lett., 2005, 87(4), 284 CrossRef.
- C. Otto, U. A. Handge, P. Georgopanos, O. Aschenbrenner, J. Kerwitz, C. Abetz, A.-L. Metze and V. Abetz, Macromol. Mater. Eng., 2016, 302(4), 1600405 CrossRef.
- Z. Zhou, S. Wang, Y. Zhang and Y. Zhang, J. Appl. Polym. Sci., 2006, 102, 4823–4830 CrossRef CAS.
- C. L. Poh, M. Mariatti, A. F. M. Noor, O. Sidek, T. P. Chuah and S. C. Chow, Composites, Part B, 2016, 85, 50–58 CrossRef CAS.
- K. Xiao, Y. Q. Liu, P. A. Hu, G. Yu, Y. M. Sun and D. B. Zhu, J. Am. Chem. Soc., 2005, 127, 8614–8617 CrossRef CAS.
- Y. W. Zhu, F. C. Cheong, T. Yu, X. J. Xu, C. T. Lim, J. T. L. Thong, Z. X. Shen, C. K. Ong, Y. J. Liu, A. T. S. Wee and C. H. Sow, Carbon, 2005, 43, 395–400 CrossRef CAS.
- J. Zhu, X. Ji, M. Yin, S. Guo and J. Shen, Compos. Sci. Technol., 2017, 144, 79–88 CrossRef CAS.
- D. Xiang, L. Wang, Q. Zhang, B. Chen, Y. Li and E. Harkin-Jones, Polym. Compos., 2018, 39, E909–E923 CrossRef CAS.
- J. Ho, R. Ramprasad and S. Boggs, IEEE Trans. Dielectr. Electr. Insul., 2007, 14, 1295–1301 CAS.
- R. Fab, K. H. Kochem and K. Muller-Nagel, Electron. Inf. Plann., 2000, 28, 103–109 Search PubMed.
- J. Ho and T. R. Jow, IEEE Trans. Dielectr. Electr. Insul., 2012, 19, 990–995 CAS.
- T. Zhu, C. Qian, W. Zheng, R. Bei, S. Liu, Z. Chi, X. Chen, Y. Zhang and J. Xu, RSC Adv., 2018, 8, 10522–10531 RSC.
- F. M. Mirabella and A. Bafna, J. Polym. Sci., Part B: Polym. Phys., 2002, 40, 1637–1643 CrossRef CAS.
- Y. Xia, J. Chen, Z. Zhu, Q. Zhang, H. Yang and Q. Wang, RSC Adv., 2018, 8, 4032–4038 RSC.
- L. Cui, H. Y. Cho, J.-W. Shin, N. H. Tarte and S. I. Woo, Macromol. Symp., 2007,(260), 49–57 CrossRef CAS.
- E. Logakis, E. Pollatos, C. Pandis, V. Peoglos, I. Zuburtikudis, C. G. Delides, A. Vatalis, M. Gjoka, E. Syskakis, K. Viras and P. Pissis, Compos. Sci. Technol., 2010, 70, 328–335 CrossRef CAS.
- C. McClory, T. McNally, M. Baxendale, P. Poetschke, W. Blau and M. Ruether, Eur. Polym. J., 2010, 46, 854–868 CrossRef CAS.
Footnote |
| † Electronic supplementary information (ESI) available. See DOI: 10.1039/d1ra08031h |
| This journal is © The Royal Society of Chemistry 2021 |

