
 Open Access Article
 This Open Access Article is licensed under a Creative Commons Attribution-Non Commercial 3.0 Unported Licence
Stick, stretch, and scan imaging method for DNA and filaments†
Qiuling Zeng‡
 a,
Yuanyuan Gao‡a,
Hong Yu‡a,
Wei Zhub,
Qi Wangcd,
Quan Longa,
Zhuo Fana and
Botao Xiao*ab
a,
Yuanyuan Gao‡a,
Hong Yu‡a,
Wei Zhub,
Qi Wangcd,
Quan Longa,
Zhuo Fana and
Botao Xiao*ab
aGuangdong Provincial Key Laboratory of Fermentation and Enzyme Engineering, School of Biology and Biological Engineering, South China University of Technology, Guangzhou, 510006, China. E-mail: xiaob@scut.edu.cn; botaoshaw@hotmail.com
bJoint International Research Laboratory of Synthetic Biology and Medicine, School of Biology and Biological Engineering, South China University of Technology, Guangzhou, 510006, China
cArtemisinin Research Center, Guangzhou University of Chinese Medicine, Guangzhou, Guangdong 510405, China
dInstitute of Science and Technology, Guangzhou University of Chinese Medicine, Guangzhou, Guangdong 510006, China
First published on 9th November 2021
Abstract
Biomolecules and organelles usually undergo changes to their structure or form as a result of mechanical stretching or stimulation. It is critical to be able to observe these changes and responses, which trigger mechano-chemical coupling or signal transduction. Advanced techniques have been developed to observe structure and form during manipulation; however, these require sophisticated methods. We have developed a simple approach to observe fine structure after stretching without fluorophore labeling. DNAs or molecules on the cell surface were bound to magnetic microbeads, followed by stretching with a magnetic field. After fixing, staining, and drying, the samples were examined by scanning electron microscopy with no need to build a functional surface with complex processes. Straight DNAs were observed rather than random-walk-like loose polymers. In our cellular experiment, the magnetic beads were bound to a Jurkat cell and formed a rosette which was later stuck to the substrate. A 41.3 μm filament on the base of a filopodium was pulled out via integrin from a cell. Therefore, our method can reveal long structures up to hundreds of micrometers at nanometer resolution after stretching or twisting. Our approach could have wide applications in structure–function studies of biomolecules, and in mechanobiology and cell biology when diffraction cannot used.
1. Introduction
The structure and form of biomolecules usually undergo changes after mechanical stimulation such as stretching or twisting.1–3 The mechanical characteristics and dynamics of these molecules have been extensively reported. For example, RNA polymerase can generate force and torque, which regulate the transcription rate and can even stall transcription.4,5 Significant alterations in DNA topology can be driven by topoisomerases and site-specific DNA recombinases.6Single-molecule techniques, including magnetic tweezers and optical tweezers, have been used to manipulate molecules to directly measure their mechanical properties and their interactions with other molecules.7 However, the data-throughput rate of these high-resolution methods is relatively limited, as only one molecule is generally processed in a single experiment. Recently developed high-throughput techniques usually require sophisticated methods and setup. New methods are needed that can optimize sample manipulation and directly image molecules. Mechanical stimuli have been observed to deform living cells,8,9 trigger molecular pathways in the cytoplasm, and even affect gene transduction in the nucleus.10 The known force sensors on the cell surface include integrins, a family of heterodimeric receptors that respond to shear stress, tensile force, and ligands, inducing conformational changes11,12 and mediating intracellular and extracellular signaling pathways.13 The RGD (arginine–glycine–aspartate) peptide is well known as the minimal recognition sequence in fibronectin that can bind specifically to eight integrins including α5β1.14
Numerous questions need to be answered about the living cell. For instance, filopodia on the surfaces of T cells are membrane organelles that can form immune synaptosomes and act as carriers to provide relevant information to antigen-presenting cells.15 Filopodia mediate the initial rolling phase of lymphocyte extravasation.16,17 Jurkat cells are an immortalized line of human T-cells that express α4 integrin, α5 integrin, and β1 integrin. Jurkat cells deform into round, rough, or amoeba-like shapes when they adhere to a cell layer or a tumor cell matrix.18 The adhesion of filopodia to the extracellular matrix is mediated by the integrin family. Filopodia grow via actin polymerization at the tip, and the application of pulling forces at the filopodia tips led to sustained growth of filopodia in an experiment using optical tweezers.19 Questions include how far a filament can extend from the base of filopodium, and how the downstream molecules coordinate with each other to regulate cellular activities. The answers depend on manipulation and observation in a wide field at high (nanometer) resolution.
Various techniques have been developed to study the mechanical responses of cells, including flow chambers, organs-on-chips,20,21 magnetic twisting cytometry,22 and micropipette aspiration.23 Scanning electron microscopy (SEM) is widely used to observe materials and cells and is a vital analytical tool. It examines millimeter-scale samples without labeling at a resolution of tens of nanometers.24,25 SEM imaging is highly sensitive to small variations in surface composition, which may provide qualitative and quantitative information about DNA samples.26,27
We previously described a method to “stick and scan” a protein nanofiber.28 The ends of single nanofibers were stuck to magnetic beads and a glass slide using a tag-free method. The stretched fibers were fixed and observed by SEM. In the current study, we expand this stick and scan method to observe DNA and a whole cell. We used a magnet to stretch the tethered DNA and prepare the sample for SEM imaging. Our method does not require fluorescent probe labeling or complex single-molecule operations. The effective sample area ranges from microns to millimeters, indicating that this is a multiscale method suitable for analysis of a large quantity of molecules. Furthermore, a cell was crosslinked to magnetic beads and the glass substrate. Through peptide GRGDNP binding, some filopodia were extended by 3–5 times the cell diameter and acquired a rope-like shape due to the pulling force, and showed surprising elastic capability. This rosette stretching approach enables live manipulation of cells with precise force and duration under light microscopy. This approach also reveals structure at nanometer resolution for a large number of cells in a millimeter-sized sample under SEM.
2. Materials and methods
2.1 DNA constructs and stretching
We used 10 kb DNA fragments derived from 48.5 kb lambda phage DNA via PCR reactions using biotin- and digoxigenin-labeled primers.29 The labeled DNA strands were incubated and bound at one end to streptavidin-coated superparamagnetic beads of diameters 2.8 μm (Dynabeads, M280, Thermo Fisher) and 5 μm (Beaverbeads SA), and at the other end to an anti-digoxigenin-coated glass surface. The concentrations of DNAs and beads were optimized so that each bead was on average tethered to one single DNA. Phosphate-buffered saline containing 150 mM NaCl was used as the buffer solution; 0.5 mg mL−1 bovine serum albumin (BSA) was added to the buffer for some of the samples. The DNA samples were placed near N52 permanent magnets to stretch the microbeads and DNA molecules. All experiments were carried out at room temperature (∼25 °C).2.2 Rosette formation by cells and beads
Jurkat T-cells were purchased from the China Center for Type Culture Collection and cultured with 5% fetal bovine serum (Gibco Thermo Fisher, USA) in RPMI 1640 (Gibco) under 5% CO2 in an incubator (Thermo Scientific). Only cells in the logarithmic growth phase were used in these experiments. The average cell diameter was 11.5 μm, consistent with previous reports.30,31 Dynabeads M270 Amine (Thermo Fisher) were incubated with 1-(3-dimethylaminopropyl)-3-ethylcarbodiimide for 2 h to activate the amine group. The peptide GRGDNP was synthesized by a solid phase peptide synthesis method (Yuanpeptide Biotech Co. Ltd.). The beads were then incubated with 1 μM peptide, resulting in conjugation of the amine and the carboxyl group of the peptide. The beads were then washed and suspended in RPMI 1640 medium. Jurkat cells were washed with RPMI 1640 containing 10% IgG-free serum and then mixed with magnetic beads coated with polypeptides. The mixture was centrifuged at 500 rpm for 5 min, followed by incubation at 37 °C for 45 min to form rosettes (Fig. 2).322.3 Rosette stretching under light microscope
A cover glass was coated with GRGDNP polypeptide solution at 10 μg mL−1, via physical absorption overnight. The rosette mixture was gently resuspended by pipetting and placed on the cover glass. N52 permanent magnets were placed on the edge of the cover glass to apply force to the cell via the magnetic beads for 3 or 5 h under a microscope to study the cell's morphological changes (Fig. 2D).2.4 Force calibration
Superparamagnetic beads were magnetized by the external magnetic field produced by the permanent magnets. The force was proportional to the distance-derivative of the magnetic field.33 The distance–force relation for the same aliquot of beads and the same side of the N52 magnets was calibrated using λ DNA on magnetic tweezers.34,35 Briefly, one end of the 16 μm λ DNA was labeled with biotin connected to M280 magnetic beads. The other end of the DNA was labeled with digoxigenin connected to the glass slide pre-incubated with anti-digoxigenin. The force at a certain magnet position was calibrated based on the fluctuation of the tethered microbead as described.33 Therefore, the force ranged from 0.5 to 1 pN from far to near on a single bead in all of the light microscopy experiments and in the SEM sample preparation. The force on multiple beads increases with the number of beads.2.5 Scanning electron microscopy
The labeled DNA was bound to a magnetic bead of 2.8 or 5 μm in diameter and to anti-digoxigenin-coated glass. The glass was kept horizontal and the liquid sample was held on it by surface tension. The DNAs were stretched by the magnetic field. The sample was then stained with 0.25 mg mL−1 cytochrome C and 50% formamide, followed by gentle washing with pure water. The magnetic field was rotated by 90 degrees and kept steady to align the DNA molecules along the surface of the glass (Fig. 1A). | ||
| Fig. 1 DNA stretching and imaging. (A) A DNA tethered to a bead and to the glass. (B) A DNA stretched by a magnetic force perpendicular to the glass surface. (C) DNA was manipulated to lie down on the glass. (D) SEM photograph of a DNA before stretching. Left, stretched DNA with M280 DynaBeads; right, stretched DNA with BeaverBeads of 5 μm diameter. (E) SEM images of stretched DNA with M280 DynaBeads. (F) SEM photographs of stretched DNA with BeaverBeads of 5 μm diameter. | ||
Rosette samples were prepared as described for light microscopy experiments. The cover glass was kept horizontal. A permanent magnet was placed at the side of the sample and was used to pull the cell parallel to the surface of the glass. The samples were rinsed with pure water twice. Samples were then fixed with 8% glutaraldehyde and washed gently with pure water, as described in our previous report.28
The samples were dried in a desiccator. A Sputter Coater (Quorum) was used to coat a platinum film onto the glass surfaces for 60 s in the vacuum. SEM images were obtained for fine structures after stretching, using a Zeiss Merlin field-emission SEM operated at a 5 kV accelerating voltage. The images were measured using ImageJ software (National Institute of Health).
3. Results
Samples of DNA-tethered superparamagnetic beads were prepared as described in the Materials and methods sections (Fig. 1A). The beads were magnetized to have north and south poles when they were placed near permanent magnets. Many free beads stuck to each other and were aligned along straight lines in the SEM images (Fig. S1†). The lines were roughly in the direction of the magnetic field (Fig. S2†). The DNAs were pulled along the magnetic force, which was perpendicular to the field. The magnitude of the force was adjusted by controlling the distance between the sample and the permanent magnets (Fig. S3†).The DNAs were firstly stretched along the direction perpendicular to the glass in the buffer (Fig. 1B), then were rotated to be parallel (Fig. 1C). The acquired images showed that DNA molecules were pulled straight from the magnetic bead by a ∼1 pN force (Fig. 1E and F), in contrast to the loose structures of control DNA (Fig. 1D), consistent with a previous review.36 This observation was also consistent with the fact that DNAs were stretched by magnets before imaging.
Some of the DNAs were located under the beads; therefore, not all the DNA extensions could be observed. For those extensions greater than 600 nm, the end–inflexion–end arc angles were measured. The angles of 16 DNAs ranged from 160 to 180 degrees (Fig. S4 and Table S1†), i.e., they formed nearly a straight line (Fig. 1E and F). By contrast, the angles of the unstretched DNAs were all less than 160 degrees. Some of the stretched DNAs were perfectly connected between a single bead and the glass. Some DNAs were also connected between two magnetic beads (Fig. S5†), i.e., a bead was found at the end of the DNA adhered to the glass.
Although we used two types of magnetic beads with different particle sizes for the experiments, straight stretched DNA was obtained in all cases. Our SEM images successfully captured DNA that had been straightened under tension. For the DynaBeads with diameter of 2.8 μm, the average width or diameter of the DNA from three replicative measurements of eight samples was 33 ± 21 nm (Fig. 1E), about 15 times that of a single DNA (2 nm). We also used BeaverBeads with a diameter of 5 μm; 0.05% BSA was added to the buffer in some experiments. The DNA was magnified by the cytochrome C and BSA staining, and platinum/gold coating by ion splutter. This resulted in DNA with diameter 118 ± 46 nm (Fig. 1F), wider than that obtained in the case without addition of BSA. This difference in diameters was reasonable, as the staining of DNAs with cytochrome C and formamide may have added to their diameter; platinum film coating for the time could also add ∼2 nm to the diameter. Although the DNAs were all straight, there were fine differences between different cases. For instance, some of the images showed that a tether had two ends or sub-tethers. It was difficult to determine whether these represented a bundle of two DNA molecules or two DNA strands. Additional experiments are needed to distinguish between single and multiple DNAs in these cases.
The experimental results also showed that magnetic beads of different sizes resulted in different lengths of the stretched DNAs. The contour length of the 10 kb DNA was ∼3.4 μm; whereas the 2.8 μm magnetic beads could only pull out 1–2 μm of the 10 kb λ DNA; the 5.0 μm magnetic beads could pull out 2–3 μm or even the entire 10 kb λ DNA. We noted that the angle between the DNA and a small magnetic bead was small enough that a section of DNA lay on the bottom plate and was invisible. However, when a larger-diameter bead was used, the angle formed between the DNA and the bottom plate was large enough to allow longer DNAs to “hang” in the air; these could be photographed by SEM.
In our cellular experiment, a GRGDNP peptide was coated onto the magnetic beads, which were bound to Jurkat cells and formed rosettes, as described in the Materials and methods section (Fig. 2A–D). Under a light microscope, one end of the cell was attached to the cover glass coated with the polypeptide. When the magnetic field was applied, many microbeads aligned in a straight line along the direction of the magnetic field (Fig. 3B and C). The cell that was bound to these beads responded slowly to the magnetic force. The force applied by a single bead was ∼1 pN as determined by the distance (Fig. S3†). The force applied by multiple beads was higher than that exerted by a single bead. Some Jurkat cells were “crawling” and were guided by the magnetic force on the peptide-coated glass. After approximately 120 min, drastic deformation of the cells was observed (Fig. 3C). The filopodia on the cell extended along the direction of the pulling beads under the effects of the magnetic field, although the fine structures of the filopodia were not clear owing to the lack of labeling and the limited resolution of light microscopy. These results suggest that the peptide bound strongly to filopodia on the cells.
 | ||
| Fig. 2 Steps for stretching cells via magnetic beads. (A) The magnetic beads were conjugated to peptides. (B) The bead and the cell formed a rosette during centrifugation. (C) The rosette was placed on peptide-coated glass and (D) stretched using permanent magnets. | ||
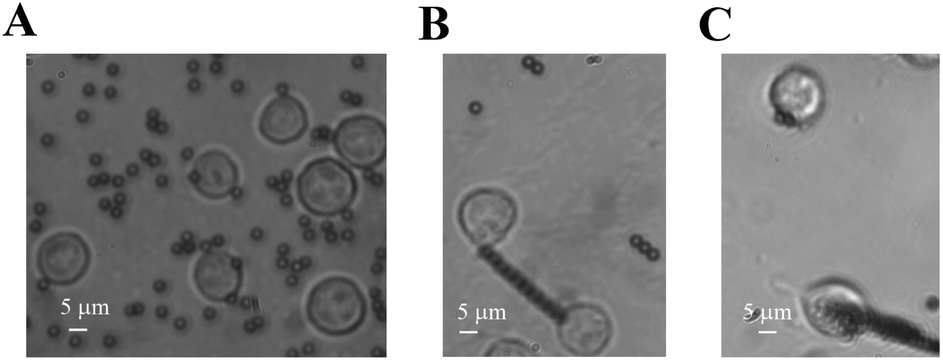 | ||
| Fig. 3 Rosette stretching under light microscope. Jurkat cells were bound to microbeads (A). Filopodia was stretched by the beads in the magnetic field for 2 h (B and C). The beads were aligned along the magnetic field. | ||
A Jurkat cell expressing integrin was bound to a magnetic bead and cover glass, which were both coated with the peptide GRGDNP. To further study the effects of peptide binding on the cell, we performed SEM experiments to visualize the fine stretched structures that formed between cells and microbeads after stretching. The rosette samples were stretched for 180 or 300 min, washed, fixed, coated with platinum film, and observed by SEM. When Jurkat cells were incubated with GRGDNP-coated beads and stretched by a force of approximately 1 pN for 5 h, the filopodia became straight and had a rope-like appearance (Fig. 4A and B). The longest filament was measured at 41.3 μm after stretching. Some amoeba-like cells were observed (Fig. 4C and D). By contrast, free, unbound Jurkat T-cells were round and contained many curved filopodia (Fig. 4G). The extensions of the filopodia were measured using ImageJ software. The filopodia extensions of free Jurkat T-cells were shorter than 15 μm. Jurkat cells that were bound to beads but not stretched by the magnetic force were also rounded (Fig. 4E and F). Multiple filopodia were found to attach to a single magnetic bead or to multiple beads.
 | ||
| Fig. 4 Fine structures observed by SEM. (A–D) Elongated filopodia were observed when the GRGDNP-coated bead was stretched by magnetic force for 5 h. The extension and thickness of the stretched filopodia varied. (E and F) A Jurkat cell was bound to beads coated with GRGDNP, without magnetic force, as a control. (G) A Jurkat cell was bound to the glass cover, without magnetic beads, as a control. | ||
4. Discussion
We have developed a simple but efficient stick, stretch, and scan SEM imaging method for DNA and cell study. It is based on our previous study involving protein fibers.28 This method allows us to observe a wide scope of stretched structures with high precision without the need to build a complex functional surface.19,20 Twist or torque may be further added to the tether as the magnets rotate. This is a good supplement to advanced techniques such as combinations of optical tweezers and fluorescence resonance energy transfer,37,38 or X-ray diffraction.39The rosette-stretching SEM approach demonstrated the formation of long filopodia from the cell with relatively high resolution. The cells were stretched, fixed, and directly observed by SEM. Some filopodia were extended by 3–5 times the cell diameter and acquired a rope-like shape after the treatments, and showed surprising elastic capability. When a cell senses an external force, cellular signaling pathways are triggered, and information is transmitted. A previous study demonstrated that the application of a magnetic force to cells, through the use of magnetic beads coated with an integrin ligand, would rapidly translate into changes in the actin filament.19 Here, we applied a large force and captured the whole picture of the stretched long filopodia. A fluorophore or tag is typically necessary to visualize this type of change; however, our approach does not require the use of a fluorophore or tag. As peptides can be promptly synthesized, this approach is easily adaptable to any peptide-binding protein and could be applied to reveal in-depth information regarding cellular activity.
We admit that the sample went through artificial treatment during the normal SEM process. Glutaraldehyde was used to fix the sample which reacted with the molecules without change the form of the cell. Platinum or gold film also cover the sample which made the filopodia thicker than themselves. These artificial effects were inherent character of the SEM itself. In contrast, fluorescent based method can reveal in situ unbiased information. After all, our method is good enough for lots of research subjects. As SEM is a popular instrument, our approach is easily available.
Filopodia have been reported to extend during Jurkat T-cell migration.40,41 Single T-cell contacts with antigen-presenting cells occur through microvillar extensions, which appear to serve as locations for the sequestration of immunologically important molecules, including T-cell receptor complexes, costimulatory and adhesion molecules, and various cytokines.42 For example, the binding of integrin on filopodia may promote the activation of T-cell receptors. In this study, when a magnetic force was applied to the beads attached to the cell, some of the beads were pulled away from the cell. The stretching that occurred via the GRGDNP molecules extended the filopodia to as long as tens of microns, which deformed the whole cell and probably triggered downstream signal transduction. Extended filopodia may have a high probability of fracture. Although most of the beads were bound to the top of the filopodia, some were also bound to the middle of the filopodia, possibly owing to movements of the beads during the stretching and unloading of the magnetic force before SEM observations. This effect may also have been due to non-uniform distribution of integrins on the cell surface. The force signal may be transduced outside-in and transferred to chemical signals through signaling molecules, such as talin and kindlins, which may lead to rearrangements of actin in the cytoskeleton.11 These downstream molecular pathways may be studied in the future.
Author contributions
Qiuling Zeng: conceptualization, formal analysis, investigation, writing. Yuanyuan Gao: investigation, data curation. Hong Yu: investigation, data curation. Wei Zhu: methodology, data curation, supervision. Qi Wang: methodology, supervision. Quan Long: investigation, data curation. Zhuo Fan: methodology, resources. Botao Xiao: conceptualization, investigation, methodology, writing-reviewing and editing, supervision. All authors have given approval to the final version of the manuscript.Conflicts of interest
There are no conflicts to declare.Acknowledgements
This work was supported by the National Natural Science Foundation of China [11772133]; Double First-Class University Plan [x2sw-k5183480].References
- C. Bustamante, Z. Bryant and S. B. Smith, Nature, 2003, 421, 423–427 CrossRef PubMed
.
- X. Dong, B. Zhao, R. E. Iacob, J. Zhu, A. C. Koksal, C. Lu, J. R. Engen and T. A. Springer, Nature, 2017, 542, 55–59 CrossRef CAS PubMed
- H. Fu, Y. Jiang, D. Yang, F. Scheiflinger, W. P. Wong and T. A. Springer, Nat. Commun., 2017, 81, 324 CrossRef PubMed
- J. Ma, L. Bai and M. D. Wang, Science, 2013, 340, 1580–1583 CrossRef CAS PubMed
- M. D. Wang, M. J. Schnitzer, H. Yin, R. Landick, J. Gelles and S. M. Block, Science, 1998, 282, 902–907 CrossRef CAS PubMed
- Y. Harada, T. Funatsu, K. Murakami, Y. Nonoyama, A. Ishihama and T. Yanagida, Biophys. J., 1999, 76, 709–715 CrossRef CAS PubMed
- K. C. Neuman and A. Nagy, Nat. Methods, 2008, 5, 491–505 CrossRef CAS PubMed
- J. Chen, Interface Focus, 2014, 4, 20130055 CrossRef PubMed
- R. M. Lee, H. Yue, W.-J. Rappel and W. Losert, J. R. Soc. Interface, 2017, 14, 20170147 CrossRef PubMed
- F. Wei, X. Xu, C. Zhang, Y. Liao, B. Ji and N. Wang, Nat. Commun., 2020, 11, 4902 CrossRef CAS PubMed
- X.-Y. Tang, Y.-F. Li and S.-M. Tan, J. Immunol., 2008, 180, 4793–4804 CrossRef CAS PubMed
- W. Chen, J. Lou, E. A. Evans and C. Zhu, J. Cell Biol., 2012, 199, 497–512 CrossRef CAS PubMed
- B.-H. Luo, C. V. Carman and T. A. Springer, Annu. Rev. Immunol., 2007, 25, 619–647 CrossRef CAS PubMed
- M. Moser, K. R. Legate, R. Zent and R. Faessler, Science, 2009, 324, 895–899 CrossRef CAS PubMed
- H.-R. Kim, Y. Mun, K.-S. Lee, Y.-J. Park, J.-S. Park, J.-H. Park, B.-N. Jeon, C.-H. Kim, Y. Jun, Y.-M. Hyun, M. Kim, S.-M. Lee, C.-S. Park, S.-H. Im and C.-D. Jun, Nat. Commun., 2018, 9, 3630 CrossRef PubMed
- U. H. von Andrian, S. R. Hasslen, R. D. Nelson, S. L. Erlandsen and E. C. Butcher, Cell, 1995, 82, 989–999 CrossRef CAS PubMed
- Y. Jung, I. Riven, S. W. Feigelson, E. Kartvelishvily, K. Tohya, M. Miyasaka, R. Alon and G. Haran, Proc. Natl. Acad. Sci. U. S. A., 2016, 113, E5916–E5924 CrossRef CAS PubMed
- J.-Y. Huang, Y.-J. Cheng, Y.-P. Lin, H.-C. Lin, C.-C. Su, R. Juliano and B.-C. Yang, J. Immunol., 2010, 185, 1450–1459 CrossRef CAS PubMed
- N. O. Alieva, A. K. Efremov, S. Hu, D. Oh, Z. Chen, M. Natarajan, H. T. Ong, A. Jegou, G. Romet-Lemonne, J. T. Groves, M. P. Sheetz, J. Yan and A. D. Bershadsky, Nat. Commun., 2019, 10, 3593 CrossRef CAS PubMed
- D. Huh, B. D. Matthews, A. Mammoto, M. Montoya-Zavala, H. Y. Hsin and D. E. Ingber, Science, 2010, 328, 1662–1668 CrossRef CAS PubMed
- S. Jalili-Firoozinezhad, F. S. Gazzaniga, E. L. Calamari, D. M. Camacho, C. W. Fadel, A. Bein, B. Swenor, B. Nestor, M. J. Cronce, A. Tovaglieri, O. Levy, K. E. Gregory, D. T. Breault, J. M. S. Cabral, D. L. Kasper, R. Novak and D. E. Ingber, Nat. Biomed. Eng., 2019, 3, 520–531 CrossRef CAS PubMed
- N. Wang, J. P. Butler and D. E. Ingber, Science, 1993, 260, 1124–1127 CrossRef CAS PubMed
- B.-H. Ji and B. Huo, Acta Mech. Sin., 2013, 29, 469–484 CrossRef CAS
- F. Gentile, M. Moretti, T. Limongi, A. Falqui, G. Bertoni, A. Scarpellini, S. Santoriello, L. Maragliano, R. P. Zaccaria and E. di Fabrizio, Nano Lett., 2012, 12, 6453–6458 CrossRef CAS PubMed
- F. De Angelis, F. Gentile, F. Mecarini, G. Das, M. Moretti, P. Candeloro, M. L. Coluccio, G. Cojoc, A. Accardo, C. Liberale, R. P. Zaccaria, G. Perozziello, L. Tirinato, A. Toma, G. Cuda, R. Cingolani and E. Di Fabrizio, Nat. Photonics, 2011, 5, 683–688 CrossRef
- C. Srinivasan, T. J. Mullen, J. N. Hohman, M. E. Anderson, A. A. Dameron, A. M. Andrews, E. C. Dickey, M. W. Horn and P. S. Weiss, ACS Nano, 2007, 1, 191–201 CrossRef CAS PubMed
- I. Martens, E. A. Fisher and D. Bizzotto, Langmuir, 2018, 34, 2425–2431 CrossRef CAS PubMed
- J. Lv, Y. Li, K. Zhou, P. Guo, Y. Liu, K. Ding, K. Li, C. Zhong and B. Xiao, RSC Adv., 2020, 10, 21986–21992 RSC
- B. Xiao, M. M. McLean, X. Lei, J. F. Marko and R. C. Johnson, Sci. Rep., 2016, 6, 23697 CrossRef CAS PubMed
- M. J. Rosenbluth, W. A. Lam and D. A. Fletcher, Biophys. J., 2006, 90, 2994–3003 CrossRef CAS PubMed
- A. C. Sabuncu, A. J. Asmar, M. W. Stacey and A. Beskok, Electrophoresis, 2015, 36, 1499–1506 CrossRef CAS PubMed
- M. Long, J. Chen, N. Jiang, P. Selvaraj, R. P. McEver and C. Zhu, Biophys. J., 2006, 91, 352–363 CrossRef CAS PubMed
- X. Zhao, X. Zeng, C. Lu and J. Yan, Nanotechnology, 2017, 28, 414002 CrossRef PubMed
- M. Yu, X. Yuan, C. Lu, S. Le, R. Kawamura, A. K. Efremov, Z. Zhao, M. M. Kozlov, M. Sheetz, A. Bershadsky and J. Yan, Nat. Commun., 2017, 8, 1650 CrossRef PubMed
- B. Xiao, R. C. Johnson and J. F. Marko, Nucleic Acids Res., 2010, 38, 6176–6185 CrossRef CAS PubMed
- C. Brack, CRC Crit. Rev. Biochem., 1981, 10, 113–169 CrossRef CAS PubMed
- S. Lee and S. Hohng, J. Am. Chem. Soc., 2013, 135, 18260–18263 CrossRef CAS PubMed
- M. J. Comstock, T. Ha and Y. R. Chemla, Nat. Methods, 2011, 8, 335–382 CrossRef CAS PubMed
- A. McPherson and B. Cudney, Acta Crystallogr., Sect. F: Struct. Biol. Commun., 2014, 70, 1445–1467 CrossRef CAS PubMed
- I. D. Campbell and M. J. Humphries, Cold Spring Harbor Perspect. Biol., 2011, 3, a004994 Search PubMed
- Y. Takada, X. Ye and S. Simon, Genome Biol., 2007, 8, 215 CrossRef PubMed
- J. Huang, V. I. Zarnitsyna, B. Liu, L. J. Edwards, N. Jiang, B. D. Evavold and C. Zhu, Nature, 2010, 464, 932–936 CrossRef CAS PubMed
Footnotes |
| † Electronic supplementary information (ESI) available. See DOI: 10.1039/d1ra07067c |
| ‡ These authors contributed equally. |
| This journal is © The Royal Society of Chemistry 2021 |