
 Open Access Article
 This Open Access Article is licensed under a Creative Commons Attribution-Non Commercial 3.0 Unported Licence
The Monte Carlo approach to model and predict the melting point of imidazolium ionic liquids using hybrid optimal descriptors†
Shahram Lotfi *a,
Shahin Ahmadi*b and
Parvin Kumarc
*a,
Shahin Ahmadi*b and
Parvin Kumarc
aDepartment of Chemistry, Payame Noor University (PNU), 19395-4697 Tehran, Iran. E-mail: Sh.lotfei@gmail.com
bDepartment of Pharmaceutical Chemistry, Faculty of Pharmaceutical Chemistry, Tehran Medical Sciences, Islamic Azad University, Tehran, Iran. E-mail: ahmadi.chemometrics@gmail.com
cDepartment of Chemistry, Kurukshetra University, Kurukshetra, Haryana 136119, India
First published on 18th October 2021
Abstract
Ionic liquids (ILs) have captured intensive attention owing to their unique properties such as high thermal stability, negligible vapour pressure, high dissolution capacity and high ionic conductivity as well as their wide applications in various scientific fields including organic synthesis, catalysis, and industrial extraction processes. Many applications of ionic liquids (ILs) rely on the melting point (Tm). Therefore, in the present manuscript, the melting points of imidazolium ILs are studied employing a quantitative structure–property relationship (QSPR) approach to develop a model for predicting the melting points of a data set of imidazolium ILs. The Monte Carlo algorithm of CORAL software is applied to build up a robust QSPR model to calculate the values Tm of 353 imidazolium ILs. Using a combination of SMILES and hydrogen-suppressed molecular graphs (HSGs), the hybrid optimal descriptor is computed and used to generate the QSPR models. Internal and external validation parameters are also employed to evaluate the predictability and reliability of the QSPR model. Four splits are prepared from the dataset and each split is randomly distributed into four sets i.e. training set (≈33%), invisible training set (≈31%), calibration set (≈16%) and validation set (≈20%). In QSPR modelling, the numerical values of various statistical features of the validation sets such as RValidation2, QValidation2, and IICValidation are found to be in the range of 0.7846–0.8535, 0.7687–0.8423 and 0.7424–0.8982, respectively. For mechanistic interpretation, the structural attributes which are responsible for the increase/decrease of Tm are also extracted.
1. Introduction
Generally, ionic liquids (ILs) are a class of room temperature molten salts with melting points near or below 100 °C and these are made up of organic cations and organic/inorganic anions. ILs have been widely studied because of their potential applications in academia and industry, such as organic synthesis, electrochemistry, nanotechnology, catalysis and industrial extraction processes.1–6 Melting point (Tm) is an important physical property of ILs as it determines their physical state and is also used in the calculation of physicochemical properties such as aqueous solubility, vapour pressure and phase equilibrium properties.7,8 Melting points (Tm) are especially important for ILs since they have a wide liquidus range due to their low melting points and high thermal decomposition temperature (Td) and their solubility in water or organic solvents is highly associated with their Tm.9,10The melting point of organic molten salts based on the imidazolium cation is low and many of them are liquid at ambient temperature. Imidazolium ILs have attracted a lot of attention because of their solvating characteristics, high conductivity, and a broad range of electrochemical stability as well as their wide applications in different areas including catalysis, supercapacitors and photovoltaics.11–13 The development of task-specific ILs is feasible by in-depth standardization of the anions and cations. On the other hand, methods related to the design and development of ionic liquids is laborious and expensive. So, using computer-assisted approaches to develop ILs may save a lot of time and money. Hence, the development of the quantitative structure–property relationship (QSPR) models for the target endpoint i.e. melting point (Tm) of the ionic liquids has met with due success.
Quantitative structure–property relationships (QSPR) is a statistical approach to link the physical characteristics of a chemical substance to its chemical structure and this approach is also used to predict the property of an unknown compound. The CORAL (CORrelation And Logic) programme (available at http://www.insilico.eu/coral) has been recommended as a tool for doing QSPR analysis on a variety of endpoints.14–19 The simplified molecular input line-entry system (SMILES) notations of the chemical structures are used to compute the descriptor correlation weight (DCW) in the CORAL software using Monte Carlo optimization.20–23 In recent times, many publications utilized the ‘index of ideality of correlation (IIC)’ as a unique criterion to construct the best predictive QSPR models.24–27
The goal of the present study is to construct the QSPR models based on a hybrid optimal descriptor obtained from SMILES and a hydrogen-suppressed graph (HSG) to predict the Tm for a dataset of 353 imidazolium ILs. The index of ideality of correlation (IIC) is assessed as a criterion of predictive potential of the QSPR models of Tm. The accuracy and reliability of the constructed QSPR model are rigorously examined utilizing four random splits.
2. Method
2.1 Data
The experimental data on the Tm of 353 imidazolium ILs were obtained from Zhang et al.28 The range of melting point temperature (Tm) values was from 180.65 to 541.15 K. The molecular structure of all imidazolium ILs was sketched using the free software BIOVIA draw 2019 and displayed by the SMILES notation. The compound IDs, SMILES codes, and corresponding experimental and predicted Tm are given in the ESI in Table S1.† Four splits were prepared from the 353Tm data and each split was randomly distributed into four sets i.e. training set (≈33%), invisible training set (≈31%), calibration set (≈16%) and validation set (≈20%). Each set was assigned a specific task in the development of the QSPR models and was well cited in the literature.29–312.2 Hybrid optimal descriptor
The CORAL platform can provide three optimal descriptors: graph-based, SMILES-based, and hybrid, computed with both the graph and the SMILES. Further, three molecular graph-based descriptors can also be created using the CORAL platform: HSG (hydrogen-suppressed graph), HFG (hydrogen-filled graph) and GAO (graph of atomic orbitals). Earlier studies indicate that QSPR models constructed with hybrid optimal descriptors are more reliable than models constructed by only using SMILES or molecular graphs.32,33 In the present QSPR modelling, a hybrid descriptor, a combination of SMILES and HSG, is applied.The Tm of imidazolium ILs, computed by the Monte Carlo optimization of CORAL software, is represented in the following equation:
| Tm = C0 + C1 × DCW(T*, N*) | (1) |
So, the hybrid optimal descriptor employed here is represented by the following equation
| HybridDCW(T*, N*) = SMILESDCW(T, N*) + GraphDCW(T*, N*) | (2) |
The SMILES and graph-based optimal descriptors are computed using the following equations:
| SMILESDCW(T*, N*) = ∑CW(Sk) + ∑CW(SSk) + ∑CW(SSSk) + CW(BOND) + CW(NOSP) + CW(HALO) + CW(PAIR) + CW(HARD) + CW(Cmax) + CW(Nmax) + CW(Omax) + CW(Smax) | (3) |
| HSGDCW(T*, N*) = ∑CW(pt2k) + ∑CW(pt3k) + ∑CW(S2k) + ∑CW(nnk) + ∑CW(C5) + ∑(C6) | (4) |
The notation Sk, SSk, and SSSk are local SMILES features interpreted as one-, two-, and three-symbols of SMILES notations; NOSP and HALO are global SMILES attributes which are computed according to the absence or presence N, O, S, P and halogens; the BOND is a mathematical function that describes the existence or absence of double (![[double bond, length as m-dash]](https://www.rsc.org/images/entities/char_e001.gif) ), triple (#), or stereochemical bonds (@ or @@); PAIR is the pairing of NOSP, BOND, and HALO; HARD represents the existence or absence of all of the above-mentioned characteristics (BOND, NOSP, and HALO) of the molecular structure; Cmax, Nmax and Omax and Smax are the maximum numbers of rings, nitrogen, oxygen, and atoms present in a molecule structure.
), triple (#), or stereochemical bonds (@ or @@); PAIR is the pairing of NOSP, BOND, and HALO; HARD represents the existence or absence of all of the above-mentioned characteristics (BOND, NOSP, and HALO) of the molecular structure; Cmax, Nmax and Omax and Smax are the maximum numbers of rings, nitrogen, oxygen, and atoms present in a molecule structure.
In eqn (4), pt2k and pt3k are the numbers of paths length 2 and 3 starting from a given vertex in a graph, respectively; S2k is the valence shell of the second orders; nnk is the nearest neighbours; C5 and C6 are codes of rings (five-member and six-member rings, with the data on presence or absence of heteroatoms, aromaticity, and the total number of given rings in the molecule).6,15,34
The Monte Carlo optimization procedure can be performed based on two types of target functions: the balance of the correlation without IIC (TF1) and the balance of correlation with IIC (TF2). The mathematical equations of the two target functions are as the following:
| TF1 = RTRN + RiTRN − |RTRN − RiTRN| × 0.1 | (5) |
| TF2 = TF1 + IICCAL × WIIC | (6) |
Here, Monte Carlo optimization based on IIC (TF2) is used to generate QSPR models. However, in eqn (6), the weight of IIC (WIIC) is an empirical coefficient (here WIIC = 0.2) and IICCAL is the index of ideality of correlation for calibration-set.
The following mathematical equation is applied to compute the IIC:35–38
 | (7) |
 | (8) |
 | (9) |
| Δk = observedk − calculatedk | (10) |
The ‘k’ is the index (1, 2, …. N) and the observedk and calculatedk are related to values of the endpoint.
The numerical data on the above equations can be achieved with the CORAL software.
2.3 Domain of applicability
The applicability domain (AD) is a hypothetical chemical space area that encompasses both the model descriptors and the predicted response. The AD of substances is employed to estimate the ambiguity in the prediction of a given chemical based on how close it is to the substances employed to create the model in the building of a QSPR model. Because it is impossible to determine the whole world of compounds employing a particular QSPR model, the prediction of a modelled response utilizing QSPR is only meaningful if the molecule being predicted falls inside the AD of the model.39In the QSPR models developed by CORAL software, the applicability domain is computed by the allocation of SMILES attributes in the training, invisible training, and calibration sets and is defined as ‘DefectAk’.40,41
 | (11) |
| DefectAk = 1, if Ak = 0 |
The statistical defect (D) can be defined as the sum of statistical defects of all attributes present in the SMILES notation.
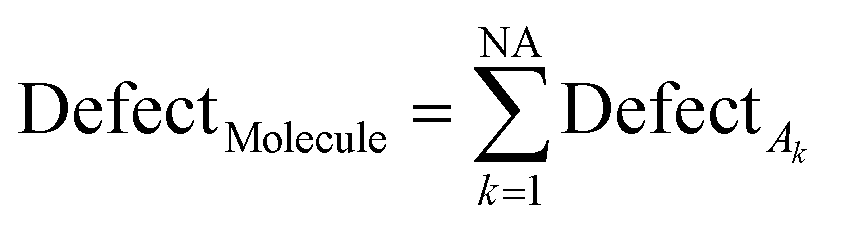 | (12) |
NA is the number of active SMILES attributes for the given compounds.
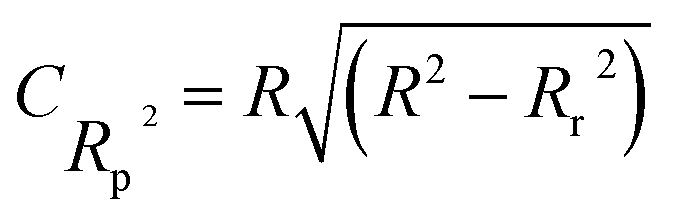
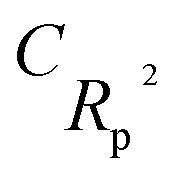
In CORAL, a substance is an outlier if inequality 13 is fulfilled:
 | (13) |
 D is an average of statistical defect for the dataset of the training set.
2.4 Validation of the model
It is important to validate the predictive potential of a created QSPR model. As per OECD guidelines, validation is defined as “the process by which the reliability and relevance of a particular approach, method, process, or assessment is established for a defined purpose”.30,42Here, to determine the robustness, reliability and the predictive capability of the QSPR models for Tm of ILs three strategies were used: (i) internal validation or cross-validation; (ii) external validation and (iii) Y-scrambling or data randomization.43,44 The mathematical relationship of different validation parameters employed herein is given in Table 1. Finally, IIC is employed to judge better models.45,46


3. Results and discussion
3.1 QSPR modelling for Tm
The QSPR models for the prediction of the Tm of different imidazolium ILs were constructed based on the hybrid optimal descriptor and Monte Carlo optimization using target function TF2 with the IIC. These QSPR models are demonstrated by the following equations:Split 1
| Tm = 201.0860213(±0.4744529) + 2.3453506(±0.0081959) × DCW(1, 12) | (14) |
Split 2
| Tm = 182.3433788(±0.6050734) + 3.3266093(±0.0136006) × DCW(1, 10) | (15) |
Split 3
| Tm = 194.3470062(±0.5449697) + 3.6063442(±0.0145966) × DCW(1, 10) | (16) |
Split 4
| Tm = 188.7306066(±0.4776797) + 2.3887347(±0.0075187) × DCW(1, 12) | (17) |
The statistical parameters of constructed QSPR models based on eqn (14)–(17) for four random splits are summarized in Table 2.
| Split | Set | n | R2 | CCC | IIC | Q2 | QF12 | QF22 | QF32 | Rm2 |
|
![[r with combining macron]](https://www.rsc.org/images/entities/i_char_0072_0304.gif) m2 m2 |
Δrm2 | Y-r | S | MAE | F |
|---|---|---|---|---|---|---|---|---|---|---|---|---|---|---|---|---|---|
| 1 | Training | 113 | 0.7862 | 0.8803 | 0.6548 | 0.7802 | 0.7848 | 31.3 | 24.6 | 408 | |||||||
| Invisible training | 112 | 0.7864 | 0.8865 | 0.7868 | 0.7780 | 0.7830 | 23.5 | 18.8 | 405 | ||||||||
| Calibration | 55 | 0.8196 | 0.9029 | 0.9053 | 0.8079 | 0.8112 | 0.8103 | 0.3341 | 0.8070 | 24.4 | 18.8 | 241 | |||||
| Validation | 54 | 0.8204 | 0.8954 | 0.8972 | 0.8060 | 0.8086 | 0.7419 | 0.1335 | 0.0279 | 28.0 | 22.8 | 238 | |||||
| 2 | Training | 116 | 0.8023 | 0.8903 | 0.7278 | 0.7958 | 0.7998 | 26.4 | 20.6 | 463 | |||||||
| Invisible training | 111 | 0.8334 | 0.8859 | 0.6057 | 0.8277 | 0.8299 | 26.4 | 20.4 | 545 | ||||||||
| Calibration | 57 | 0.8256 | 0.9071 | 0.9005 | 0.8137 | 0.8163 | 0.8144 | 0.8301 | 0.8136 | 24.5 | 20.2 | 260 | |||||
| Validation | 50 | 0.8535 | 0.9133 | 0.8982 | 0.8423 | 0.8271 | 0.7889 | 0.0764 | 0.0215 | 24.7 | 20.7 | 280 | |||||
| 3 | Training | 109 | 0.8116 | 0.8960 | 0.7922 | 0.8052 | 0.8064 | 24.9 | 19.2 | 461 | |||||||
| Invisible training | 107 | 0.8226 | 0.8900 | 0.8274 | 0.8155 | 0.8195 | 27.9 | 22.5 | 487 | ||||||||
| Calibration | 62 | 0.7809 | 0.8687 | 0.8837 | 0.7665 | 0.7287 | 0.7267 | 0.6810 | 0.7747 | 33.3 | 26.1 | 214 | |||||
| Validation | 56 | 0.7846 | 0.8818 | 0.7784 | 0.7687 | 0.6838 | 0.6965 | 0.0256 | 0.0218 | 27.5 | 22.3 | 197 | |||||
| 4 | Training | 118 | 0.8232 | 0.9031 | 0.8195 | 0.8183 | 0.8188 | 25.2 | 18.8 | 540 | |||||||
| Invisible training | 107 | 0.8551 | 0.9038 | 0.7369 | 0.8503 | 0.8471 | 23.1 | 17.6 | 620 | ||||||||
| Calibration | 62 | 0.8177 | 0.8952 | 0.9042 | 0.8035 | 0.8224 | 0.8154 | 0.7975 | 0.8093 | 26.8 | 22.0 | 269 | |||||
| Validation | 47 | 0.8323 | 0.8986 | 0.7424 | 0.8163 | 0.7888 | 0.7077 | 0.1623 | 0.0182 | 23.9 | 17.3 | 223 |
Taking into account the statistical criteria of the various validation parameters, all the constructed QSPR models were statistically good and had robust predictions. Furthermore, all of the generated QSPR models matched the MAE requirements of the error-based measure.50 Also, the Y-randomization test was carried out to evaluate the robustness of constructed models and the numerical value of  was found more than 0.5 for all models. The numerical value of the determination coefficient (RValidation2 = 0.8535) of the validation set for split 2 was found highest, so this model was nominated as the dominant model (Table 2). Plots of predicted Tm versus experimental Tm of four models developed by TF2 are shown in Fig. 1A. The plots of residual Tm versus predicted Tm for all subsets of all splits are represented in Fig. 1B. The dispersion of residual Tm was found to be near the horizontal line centred around zero and confirmed that all developed QSPR models were well fitted.
 | ||
| Fig. 1 Experimental Tm versus predicted Tm values (A) and residual of Tm versus predicted Tm (B) for four QSPR models constructed by TF2. | ||
In the CORAL-QSPR model constructed utilizing the Monte Carlo method, the applicability domain was employed to identify outliers. The average of defect SMILES was 1.39684 for split 2 and imidazolium ILs appeared into the domain of applicability if defect SMILES < 2.79367. The number of outliers present in the QSPR models constructed by TF2 was 9, 6, 8, and 8 for the splits 1, 2, 3 and 4 respectively.
3.2 Mechanistic interpretation
One of the OECD principles is the mechanistic interpretation of the generated QSPR model which means molecular structure information may be retrieved from such models. Because established optimal chemical descriptors may be connected with suitable chemical pieces, all models created using the Monte-Carlo technique follow the concept of mechanistic interpretation. In CORAL QSPR, the structural attributes (SAk) are used for mechanistic interpretation. The comparable statistical reliability of the model should be theoretically achieved in multiple rounds of Monte Carlo optimization. So, four classes of the attributes can be classified depending upon the numerical data for correlation weights (CWs) in three or more independent optimization runs: (i) if CW(SAk) is positive in all runs then these attributes are classified as a promoter of Tm increase; (ii) if CW(SAk) is negative in all runs then these attributes are classified as a promoter of Tm decrease; (iii) if CW(SAk) is both positive and negative in all runs then these attributes are classified as undefined; and (iv) if CW(SAk) = 0 these attributes are kept in rare or blocked category. The structural attributes as a promoter of increase and decrease extracted from split 2 (the best QSPR model) are listed in Table 3.| Type of descriptors | No. | SAk | CWs | NT, a | NiT, b | NC | Defect [SAk] | Comments | ||
|---|---|---|---|---|---|---|---|---|---|---|
| Probe 1 | Probe 2 | Probe 3 | ||||||||
| Promoter of increase | ||||||||||
| Graph-based descriptors | 1 | VS2-C…5… | 1.34960 | 2.43334 | 1.31153 | 108 | 99 | 50 | 0.0003 | Valence shell of the second order for aliphatic carbon atom equal to 5 |
| 2 | PT3-C…5… | 0.10558 | 1.51087 | 0.92938 | 99 | 87 | 41 | 0.0006 | The presence of the path of length 3 equal to 5 for a carbon atom | |
| 3 | PT2-C…4… | 0.24752 | 2.00169 | 0.35048 | 72 | 72 | 37 | 0.0003 | The presence of the path of length 2 equal to 4 for a carbon atom | |
| SMILES based descriptors | 1 | 1……….. | 7.29691 | 5.95405 | 6.34387 | 113 | 112 | 55 | 0.0000 | Presence of a cyclic ring |
| 2 | c……….. | 1.71525 | 2.42427 | 0.64969 | 109 | 102 | 55 | 0.0002 | Presence of aromatic carbon | |
| 3 | n……….. | 2.38850 | 1.33337 | 0.67039 | 108 | 102 | 55 | 0.0002 | Presence of aromatic nitrogen | |
| 4 | c…(……. | 2.49408 | 0.42892 | 2.49631 | 101 | 91 | 48 | 0.0002 | Branching at an aromatic carbon | |
| 5 | (…C…(… | 1.27092 | 2.30761 | 2.86614 | 88 | 89 | 39 | 0.0006 | Combination of aliphatic carbon with two branching | |
| 6 | c…(…C… | 1.33043 | 0.11257 | 0.06315 | 83 | 80 | 39 | 0.0003 | Aromatic carbon joined by branching with the aliphatic carbon atom | |
| 7 | […1……. | 0.89010 | 1.76115 | 0.62621 | 73 | 74 | 32 | 0.0006 | Presence of branching connected to the ring | |
| 8 | n…(……. | 0.94747 | 1.97741 | 2.03406 | 71 | 60 | 32 | 0.0005 | Presence of aromatic nitrogen and branching | |
![[thin space (1/6-em)]](https://www.rsc.org/images/entities/char_2009.gif) |
||||||||||
| Promoter of decrease | ||||||||||
| Graph-based descriptors | 1 | VS2-F…6… | −0.31025 | −0.58746 | −0.85323 | 67 | 70 | 30 | 0.0005 | Valence shell of second-order equal to 6 for a fluorine atom |
| 2 | PT2-C…1… | −0.76524 | −0.99261 | −0.74397 | 85 | 81 | 45 | 0.0004 | The presence of the path of length 2 equal to 1 for a carbon atom | |
| SMILES based descriptors | 1 | BOND10000000 | −2.42991 | −1.67430 | −2.03277 | 60 | 58 | 30 | 0.0001 | Presence of double bonds and absence of triple and stereochemical bonds |
| 2 | […S……. | −0.94276 | −0.55305 | −0.90267 | 35 | 37 | 13 | 0.0015 | Combination of branching and aliphatic sulphur | |
| 3 | […C……. | −1.90870 | −0.15225 | −0.77063 | 76 | 67 | 32 | 0.0009 | Presence of branching connected to aliphatic carbon | |
According to the outcomes mentioned in Table 3, the graph-based descriptors as promoters of Tm increase for ILs are: (i) VS2-C…5…, PT3-C…5…, PT2-C…4… and the graph-based descriptors as promoters of decrease are VS2-F…6…, PT2-C…1….
In the same way, some SMILES based descriptors as Tm enhancer are: 1……….., c……….., n……….., c…(……., (…C…(…, c…(…C…, […1……., n…(……., and some promoter of Tm decrease SMILES based attributes are: BOND10000000, […C……., […S……..
3.3 Comparison with the previous report
Data of QSPR models reported in the literature is shown in Table 4. These results are commonly based on the use of quantitative QSPR, group contribution methods (GCM), artificial neural network (ANN) model clustering techniques and CODESSA program.9,51–55 Huo et al.52 developed a QSPR model (R2 = 0.8984) based on the group contribution method to predict the melting points of 190 imidazolium and benzimidazolium ILs. J. A. Cerecedo-Cordoba et al.51 used QSPR techniques based on clustering methods for the prediction of melting points using two data sets of 281 (R2 = 0.78)and 134 (R2 = 0.93) imidazole ionic liquids. A. R. Katritzky et al.54 reported QSPR models based on CODESSA program to predict the melting points of 104 imidazolium bromides and 45 benzimidazolium bromides. They could not develop a unified correlation for the investigated ILs. Instead, they suggested several QSPRs models. They divided 149 substituted ILs on the basis of the N-substituents into four subsets: subset A having 57 compounds, subset B having 29 compounds, subset C having 18 compounds and subset D having 45 benzimidazolium bromides. The numerical value of determination coefficient were (i) set A, R2 = 0.7442, (ii) set B, R2 = 0.7517, (iii) set C, R2 = 0.943, and (iv) set D, R2 = 0.68992. López-Martin et al.55 developed a QSPR model (R2 = 0.869) for prediction of the Tm of 84 imidazolium-based ILs. They used the molecular descriptors generated by CODESSA and DRAGON software.| Descriptor type | Feature selection method | Machin learning method | Data set size | R2 | RMSD | Ref. | |||
|---|---|---|---|---|---|---|---|---|---|
| Training | Test | Training | Test | Training | Test | ||||
| a BMLR: best multilinear regression method, PLS: partial least squares, MLR: multiple linear regression, ANN: artificial neural network. | |||||||||
| CODESSA | BMLR | MLR | 16 | 3 | 0.90 | 0.9815 | 19.2 | 13.2 | 9 |
| 25 | 4 | 0.92 | 0.8622 | 15.2 | 29.1 | ||||
| PaDEL-descriptor | Tree feature selection | MLR | 291 | — | 0.78 | — | 18.2 | — | 51 |
| Group contribution descriptors | — | Group contribution method | 190 | — | 0.90 | — | 28.2 | — | 52 |
| Artificial neural networks | Multilayer perceptron network (MLP) | ANN | 97 | — | 0.99 | — | — | — | 53 |
| CODESSA | BMLR | MLR | 57 | — | 0.74 | — | 29.2 | — | 54 |
| 25 | — | 0.75 | — | 14.5 | — | ||||
| 18 | — | 0.94 | — | 17.7 | — | ||||
| 45 | — | 0.69 | — | 20.0 | — | ||||
| Dragon and CODESSA | — | PLS | 22 | — | 0.95 | — | — | — | 55 |
| — | 62 | — | 0.87 | — | — | — | |||
| Materials Studio | Genetic algorithm | MLR | 50 | 10 | 0.88 | 0.74 | 29.9 | 56 | |
| BA-ANN | 50 | 10 | 0.91 | 0.95 | 12.2 | ||||
| CORAL | Monte-Carlo | LR | 226 | 109 | 0.83 | 0.85 | 26.0 | 24.7 | This work |
The comparison depicts that the R2 of the calculated CORAL models are qualitatively comparable or even better than most of the other models suggested in the previous report for Tm of imidazolium ILs. However, previously reported models were developed utilizing a very small dataset, whereas the present dataset contains 353 imidazolium ILs, which is more than any reported work. In the present study. The numerical value of MAE and RMSE of the constructed QSPR models is smaller than all the reported QSPR models. Another superiority of the present method is that CORAL software does not require any physicochemical parameters or 3D optimization structure, as well as does not require the previous calculations of the chemicals descriptors for the creation of the QSPR models. Generally, the comparative data demonstrated the supremacy of the built models over the earlier published models.
4. Conclusion
For the prediction of the Tm of 353 imidazolium ILs, QSPR models were developed using a hybrid descriptor based on SMILES and HSG attributes. Using the balance of correlation method with the index of ideality correlation (IIC), reliable QSPR models for the Tm of 353 imidazolium ILs were successfully constructed. The IIC improves the predictive potential of described models. Four models were developed from four random splits and all the models were found statistically satisfactory and robust. The numerical value of the correlation coefficient (R2 = 0.8535) of the validation set of split 2 was highest than the other models and therefore, it was designated as the key model. The authenticity and robustness of the developed models were predicted by various statistical parameters such as R2, CCC, IIC, QF12, QF22, QF32, Rm2, etc. The present hybrid QSPR models were more robust and predictive than models reported in the literature. The structural attributes acting as promoters of Tm increase or decrease were also recognized.
Conflicts of interest
The authors declare no conflicts of interest.Acknowledgements
The authors are thankful to Dr Andrey A. Toropov and Dr Alla P. Toropova for providing CORAL software. The authors are also thankful to the authorities of respective universities for providing infrastructure. This study has received funding from the Payame Noor University (PNU) (Grant No. 7/6188).References
- B. C. Ranu, R. Jana and S. Sowmiah, An improved procedure for the three-component synthesis of highly substituted pyridines using ionic liquid, J. Org. Chem., 2007, 72(8), 3152–3154 CrossRef CAS PubMed.
- I. Paramasivam, J. Macak, T. Selvam and P. Schmuki, Electrochemical synthesis of self-organized TiO2 nanotubular structures using an ionic liquid (BMIM-BF4), Electrochim. Acta, 2008, 54(2), 643–648 CrossRef CAS.
- G.-H. Sun, K.-X. Li, H. Fan, J.-Y. Gu, Q. Li and Y. Liu, Electrochemical performance of capacitors using [BMIm] BF4/Fc as electrolyte, Acta Phys.-Chim. Sin., 2008, 24(1), 103–108 CAS.
- C. W. Scheeren, G. Machado, S. R. Teixeira, J. Morais, J. B. Domingos and J. Dupont, Synthesis and characterization of Pt(0) nanoparticles in imidazolium ionic liquids, J. Phys. Chem. B, 2006, 110(26), 13011–13020 CrossRef CAS PubMed.
- M. L. Dietz and D. C. Stepinski, Anion concentration-dependent partitioning mechanism in the extraction of uranium into room-temperature ionic liquids, Talanta, 2008, 75(2), 598–603 CrossRef CAS PubMed.
- S. Lotfi, S. Ahmadi and P. Zohrabi, QSAR modeling of toxicities of ionic liquids toward Staphylococcus aureus using SMILES and graph invariants, Struct. Chem., 2020, 31(6), 2257–2270 CrossRef CAS.
- F. Gharagheizi, P. Ilani-Kashkouli and A. H. Mohammadi, Computation of normal melting temperature of ionic liquids using a group contribution method, Fluid Phase Equilib., 2012, 329, 1–7 CrossRef CAS.
- A. R. Katritzky, R. Jain, A. Lomaka, R. Petrukhin, U. Maran and M. Karelson, Perspective on the relationship between melting points and chemical structure, Cryst. Growth Des., 2001, 1(4), 261–265 CrossRef CAS.
- N. Sun, X. He, K. Dong, X. Zhang, X. Lu, H. He and S. Zhang, Prediction of the melting points for two kinds of room temperature ionic liquids, Fluid Phase Equilib., 2006, 246(1–2), 137–142 CrossRef CAS.
- J. A. Lazzús, A group contribution method to predict the melting point of ionic liquids, Fluid Phase Equilib., 2012, 313, 1–6 CrossRef.
- A. B. McEwen, S. F. McDevitt and V. R. Koch, Nonaqueous electrolytes for electrochemical capacitors: imidazolium cations and inorganic fluorides with organic carbonates, J. Electrochem. Soc., 1997, 144(4), L84 CrossRef CAS.
- J. Fuller, R. T. Carlin and R. A. Osteryoung, The room temperature ionic liquid 1-ethyl-3-methylimidazolium tetrafluoroborate: electrochemical couples and physical properties, J. Electrochem. Soc., 1997, 144(11), 3881 CrossRef CAS.
- H. L. Ngo, K. LeCompte, L. Hargens and A. B. McEwen, Thermal properties of imidazolium ionic liquids, Thermochim. Acta, 2000, 357, 97–102 CrossRef.
- P. Kumar and A. Kumar, Monte Carlo method based QSAR studies of Mer kinase inhibitors in compliance with OECD principles, Drug Res., 2018, 68(4), 189–195 CrossRef CAS PubMed.
- A. P. Toropova and A. A. Toropov, CORAL software: prediction of carcinogenicity of drugs by means of the Monte Carlo method, Eur. J. Pharm. Sci., 2014, 52, 21–25 CrossRef CAS PubMed.
- S. Ahmadi, H. Ghanbari, S. Lotfi and N. Azimi, Predictive QSAR modeling for the antioxidant activity of natural compounds derivatives based on Monte Carlo method, Mol. Diversity, 2020, 1–11 Search PubMed.
- S. Ahmadi, F. Mardinia, N. Azimi, M. Qomi and E. Balali, Prediction of chalcone derivative cytotoxicity activity against MCF-7 human breast cancer cell by Monte Carlo method, J. Mol. Struct., 2019, 1181, 305–311 CrossRef CAS.
- T. Ghiasi, S. Ahmadi, E. Ahmadi, M. Talei Bavil Olyai and Z. Khodadadi, The index of ideality of correlation: QSAR studies of hepatitis C virus NS3/4A protease inhibitors using SMILES descriptors, SAR QSAR Environ. Res., 2021, 32(6), 495–520 CrossRef CAS PubMed.
- S. Ahmadi, S. Lotfi and P. Kumar, A Monte Carlo method based QSPR model for prediction of reaction rate constants of hydrated electrons with organic contaminants, SAR QSAR Environ. Res., 2020, 31(12), 935–950 CrossRef CAS PubMed.
- D. Weininger, SMILES, a chemical language and information system. 1. Introduction to methodology and encoding rules, J. Chem. Inf. Comput. Sci., 1988, 28(1), 31–36 CrossRef CAS.
- S. Lotfi, S. Ahmadi and P. Kumar, A hybrid descriptor based QSPR model to predict the thermal decomposition temperature of imidazolium ionic liquids using Monte Carlo approach, J. Mol. Liq., 2021, 116465 CrossRef CAS.
- P. Kumar and A. Kumar, CORAL: QSAR models of CB1 cannabinoid receptor inhibitors based on local and global SMILES attributes with the index of ideality of correlation and the correlation contradiction index, Chemom. Intell. Lab. Syst., 2020, 200, 103982 CrossRef CAS.
- A. A. Toropov, A. P. Toropova, E. Benfenati, G. Gini, D. Leszczynska and J. Leszczynski, SMILES-based QSAR approaches for carcinogenicity and anticancer activity: comparison of correlation weights for identical SMILES attributes, Anti-Cancer Agents Med. Chem., 2011, 11(10), 974–982 CrossRef CAS PubMed.
- M. Duhan, R. Singh, M. Devi, J. Sindhu, R. Bhatia, A. Kumar and P. Kumar, Synthesis, molecular docking and QSAR study of thiazole clubbed pyrazole hybrid as α-amylase inhibitor, J. Biomol. Struct. Dyn., 2021, 39(1), 91–107 CrossRef CAS PubMed.
- A. Kumar, J. Sindhu and P. Kumar, In-silico identification of fingerprint of pyrazolyl sulfonamide responsible for inhibition of N-myristoyltransferase using Monte Carlo method with index of ideality of correlation, J. Biomol. Struct. Dyn., 2020, 1–12 Search PubMed.
- A. Kumar and P. Kumar, Construction of pioneering quantitative structure activity relationship screening models for abuse potential of designer drugs using index of ideality of correlation in Monte Carlo optimization, Arch. Toxicol., 2020, 94(9), 3069–3086 CrossRef CAS PubMed.
- A. Kumar and P. Kumar, Quantitative structure toxicity analysis of ionic liquids toward acetylcholinesterase enzyme using novel QSTR models with index of ideality of correlation and correlation contradiction index, J. Mol. Liq., 2020, 318, 114055 CrossRef CAS.
- S. Zhang, X. Lu, Q. Zhou, X. Li, X. Zhang and S. Li, Ionic liquids: physicochemical properties, Elsevier, 2009 Search PubMed.
- S. Ahmadi, S. Aghabeygi, M. Farahmandjou and N. Azimi, The predictive model for band gap prediction of metal oxide nanoparticles based on quasi-SMILES, Struct. Chem., 2021, 1–13 Search PubMed.
- A. Kumar and P. Kumar, Identification of good and bad fragments of tricyclic triazinone analogues as potential PKC-θ inhibitors through SMILES-based QSAR and molecular docking, Struct. Chem., 2021, 32(1), 149–165 CrossRef CAS.
- A. A. Toropov, A. P. Toropova, D. Leszczynska and J. Leszczynski, “Ideal correlations” for biological activity of peptides, BioSystems, 2019, 181, 51–57 CrossRef CAS PubMed.
- S. Ahmadi, M. Mehrabi, S. Rezaei and N. Mardafkan, Structure-activity relationship of the radical scavenging activities of some natural antioxidants based on the graph of atomic orbitals, J. Mol. Struct., 2019, 1191, 165–174 CrossRef CAS.
- A. Kumar and P. Kumar, Prediction of power conversion efficiency of phenothiazine-based dye-sensitized solar cells using Monte Carlo method with index of ideality of correlation, SAR QSAR Environ. Res., 2021, 32(10), 817–834 CrossRef CAS PubMed.
- P. Kumar, A. Kumar and J. Sindhu, In silico design of diacylglycerol acyltransferase-1 (DGAT1) inhibitors based on SMILES descriptors using Monte-Carlo method, SAR QSAR Environ. Res., 2019, 30(8), 525–541 CrossRef CAS PubMed.
- A. A. Toropov, R. Carbó-Dorca and A. P. Toropova, Index of ideality of correlation: new possibilities to validate QSAR: a case study, Struct. Chem., 2018, 29(1), 33–38 CrossRef CAS.
- A. P. Toropova and A. A. Toropov, The index of ideality of correlation: a criterion of predictability of QSAR models for skin permeability?, Sci. Total Environ., 2017, 586, 466–472 CrossRef CAS PubMed.
- S. Ahmadi, Mathematical modeling of cytotoxicity of metal oxide nanoparticles using the index of ideality correlation criteria, Chemosphere, 2020, 242, 125192 CrossRef CAS PubMed.
- A. Kumar and P. Kumar, Cytotoxicity of quantum dots: use of quasiSMILES in development of reliable models with index of ideality of correlation and the consensus modelling, J. Hazard. Mater., 2021, 402, 123777 CrossRef CAS PubMed.
- E. Carnesecchi, A. A. Toropov, A. P. Toropova, N. Kramer, C. Svendsen, J. L. Dorne and E. Benfenati, Predicting acute contact toxicity of organic binary mixtures in honey bees (A. mellifera) through innovative QSAR models, Sci. Total Environ., 2020, 704, 135302 CrossRef CAS PubMed.
- S. Ahmadi and A. Akbari, Prediction of the adsorption coefficients of some aromatic compounds on multi-wall carbon nanotubes by the Monte Carlo method, SAR QSAR Environ. Res., 2018, 29(11), 895–909 CrossRef CAS PubMed.
- P. Kumar and A. Kumar, Nucleobase sequence based building up of reliable QSAR models with the index of ideality correlation using Monte Carlo method, J. Biomol. Struct. Dyn., 2020, 38(11), 3296–3306 CrossRef CAS PubMed.
- S. Ahmadi, A. P. Toropova and A. A. Toropov, Correlation intensity index: mathematical modeling of cytotoxicity of metal oxide nanoparticles, Nanotoxicology, 2020, 14(8), 1118–1126 CrossRef CAS PubMed.
- A. P. Toropova, A. A. Toropov, E. Carnesecchi, E. Benfenati and J. L. Dorne, The using of the index of ideality of correlation (IIC) to improve predictive potential of models of water solubility for pesticides, Environ. Sci. Pollut. Res., 2020, 27(12), 13339–13347 CrossRef CAS PubMed.
- M. Nimbhal, K. Bagri, P. Kumar and A. Kumar, The index of ideality of correlation: a statistical yardstick for better QSAR modeling of glucokinase activators, Struct. Chem., 2020, 31(2), 831–839 CrossRef CAS.
- A. P. Toropova and A. A. Toropov, The index of ideality of correlation: improvement of models for toxicity to algae, Nat. Prod. Res., 2019, 33(15), 2200–2207 CrossRef CAS PubMed.
- A. A. Toropov and A. P. Toropova, Use of the index of ideality of correlation to improve predictive potential for biochemical endpoints, Toxicol. Mech. Methods, 2019, 29(1), 43–52 CrossRef CAS PubMed.
- A. Shayanfar and S. Shayanfar, Is regression through origin useful in external validation of QSAR models?, Eur. J. Pharm. Sci., 2014, 59, 31–35 CrossRef CAS PubMed.
- N. Chirico and P. Gramatica, Real external predictivity of QSAR models: how to evaluate it? Comparison of different validation criteria and proposal of using the concordance correlation coefficient, J. Chem. Inf. Model., 2011, 51(9), 2320–2335 CrossRef CAS PubMed.
- I. Lawrence and K. Lin, Assay validation using the concordance correlation coefficient, Biometrics, 1992, 599–604 Search PubMed.
- K. Roy, R. N. Das, P. Ambure and R. B. Aher, Be aware of error measures. Further studies on validation of predictive QSAR models, Chemom. Intell. Lab. Syst., 2016, 152, 18–33 CrossRef CAS.
- J. A. Cerecedo-Cordoba, J. J. González Barbosa, J. Frausto Solís and N. V. Gallardo-Rivas, Melting temperature estimation of imidazole ionic liquids with clustering methods, J. Chem. Inf. Model., 2019, 59(7), 3144–3153 CrossRef CAS PubMed.
- Y. Huo, S. Xia, Y. Zhang and P. Ma, Group contribution method for predicting melting points of imidazolium and benzimidazolium ionic liquids, Ind. Eng. Chem. Res., 2009, 48(4), 2212–2217 CrossRef CAS.
- J. S. Torrecilla, F. Rodriguez, J. L. Bravo, G. Rothenberg, K. R. Seddon and I. Lopez-Martin, Optimising an artificial neural network for predicting the melting point of ionic liquids, Phys. Chem. Chem. Phys., 2008, 10(38), 5826–5831 RSC.
- A. R. Katritzky, R. Jain, A. Lomaka, R. Petrukhin, M. Karelson, A. E. Visser and R. D. Rogers, Correlation of the melting points of potential ionic liquids (imidazolium bromides and benzimidazolium bromides) using the CODESSA program, J. Chem. Inf. Comput. Sci., 2002, 42(2), 225–231 CrossRef CAS PubMed.
- I. López-Martin, E. Burello, P. N. Davey, K. R. Seddon and G. Rothenberg, Anion and cation effects on imidazolium salt melting points: a descriptor modelling study, ChemPhysChem, 2007, 8(5), 690–695 CrossRef PubMed.
- C. Yan, M. Han, H. Wan and G. Guan, QSAR correlation of the melting points for imidazolium bromides and imidazolium chlorides ionic liquids, Fluid Phase Equilib., 2010, 292(1–2), 104–109 CrossRef CAS.
Footnote |
| † Electronic supplementary information (ESI) available. See DOI: 10.1039/d1ra06861j |
| This journal is © The Royal Society of Chemistry 2021 |