DOI:
10.1039/D1RA06793A
(Paper)
RSC Adv., 2021,
11, 40205-40215
Structural, morphological, dielectric and optical properties of double perovskites RBaFeTiO6 (R = La, Eu)
Received
9th September 2021
, Accepted 8th December 2021
First published on 17th December 2021
Abstract
Double perovskites RBaFeTiO6 (R = La, Eu) were successfully synthesized using a solid state reaction route. Structural refinement analysis has been performed to investigate the details of the crystalline structure which was found to be a cubic double perovskite structure at room temperature (space group Pm![[3 with combining macron]](https://www.rsc.org/images/entities/char_0033_0304.gif) m, No. 221). Crystallite size, lattice strain, density, and porosity parameters were also calculated. The morphology and the elemental composition were analyzed by scanning electron microscopy (SEM), energy dispersive X-ray spectroscopy (EDX) and elemental mapping. FTIR and Raman scattering spectroscopy have been performed in order to study the vibrational modes and the various bond formations of the synthesized samples. The optical properties investigated by means of the optical absorbance measurements highlight that both materials present large band gap energies, and are thus potential candidates for various technological applications. The electrical behavior of these double perovskites was also studied by frequency-dependent dielectric measurements and impedance spectroscopy. The electrical conduction follows Jonscher's power law and the conduction mechanisms are identified.
m, No. 221). Crystallite size, lattice strain, density, and porosity parameters were also calculated. The morphology and the elemental composition were analyzed by scanning electron microscopy (SEM), energy dispersive X-ray spectroscopy (EDX) and elemental mapping. FTIR and Raman scattering spectroscopy have been performed in order to study the vibrational modes and the various bond formations of the synthesized samples. The optical properties investigated by means of the optical absorbance measurements highlight that both materials present large band gap energies, and are thus potential candidates for various technological applications. The electrical behavior of these double perovskites was also studied by frequency-dependent dielectric measurements and impedance spectroscopy. The electrical conduction follows Jonscher's power law and the conduction mechanisms are identified.
1. Introduction
Due to their interesting chemical and physical properties, perovskite oxide materials ABO3 (A is a large cation, and B a small transition metal or lanthanide cation) have been considered as an active area of research in solid-state chemistry and physics.1,2 The chemical flexibility and the vastness of compositional and configurational space in perovskite materials, have inspired researchers to multiply the site occupancies by including new elements in this structure.3
This multiplicity leads to the elaboration of a new class of materials defined as double perovskite oxides, resulting from the doubling of the formula unit of the perovskite structure. Since the original studies in the early 1950s,4 the A2BB′O6 double perovskites (A is an alkali or rare-earth cation, while B and B′ are transition metal cations) have received significant scientific interest due to their extensive physical properties and potential for technological use.5,6 Rare earth materials exhibit a variety of promising optical, magnetic, electrical, and catalytic properties resulting from the presence of rare earth elements.7 The incorporation of rare earth elements into the double perovskite R2B′B′′O6 has therefore attracted considerable attention ever since its discovery. The novel functionalities of rare-earth-based double perovskites in particular, including multiferroicity,8 magnetocapacitance,9 magnetoresistance,10 photocatalytic activities,11 have attracted much interest in recent decades. In turn, alkaline earth-based double perovskites represent a very large family of oxide compounds with impressive electronic and magnetic properties, high low-field magnetoresistance, half-metallicity, and a wide variety of magnetic structures.5 All these features have inspired the scientific community to explore even more flexibility and degrees of freedom, by developing and conducting intensive researches on another class of mixed double perovskite materials of the general formula AA′BB′O6 (A an alkali earth cation, A′ a rare-earth cation, while B and B′ are transition metal cation). In these compounds, the A- and B-site cations occupy distinct or indistinguishable crystallographic sites depending on their charge and ionic radius. As a result, a variety of interesting properties such as magnetoelectricity,12 giant magnetocaloric effect,13 catalytic properties,14 half-metallicity,15 multiferroicity, and colossal magnetoresistance have been highlighted.16,17
In view of the foregoing, novel double perovskite oxides RBaFeTiO6 (R = La, Eu) are synthesized by solid-state reaction route which is the simplest and the most common method for synthesizing oxide materials. Based on the literature survey, there are only two papers concerning the double perovskite LaBaFeTiO6, which cover the structural analysis and magnetic study by Mössbauer spectroscopy.18,19 These studies revealed that this material crystallizes in a Pmm cubic symmetry with a disordered distribution of Fe/Ti ions on the B-sites.18 In addition, Mössbauer spectroscopic measurements (at 80 K and 300 K) pointed to the paramagnetic feature of this double perovskite with a trivalent high spin state for the iron ions.19 However, the Eu-based system EuBaFeTiO6 has not yet been investigated. In this paper, we have undertaken an investigation of their structural, morphological, vibrational, optical, dielectric, and electrical properties. Besides, our results which are presented herein provide the study of the effect of rare earth ions (R3+) on these different properties.
2. Materials and methods
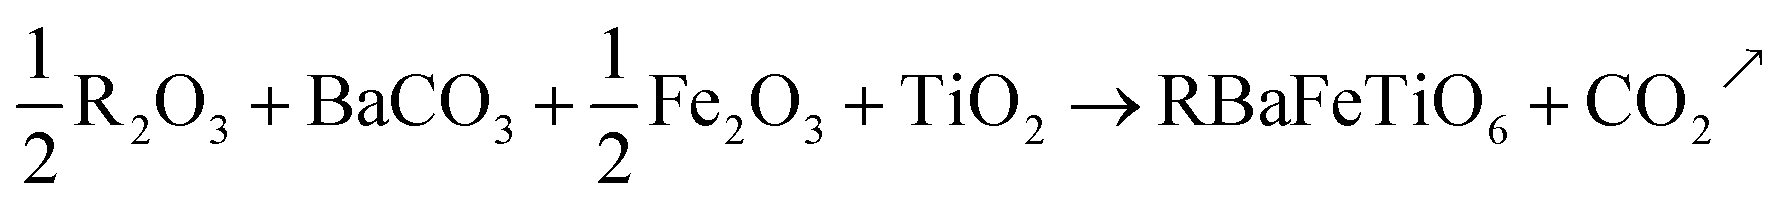
LaBaFeTiO6 and EuBaFeTiO6 compounds were prepared by solid-state reaction using high-purity rare earth oxides R2O3 (Sigma-Aldrich with purity higher than 99.5%), barium carbonates BaCO3 (Sigma-Aldrich with purity higher than 99% purity), iron oxide Fe2O3 (Sigma-Aldrich 99.9%) and titanium oxide TiO2 (Sigma-Aldrich with purity higher than 99%). The phases were prepared according to the following reaction:| |
 | (1) |
All these raw materials were weighed and mixed in stoichiometric ratios by grinding in an agate mortar. The mixtures were calcined at 700 °C during 24 h for decarbonation, before being sintered in a Pt crucible at 1250 °C (48 h) and 1300 °C (24 h), respectively. These powders have been reground and pelletized into cylindrical pellets in between these thermal treatments.
The phase identification and the determination of the crystal structure were carried out by X-ray diffraction measurements at room temperature. This analysis has been performed using a PANalytical X'pert PRO diffractometer using (CuKα) radiation (λCuKα = 1.54064 Å) in a wide range of Bragg angles (10° ≤ 2θ ≤ 80°) with a step width of 0.06° and a count time of 27 seconds per step. The obtained data were analyzed by means of the standard Rietveld method using FULLPROF software suite.20 The density was measured using an Isolab Borosilicate Glass 3.3 Pycnometer with a 25 ml capacity. The micro-structure and elemental composition of the prepared powders were examined with a JEOL-6300F scanning electron microscope (SEM), operating with accelerating voltage of 20 keV. Energy dispersive X-ray spectroscopy (EDX) and elemental mapping (EM) have been performed for compositional analysis of the samples. The Raman spectra were recorded using a Vertex 70 Bruker in the spectral range of 400–1600 cm−1 with excitation lines of 455 nm. Fourier Transform Infrared Spectroscopy (FT-IR) was performed to study the vibrational bands of the pattern by use of a Bruker Platinium-ATR apparatus. Optical study was performed at room temperature by means of a Jasco V-630 UV-vis-NIR spectrophotometer. The dielectric measurements of the silver coated pellets of the sample were conducted using an “HP LCR Meter 4284A′′ as a function of frequency 100 Hz ≤ f ≤ 1 MHz at various temperatures.
3. Results and discussion
3.1. Structural, morphological and elemental analysis
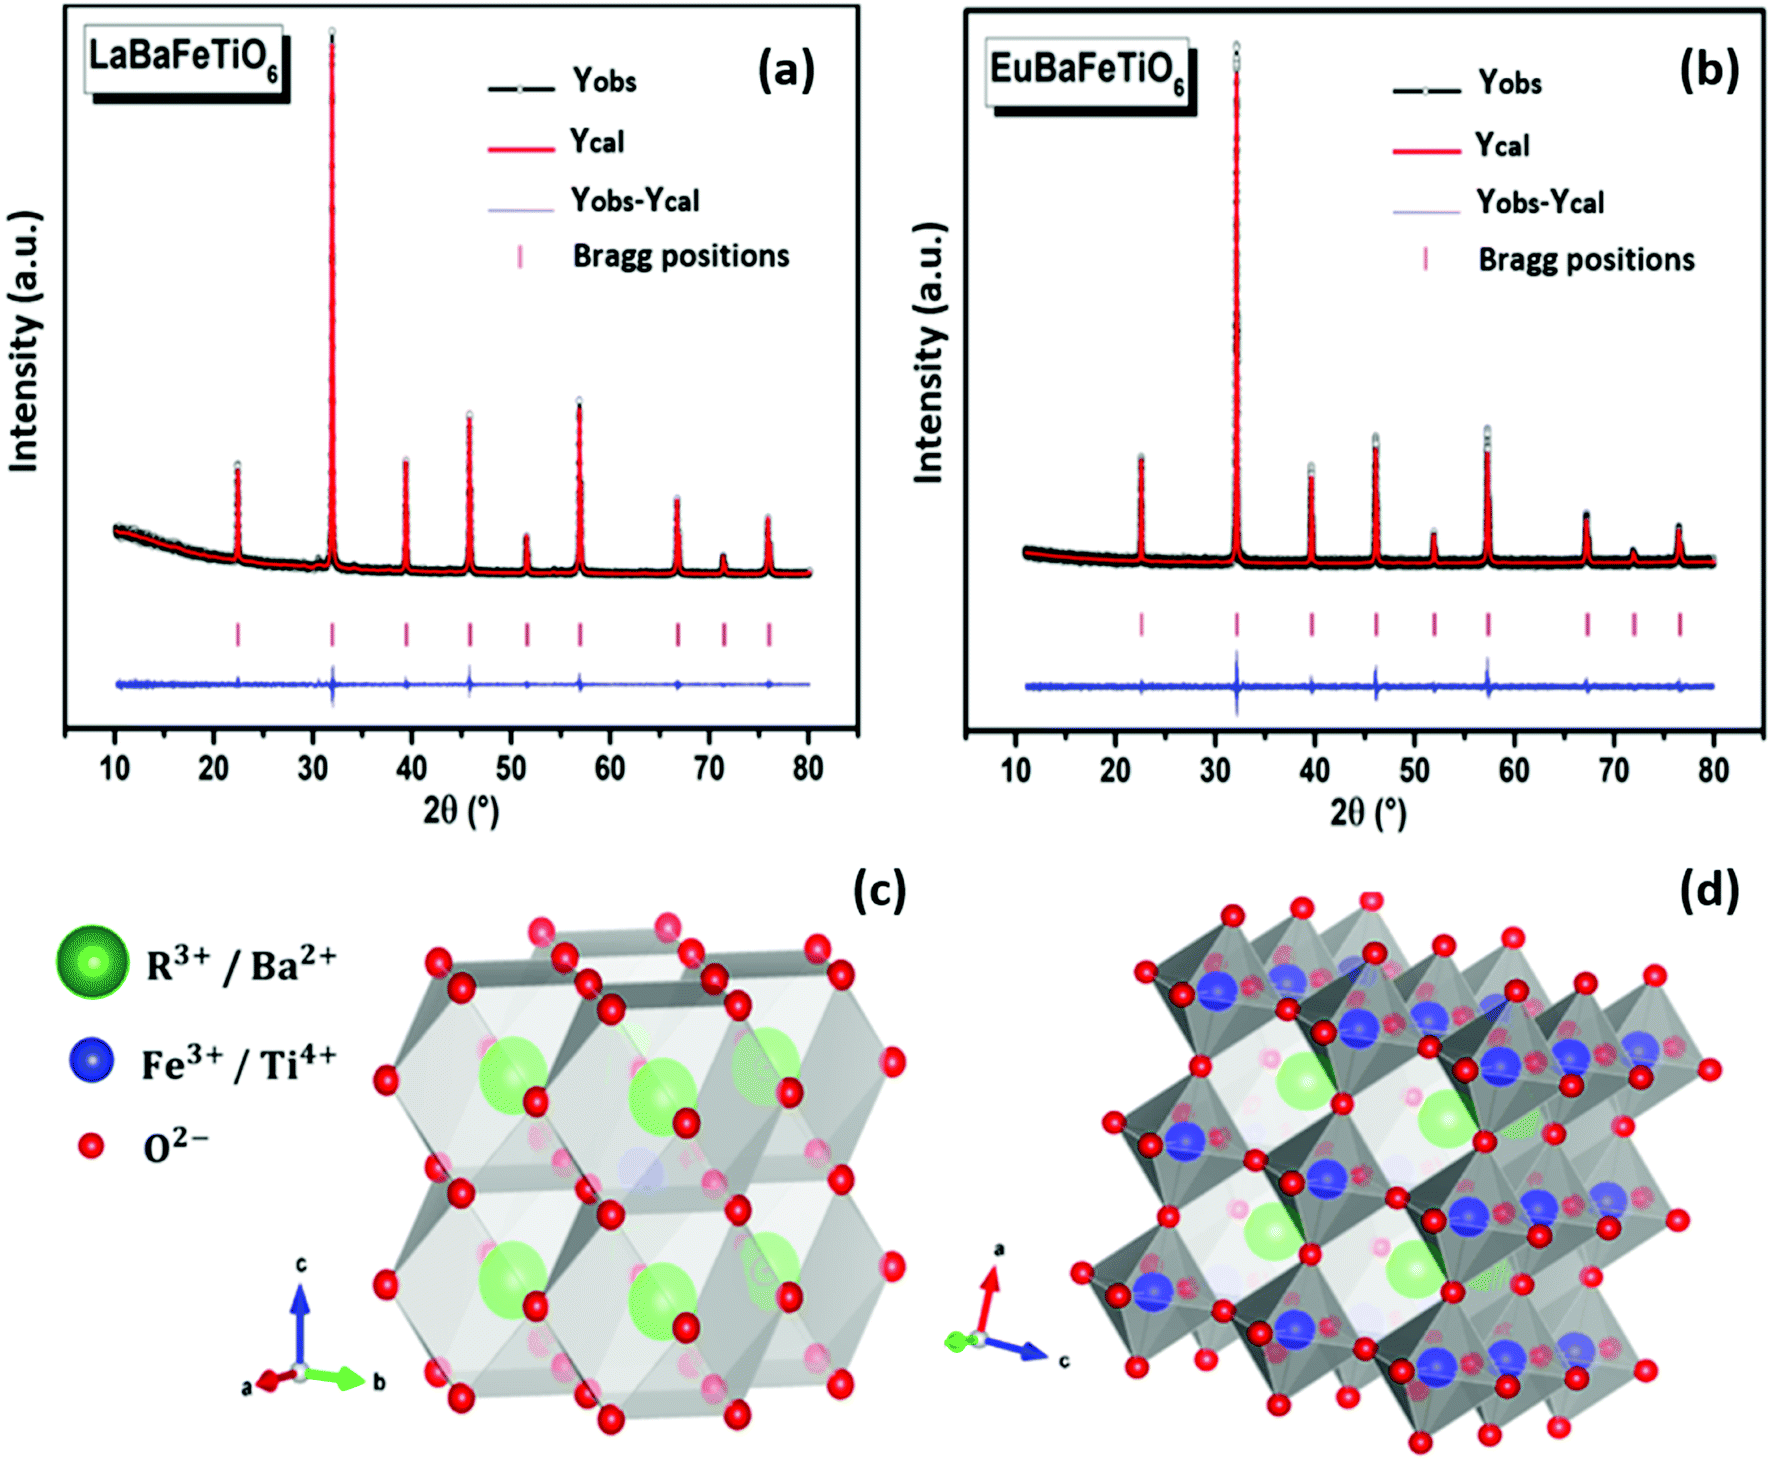
Fig. 1(a and b) illustrate the room temperature refined XRD patterns for the RBaFeTiO6 (R = La, Eu) samples, where the strong intensities and the sharp shapes of the diffraction peaks are indicative of good crystallization. The quality of the Rietveld refinement is evaluated on the basis of χ2, Rf and Bragg factor Rb values. Indeed, the use of the agreement factors Rp and Rwp is unsatisfactory from a statistical point of view. They are strongly dependent on the background resolution and the fluctuations of the whole pattern. Thus, their values are affected by the scan time and step size which are in turn dependent on the quality of the X-ray diffraction measuring device. The obtained results are given in Table 1. The values of agreement factors (χ2 <1.5, Rf <5 and Rb <5) establish the goodness of the fitting.21 We have also shown schematic representation of the RBaFeTiO6 double perovskites structure using refined structural parameters (Fig. 1(c and d)). Both materials are found to crystallize in a cubic structure (Pmm, No. 221) with disordered R3+/Ba2+ and Fe3+/Ti4+ in A and B sites, respectively. Furthermore, the crystal parameters obtained for the LaBaFeTiO6 phase are consistent with those reported in the literature.18
 |
| | Fig. 1 (a and b) Rietveld refinement and (c and d) crystal structure of RBaFeTiO6 represented using VESTA software.22 | |
Table 1 Experimentally determined structural parameters, Rietveld refinement parameters and density data for RBaFeTiO6 (R = La, Eu)
| Compound |
Element |
x |
y |
z |
B (Å2) |
Occupancy |
Refinement parameters |
| LaBaFeTiO6 |
La/Ba |
0 |
0 |
0 |
0.36 |
0.50/0.50 |
a (Å) |
3.96 ± 0.01 |
| Fe/Ti |
0.5 |
0.5 |
0.5 |
0.50 |
0.50/0.50 |
V (Å3) |
62.1 ± 0.5 |
| O1 |
0.5 |
0.5 |
0 |
0.80 |
1 |
χ2 |
1.26 |
| O2 |
0 |
0.5 |
0.5 |
0.80 |
1 |
Rf |
0.80 |
| O3 |
0.5 |
0 |
0.5 |
0.80 |
1 |
Rb |
1.28 |
| dLa/Ba–O (Å) |
2.801 |
dFe/Ti–O (Å) |
1.981 |
| Theoretical density ρ (g cm−3) |
6.35 |
Measured density ρ′ (g cm−3) |
6.14 |
| EuBaFeTiO6 |
Eu/Ba |
0 |
0 |
0 |
0.44 |
0.50/0.50 |
a (Å) |
3.94 ± 0.01 |
| Fe/Ti |
0.5 |
0.5 |
0.5 |
0.61 |
0.50/0.50 |
V (Å3) |
61.16 ± 0.5 |
| O1 |
0.5 |
0.5 |
0 |
2.03 |
1 |
χ2 |
1.40 |
| O2 |
0 |
0.5 |
0.5 |
2.03 |
1 |
Rf |
2.15 |
| O3 |
0.5 |
0 |
0.5 |
2.03 |
1 |
Rb |
3.24 |
| dEu/Ba–O (Å) |
2.783 |
dFe/Ti–O (Å) |
1.968 |
| Theoretical density ρ (g cm−3) |
6.65 |
Measured density ρ′ (g cm−3) |
6.49 |
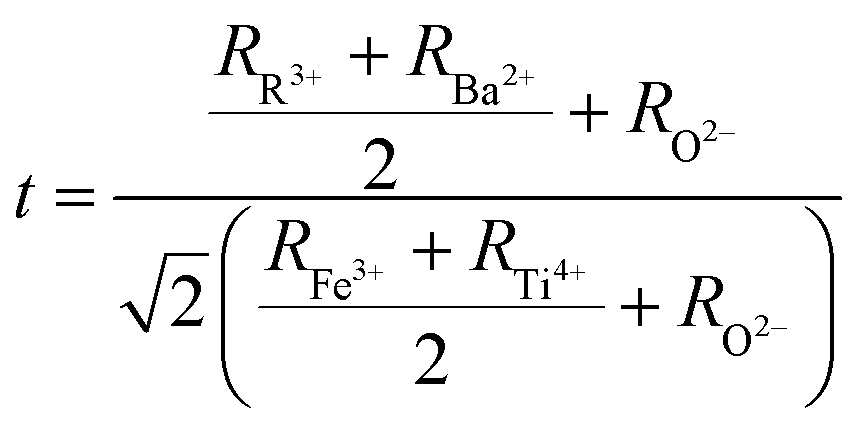
The structure and stability of double perovskites RBaFeTiO6 can be approximated using the ratio of R3+/Ba2+–O2− to Fe3+/Ti4+–O2− bond lengths as the tolerance factor (t):23
| |
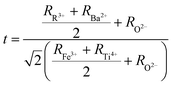 | (2) |
where
RR,3+ RBa,2+ RFe,3+ RTi4+ and
RO2− are the ionic radii of rare earth ions R
3+, Ba
2+, Fe
3+, Ti
4+ and O
2− ions, respectively. The calculated values of the tolerance factors are found to be 0.996 (LaBaFeTiO
6) and 0.979 (EuBaFeTiO
6), asserting the formation of a cubic structure with favorable conditions for double perovskite structure. Besides, the noticed decrease in the tolerance factor value indicates the decrease in the cubic symmetry of these materials.
| |
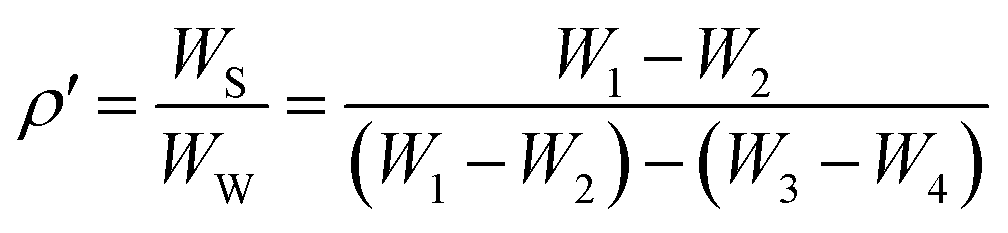
 | (3) |
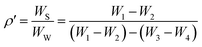
where
W1,
W2,
W3 and
W4 correspond to the weight of (pycnometer + powder), pycnometer, (pycnometer + powder + water) and (pycnometer + powder), respectively. The obtained densities of RBaFeTiO
6 (R = La, Eu) are shown in
Table 1. These measured densities (
ρ′) are found to be 97% of the theoretical density calculated from the lattice parameters derived from XRD data. Such results asserts the calculated structural parameters and thus the existence of only a single formula unit in the unit cell. Moreover, the small values of the measured densities compared to the theoretical ones is related to the presence of unavoidable pores during the heating process. The porosity (
P) was calculated basing on the following equation:
24| |
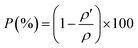 | (4) |
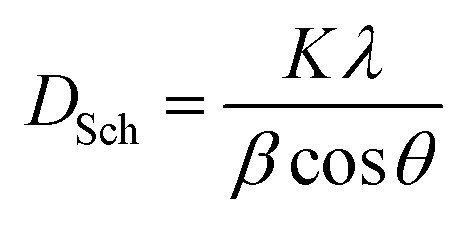
Leading to small values of porosity, i.e. 3.27% for LaBaFeTiO6 and 2.41% for EuBaFeTiO6. This decrease in the porosity indicates a small delay in the densification process of the RBaFeTiO6 matrix. The average crystallite size of the RBaFeTiO6 powders was, first, evaluated by the X-ray line broadening technique using the Scherrer formula:25
| |
 | (5) |
where
DSch is the average size of the ordered domains (crystallites),
K is the shape factor (
K = 0.9),
λ is the X-ray wavelength (
λ = 1.5406 Å),
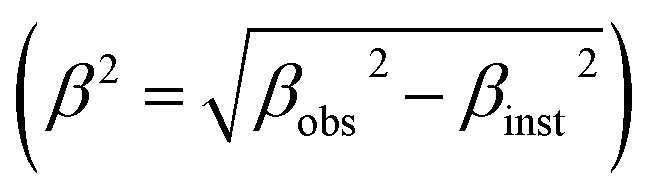
β is the full width at half maxima (FWHM) and
θ is the Bragg angle. The instrumental broadening factor was taken into consideration when calculating the FWHM parameter
. The average crystallite sizes calculated based on the most intense diffraction peak are about 63 nm and 83 nm for the LaBaFeTiO
6 and EuBaFeTiO
6 samples, respectively. The crystallite size was also estimated using the Williamson–Hall method based on the following relation:
26| |
 | (6) |
where
ε is the microstrain and
DW–H the crystallite size.
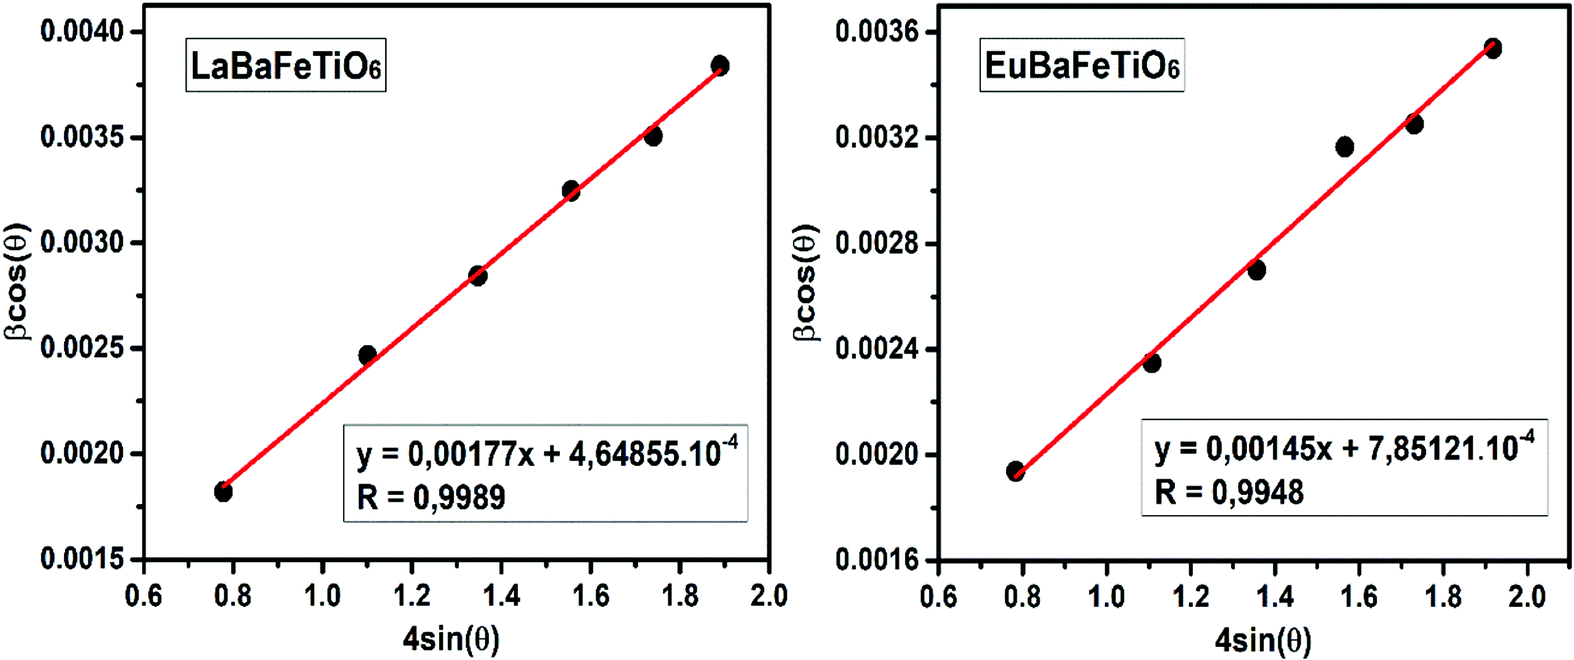
Fig. 2 shows the evolution of
β![[thin space (1/6-em)]](https://www.rsc.org/images/entities/char_2009.gif)
cos
θ vs. 4
sin
θ. The crystallite size
DW–H was calculated from the interception of the curve with the vertical axis (sin
θ = 0), while the microstrain parameter is obtained from the slope of the obtained curve. The obtained parameters (
ε,
DW–H) were found to be (4.65 10
−4, 78 nm) for LaBaFeTiO
6 and (7.85 10
−4, 95 nm) for EuBaFeTiO
6, which is in a good agreement with
DSch values.
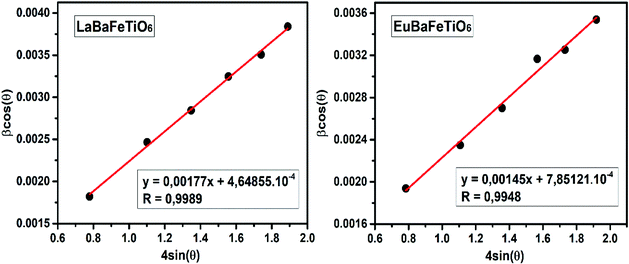 |
| | Fig. 2 Williamson–Hall plot of RBaFeTiO6 samples. | |
SEM images along with EDX spectra of RBaFeTiO6 (R = La, Eu) powders are given in Fig. 3. One can observe that the synthesized powders consist of irregularly shaped grains with non-uniform size distribution. Moreover, the obtained powders present a large grain sizes reaching 90 μm and 109 μm for the LaBaFeTiO6 and EuBaFeTiO6 samples, respectively. This indicates that the growth of grains is inhibited in the La-based sample compared to the Eu-based one. The difference in the grain size is probably related to the change in the rate and nature of nucleation in the two samples.
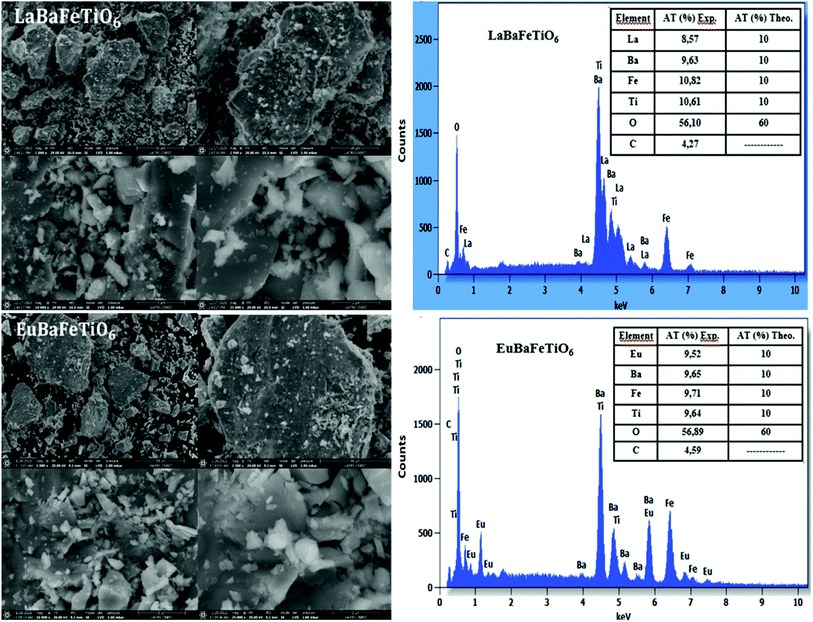 |
| | Fig. 3 SEM morphology and EDX analysis of double perovskites RBaFeTiO6 powders. | |
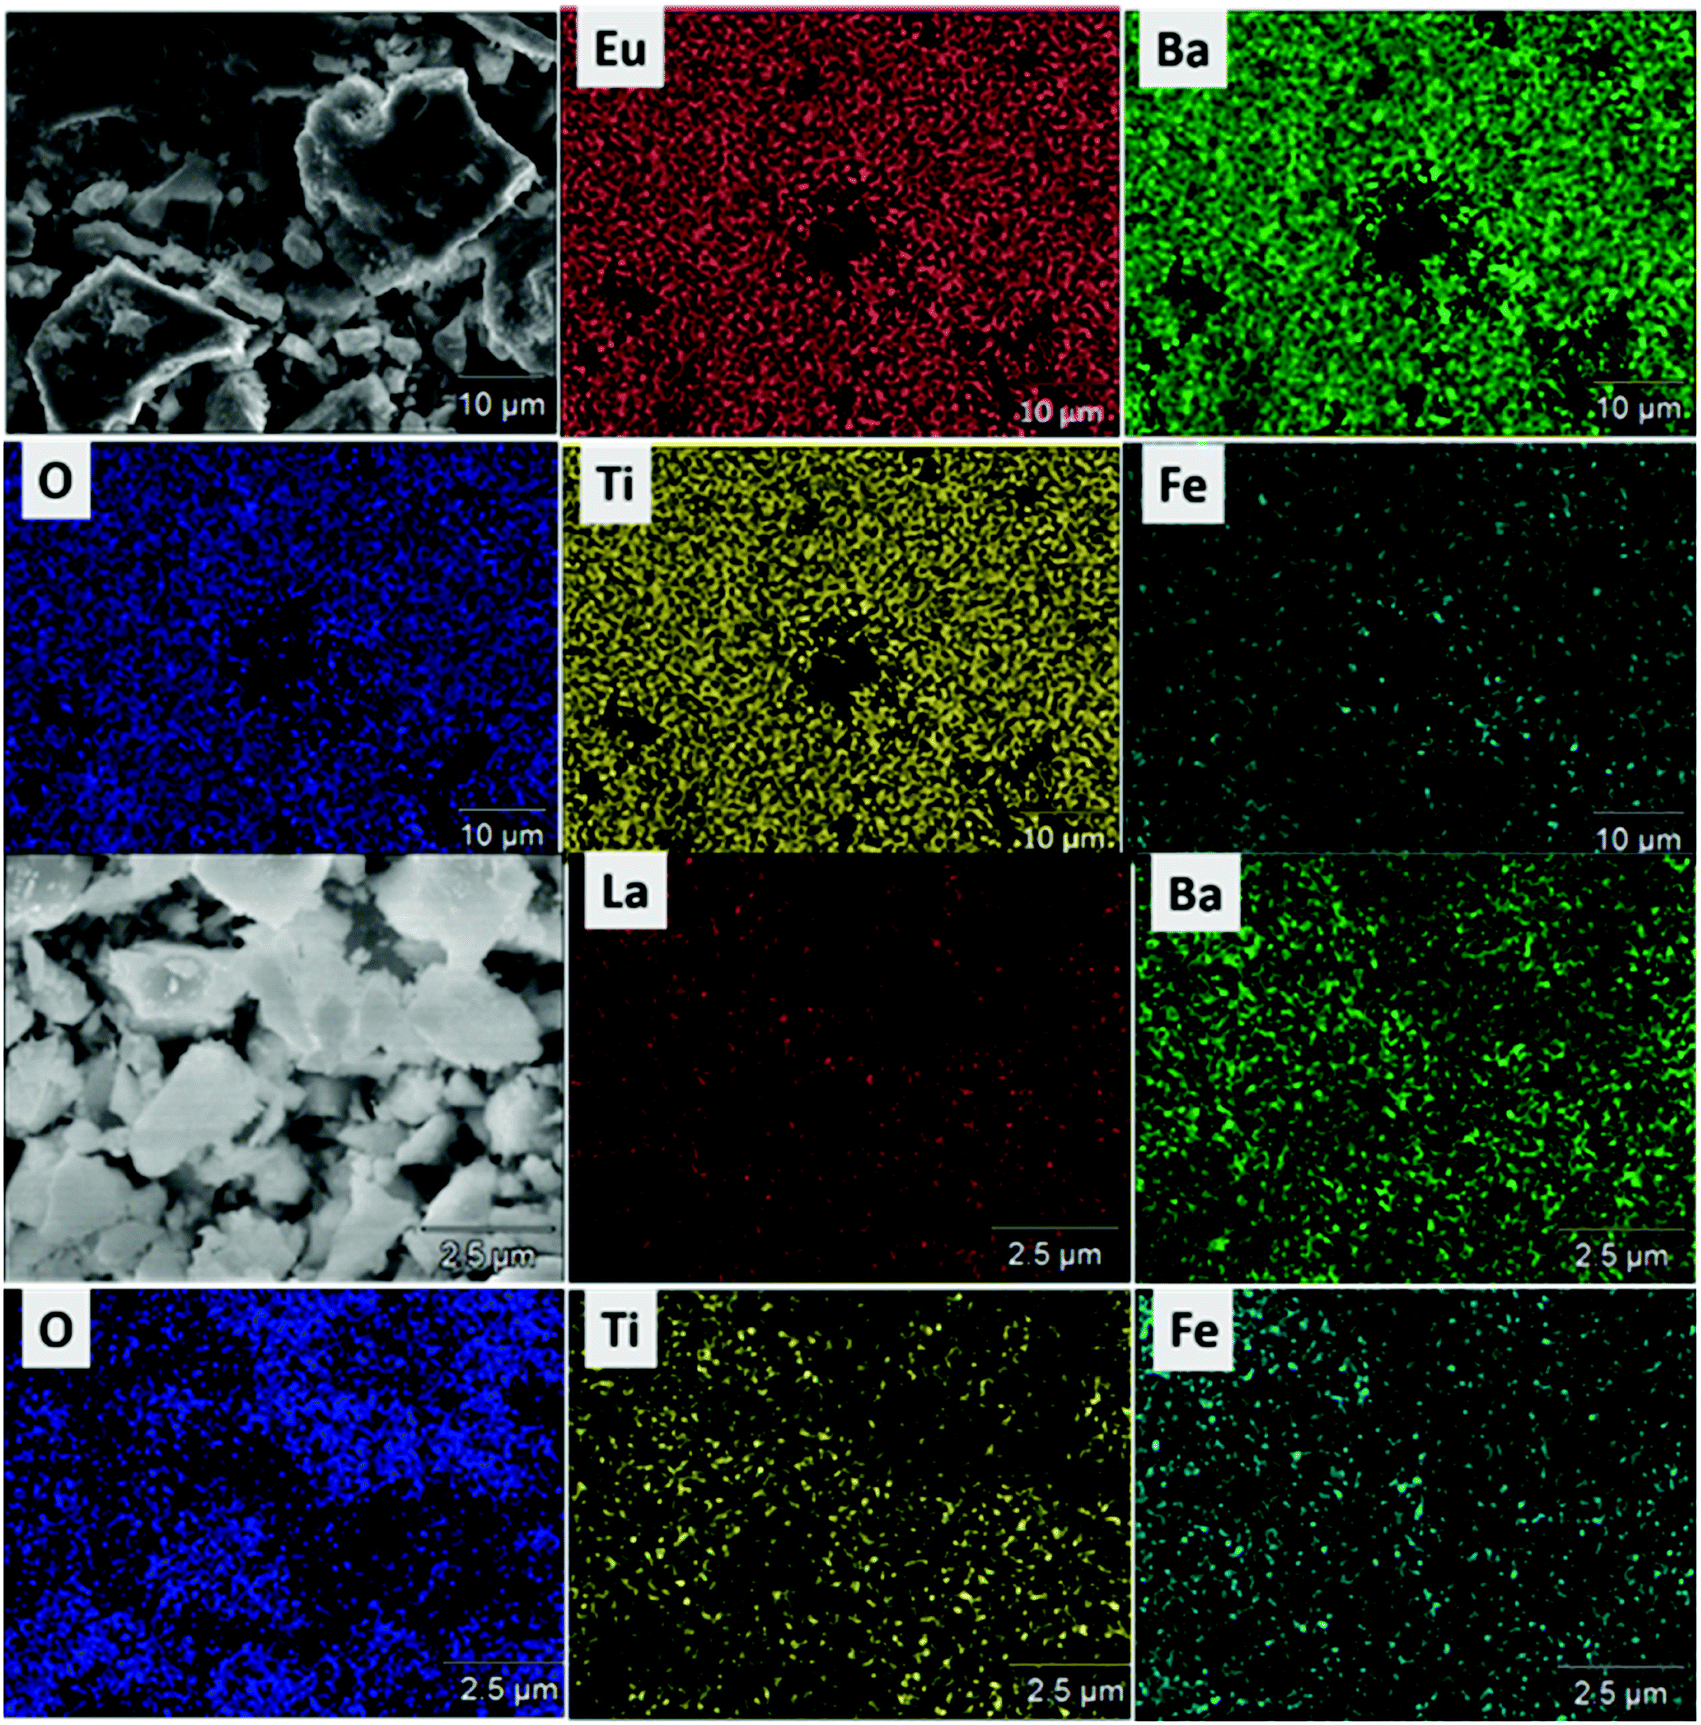
In order to control the composition of our samples, energy dispersive X-ray (EDX) analysis was performed (Fig. 3). One can notice that no trace of impurity peaks was detected, affirming the purity and homogeneity of our compounds. Indeed, the obtained chemical composition values are almost in agreement with atomic composition of precursors. The small amount of carbon is due to the adhesive tape used during the analysis. Furthermore, the EDX mapping of the RBaFeTiO6 ceramics highlights homogenous distribution of all contained elements (Fig. 4).
 |
| | Fig. 4 Elemental mapping of RBaFeTiO6 samples. | |
3.2. FTIR and Raman measurements
The FT-IR spectra of RBaFeTiO6 (R = La, Eu) are recorded at room temperature in the 400–2000 cm−1 wavenumbers range (Fig. 5). The evolution of the highlighted band wavenumbers as a function of rare earth elements asserts the effect of the distortion caused by the R3+ cations. By passing from lanthanum (La) to europium (Eu), one can notice a significant displacement of the different bands towards larger wavenumbers. Such results affirm the influence of rare earth cations on the vibrational properties of these double perovskites. Indeed, the decrease in the rare earth size causes the reduction of the lattice volume, along which Ba2+, Fe3+ and Ti4+ ions move towards those of oxygen inducing an increase in the force constant of (R3+/Ba2+)–O2− and (Fe3+/Ti4+)–O2− bonds and thus an increase in their vibrations frequencies. These findings are very consistent with those obtained by X-ray diffraction analysis.
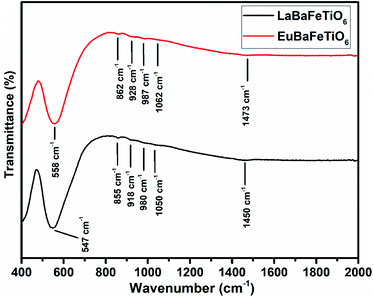 |
| | Fig. 5 Fourier infrared spectra of RBaFeTiO6 (R = La, Eu) compounds. | |
The values of the observed absorption band wavenumbers of LaBaFeTiO6 (EuBaFeTiO6) are also indicated on the Fig. 5. The absorption bands at 547 (558) cm−1 and 918 (928) cm−1 are attributed to the Fe/Ti–O vibration band in (Fe/Ti)O6 octahedra.27–31 The two peaks at 980 (987) cm−1 and 1048 (1056) cm−1 are associated with the O–Ba–O vibrations,32 while the band appearing at 855 (862) cm−1 is believed to reflect the Ba–O vibration modes.33 The other small absorption band at 1463 (1473) cm−1 is related to the O–(Fe/Ti)–O vibrations inside the (Fe/Ti)O6 octahedra.34,35
The dominance of the spectroscopic behavior by the vibration modes of Ba–O bonds and Fe/TiO6 octahedra is consistent with the vibrational character of the RE(III)–O bonds, as their vibration bands generally appear over a lower wavenumber range (250–500 cm−1).29 Such character is apparently explained by the inverse dependence of the vibrational frequency on the mass of the atoms, so that heavier atoms vibrate at lower frequencies.36
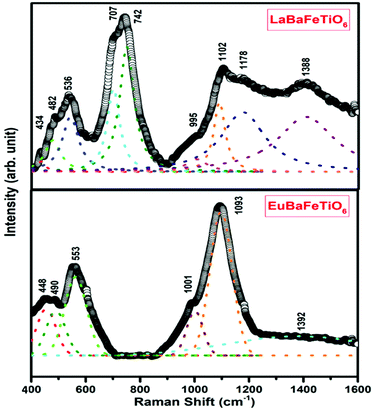
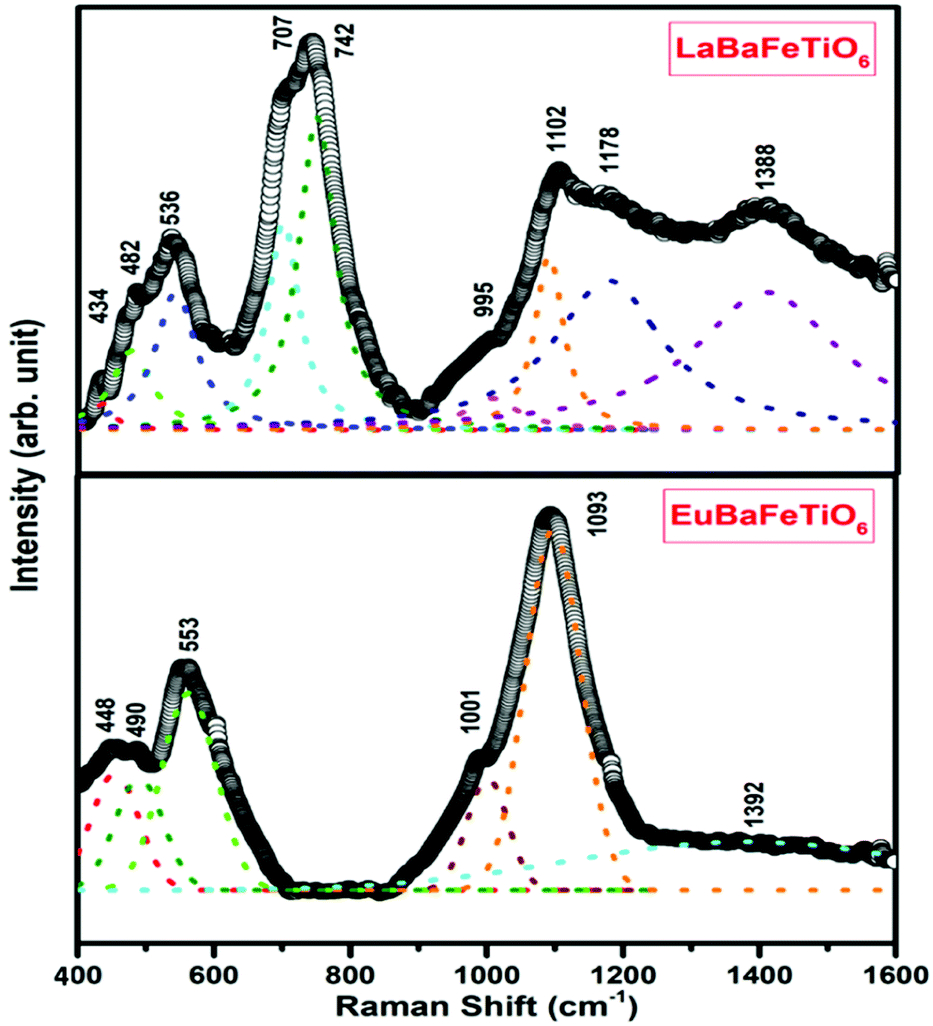
Raman spectra of the two double perovskites LaBaFeTiO6 and EuBaFeTiO6 were collected in the range 400–1600 cm−1 as represented in Fig. 6. The frequencies of the obtained Raman active modes are determined by fitting the recorded spectra and decomposing the fitted curves into individual Lorentzian components. The LaBaFeTiO6 double perovskite exhibits nine Raman active modes, whereas the EuBaFeTiO6 one shows only six Raman bands. The influence of the rare earth element on the different bond lengths in the RBaFeTiO6 systems, as previously proved by the XRD and FTIR results, is evidenced by the observed shift in the positions of the highlighted Raman bands. The resonance peaks observed at 434 (448) cm−1 and 536 (553) cm−1 correspond to the A1g and A2g modes, respectively.37 The small shoulder observed at 995 (1001) cm−1 is attributed to the double energy values of Ag vibrational mode.38 Besides, the peaks positioned at 1102 (1093) cm−1 and 1388 (1392) cm−1 correspond to the 2Eg modes.37–39 It is worth noting that the peaks at 1388 (1392) cm−1 are correlated with the existence of magnetic ordering in these materials.37–39
 |
| | Fig. 6 Room temperature Raman spectra of RBaFeTiO6 compounds. | |
3.3. Optical study
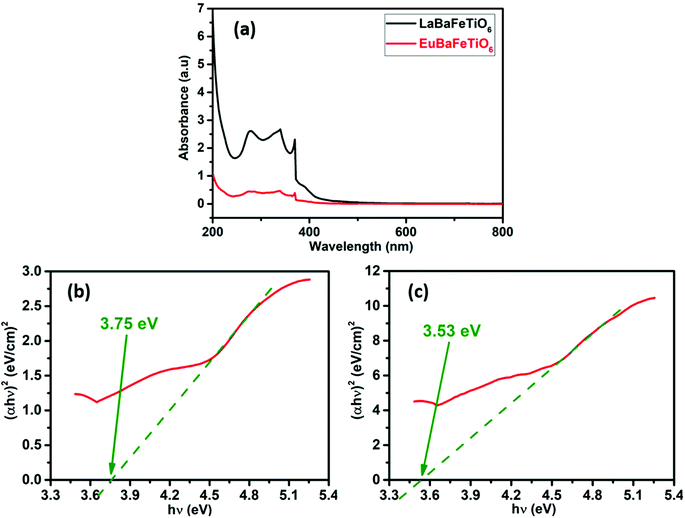
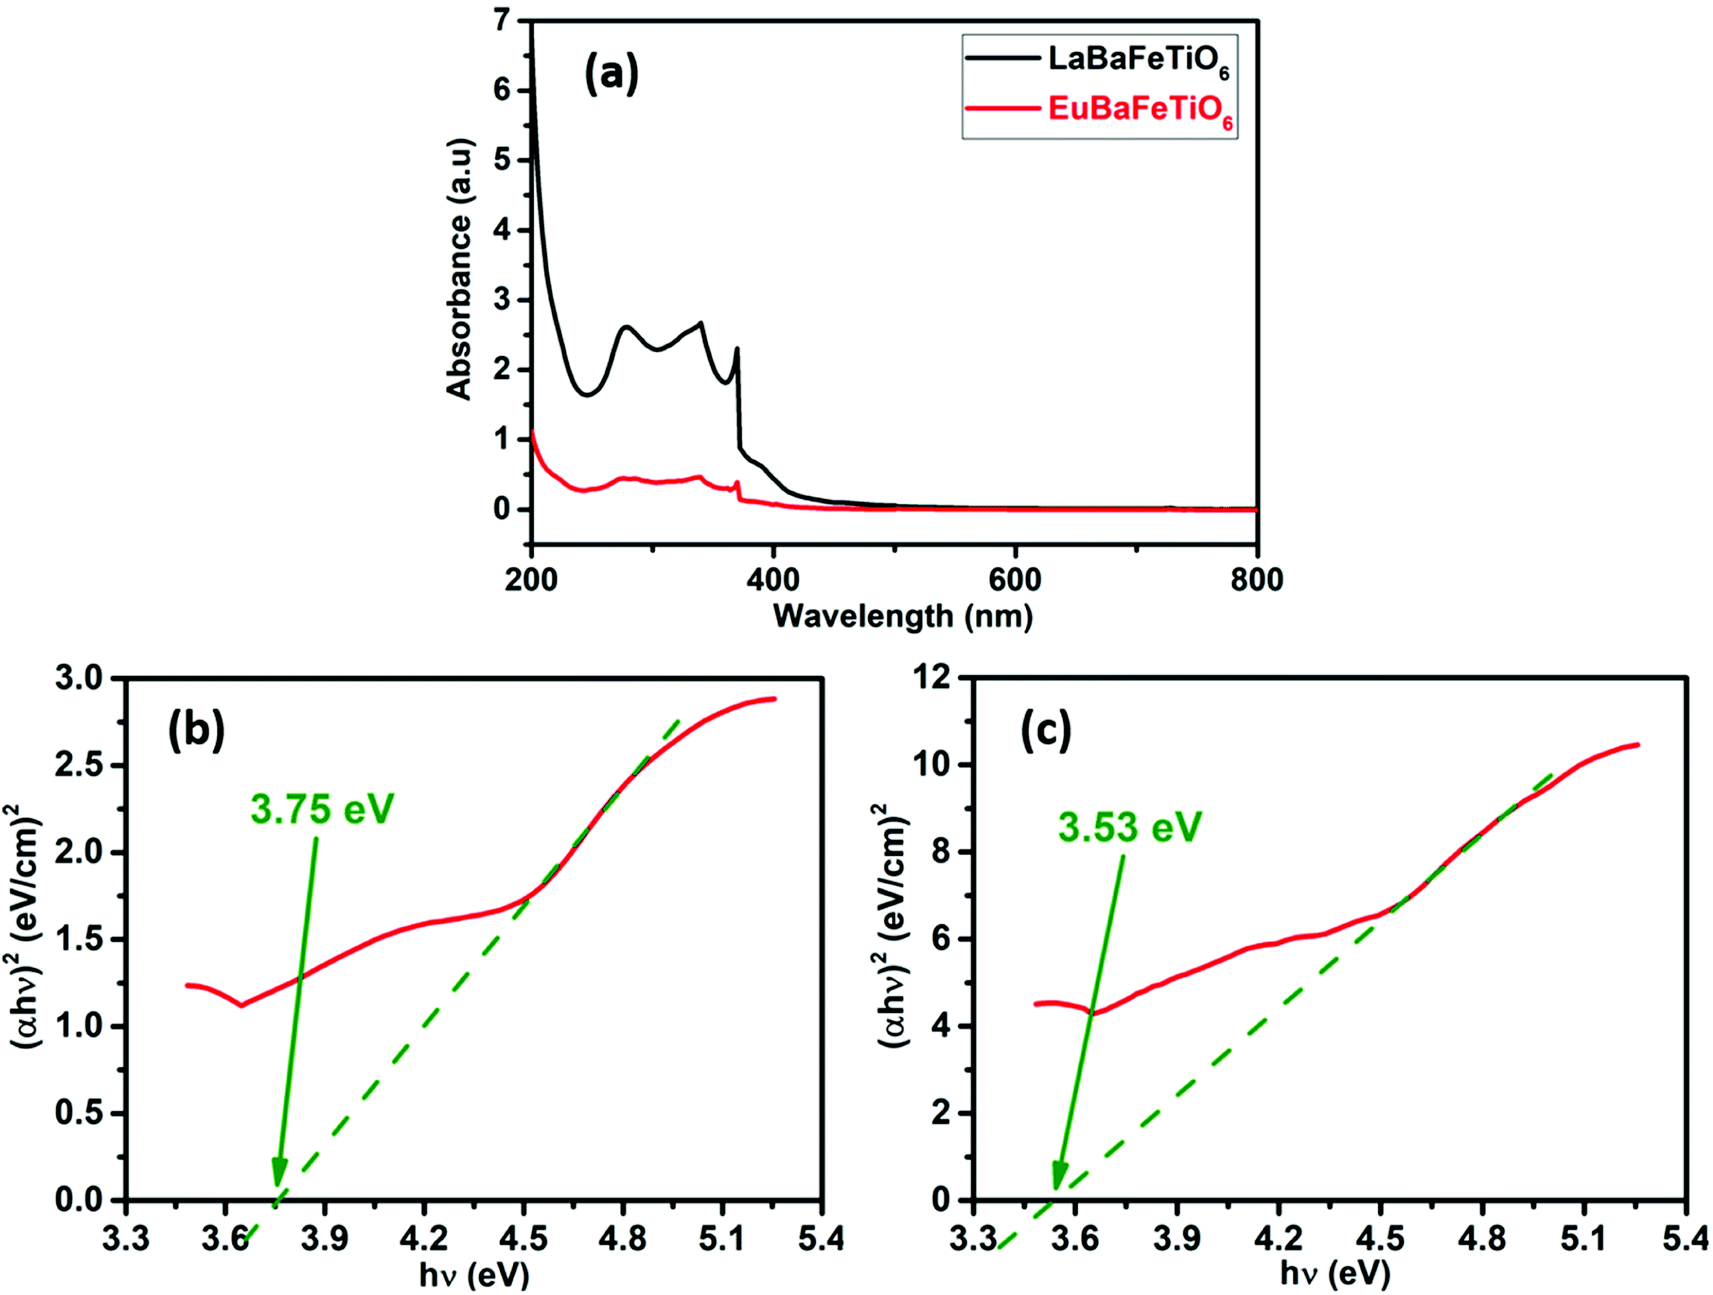
UV-Vis absorbance measurements were conducted to study the optical properties of the synthesized samples. Fig. 7(a) indicates that each of these materials exhibit similar absorption edges but with progressive intensity. The absorption intensity is highest for the La-based sample compared to the Eu-based one. The high absorption capability at UV-regime suggests that the EuBaFeTiO6 material can be considered for photocatalytic activities. The absence of absorption peaks in the visible wavelength range indicates that these powders represent a highly reflective nature for visible light. Further analysis of the optical properties using Tauc plots have been performed. Indeed, the optical band gap (Eg) is determined by using Tauc relation:40where α is the absorption coefficient, (hυ) is the incident photon energy, A is the characteristic parameter, while n is an exponent that is related to the optical absorption process and equal to 1/2 for a direct allowed transition or 2 for an indirect allowed transition.41 Fig. 7(b and c) representing the Tauc plots revealed a direct band gap with an energy of 3.75 eV and 3.53 eV for the LaBaFeTiO6 and EuBaFeTiO6, respectively. These energies are estimated by extrapolating the linear portion of the curve to the energy axis ((αhυ)2 = 0). These findings highlights the influence of the rare earth ion on the optical properties of these materials. Moreover, such wide band gap energy values make these materials potential candidates for various application, as photovoltaic and optoelectronic devices.42,43
 |
| | Fig. 7 (a) Absorbance spectra and Tauc plots for optical absorption curves of (b) LaBaFeTiO6 and (c) EuBaFeTiO6. | |
3.4. Dielectric and conductivity study
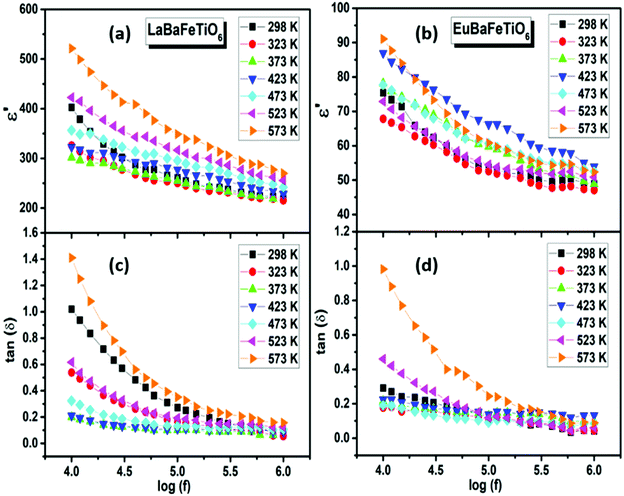
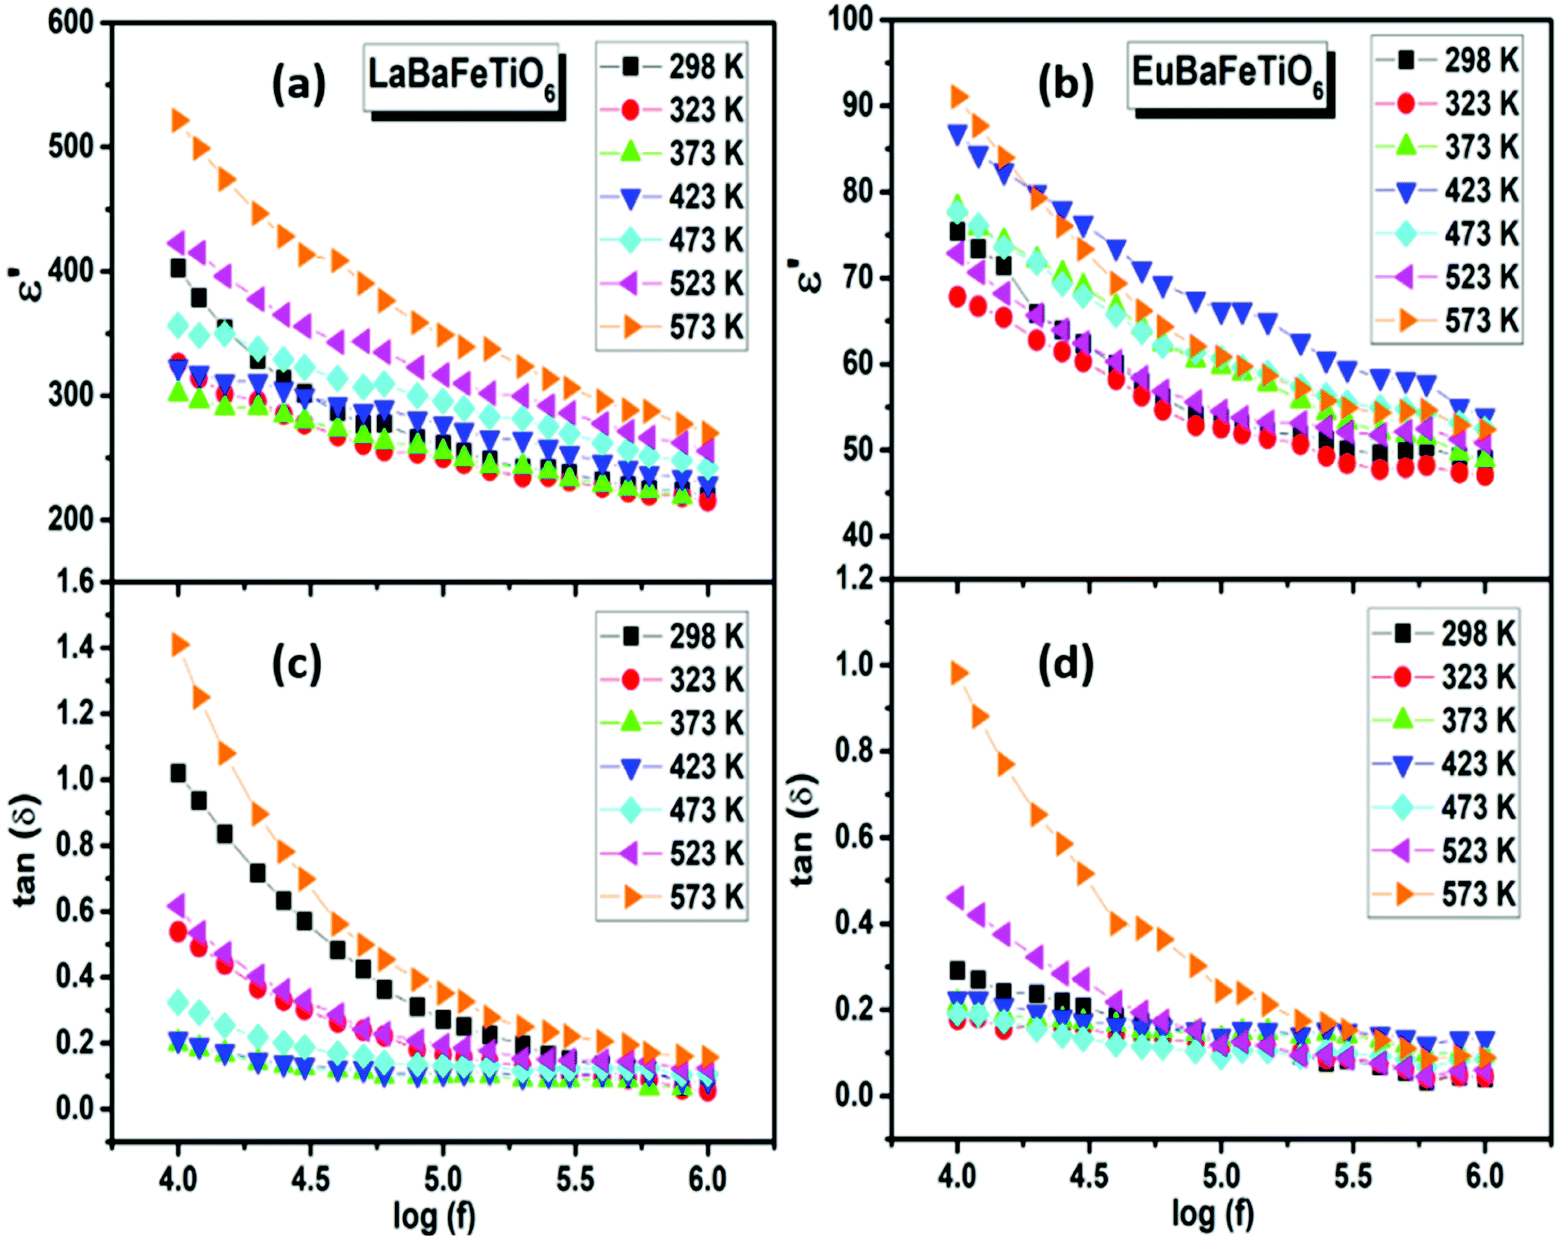
Fig. 8(a and b) represents the variation of the dielectric constant (ε′) with frequency at various temperatures. ε′ presents a continuous decrease with increasing frequency for all temperatures, then it tends to become almost frequency independent in the high frequency region. Such behavior is termed as dielectric relaxation explained on the basis of dominant polarization mechanisms changing gradually with frequency due to the difference in their characteristic times.41,44 At low frequencies, all polarization mechanisms contribute to the dielectric constant. With the frequency rise, the contributions of these various types of polarizations decrease progressively and hence the dielectric constant decreases along with frequency. The frequency dependence of loss factor (tanδ) is shown in Fig. 8(c and d). The tanδ values display an inverse frequency dependence explained by the dipole rotation mechanism. At low frequencies, a large number of dipoles align themselves along the applied field and contribute fully to the polarization, giving rise to a large value of the loss factor. At higher frequencies, the dipoles react weakly to the applied field, since the variation in the field is so rapid for them, and hence the orientational polarization ceases and no energy is required to rotate the dipoles. The low values of dielectric loss in the high-frequency region suggest that the good crystalline quality of these materials and offers potential for use in the electronic and electrical industry.45,46
 |
| | Fig. 8 (a and b) Frequency dependence of dielectric constant (ε′) and (c and d) loss factor (tanδ) at various temperatures. | |
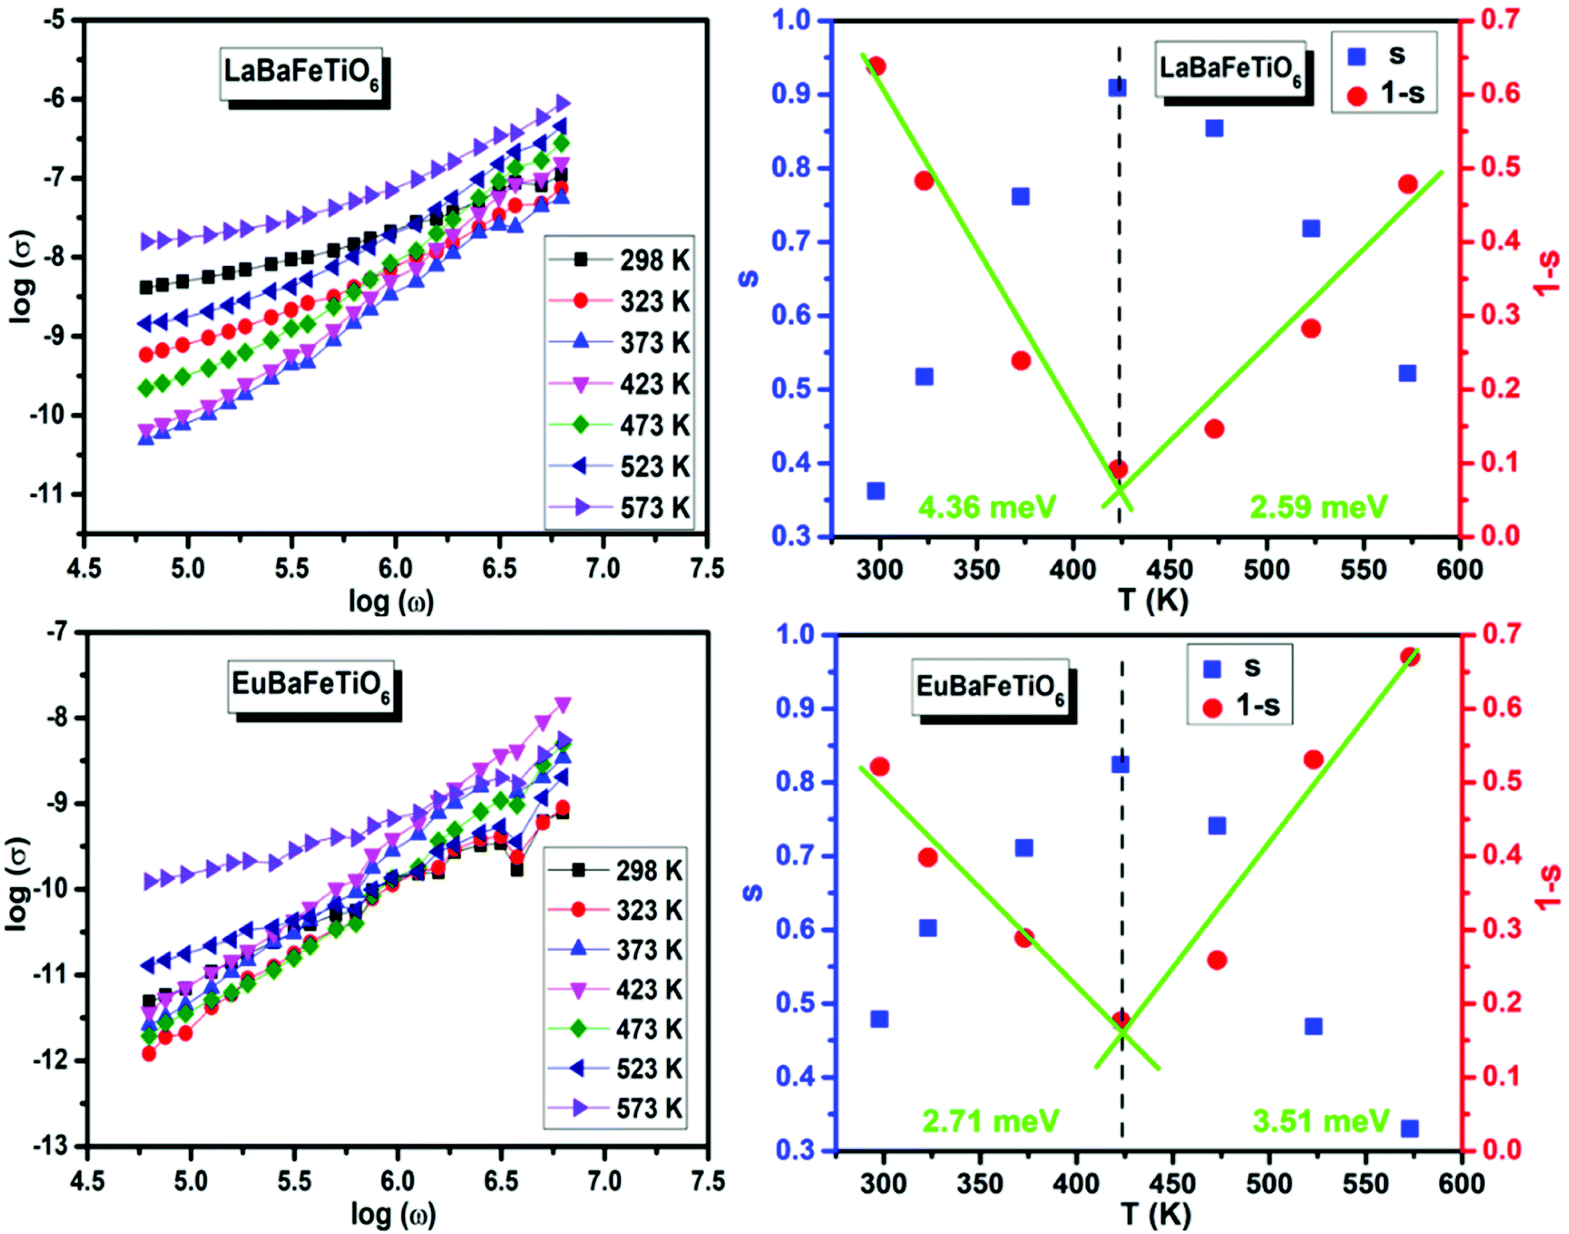
Fig. 9 depicts the frequency (angular) dependence of electrical conductivity (σ) at different temperatures. σ(ω) displays a frequency independent plateau at low frequencies and disperses at higher ones. The plateau region, corresponding to dc conductivity (σdc), is found to be extended toward higher frequencies with rise temperature, and hence the dispersion frequency termed as hopping frequency increases with increasing temperature. The change in σdc with temperature implies that the electrical conduction process is thermally activated. The overall conduction behavior suggests that electrical conductivity occurs via hopping mechanism governed by the Jonscher's power law:47
| | |
σ = σdc + σac = σdc + AωS
| (8) |
where
σdc is the dc conductivity corresponding to the frequency-independent conductivity, whereas the ac conductivity
σac describes the frequency dispersion.
A is a pre-exponential factor and
S the power law exponent (0 <
S < 1) calculated from the linear fit of log–log plots.
Table 2 shows the obtained ‘
S’ exponents for both materials at different temperatures. The noticed temperature dependence suggests that the electrical conduction in the material is due to the thermally activated process. Several theoretical models were used to describe the temperature dependence of ‘
S’.
48 One can observe that the exponent ‘
S’ increases with temperature until 423 K, before exhibiting a continuous decrease at higher temperatures. This trend implies that the conduction mechanism in these materials is dominated by two conduction mechanisms,
i.e. non-overlapping small polaron tunneling and correlated barrier hopping mechanisms respectively. Therefore, these results are evidence for the similarity of the conduction mechanisms established in these materials. Furthermore, the values of
S do not exceed 1, which indicates that the electrical conduction mechanism occurs with sudden hopping as explained by Funke.
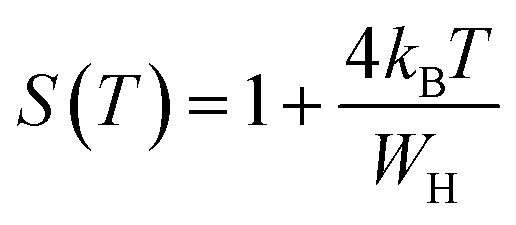
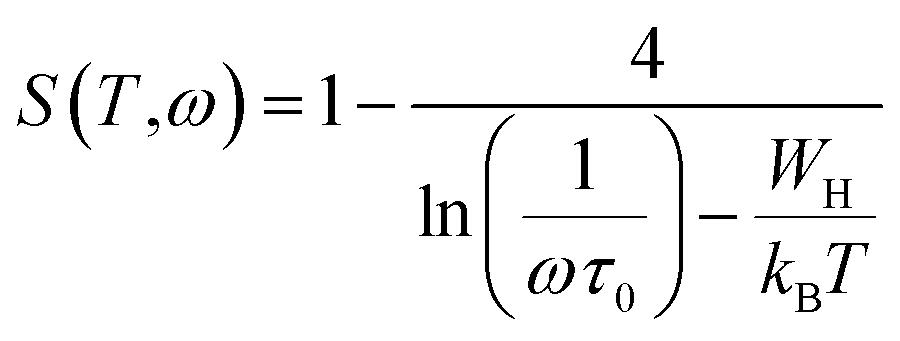
49 For non-overlapping small polaron tunneling (NSPT) mechanism, the parameter S varies as:
50| |
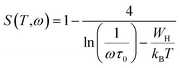 | (9) |
where
WH is the polaron hopping energy,
kB the Boltzmann constant, and
τ0 the characteristic relaxation time. For larger values of

,
S exponent is re-established as:
| |
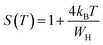 | (10) |
 |
| | Fig. 9 Frequency (angular) dependence of the conductivity (σ) at fixed temperatures and thermal evolution of S and (1 − S) parameters. | |
Table 2 Power law exponent (S) values for different temperatures
| Temperature (K) |
298 |
323 |
373 |
423 |
473 |
523 |
573 |
| SLaBaFeTiO6 |
0.36 |
0.52 |
0.76 |
0.91 |
0.85 |
0.72 |
0.52 |
| SEuBaFeTiO6 |
0.48 |
0.60 |
0.71 |
0.82 |
0.74 |
0.47 |
0.33 |
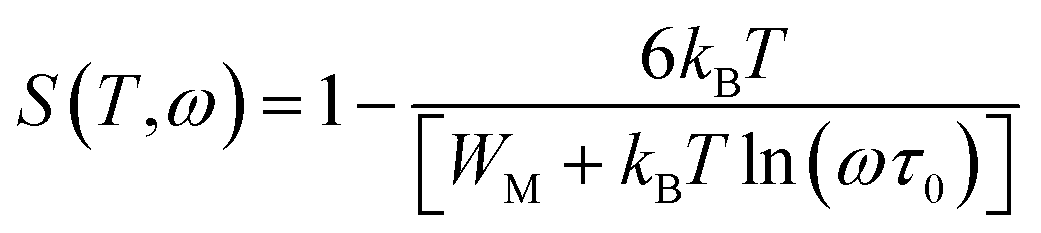
However, in the case of the correlated barrier hopping (CBH) the exponent S is expressed as:51
| |
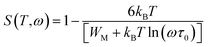 | (11) |
where
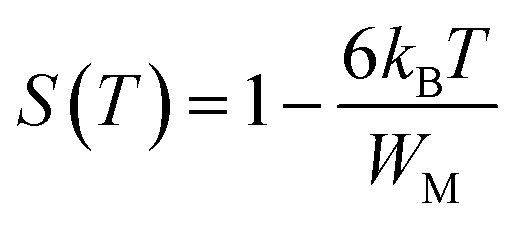
WM is the binding energy needed to move a charge carrier from one site to another. In the case of
WM ≫
kBTln(
ωτ0), this relation is simplified as:
| |
 | (12) |
Thus, the parameters WH and WM were calculated using the slope of (1 − S) line as a function of temperature (Fig. 9), giving WH = 4.36 meV and WM = 2.59 meV for LaBaFeTiO6, and WH = 2.71 meV and WM = 3.51 meV for EuBaFeTiO6.
3.5. Impedance investigation
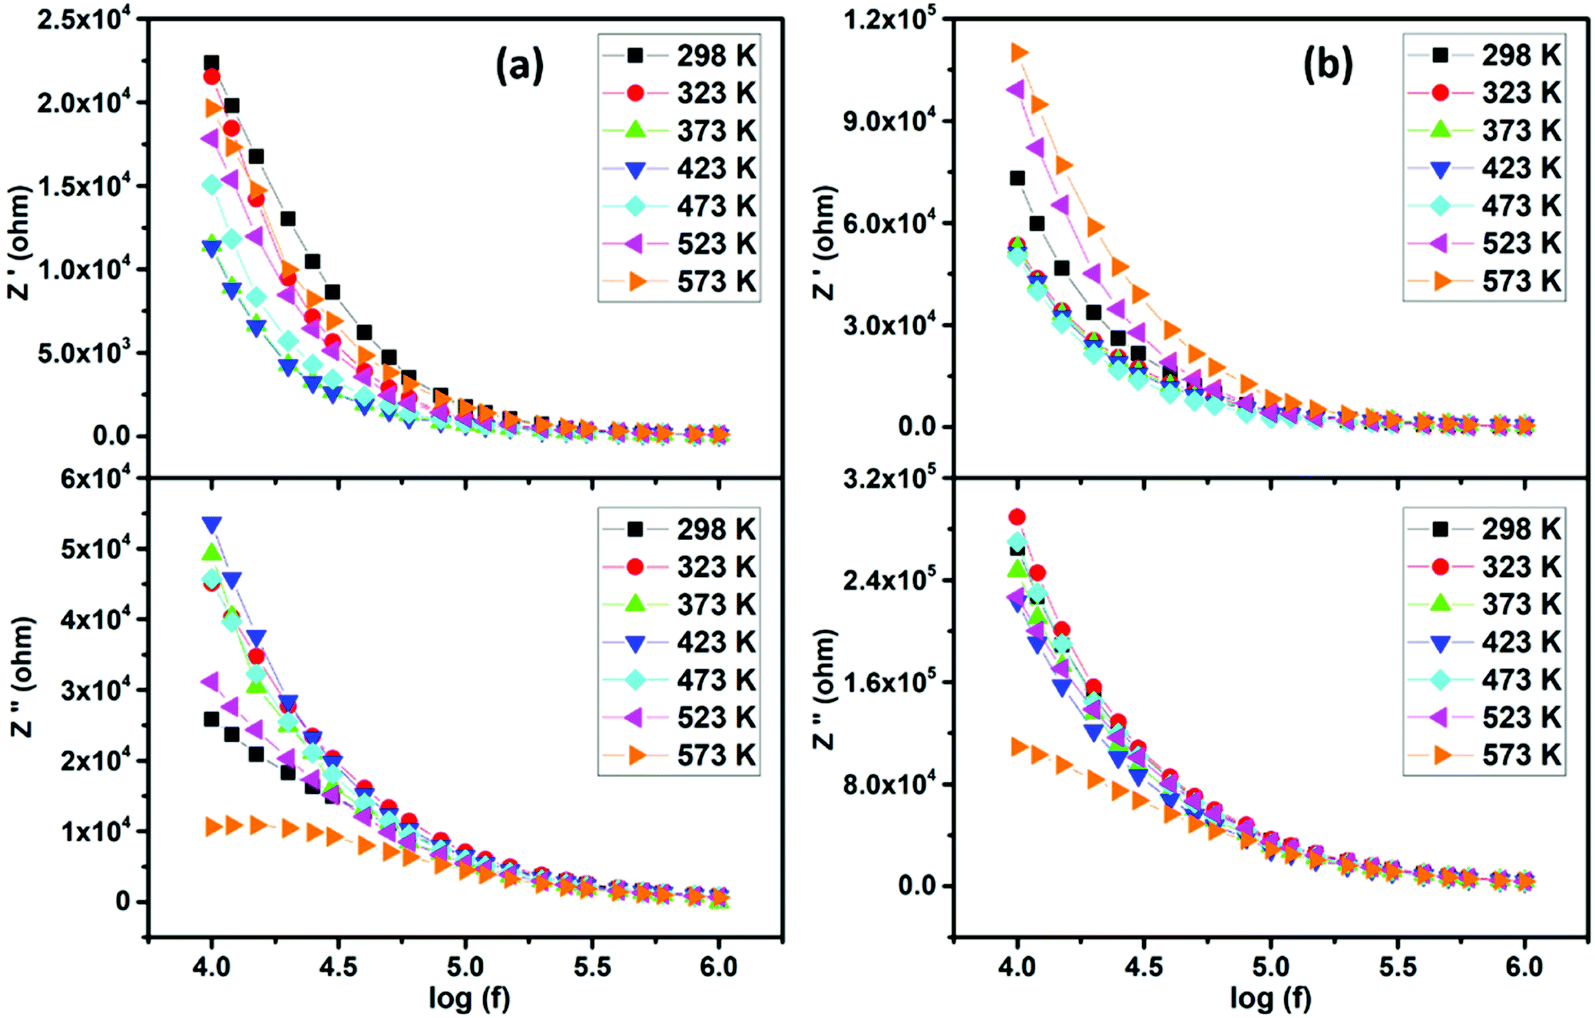
The frequency dependence of real (Z′) and imaginary (−Z′′) parts of electric impedance at various temperatures is represented in Fig. 10. One can observe that the magnitude of Z′ decreases with increasing frequency, in accordance with the observed increase in ac conductivity (Fig. 9). With further rise in frequency, the real part of impedance merges to a constant value for all selected temperatures, which may be assigned to the release of space charge polarization. Moreover, with increasing temperature, the Z′ values decrease and rise, describing the typical negative and positive temperature coefficient behaviors (NTCR, PTCR).
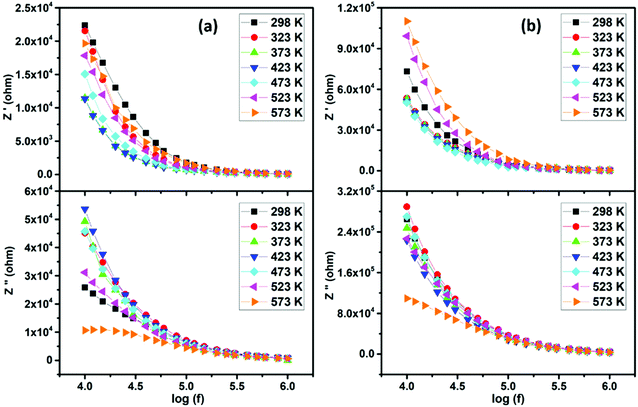 |
| | Fig. 10 Frequency dependent real and imaginary parts of impedance for (a) LaBaFeTiO6 and (b) EuBaFeTiO6. | |
This feature suggests the possible use of these materials as PTC and NTC thermistors.52 However, it is clear from the loss spectra that the imaginary part (−Z′′) represents a higher value in the low frequency region, before decreasing with increasing frequency and reaching a low value. It can also be seen that Z′′ represents a step like anomaly at 573 K. The absence of this trend for lower temperatures is certainly attributed to the fact that the peaks maxima for the other temperatures move to the low frequency side with decreasing temperature, before that the curves finally merge in the high frequency region. Such trend is indicative of thermally activated relaxation with distributed relaxation times.
4. Conclusions
Double perovskites RBaFeTiO6 (R = La, Eu) have been studied with a variety of experimental characterizations, in order to investigate the effect of rare earth element on their structural, morphological, vibrational, optical and dielectric properties. Rietveld refinement of X-ray diffraction patterns revealed that these materials belong to the double perovskite family and crystallize in a cubic structure (Pmm (#221) space group). The occupancies of La3+/Ba2+ ions at A-sites and Fe3+/Ti4+ ions at B-sites are disordered in these materials. The effect of rare earth element on density and porosity are also reported. These two materials are found to represent an irregularly shaped grains with non-uniform size distribution. Besides, the La-based sample presents a smaller crystallite and grain size in compared to the Eu-based sample as confirmed by Scherrer's equation, Williamson–Hall analysis and Scanning Electron Micrographs. The evidence of the expected stoichiometry of RBaFeTiO6 was deduced by X-ray dispersive spectroscopy, while the homogenous distribution of all elements was verified through the elemental mapping. The recorded FTIR spectra, dominated by the M–O (M = Ba, Fe, Ti) vibration bands, proved the effect of the rare earth element on the bond lengths and the vibrational properties of these double perovskites. Different active modes were identified by the Raman spectroscopic analysis, noting that the higher frequency region modes point to the presence of magnetic ordering in the material. Moreover, both materials are found to exhibit a large direct band gap with an energy of 3.75 eV for LaBaFeTiO6 and 3.53 eV for EuBaFeTiO6. Dielectric relaxation and low loss are highlighted from frequency dependent permittivity. Electrical conduction follows Jonscher's universal power law for both double perovskites. We showed that electrical conduction is dominated by NSPT mechanism at low temperatures and CBH at high ones. The overall analysis of the impedance features indicated the presence of NTCR/PTCR-like behavior in both samples.
Conflicts of interest
There are no conflicts to declare.
References
- C. Li, K. C. K. Soh and P. Wu, J. Alloys Compd., 2004, 372, 40–48 CrossRef CAS.
- T. Ishihara, Inorganic perovskite oxides, in Springer Handbook of Electronic and Photonic Materials, Springer, Cham, 2017, vol. 1 Search PubMed.
- A. Hossain, P. Bandyopadhyay and S. Roy, J. Alloys Compd., 2018, 740, 414–427 CrossRef CAS.
- R. Roy, J. Am. Ceram. Soc., 1954, 37(12), 581–588 CrossRef CAS.
- S. Vasala and M. Karppinen, Prog. Solid State Chem., 2015, 43, 1–36 CrossRef CAS.
- T. Saha-Dasgupta, Mater. Res. Express, 2020, 7(1), 014003 CrossRef CAS.
- A. R. Jha, Rare earth materials: properties and applications. CRC Press, 2014 Search PubMed.
- S. Ravi, J. Rare Earths, 2018, 36(11), 1175–1178 CrossRef CAS.
- A. Hossain, A. A. Ullah, P. S. Guin and S. Roy, J. Sol-Gel Sci. Technol., 2020, 93(3), 479–494 CrossRef CAS.
- R. N. Mahato, K. Sethupathi and V. Sankaranarayanan, J. Appl. Phys., 2010, 107, 09D714 CrossRef.
- S. Chanda, R. Maity, S. Saha, A. Dutta and T. P. Sinha, J. Sol-Gel Sci. Technol., 2021, 99(3), 600–613 CrossRef CAS.
- K. Parida, S. K. Dehury and R. N. P. Choudhary, Phys. Lett. A, 2016, 380, 4083–4091 CrossRef CAS.
- R. N. Mahato, K. K. Bharathi, K. Sethupathi, V. Sankaranarayanan, R. Nirmala, A. K. Nigam and J. Lamsal, J. Appl. Phys., 2009, 105, 07A908 CrossRef.
- R. Hu, R. Ding, J. Chen, J. Hu and Y. Zhang, Catal. Commun., 2012, 21, 38–41 CrossRef CAS.
- Y. Aharbil, H. Labrim, S. Benmokhtar, M. A. Haddouch, L. Bahmad, A. Belhaj, H. Ez-Zahraouy and A. Benyoussef, Mater. Chem. Phys., 2016, 183, 588–594 CrossRef CAS.
- G. Song, G. Li, B. Gao, F. Liang and J. Zhang, J. Alloys Compd., 2017, 690, 923–929 CrossRef CAS.
- R. Nath Mahato, K. Sethupathi, V. Sankaranarayanan, R. Nirmala, A. K. Nigam and S. K. Malik, J. Appl. Phys., 2011, 109, 07E319 CrossRef.
- U. Shankar, P. K. Agarwal, R. Pandey and A. K. Singh, Solid State Sci., 2016, 52, 78–82 CrossRef CAS.
- A. A. Elbadawi, O. A. Yassin and A. A. Gismelseed, J. Magn. Magn. Mater., 2013, 326, 1–6 CrossRef CAS.
- J. Rodríguez-Carvajal, FullProf, CEA/Saclay, France, 2001 Search PubMed.
- B. H. Toby, Powder Diffr., 2006, 21(1), 67–70 CrossRef CAS.
- K. Momma and F. Izumi, J. Appl. Crystallogr., 2011, 44(6), 1272–1276 CrossRef CAS.
- V. M. Goldshmidt, Geochemische Verteilungsgesetetze de Element VII, VIII, 1927/ 1928 Search PubMed.
- M. J. Iqbal and M. N. Ashiq, Chem. Eng. J., 2008, 136(2–3), 383–389 CrossRef CAS.
- U. Holzwarth and N. Gibson, Nat. Nanotechnol., 2011, 6(9), 534 CrossRef CAS PubMed.
- G. K. Williamson and W. H. Hall, Acta Metall., 1953, 1(1), 22–31 CrossRef CAS.
- B. P. Barbero, J. A. Gamboa and L. E. Cadús, Appl. Catal., B, 2006, 65(1–2), 21–30 CrossRef CAS.
- R. Hu, C. Li, X. Wang, Y. Sun, H. Jia, H. Su and Y. Zhang, Catal. Commun., 2012, 29, 35–39 CrossRef CAS.
- G. S. Rao, C. N. R. Rao and J. R. Ferraro, Appl. Spectrosc., 1970, 24(4), 436–445 CrossRef CAS.
- L. Ramajo, M. S. Castro and M. M. Reboredo, Composites, Part A, 2007, 38(8), 1852–1859 CrossRef.
- M. A. Araghi, N. Shaban and M. Bahar, Mater. Sci.-Pol., 2016, 34(1), 63–68 CrossRef.
- B. N. Parida, D. K. Pattanayak, R. K. Parida, B. Mohanty and N. C. Nayak, J. Mol. Struct., 2019, 1189, 288–298 CrossRef CAS.
- G. Davidson, Spectroscopic properties of inorganic and organometallic compounds, Royal Society of chemistry, 1993, vol. 26 Search PubMed.
- V. C. Chavan, S. E. Shirsath, M. L. Mane, R. H. Kadam and S. S. More, J. Magn. Magn. Mater., 2016, 398, 32–37 CrossRef CAS.
- G. R. Gordani, A. Ghasemi and A. Saidi, Ceram. Int., 2014, 40(3), 4945–4952 CrossRef CAS.
- J. Rychlewski, J. Appl. Math. Mech., 1984, 48(3), 303–314 CrossRef.
- J. S. Punitha, M. Dhilip, V. Anbarasu, A. Nataraj and K. S. Kumar, AIP Conf. Proc., 2019, 2117(1), 020010 CrossRef.
- J. S. Punitha, M. Dhilip, V. Anbarasu and K. S. Kumar, AIP Conf. Proc., 2019, 2115(1), 030468 CrossRef.
- D. Triyono, IOP Conf. Ser.: Mater. Sci. Eng., 2020, 902(1), 012027 Search PubMed.
- J. Tauc, Mater. Res. Bull., 1968, 3(1), 37–46 CrossRef CAS.
- L. Boudad, M. Taibi, A. Belayachi and M. Abd-Lefdil, J. Mater. Sci.: Mater. Electron., 2020, 31(1), 354–360 CrossRef CAS.
- G. Volonakis, N. Sakai, H. J. Snaith and F. Giustino, J. Phys. Chem. Lett., 2019, 10(8), 1722–1728 CrossRef CAS PubMed.
- J. Zhou, Z. Xia, M. S. Molokeev, X. Zhang, D. Peng and Q. Liu, J. Mater. Chem. A, 2017, 5(29), 15031–15037 RSC.
- A. K. Jonscher, IEEE Trans. Electr. Insul., 1992, 27(3), 407–423 CrossRef.
- K. Yang, X. Huang, Y. Huang, L. Xie and P. Jiang, Chem. Mater., 2013, 25(11), 2327–2338 CrossRef CAS.
- N. Nithya, R. Mahalakshmi and S. Sagadevan, Mater. Res., 2015, 18, 581–587 CrossRef CAS.
- A. K. Jonscher, J. Mater. Sci., 1978, 13(3), 553–562 CrossRef CAS.
- A. Ghosh, Phys. Rev. B: Condens. Matter Mater. Phys., 1990, 41(3), 1479 CrossRef CAS PubMed.
- K. Funke, Prog. Solid State Chem., 1993, 22(2), 111–195 CrossRef CAS.
- A. R. Long, Adv. Phys., 1982, 31(5), 553–637 CrossRef CAS.
- S. R. Elliott, Adv. Phys., 1987, 36(2), 135–217 CrossRef CAS.
- M. Rahaman, T. K. Chaki and D. Khastgir, J. Mater. Sci., 2013, 48(21), 7466–7475 CrossRef CAS.
|
| This journal is © The Royal Society of Chemistry 2021 |
Click here to see how this site uses Cookies. View our privacy policy here. 
 Open Access Article
 This Open Access Article is licensed under a Creative Commons Attribution-Non Commercial 3.0 Unported Licence
 *a,
M. Taibia,
A. Belayachib and
M. Abd-lefdilb
*a,
M. Taibia,
A. Belayachib and
M. Abd-lefdilb

 . The average crystallite sizes calculated based on the most intense diffraction peak are about 63 nm and 83 nm for the LaBaFeTiO6 and EuBaFeTiO6 samples, respectively. The crystallite size was also estimated using the Williamson–Hall method based on the following relation:26


 , S exponent is re-established as: