 Open Access Article
Investigation of element migration characteristics and product properties during biomass pyrolysis: a case study of pine cones rich in nitrogen
Jielong Wu†
,
Liangcai Wang†*,
Huanhuan Ma* and
Jianbin Zhou *
*
College of Materials Science and Engineering, Nanjing Forestry University, Nanjing, 210037, China. E-mail: wangliangcai@njfu.edu.cn; mahuanhuan@njfu.edu.cn; zhoujianbin@njfu.edu.cn
First published on 27th October 2021
Abstract
To further understand the element migration characteristics and product properties during biomass pyrolysis, herein, pine cone (PC) cellulose and PC lignin were prepared, and their pyrolysis behavior was determined using thermogravimetric analysis (TGA). Subsequently, the PC was pyrolyzed in a vertical fixed bed reactor system at 400–700 °C for 60 min. The characteristics of element migration and the physicochemical properties of the pyrolysis products were analyzed and discussed. In the pyrolysis temperature range from 200 °C to 500 °C, there were two distinct weight loss peaks for PC. During the pyrolysis process, the C element was primarily retained in the biochar, while the O element mainly migrated into liquid and gaseous products in the form of compounds such as CO2, CO, and H2O. Besides, 28.42–76.01% of the N element in PC migrated into biochar. Of the three-phase products, the gases endow the lowest energy yield, while the energy of the biochar dominates the pyrolysis of the PC. Additionally, the N content and specific surface area for the PC-derived biochar obtained at 400 °C in a N2 atmosphere were higher than those of the biochar derived from fiberboard.
1. Introduction
Biomass is a clean and renewable resource, resulting from its wide distribution, abundance, CO2 neutrality, and low emission of nitrogen and sulfur compounds.1–3 Unfortunately, the high water and oxygen contents of biomass lead to some drawbacks such as low burning rates and low flame temperatures for biomass combustion, as well as transport difficulties.4–6 Thus, relevant researchers often employ thermochemistry or biotechnology to convert biomass into solids, gases, and liquids to enhance the quality of biomass for integrated use, of which pyrolysis is a promising thermochemical process for biomass utilization.7 As is known, the pyrolysis of biomass involves a transformation of its phase. Meanwhile, the parent substance (i.e., biomass) and the derivatives (i.e., solids, gases, liquids) possess inherited relationships. As a result, the element content of the parent substance and the derivatives is a critical indicator of the degree of inheritance. It follows that it is essential to investigate the migration of elements during biomass pyrolysis.Previous works have indicated that the release of CO2 and CO during low-temperature (200–350 °C) pyrolysis (viz. torrefaction) of biomass allows for the elimination of oxygen faster than that caused by pure dehydration.8–15 Recently, numerous studies have shown that torrefaction can increase the carbon content and calorific value of biomasses, and reduce their oxygen content.16–19 According to these, we can conclude that torrefaction leads to changes in the content of O and C elements, especially the O element. In other words, torrefaction causes the migration of O and C elements from biomass. Notably, most of the biomass torrefaction research has focused on the solid products of biomass, and the physiochemical changes, fuel properties, and further uses of torrefied biomass have been extensively reported.20,21 In fact, in addition to the solid products, there are small amounts of gaseous and liquid products.22,23 However, relatively few systematic studies have been performed on the migration laws of carbon and oxygen elements as the collection of small amounts of gaseous and liquid products is difficult. Biomass pyrolysis (400–800 °C) can significantly increase the yield of gaseous and liquid products.
On the other hand, previous studies have indicated that the doping of carbon-based materials with other heteroatoms (e.g., N, P, and S) can further improve their properties.24–26 Schnucklake et al.27 synthesized nitrogen-doped porous carbon using phenolic resin as the carbon source and pyrrole-2-carboxaldehyde as the nitrogen source. It was presented that the nitrogen-doped porous carbon shows promising activity for the positive side reaction. Laheäär et al.28 used ammonia gas as the nitrogen source to modify activated carbon and indicated that the nitrogen-doped activated carbon with a nitrogen content of 4.50 wt% and a specific capacitance of 152 Fg−1. Xu et al.29 obtained biochar with 3.16 wt% N content by pyrolyzed the fiberboard containing phenolic resin. It was found that the biochar derived from fiberboard had a better adsorption effect on tetracycline. These previous studies have made significant progress in understanding that doped with N can enhance the active site of carbon. However, exogenous nitrogen (e.g., pyrrole-2-carboxaldehyde, ammonia gas, and phenolic resin) doping is not conducive to the uniform distribution of nitrogen in carbon materials, accompanied by the high cost. Therefore, biomass feedstocks with high nitrogen possess the potential to address the problem of uneven nitrogen doping and improve the active site of biomass-derived carbon. It follows that the nitrogen migration laws during pyrolysis of biomass feedstocks with high nitrogen are worthy of prior investigation.
Interestingly, pine cone (PC) is rich in nitrogen as an agroforestry waste, which is higher than that of other biomass like rice straw and grape stem, as well as is abundant in China.7,13 However, until now, most of the research on PC has focused on the development and investigation of natural medicinal extracts.30 Consequently, the pyrolysis behavior of PC and the migration law of C, O, and N elements in the pyrolysis process have not been reported yet. In the present work, the physicochemical properties for biochar, liquid, and gaseous products generated at different temperatures were determined via proximate analysis, ultimate analysis, Karl–Fischer titration, and so on. Overall, this work has made further understand of the deoxygenation, decarbonization, and denitrogenation from PC during pyrolysis at different temperatures.
2. Experimental section
2.1. Materials
Pine cone (PC), employed as the feedstock for the pyrolysis experiment, was sourced from the Kuandian, Liaoning Province of China. Before the test, the PC was dried in an oven at 105 °C for 24 h and then ground into a powder with a particle size of 0.130–0.180 mm. The PC cellulose and the PC lignin were prepared regarding the Chinese National Standards GB/T2677.10-1995 and the Chinese National Standards GB/T2677.8-1994, respectively.2.2. Thermogravimetric experiment
Weigh loss characteristics of samples were carried out in TGA (TGA STA8000, PerkinElmer, Waltham, MA, USA). For each experiment, the sample weight, nitrogen flow rate, heating rate, and final pyrolysis temperature were ∼10 mg, 50 mL min−1, 20 °C min−1, and 700 °C, respectively.2.3. Pyrolysis experiment
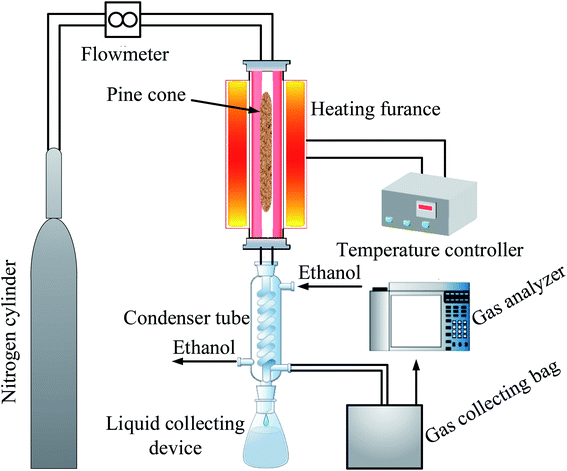
The pyrolysis experiment was employed in a vertical fixed-bed (Blue M, Thermo Scientific, USA) reactor system, as presented in Fig. 1.Approximately 30 g of PC was placed into the reactor, and before the experiment, the reactor was purged with nitrogen to remove air from the reactor, and then the nitrogen was turned off after 10 min. Subsequently, the operating parameters (temperatures) of the vertical fixed-bed reactor system were varied to examine the properties of biochar, liquid, and gaseous products at a residence time of 60 min. During the pyrolysis process, the biochar remained in the reactor. Meanwhile, the liquid and gaseous products were collected in a liquid collecting device and a gas collecting bag, respectively. The pyrolysis experiment was repeated 3 times under the same experimental conditions to obtain enough products for subsequent testing. Besides, the volume concentration of each gas in the gaseous product was determined by a gas analyzer (Gasboard, Ruiyi Automatic Control Co., Ltd, Hubei, China).
2.4. Sample labels
Herein, the pine cone was named PC. Besides, PC-derived biochar (pyrolyzed pine cone) was labeled as PPC-X, where X is the pyrolysis temperature. As an example, PPC-400 stands for the PC-derived biochar obtained by pyrolyzing PC upon 400 °C under a heating rate of 20 °C min−1 with a residence time of 60 min.2.5. Analysis of pyrolysis products
Proximate analysis, ultimate analysis, and HHV of PC and PPC-X were performed regarding the Chinese National Standards GB/T28731-2012, an element analyzer (Vario macro cube, Elementar, Germany), and an adiabatic oxygen bomb calorimeter (XRY-1A, Changji Geological Instruments, China), respectively. The HHV of gaseous was determined via the gas analyzer.The water content, pH, ultimate analysis, and composition of liquid were determined via Karl Fischer titration (KF-200, Mitsubishi Corporation, Japan), pH tester (E-201-C, Precision Scientific Instruments Co., Ltd, Shanghai, China), an element analyzer, and gas chromatography-mass spectrometry (Trace DSQ II, Thermo Scientific, USA), respectively.
2.6. Mass yield and energy yield of samples
Mass yield and energy yield were calculated by (1) and (2), respectively.
 | (1) |
 | (2) |
3. Results and discussion
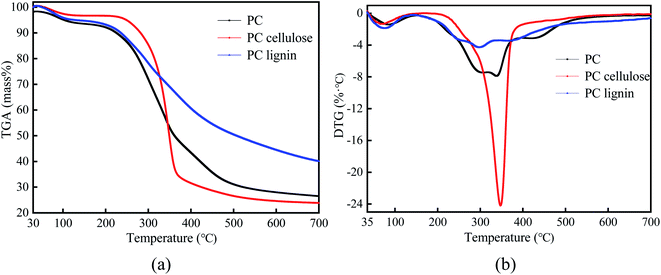
3.1. Thermogravimetric analysis of PC, PC cellulose, and PC lignin
The TGA (a) and DTG (b) curves of PC, PC cellulose, and PC lignin pyrolysis with a heating rate of 20 °C min−1 are given in Fig. 2.A notable difference was found in the pyrolysis behaviors of PC, PC cellulose, and PC lignin. The weight loss of PC happens early in the temperature ranging from 110 °C to 200 °C. Moreover, the DTG curve of PC endows two distinct weight loss peaks in the pyrolysis temperature ranging from 200 °C to 500 °C, at around 330 °C and 450 °C, respectively. Of these, the weight loss peak at about 330 °C was caused by the pyrolysis of lignin or hemicellulose, while the weight loss peak at about 450 °C was primarily ascribed to the existence of non-structural substances (e.g., wax, fat, resin, tannin, sugars, and pigments). This is significantly different from other biomass shown only one peak such as bamboo,31 pinewood,32 and wheat straw,33 while similar to palm kernel had two weight loss peaks.8 The weight percentage for the pyrolysis residue of PC being ∼26%, which was consistent with the proximate analysis of PC (Table 1). Compared with the PC, PC cellulose was pyrolyzed in the lower temperature ranging from 200 °C to 380 °C and endows a narrow range of maximum weight loss upon 220–370 °C. Meanwhile, the weight percentage for pyrolysis residue was ∼23%. Unlike the sharper DTG peaks of PC and PC cellulose, PC lignin was slowly pyrolyzed in the wider temperature ranging from 160 °C to 700 °C and generated the highest weight percentage for residue (∼40%), this result was similar to the previous publication.8 Thence, the thermal stability of samples was determined: PC lignin > PC > PC cellulose.34
| Samples | Proximate analysis (wt%, db) | Ultimate analysis (wt%, db) | HHV (MJ kg−1) | Energy yield (%) | ||||||
|---|---|---|---|---|---|---|---|---|---|---|
| Volatile | Fixed carbon | Ash | C | H | N | S | O | |||
| PC | 73.98 ± 0.95 | 23.41 ± 0.44 | 2.61 ± 0.26 | 43.99 ± 0.49 | 3.65 ± 0.05 | 1.67 ± 0.07 | 0.51 ± 0.02 | 47.57 ± 0.89 | 17.86 ± 0.52 | 100 |
| PPC-400 | 20.46 ± 0.77 | 71.69 ± 0.46 | 5.70 ± 0.32 | 66.11 ± 0.52 | 2.21 ± 0.04 | 2.79 ± 0.06 | 0.79 ± 0.03 | 22.40 ± 0.97 | 28.92 ± 0.59 | 73.68 |
| PPC-500 | 16.57 ± 0.81 | 75.30 ± 0.49 | 7.99 ± 0.29 | 70.63 ± 0.48 | 1.09 ± 0.06 | 1.72 ± 0.05 | 0.53 ± 0.01 | 18.04 ± 0.89 | 29.68 ± 0.45 | 54.39 |
| PPC-600 | 11.99 ± 0.87 | 79.47 ± 0.51 | 8.61 ± 0.34 | 74.07 ± 0.55 | 0.63 ± 0.03 | 1.65 ± 0.07 | 0.20 ± 0.02 | 14.84 ± 1.01 | 30.08 ± 0.65 | 51.01 |
| PPC-700 | 9.48 ± 0.79 | 81.15 ± 0.45 | 8.96 ± 0.27 | 74.63 ± 0.51 | 0.53 ± 0.04 | 1.63 ± 0.06 | 0.15 ± 0.01 | 14.10 ± 0.88 | 30.31 ± 0.63 | 49.42 |
3.2. Pyrolysis of PC
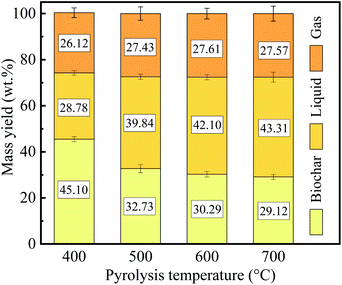
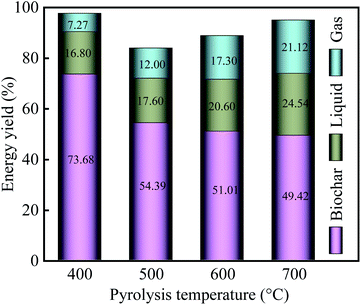
It is well known that the weight loss of PC during pyrolysis primarily resulted from the evaporation of volatiles. Fig. 4 shows the product distribution of the PC pyrolysis at different temperatures.
From Fig. 4, it can seem that an increase in pyrolysis temperature, resulting in an outstanding reduction in the yield of biochar, but the yield of liquid presented a gradual increase. Meanwhile, the yield of gas has no significant difference.
The weight loss gradually increased with the pyrolysis temperature from 400 °C to 700 °C, and had a relatively considerable weight loss (70.88%) at 700 °C, since the hemicellulose, cellulose, lignin, and non-structural substances of PC strongly decomposed.36 However, the increase in weight loss gradually slows down as the pyrolysis temperature increases. The sum of the yield of liquid and gas increased as the pyrolysis temperature increases, which was mainly attributed to the thermal cracking and lead to the formation of more volatiles.37 The effect of pyrolysis temperature on PC mass yield was similar to the effect on other biomass (e.g., cotton stalk, eucalyptus, and rice husk).38–40
3.2.2.1 Physicochemical properties of biochar. Physicochemical properties for biochar are listed in Table 1.
The pyrolysis temperature has a notable effect on the physicochemical properties of biochar. The content of volatile gradually decreased as the pyrolysis temperature increases, such as 20.46% for PPC-400 and only 9.48% for PPC-700. Conversely, as the pyrolysis temperature increases, the ash content increased as a result of the ash remaining in the PC. Meanwhile, the content of fixed carbon equally increased significantly. Similar results were obtained for coffee chaff41 and Japanese cedar.42 This suggests that the pyrolysis temperature resulted in lower volatile content, while the higher ash content was due to enhanced thermal decomposition for the PC. In addition, the nitrogen content of PPC-400 was higher, which was 2.79%, and the nitrogen content was over those of other biochar such as coffee chaff biochar,41 rick husk biochar,43 and date seeds biochar.44 However, the nitrogen content of PPC-400 was similar to that of fiberboard biochar.29 In reviewing the literature, Li et al.45 indicated the nitrogen content of bamboo biochar detected by element analyzer and XPS being 0.6% and 0.4%, respectively. Wang et al.46 demonstrated the nitrogen content for lignin-derived porous carbon determined by element analyzer and XPS is 0.24% and 0%, respectively. Similarly, Xu et al.29 illuminated the nitrogen content for fiberboard biochar detected by element analyzer and XPS being 3.42% and 2%, respectively. Notably, the nitrogen element content detected by an element analyzer is higher than the nitrogen element content detected by XPS. A plausible explanation for this result can be given as follows: element analyzer and XPS work on different principles. For the elemental analyzer, the element content of samples is determined by the detector after combustion, secondary combustion, reduction, and interference gas removal, while XPS according to Einstein's photoelectron effect to determines the elemental content on the surface of samples. In other words, ultimate analysis demonstrates the elemental composition of samples, while XPS determines elemental content on the surface of samples. As such, when discussing the migration law of the N element, the N element determined by XPS will not be discussed if not mentioned otherwise.
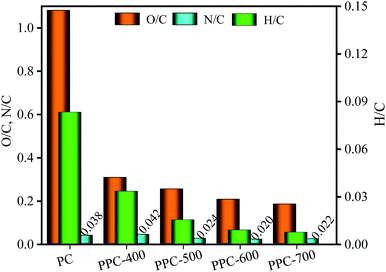
3.2.2.2 H/C, O/C, and N/C element rations. The S content of PC was intensely low and did not change much during the pyrolysis process. As the pyrolysis temperature increases, the formation and release of CH4 and C2H6 lead to a slight decrease in H content. Besides, the content of both C and O in PC exceeds 40%. A sharp decrease in O content, from 45.57% for PC to 14.10% for PPC-700 with increasing the pyrolysis temperature. Notably, the C element was released during pyrolysis, but the C content increased increasingly, from 43.99% for PC to 74.63% for PPC-700, which was because of the weight loss of PC and the removal of a major amount of O element. In addition, the N element enrichment and N element release have effects on the N content of biochar during the pyrolysis process. The N content of PPC-400 was higher than that of PC, PPC-500, PPC-600, and PPC-700; from this, we can infer that the enrichment of N element was higher than the release of N element upon pyrolysis temperature was 400 °C.
Fig. 5 shows variation in H/C, O/C, and N/C element rations for the PC and biochar along with pyrolysis temperature.
With an increase in pyrolysis temperature, the element ratios of N/C increased at first, and then they slowly decreased and tended to be stable. However, the element ratios of H/C and O/C for the biochar gradually decreased as the pyrolysis temperature increases. This indicates that large amounts of H and O elements were removed from the PC, while the C element was enriched during the pyrolysis process. Compared to the ranges of the H/C and O/C element ratios found in the previous publication for lignite, peat, bitumen, and anthracite, the PC contains more O and H elements than all coals.47
| Samples | Ultimate analysis (wt%) | Water content of liquid (wt%) | pH | HHV (MJ kg−1) | Energy yield (%) | |||
|---|---|---|---|---|---|---|---|---|
| C | H | N | O | |||||
| a L-XXX stands for liquid obtained from pyrolysis of PC at XXX temperature. | ||||||||
| L-400 | 8.21 ± 0.32 | 4.76 ± 0.03 | 0.62 ± 0.03 | 86.41 ± 0.62 | 73.03 ± 1.32 | 3.25 ± 0.27 | 10.40 | 16.80 |
| L-500 | 7.99 ± 0.41 | 6.13 ± 0.04 | 0.64 ± 0.02 | 85.24 ± 0.53 | 74.56 ± 1.27 | 3.71 ± 0.32 | 7.89 | 17.60 |
| L-600 | 7.76 ± 0.35 | 5.41 ± 0.05 | 0.81 ± 0.03 | 86.02 ± 0.57 | 76.45 ± 1.36 | 4.08 ± 0.38 | 8.74 | 20.60 |
| L-700 | 7.82 ± 0.31 | 4.92 ± 0.03 | 0.92 ± 0.04 | 86.34 ± 0.62 | 77.89 ± 1.32 | 4.42 ± 0.29 | 10.12 | 24.54 |
Liquid had a C content of 7.76–8.21% and an O content of 85.24–86.41%. Meanwhile, with an increase in pyrolysis temperature, the water content of liquid gradually increased from 73.03% to 77.89%. This result suggests that increased temperature promotes the dehydration reaction. Besides, with an increase in pyrolysis temperature, the pH also increased from 3.25 to 4.42. This was mainly due to the water content of liquid gradually increased.
To compare the composition of the liquids obtained at different temperatures, L-400 and L-700 were subjected to GC/MS tests. As is known, the chromatographic peak area of a compound is considered to be linearly related to its content. Several representative compounds were selected as their comparatively higher peak area%. Table 3 lists the 30 components of L-400 with a relative content above 0.15%. Similarly, Table 4 exhibits the 34 components of L-700 with a relative content above 0.15%.
| Time (min) | Relative content (%) | Compound name | Molecular formula |
|---|---|---|---|
| 5.774 | 17.12 | Acetic acid | C2H4O2 |
| 11.961 | 9.08 | Furfuryl alcohol | C5H6O2 |
| 18.256 | 5.21 | Guaiacol | C7H8O2 |
| 17.945 | 4.23 | Phenol | C6H6O |
| 12.130 | 2.78 | 2-Methyl-2-cyclopenten-1-one | C6H8O |
| 10.411 | 2.13 | 2-Cyclopentenone | C5H6O |
| 20.411 | 1.95 | p-Cresol | C7H8O |
| 15.185 | 1.92 | 3-Methyl-2-cyclopenten-1-one | C6H8O |
| 8.704 | 1.89 | Pyrrole | C4H5N |
| 8.415 | 1.86 | Cyclopentanone | C5H8O |
| 12.632 | 1.81 | 3-tert-Butylcyclobutene | C8H14 |
| 8.049 | 1.65 | Propionic acid | C3H6O2 |
| 16.734 | 1.62 | 2,3-Dimethyl-2-cyclopenten-1-one | C7H10O |
| 19.309 | 1.59 | o-Cresol | C7H8O |
| 21.169 | 1.57 | 2-Methoxy-4-methylphenol | C8H10O2 |
| 15.338 | 1.53 | 2,3-Dimethyl-butane | C6H14 |
| 6.522 | 1.21 | Hydroxyacetone | C3H6O2 |
| 23.433 | 1.12 | 4-Ethyl-2-methoxyphenol | C9H12O2 |
| 9.484 | 1.09 | Dimethylmalonic acid | C5H8O4 |
| 6.615 | 1.03 | 2,4-Pentadienenitrile | C5H5N |
| 21.633 | 1.01 | 2,4-Dimethylphenol | C8H10O |
| 15.561 | 0.89 | 3,4-Dimethyl-2-cyclopenten-1-one | C7H10O |
| 7.378 | 0.85 | 2-Methyl-2-pentanol | C6H14O |
| 14.918 | 0.80 | 2,3-Dimethyl-2-cyclopenten-1-one | C7H10O |
| 9.670 | 0.72 | 2-Methylcyclopentanone | C6H10O |
| 17.007 | 0.58 | 2,3,4-Trimethyl-2-cyclopenten-1-one | C8H12O |
| 22.332 | 0.41 | Maltose | C6H6O3 |
| 8.234 | 0.34 | 4-Methylphenol | C7H8O |
| 13.758 | 0.22 | Phenol | C6H6O |
| 22.243 | 0.16 | Hydroxycarbamide | CH4O2N2 |
| Time (min) | Relative content (%) | Compound name | Molecular formula |
|---|---|---|---|
| 1.769 | 11.88 | Acetic acid | C2H4O2 |
| 12.893 | 8.92 | 1-2-Benzenediol | C6H6O2 |
| 10.492 | 4.36 | Valeraldehyde | C5H10O |
| 13.604 | 3.38 | 4-Methylcatechol | C7H8O2 |
| 5.150 | 2.46 | 2-Furan methanol | C5H6O2 |
| 11.248 | 1.96 | 3-Hydroxypyridine | C5H5ON |
| 1.589 | 1.94 | 2-Thiourea | CH4N2S |
| 2.229 | 1.89 | 3-Hydroxypropionic acid | C3H6O3 |
| 2.149 | 1.68 | Acetoxyacetic acid | C4H6O4 |
| 8.977 | 1.38 | 2-Hydroxy-3-methylcyclopent-2-enone | C6H8O2 |
| 6.406 | 1.34 | 2-Methyl-2-imidazoline | C4H8N2 |
| 10.282 | 1.20 | Guaiacol | C7H8O |
| 8.497 | 1.14 | N-Methylpiperidine | C6H13N |
| 8.056 | 0.63 | Phenol | C6H6O |
| 10.903 | 0.45 | 3-Ethyl-2-hydroxy-2-cyclopenten-1-one | C7H10O2 |
| 18.486 | 0.43 | Lauric acid | C12H24O2 |
| 10.808 | 0.40 | Maltose | C6H6O3 |
| 15.750 | 0.37 | 4-Ethylresorcinol | C8H10O2 |
| 6.516 | 0.36 | 4-Hydroxybutyric acid | C4H8O3 |
| 7.656 | 0.36 | 2,4-Dimethylfuran | C6H8O |
| 1.534 | 0.35 | Hydroxycarbamide | CH4O2N2 |
| 12.458 | 0.35 | 2-Methoxy-4-(methoxymethyl)phenol | C9H12O3 |
| 5.450 | 0.32 | Acetonyl acetate | C5H8O3 |
| 9.572 | 0.31 | Gamma-valerolactone | C5H8O2 |
| 10.082 | 0.31 | 4-Methylphenol | C7H8O |
| 17.980 | 0.31 | 4-Hydroxy-3-methoxyphenylacetone | C10H12O3 |
| 13.879 | 0.27 | 4-Hydroxy-3-methoxystyrene | C9H10O2 |
| 13.984 | 0.27 | m-Dihydroxybenzene | C6H6O2 |
| 7.846 | 0.25 | Dibuthylamine | C8H19N |
| 19.751 | 0.24 | Homovanillic acid | C9H10O4 |
| 1.564 | 0.18 | Isopropylamine | C3H9N |
| 7.001 | 0.17 | 3,5-Lutidine | C7H9N |
| 8.822 | 0.17 | 1,2,5-Trimethylpyrrole | C7H11N |
| 6.606 | 0.16 | 2,6-Dimethylpyrazine | C6H8N2 |
Table 3 indicates the top 5 products were acetic acid (17.12%), furfuryl alcohol (9.08%), guaiacol (5.21%), phenol (4.23%), and 2-methyl-2-cyclopenten-1-one (2.78%). Table 4 lists the top 5 products were acetic acid (11.88%), 1-2-benzenediol (8.92%), valeraldehyde (4.36%), 4-methylcatechol (3.38%), and 2-furan methanol (2.46%).
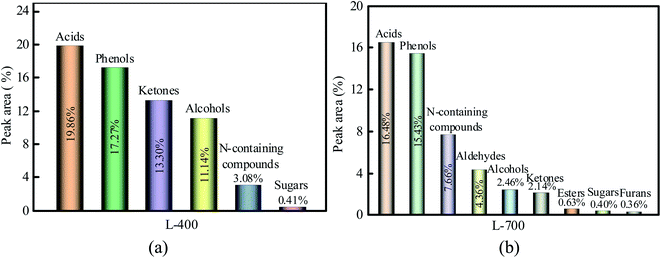
The liquids (i.e., bio-oils) are intensely complex in composition and contains an army of compounds. Although they were not likely to identify each ingredient, the liquids can be divided into several main categories according to the functional groups determined by GC/MS: acids, phenols, ketones, esters, alcohol, N-containing compounds, aldehydes, sugar, and furans. Total content for liquids ranged from 68.37% for L-400 to 50.19% for L-700, resulting from some components present in liquids were not calculated. The main components of L-400 and L-700 are shown in Fig. 6(a) and (b), respectively.
As seen in Fig. 6(a), the relative contents of acids, phenols, ketones, alcohols, N-containing compounds, and sugar were 19.86%, 17.27%, 13.30%, 11.14%, 3.08%, and 0.41%, respectively. However, the relative content of sugar was below 1.00%. Compared with L-400, L-700 (as indicated in Fig. 6(b)) had fewer acids and more N-containing compounds, which is consistent with the results of the PH as well as the ultimate analysis. Notably, the composition of L-700 is more complex than that of L-400, which suggests the high temperature leads to the secondary decomposition of many substances.
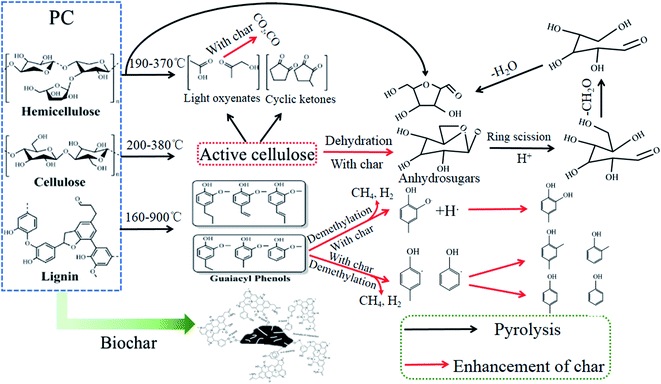
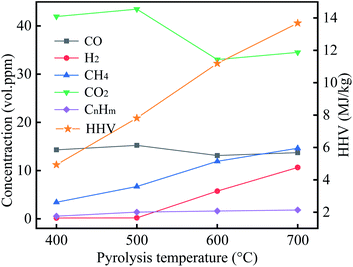
The gaseous products were primarily CO2, CO, CH4, and H2, which are derived from the decomposition of cellulose, hemicellulose, and lignin, and the mechanisms of their formation have been reported in the previous work.48 Of these, CO2 endows the highest volume concentration, followed by CO and CH4, but pyrolysis temperature was 700 °C, the CH4 volume concentration slightly more than the volume concentration of CO. With an increase in pyrolysis temperature, the CO volume concentration and the CmHn volume concentration have no significant difference, while the CH4 volume concentration and H2 volume concentration gradually increased. In reviewing the literature, CH4 is mainly derived from the pyrolysis of methoxy, methyl, and methylene in lignin.49 This suggests an increase in pyrolysis temperature, resulting in the lignin intensely decomposition, and produce more CH4, which coincides with the change of CH4 volume concentration in this study. HHV for the gases of 400 °C, 500 °C, 600 °C, and 700 °C was 4.93 MJ kg−1, 7.81 MJ kg−1, 11.19 MJ kg−1, and 13.68 MJ kg−1, respectively. These results manifested that with an increase in pyrolysis temperature, the heating values of gaseous products gradually increased.
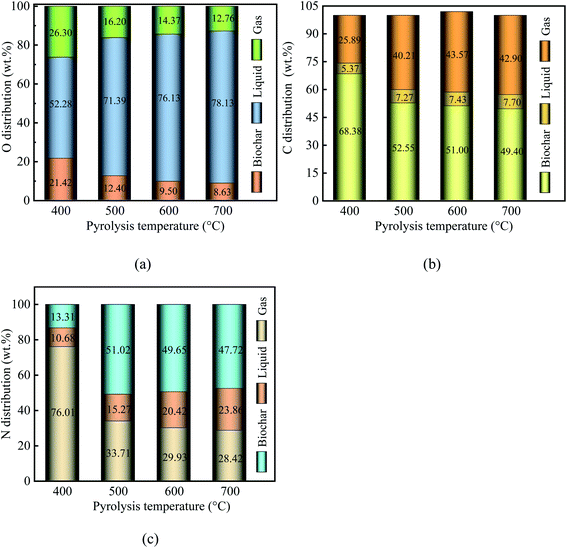
When the pyrolysis temperature increased from 400 °C to 700 °C, the proportion of O in biochar decreased from 24.42% to 8.63%. Similarly, the proportion of O in gaseous products decreased from 26.30% to 12.76%. In contrast, the proportion of O in liquid products increased from 52.28% to 78.13%. This means that higher temperatures intensified the deoxygenation reaction. Element O was removed from the PC and migrated into the liquid and gaseous products in the form of CO, H2O, CO2, and oxygen-containing organic compounds. Notably, element O in PC was primarily transferred into H2O, followed by CO2 and CO. These results suggest that water and gaseous products play a vital role in deoxygenation.
When the pyrolysis temperature increased from 400 °C to 700 °C, the proportion of C in liquid products increased from 5.37% to 7.70%. Similarly, the proportion of C in gaseous products increased from 25.89% to 42.90%. In contrast, the proportion of O in biochar decreased from 68.38% to 49.40%. These results show that the C loss in PC was less than 50.60% over the pyrolysis temperature range. Meanwhile, with an increase in pyrolysis temperature, the proportion of N decreased from 76.01% for PPC-400 to 28.42% for PPC-700. As a result, the pyrolysis process of PC being a deoxygenation process along with C and N elements migration.
With an increase in pyrolysis temperature, the energy yield of biochar gradually decreased from 73.86% for PPC-400 to 49.42% for PPC-700, but the energy yield of liquid increased from 18.60% (400 °C) to 24.54% (700 °C). Among the three-phase products, the gases endow the lowest energy yield because it has the lowest mass yield. Notably, the energy of the biochar dominates the pyrolysis of the PC, which was consistent with the previous study.50
3.3. Analysis of the potential for removal of tetracycline
Recently, it has been reported that biochar derived from fiberboard can remove tetracycline due to its high content of nitrogen and a certain specific surface area.29 In this work, the nitrogen content of PPC-400 was similar to that of the biochar derived from fiberboard and its specific surface area was slightly higher than that of the biochar derived from fiberboard.29 Interestingly, in this work, PPC-400 was obtained by pyrolysis of PC at 400 °C under the conditions of insufficient nitrogen atmosphere. Therefore, the biochar (PPC-N-400) prepared by pyrolyzing PC at 400 °C in a nitrogen atmosphere for 60 min has more nitrogen content and its specific surface area further increased. The nitrogen content and specific surface area of PPC-N-400 were higher than that of the biochar derived from fiberboard, as listed in Table 5.| Samples | Surface area (m2 g−1) | Pore volume (cm3 g−1) | Average pore size (nm) | Nitrogen content (%) | Tetracycline removal efficiency (%) | Reference |
|---|---|---|---|---|---|---|
| a BCXXX stands for biochar derived from pyrolysis of fiberboard prepared at XXX °C, XXX can be 300, 500, and 800. | ||||||
| BC300a | 32.2 | 0.022 | 2.5 | 3.54 | 55.45% | 29 |
| BC500a | 34.9 | 0.033 | 4.3 | 3.16 | 63.29% | |
| BC800a | 135.1 | 0.108 | 3.3 | 3.42 | 68.60% | |
| PPC-400 | 65.3 | 0.066 | 2.0 | 2.79 | Further investigation | This study |
| PPC-N-400 | 246.4 | 0.230 | 1.9 | 3.98 | ||
Consequently, we can infer that the PPC-400 and PPC-N-400 have potential in the field for removing tetracycline. Particularly, PPC-N-400 had a significant removal effect, and its removal efficiency may be over 68.60%.29
4. Conclusions
When PC was pyrolyzed, the effect of its pyrolysis temperature on the products was similar to the effect of torrefaction pretreatment on the products. PC endows two distinct weight loss peaks in the pyrolysis temperature ranging from 200 °C to 500 °C. Of these, the weight loss peak at about 450 °C was primarily ascribed to the existence of non-structural substances. During the pyrolysis process, the deoxygenation, decarbonization, and denitrogenation of PC endow a significant effect on the physicochemical properties of biochar, liquid products, and gaseous products. After pyrolysis, oxygen was present in the gaseous state as CO2 and CO, and also in the liquid products as oxygen-containing organic compounds and H2O. Unlike oxygen, over 49.40% of carbon in PC was remained in PPC-X, while a small amount of carbon migrated into the liquid and gaseous products. Of note is that the energy of biochar dominates the pyrolysis of the PC. Furthermore, the nitrogen content and specific surface area of the PPC-N-400 were higher than that of the biochar derived from fiberboard. Therefore, we can infer that the PPC-N-400 has a significant effect on the removal of tetracycline.Author contributions
Jielong Wu: data curation, investigation, and writing-original draft. Liangcai Wang: project administration, writing-original draft, editing, and supervision. Huanhuan Ma: visualization and methodology. Jianbin Zhou: supervision, writing-review, and funding acquisition.Conflicts of interest
The authors declare no competing financial interest.Acknowledgements
This work was supported by the National Promotion Project of China (No. 2020133136), the National Key Research and Development Plan of China (2016YFE0201800).References
- G. Y. Wang, Y. J. Dai, H. P. Yang, Q. G. Xiong, K. G. Wang, J. S. Zhou, Y. C. Li and S. R. Wang, A review of recent advances in biomass pyrolysis, Energy Fuels, 2020, 34(12), 15557–15578, DOI:10.1021/acs.energyfuels.0c03107.
- S. S. Kim, H. V. Ly, J. Kim, J. H. Choi and H. C. Woo, Thermogravimetric characteristics and pyrolysis kinetics of alga sagarssum sp biomass, Bioresour. Technol., 2013, 139, 242–248, DOI:10.1016/j.biortech.2013.03.192.
- S. S. Idris, N. A. Rahman and K. Ismail, Combustion characteristics of Malaysian oil palm biomass, sub-bituminous coal and their respective blends via thermogravimetric analysis (TGA), Bioresour. Technol., 2012, 123, 581–591, DOI:10.1016/j.biortech.2012.07.065.
- A. Pimchuai, A. Dutta and P. Basu, Torrefaction of agriculture residue to enhance combustible properties, Energy Fuels, 2010, 24(9), 4638–4645, DOI:10.1021/ef901168f.
- P. Rousset, C. Aguiar, N. Labbe and J. M. Commandre, Enhancing the combustible properties of bamboo by torrefaction, Bioresour. Technol., 2011, 102(17), 8225–8231, DOI:10.1016/j.biortech.2011.05.093.
- M. J. Prins, K. J. Ptasinski and F. J. J. G. Janssen, More efficient biomass gasification via torrefaction, Energy, 2006, 31(15), 3458–3470, DOI:10.1016/j.energy.2006.03.008.
- K. H. Cen, J. Zhang, Z. Q. Ma, D. Y. Chen, J. B. Zhou and H. H. Ma, Investigation of the relevance between biomass pyrolysis polygeneration and washing pretreatment under different severities: Water, dilute acid solution and aqueous phase bio-oil, Bioresour. Technol., 2019, 278, 26–33, DOI:10.1016/j.biortech.2019.01.048.
- D. Ciokosz and R. Wallace, A review of torrefaction for bioenergy feedstock production, Biofuels, Bioprod. Biorefin., 2011, 5(3), 317–329, DOI:10.1002/bbb.275.
- W. H. Chen, K. M. Lu and C. M. Tsai, An experimental analysis on property and structure variations of agricultural wastes undergoing torrefaction, Appl. Energy, 2012, 100, 318–325, DOI:10.1016/j.apenergy.2012.05.056.
- T. Acharjee, C. Coronella and V. R. Vasquez, Effect of thermal pretreatment on equilibrium moisture content of lignocellulosic biomass, Bioresour. Technol., 2011, 102(7), 4849–4854, DOI:10.1016/j.biortech.2011.01.018.
- Y. Chen, L. C. Wang, M. Q. Zhao, H. H. Ma, D. Y. Chen, Y. M. Zhang and J. B. Zhou, Comparative study on the pyrolysis behaviors of pine cone and pretreated pine cone by using TGA-FTIR and pyrolysis-GC/MS, ACS Omega, 2021, 6(5), 3490–3498, DOI:10.1021/acsomega.0c04456.
- B. Colin, J. L. Dirion, P. Arlabosse and S. Salvador, Quantification of the torrefaction effects on the grindability and the hygroscopicity of wood chips, Fuel, 2017, 197, 232–239, DOI:10.1016/j.fuel.2017.02.028.
- S. R. Wang, G. X. Dai, B. Ru, Y. Zhao, X. L. Wang, G. Xiao and Z. Y. Luo, Influence of torrefaction on the characteristics and pyrolysis behavior of cellulose, Energy, 2017, 120, 864–871, DOI:10.1016/j.energy.2016.11.135.
- S. R. Wang, G. X. Dai and B. Ru, Effects of torrefaction on hemicellulose structural characteristics and pyrolysis behaviors, Bioresour. Technol., 218, 1106–1114, DOI:10.1016/j.biortech.2016.07.075.
- G. X. Dai, Q. Zou, S. R. Wang, Y. Zhao, L. J. Zhu and Q. X. Huang, Effect of torrefaction on the structure and pyrolysis behavior of lignin, Energy Fuels, 32, 4160–4166, DOI:10.1021/acs.energyfuels.7b03038.
- D. Ciolkosz and R. Wallace, A review of torrefaction for bioenergy feedstock production, Biofuels, Bioprod. Biorefin., 2011, 5(3), 317–329, DOI:10.1002/bbb.275.2011.
- M. J. C. Stelt, H. Gerhauser, J. H. A. Kiel and K. Ptasinski, Biomass upgrading by torrefaction for the production of biofuels: A review, Biomass Bioenergy, 2011, 35(9), 3748–3762, DOI:10.1016/j.biombioe.2011.06.023.
- J. J. Chew and V. Doshi, Recent advances in biomass pretreatment-torrefaction fundamentals and technology, Renewable Sustainable Energy Rev., 2011, 15(8), 4212–4222, DOI:10.1016/j.rser.2011.09.017.
- Q. V. Bach and Ø. Skreiberg, Upgrading biomass fuels via wet torrefaction: A review and comparison with dry torrefaction, Renewable Sustainable Energy Rev., 2016, 54, 665–677, DOI:10.1016/j.rser.2015.10.014.
- Q. V. Bach, W. H. Chen, Y. S. Chu and Ø. Skreiberg, Predictions of biochar yield and elemental composition during torrefaction of forest residues, Bioresour. Technol., 2016, 215, 239–246, DOI:10.1016/j.biortech.2016.04.009.
- L. W. Li, Y. Q. Huang, D. Y. Zhang, A. Q. Zheng, Z. L. Zhao, M. Z. Xia and H. B. Li, Uncovering structure-Reactivity relationships in pyrolysis and gasification of biomass with varying severity of torrefaction, ACS Sustainable Chem. Eng., 2018, 6(5), 6008–6017, DOI:10.1021/acssuschemeng.7b04649.
- W. H. Chen, S. H. Liu, T. T. Juang, C. M. Tsai and Y. Q. Zhuang, Characterization of solid and liquid products from bamboo torrefaction, Appl. Energy, 2015, 160, 829–835, DOI:10.1016/j.apenergy.2015.03.022.
- D. Y. Chen, J. M. Mei, H. P. Li, Y. M. Li, M. T. Lu, T. T. Ma and Z. Q. Ma, Combined pretreatment with torrefaction and washing using torrefaction liquid products to yield upgraded biomass and pyrolysis products, Bioresour. Technol., 2017, 228, 62–68, DOI:10.1016/j.biortech.2016.12.088.
- A. K. Mondal, K. Kretschmer, Y. F. Zhao, H. Liu, H. B. Fan and G. X. Wang, Naturally nitrogen doped porous carbon derived from waste shrimp shells for high-performance lithium ion batteries and supercapacitors, Microporous Mesoporous Mater., 2017, 246, 72–80, DOI:10.1016/j.micromeso.2017.03.019.
- W. Ai, Z. M. Luo, J. Jiang, J. H. Zhu, Z. Z. Du, Z. X. Fan, L. H. Xie, H. Zhang and T. Yu, Nitrogen and sulfur codoped graphene: multifunctional electrode materials for high-performance Li-ion batteries and oxygen reduction reaction, Adv. Mater., 2014, 26(35), 6186–6192, DOI:10.1002/adma.201401427.
- D. S. Yang, D. Bhattacharjya, S. Inamdar, J. Park and J. S. Yu, Phosphorus-doped ordered mesoporous carbons with different lengths as efficient metal-free electrocatalysts for oxygen reduction reaction in alkaline media, J. Am. Chem. Soc., 2012, 134(39), 16127–16130, DOI:10.1021/ja306376s.
- M. Schnucklake, L. Eifert, J. Schneider, R. Zeis and C. Rorh, Porous N-and S-doped carbon-carbon composite electrodes by soft-templating for redox flow batteries, Beilstein J. Nanotechnol., 2019, 10(1), 1131–1139, DOI:10.3762/bjnano.10.113.
- A. Laheäär, S. Delpeux-Ouldriane, E. Lust and F. Beguin, Ammonia treatment of activated carbon powders for supercapacitor electrode application, J. Electrochem. Soc., 2014, 161(4), A568–A575, DOI:10.1149/2.051404jes.
- D. L. Xu, Y. X. Gao, Z. X. Lin, W. R. Gao, H. Zhang, K. Karnowo, X. Hu, H. Q. Sun, S. S. A. Syed-Hassan and S. Zhang, Application of biochar derived from pyrolysis of waste fiberboard on tetracycline adsorption in aqueous solution, Front. Chem., 2020, 7 DOI:10.3389/fchem.2019.00943.
- J. Yi, H. Qu, Y. Wu, Z. Wang and L. Wang, Study on antitumor, antioxidant and immunoregulatory activities of the purified polyphenols from pinecone of Pinus koraiensis on tumor-bearing S180 mice in vivo, Int. J. Biol. Macromol., 2016, 94, 735–744, DOI:10.1016/j.ijbiomac.2016.10.071.
- Z. H. Jiang, Z. J. Liu, B. H. Fei, Z. Y. Cai, Y. Yu and X. E. Liu, The pyrolysis characteristics of moso bamboo, J. Anal. Appl. Pyrolysis, 2012, 94, 48–52, DOI:10.1016/j.jaap.2011.10.010.
- X. L. Gu, X. Ma, L. X. Li, C. Liu, K. H. Cheng and Z. Z. Li, Pyrolysis of poplar wood sawdust by TG-FTIR and PY-GC/MS, J. Anal. Appl. Pyrolysis, 2013, 102, 16–23, DOI:10.1016/jjaap.2013.04.009.
- R. Azargohar, S. Nanda, J. A. Kozinski, A. K. Dalai and R. Sutarto, Effects of temperature on the physicochemical characteristics of fast pyrolysis bio-chars derived from Canadian waste biomass, Fuel, 2014, 125, 90–100, DOI:10.1016/j.fuel.2014.01.083.
- V. Pasangulapati, A. Kumar, C. L. Jones and R. L. Huhnke, Characterization of switchgrass cellulose. Hemicellulose and lignin for thermochemical conversions, J. Biobased Mater. Bioenergy, 2012, 6(3), 249–258, DOI:10.1166/jbmb.2012.1216.
- H. Yang, R. Yan, H. Chen, D. H. Lee and C. Zheng, Characteristics of hemicellulose, cellulose and lignin pyrolysis, Fuel, 2007, 86(12), 1781–1788, DOI:10.1016/j.fuel.2006.12.013.
- L. Burhenne, J. Messmer, T. Aicher and M. P. Laborie, The effect of the biomass components lignin, cellulose and hemicellulose on TGA and fixed bed pyrolysis, J. Anal. Appl. Pyrolysis, 2013, 101, 177–184, DOI:10.1016/j.jaap.2013.01.012.
- J. J. Chew, V. Doshi, S. T. Yong and S. Bhattacharya, Kinetic study of torrefaction of oil palm shell, mesocarp and empty fruit bunch, J. Therm. Anal. Calorim., 2016, 126(2), 1–7, DOI:10.1007/s10973-016-5518-3.
- Y. P. Xie, K. Zeng, G. Flamant, H. P. Yang, N. Liu, X. He, X. Y. Yang, A. Nzijou and H. P. Chen, Solar pyrolysis of cotton stalk in molten salt for bio-fuel production, Energy, 2019, 179(JUL.15), 1124–1132, DOI:10.1016/j.energy.2019.05.055.
- B. Arias, C. Pevida, J. Fermoso, M. G. Plaza, F. Rubiera and J. J. Pis, Influence of torrefaction on the grindability and reactivity of woody biomass, Fuel Process. Technol., 2008, 89(2), 169–175, DOI:10.1016/j.fuproc.2007.09.002.
- D. Sahoo and N. Remya, Influence of operating parameters on the microwave pyrolysis of rice husk: biochar yield, energy yield, and property of biochar, Biomass Convers. Biorefin., 2020, 8 DOI:10.1007/s13399-020-00914-8.
- P. Quosai, A. Anstey, A. Mohanty and M. Misra, Characterization of biocarbon generated by high-and low-temperature pyrolysis of soy hulls and coffee chaff: for polymer composite applications, R. Soc. Open Sci., 2018, 5(8), 171970, DOI:10.1098/rsos.171970.
- K. Kameyama, T. Miyamoto and Y. Iwata, The preliminary study of water-retention related properties of biochar produced from various feedstock at dierent pyrolysis temperatures, Materials, 2019, 12(11), 1732, DOI:10.3390/ma12111732.
- H. L. Wang, D. J. Wu, J. B. Zhou, H. H. Ma, D. L. Xu, B. Qian, S. Tao and Z. Wang, Preparation of supercapacitor electrode from gasified rice husk carbon, Bioresources, 2018, 13, 4279–4289, DOI:10.15376/biores.13.2.4279-4289.
- A. Afnan and M. Robert, Predictable and targeted activation of biomass to carbons with high surface area density and enhanced methane storage capacity, Energy Environ. Sci., 2020, 13, 2967–2978, 10.1039/D0EE01340D.
- T. T. Li, Z. H. Tong, B. Gao, Y. C. Li, A. Smyth and H. K. Bayabil, Polyethyleneimine-modified biochar for enhanced phosphate adsorption, Environ. Sci. Pollut. Res., 2020, 27, 7420–7429, DOI:10.1007/s11356-019-07053-2.
- L. C. Wang, J. L. Wu, H. H. Ma, G. L. Han, D. R. Yang, Y. Chen and J. B. Zhou, H3PO4-assisted synthesis of apricot shell lignin-based activated carbon for capacitors:understanding the pore structure/electrochemical performance relationship, Energy Fuels, 2021, 35, 8303–8312, DOI:10.1021/acs.energyfuels.1c00169.
- M. Phanphanich and S. Mani, Impact of torrefaction on the grindability and fuel characteristics of forest biomass, Bioresour. Technol., 2011, 102(2), 1246–1253, DOI:10.1016/j.biortech.2010.08.028.
- Z. Q. Ma, J. H. Wang, H. Z. Zhou, Y. Zhang, Y. Y. Yang, X. H. Liu, J. W. Ye, D. Y. Chen and S. R. Wang, Relationship of thermal degradation behavior and chemical structure of lignin isolated from palm kernel shell under different process severities, Fuel Process. Technol., 2018, 181, 142–156, DOI:10.1016/j.fuproc.2018.09.020.
- Q. Liu, S. R. Wang, Y. Zheng, Z. Y. Luo and K. F. Cen, Mechanism study of wood lignin pyrolysis by using TG-FTIR analysis, J. Anal. Appl. Pyrolysis, 2008, 82, 170–177, DOI:10.1016/j.jaap.2008.03.007.
- J. Park, Y. Lee, C. Ryu and Y. K. Park, Slow pyrolysis of rice straw: analysis of products properties, carbon and energy yields, Bioresour. Technol., 2014, 155, 63–70, DOI:10.1016/j.biortech.2013.12.084.
Footnote |
| † These authors contribute equally to this work. |
| This journal is © The Royal Society of Chemistry 2021 |

