 Open Access Article
Study on the interaction of Zea mays L. centrin and melittin
Zhijun Wang†
a,
Yanlong Feng† a,
Tiantian Songb,
Jie Sub,
Mengjie Fub and
Haiying Lei*b
aDepartment of Chemistry, Changzhi University, Changzhi 046011, China. E-mail: czxywzj@163.com
bDepartment of Life Sciences, Changzhi University, Changzhi 046011, China. E-mail: xiaoleikkxx@163.com
First published on 9th November 2021
Abstract
Zea mays L. centrin (Zmcen) is a 20 kDa calcium binding protein also known as caltractin. We used melittin as a simulated target peptide and examined its interaction with Zmcen to understand the structure of Zmcen and the mechanism of interaction with downstream target peptides. The circular dichroism spectrum was used to characterize the typical α-helix structure of Zmcen, and after combining with melittin, the α-helix content of Zmcen changed. Trp residues in melittin were used as fluorescent probes to monitor changes in the conformation of Zmcen upon melittin binding. The Trp residues in melittin gradually shifted from polar environments to nonpolar environments, fluorescence peaks were significantly blueshifted, and the intensity of the fluorescence peak increased. These results showed that Zmcen and melittin combined in a 1![[thin space (1/6-em)]](https://www.rsc.org/images/entities/char_2009.gif) :
:![[thin space (1/6-em)]](https://www.rsc.org/images/entities/char_2009.gif) 1 ratio to form a new complex. The influence of metal ions on binding was also investigated. The combination of Ca2+ and Zmcen helped expose more hydrophobic regions of Zmcen and promoted the binding of Zmcen and melittin. In addition, 2-p-toluidinylnaphthalene-6-sulfonate (TNS) was used as a hydrophobic probe to bind to Zmcen and Zmcen occupied the hydrophobic area on the surface of Zmcen, thereby weakening the binding of Zmcen and melittin. The Biacore experiment was used to calculate the equilibrium constant (KD) for the dissociation of Zmcen and melittin. Melittin mainly binds to C-Zmcen but not to N-Zmcen, indicating that the binding site of melittin on Zmcen was mainly at the C-terminus of Zmcen.
1 ratio to form a new complex. The influence of metal ions on binding was also investigated. The combination of Ca2+ and Zmcen helped expose more hydrophobic regions of Zmcen and promoted the binding of Zmcen and melittin. In addition, 2-p-toluidinylnaphthalene-6-sulfonate (TNS) was used as a hydrophobic probe to bind to Zmcen and Zmcen occupied the hydrophobic area on the surface of Zmcen, thereby weakening the binding of Zmcen and melittin. The Biacore experiment was used to calculate the equilibrium constant (KD) for the dissociation of Zmcen and melittin. Melittin mainly binds to C-Zmcen but not to N-Zmcen, indicating that the binding site of melittin on Zmcen was mainly at the C-terminus of Zmcen.
1. Introduction
Centrin is an acidic, highly conserved calcium binding protein of approximately 20 kDa, also called caltractin, which is one of the members of the calmodulin (CaM) in the EF-hand superfamily.1 Centrin is mainly found in protists,2 fungi,3 plants4 and animals5 and was first identified in green algae.6As a caltractin, the centrins fold into two independent domains, the N-terminal and C-terminal domains, connected by an α-helical flexible linker region. Each domain contains a pair of EF-hand structures. In general, the centrins contain four helix-loop-helix topological structures.7 Each EF-hand structure can bind a calcium ion, and the coordination of the Ca2+ ion to the binding ring in the EF-hand structure has been proven to form a pentagonal bipyramidal arrangement with amino acids at positions 1, 3, 5, 7, 9, and 12 of the loop region.8 The binding of Ca2+ ions triggers a conformational change of centrin, which leads to regulation of the enzyme activity of the Ca2+ sensor itself or allows it to interact with downstream targets.1b Centrins can bind a large number of peptides and other peptides of different sizes and shapes and regulate their activities in many different ways, leading to cell changes. Research has shown that centrin is a component of the microtubule organizing center (MTOC) and exists in different parts of the MTOC.9 Centrin plays multiple roles in the process of cell division, one of which is the replication of MTOC.10 The other is as a component of shrinking fibers in and attached to MTOC, which shrink in response to changes in Ca2+ concentration.11
In recent years, research on centrin has mainly focused on prokaryotes, humans and lower plants, while there are relatively few reports on centrin in higher plants. For example, the properties and functions of centrin have been studied through the interaction of the centrin of Euplotes octocarinatus with rare earth ions.12 Human centrin 2 binds to xeroderma pigmentosum group C (XPC) protein to form a complex that participates in the nucleotide excision repair (NER) of intracellular DNA.13 Verde et al. used a combination of biophysical and biochemical methods to study the structure, ion, and target peptide binding properties of calmodulin-like protein 19. CML19 is an Arabidopsis centrin that modulates nucleotide excision repair (NER) by binding to the RAD4 protein.1b There are no reports on the properties of Zmcen. Zea mays L. is an important food crop in China, and research on Zmcen is important to understanding the physiological and biochemical reactions during the growth of Zea mays L. Zmcen is composed of 172 amino acid residues, and its molecular weight is approximately 20 kDa. This paper reports studies of the interaction between Zmcen and melittin. It provides a theoretical basis for further elucidating the mechanism of Zmcen in cell division, cell movement and other important life processes.
Melittin is the main toxic component in the venom of the European honeybee Apis mellifera, and it is a cationic hemolytic peptide.14 Melittin consists of 26 amino acid residues in the sequence NH2-GIGAVLKVLTTGLPALISWIKRKRQQ-COOH, and it has a positive charge of 5 units. The amino terminal region (residues 1–20) is mainly hydrophobic, while the carboxy terminal region (residues 21–26) is hydrophilic due to the presence of a positively charged amino acid.15 Melittin can interact with certain proteins in cells (such as phospholipase and calmodulin) to induce functional regulation.16 Therefore, melittin can be used as a mimic target peptide that interacts with calmodulin.
In this study, we primarily studied the binding between Zmcen and melittin. Because of the α-helix structure of Zmcen, the CD spectrum was used to determine the content of α-helices before and after the combination of Zmcen and melittin. Fluorescence spectroscopy has previously been shown to be a sensitive tool for monitoring local environmental changes in tryptophan residues in calmodulin-binding peptides.17 Tryptophan present in melittin can be used as a fluorescent probe. Compared with the maximum emission wavelength of the free peptide, the fluorescence emission maximum of tryptophan showed a clear blueshift (∼20 nm) after calmodulin binding. In addition, the Biacore instrument is based on the basic principle of surface plasmon resonance (SPR), which allows two molecules to interact. Through changes in the SPR optical signal, the signal change of the whole reaction can be dynamically monitored in real time. There is no need to label any samples during the analysis, no sample preprocessing is required, the amount of sample required is very small, and the analysis provides considerable information on biomolecular interactions that is difficult to obtain by traditional techniques.18
2. Experimental
2.1. Reagents
4-(2-Hydroxyethyl)-1-piperazineethanesulfonic acid (HEPES) was purchased from RHAWN (Shanghai, China). 2-Ptoluidinylnaphthalene-6-sulfonate (TNS) and melittin were purchased from Sigma (America). All chemicals were of analytical grade and used without purification. Ultrapure water was used for all experiments.2.2. Protein preparation
The Zea mays L. centrin protein (Zmcen) was cloned, expressed and purified as previously reported.19The concentration of Zmcen was determined spectrophotometrically using the molar extinction coefficient ε280 = 2980 M−1 cm−1. Other determinations of protein concentration used ε280 (M−1 cm−1) = (#Trp) (5500) + (#Tyr) (1490) + (#cystine) (125).20
2.3. Instruments
Fluorescence measurements were performed on an F-4600 fluorescence emission spectrometer (HITACHI, Japan) at ambient temperature. The pH value of each solution was adjusted with a PHSJ-3F pH meter by adding drops of concentrated sodium hydroxide (NaOH). Molecular and mutual assistance was measured by a Biacore system (Sweden). Circular dichroism spectra (CD) were measured on a Chirascan system.2.4. Fluorescence emission spectroscopy
The interactions of melittin with Zmcen, C-Zmcen, and N-Zmcen were measured by fluorescence spray microscopy. The sample buffer contained 10 mM HEPES at pH 7.4. Experiments were carried out at room temperature. To minimize interference from the tyrosine residues of Zmcen, the excitation wavelength was set at 295 nm in the melittin and protein titration experiments. The emission spectrum was obtained in the range 320 nm to 540 nm. The slit widths for excitation and emission were 10 nm, the PMT voltage was 400 V, and the reaction time was 2 min after each drop of protein was added.2.5. CD spectra measurements
Circular dichroism (CD) spectroscopy was used to study the configuration changes of Zmcen caused by the addition of melittin. All spectra had a step size of 0.2 nm and a bandwidth of 1 nm. Far-UV CD spectra were recorded between 200 and 250 nm using 1 mm path length quartz cells. The sample buffer contained 10 mM HEPES at pH 7.4. The buffer signal was digitally subtracted using the software provided by the manufacturer. Experiments were carried out at room temperature.2.6. Binding kinetics measurements by SPR
The binding of melittin to Zmcen, C-Zmcen, and N-Zmcen was measured by SPR using a Biacore X100 system. Biacore is a detection method based on surface plasmon resonance technology, which is commonly used to measure molecular complexes such as small molecule–protein or protein–protein complexes. The most typical method involves immobilization of the ligand protein on the sensor chip by forming an amide bond between the protein and the carboxymethyl-dextran matrix of the CM5 chip.21 Biacore monitors the binding and dissociation of the analyte protein and the ligand protein. The binding kinetics and affinity were evaluated, and the association rate constant (ka), the dissociation rate constant (kd) and the dissociation equilibrium constant (KD) for binding between the ligand protein and the analyte protein were obtained from this analysis. Labeled molecules with attachment tags, such as biotin, can be easily captured by streptavidin on the sensor chip and have been applied in binding assays using Biacore.18 Therefore, we used melittin as the ligand protein and Zmcen as the analyte protein to evaluate the interaction between them. After activating the CM5 chip with DEC/NHS, we diluted melittin with a sodium acetate solution of pH 5.0 to 20 μg mL−1, flowed it through the chip on a Biacore instrument at a flow rate of 5 μL min−1 for 300 s, and then blocked the excess active carboxyl groups on the chip with ethanolamine. Thus, the melittin CM5 chip (Mel-CM5) was prepared. Zmcen was serially diluted 2-fold with HBS to prepare a series of different concentrations, and the binding kinetics were measured on the Mel-CM5. The binding interactions were monitored over a 120 s association period, followed by a 600 s dissociation period in Mel-CM5 containing HBS. The affinity data were analyzed by Biacore X100 control software with a 1![[thin space (1/6-em)]](https://www.rsc.org/images/entities/char_2009.gif) :
:![[thin space (1/6-em)]](https://www.rsc.org/images/entities/char_2009.gif) 1 model. Throughout the experiment, HBS buffer was prepared with ultrapure water and used after filtration with a 0.2 micron water-based filter membrane. All samples were stirred and degassed at a speed of 10
1 model. Throughout the experiment, HBS buffer was prepared with ultrapure water and used after filtration with a 0.2 micron water-based filter membrane. All samples were stirred and degassed at a speed of 10![[thin space (1/6-em)]](https://www.rsc.org/images/entities/char_2009.gif) 000 rpm.
000 rpm.
3. Results and discussion
3.1. Secondary structural changes of Zmcen after binding with melittin
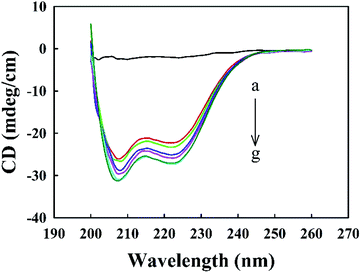
Melittin solutions were added dropwise to the Zmcen solution, and CD spectra were used to characterize the distribution of secondary structural elements in Zmcen. Fig. 1 shows the CD curves for melittin dripped into Zmcen. Curve a in Fig. 1 shows that free melittin in aqueous solution exhibited a random coil-type spectrum with no obvious peak. Curve b in Fig. 1 shows that double shoulder peaks at 222 nm and 208 nm are displayed in the CD spectrum of Zmcen, which are typical peaks characteristic of α-helixes.22 This indicates that Zmcen exhibited increasing content of α-helices. This result is consistent with the four helix-loop-helix structure of the centrin. The peaks at 222 nm and 208 nm increased with increasing melittin content in the solution, indicating that the binding of melittin affected the secondary structure of the centrin. Fig. 1 shows that when there was an equimolar melittin concentration, the peaks at 222 nm and 208 nm remained basically unchanged with increasing melittin concentration, indicating that Zmcen binds to melittin in a ratio of 1![[thin space (1/6-em)]](https://www.rsc.org/images/entities/char_2009.gif) :
:![[thin space (1/6-em)]](https://www.rsc.org/images/entities/char_2009.gif) 1.
1.
3.2. Fluorescence spectra of Zmcen titrated with melittin
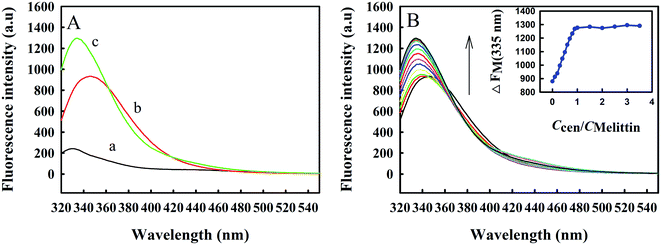
Zmcen contains tyrosine but not tryptophan, and its fluorescence is mainly derived from tyrosine luminescence. Melittin contains a tryptophan. Tryptophan and tyrosine have different luminescence properties in water. The use of 295 nm as the excitation wavelength precludes luminescence from tyrosine. In addition, the peak position for tryptophan fluorescence is related to the polarity of the chemical environment in which it is located, so the intermolecular binding process can be inferred from changes in the peak position. When Trp residues are exposed to a hydrophobic environment, the emission peak maximum is at 330 nm, and the minimum can reach 308 nm, in a polar environment, the maximum emission peak can reach 355 nm.23 The indole ring of the Trp residue has dual physicochemical properties, a large van der Waals surface area, and a highly polarized N–H bond. Therefore, Trp residues can be located inside nonpolar protein molecules and can also be located on the surfaces of macromolecules in contact with water molecules.24It can be seen from curve b in Fig. 2A that the fluorescence peak maximum for free melittin is at approximately 350 nm, which is similar to the emission spectrum of Trp in aqueous solution, indicating that the microenvironments of Trp residues in free melittin are hydrophilic. After adding Zmcen to the melittin solution, the fluorescence peak of melittin was blueshifted to 334 nm (curve c), indicating that the microenvironment of the Trp residue of melittin changed from the original polar environment to a nonpolar, hydrophobic environment. At the same time, the intensity of fluorescence from Trp residues was greatly enhanced, which may be due to the interaction between Zmcen and melittin. In addition, a comparison of curve c with curve a and curve b shows that the fluorescence peak obtained after an equimolar amount of Zmcen was dripped into the melittin solution did not constitute a simple addition of the spectra for Zmcen and melittin, which proves that Zmcen and melittin interacted to form a compound. Fig. 2B shows the fluorescence spectrum of Zmcen titrated into a solution of melittin. With the addition of Zmcen, the fluorescence peak for melittin gradually blueshifted, and the fluorescence intensity gradually increased. When the ratio of Zmcen and melittin contents reached 1![[thin space (1/6-em)]](https://www.rsc.org/images/entities/char_2009.gif) :
:![[thin space (1/6-em)]](https://www.rsc.org/images/entities/char_2009.gif) 1, the position and intensity of the fluorescence peak maximum no longer changed. Zmcen and melittin were combined at a ratio of 1
1, the position and intensity of the fluorescence peak maximum no longer changed. Zmcen and melittin were combined at a ratio of 1![[thin space (1/6-em)]](https://www.rsc.org/images/entities/char_2009.gif) :
:![[thin space (1/6-em)]](https://www.rsc.org/images/entities/char_2009.gif) 1.
1.
3.3. Effect of metal ions on the combination of Zmcen and melittin
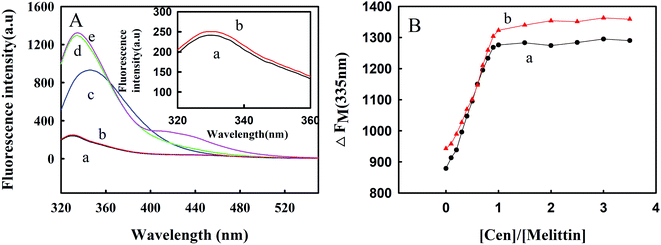
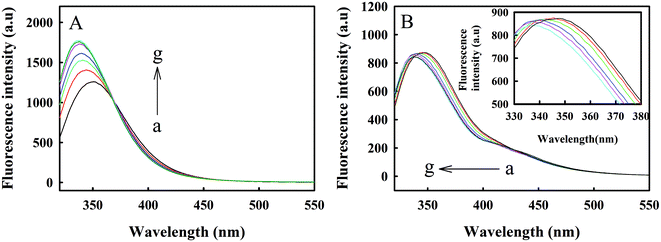
Zmcen contains 4 EF-hand structures, which are calcium-binding proteins, and each EF-hand structure can bind one calcium ion. Therefore, we studied the effect of calcium ions on the interaction between Zmcen and melittin, as shown in Fig. 3. Fig. 3A shows the fluorescence spectrum for the combination of calcium-saturated protein and melittin. From curve e, we can see that calcium-saturated protein can also bind to melittin, and this is similar to the binding of blank protein to melittin (curve d). The fluorescence peak of melittin was blueshifted from 350 nm to approximately 335 nm, but the difference was that the fluorescence intensity of calcium-saturated protein combined with melittin was slightly stronger than that of blank protein combined with melittin. Fig. 3B shows titration curves for the fluorescence peak at 335 nm during titration with calcium-saturated protein and blank protein. This shows that calcium-saturated protein and melittin also combined with a ratio of 1![[thin space (1/6-em)]](https://www.rsc.org/images/entities/char_2009.gif) :
:![[thin space (1/6-em)]](https://www.rsc.org/images/entities/char_2009.gif) 1, and the fluorescence intensity was greater than the fluorescence intensity seen after the blank protein and melittin were combined in a 1
1, and the fluorescence intensity was greater than the fluorescence intensity seen after the blank protein and melittin were combined in a 1![[thin space (1/6-em)]](https://www.rsc.org/images/entities/char_2009.gif) :
:![[thin space (1/6-em)]](https://www.rsc.org/images/entities/char_2009.gif) 1 ratio. This may be because the conformation of the protein changed after the metal ions were combined with the protein, thereby exposing a large number of hydrophobic regions.12
1 ratio. This may be because the conformation of the protein changed after the metal ions were combined with the protein, thereby exposing a large number of hydrophobic regions.12
3.4. The effect of TNS on the binding of Zmcen and melittin
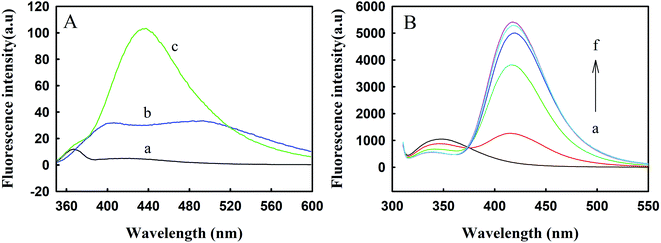
TNS is a hydrophobic fluorescent probe. The positions and intensities of the fluorescence peaks seen in polar solvents and nonpolar solvents are significantly different.25 TNS can bind to centrin with hydrophobic forces and occupy hydrophobic areas on the surface of the protein. Melittin exists in the form of monomers at low concentrations; even when the TNS concentration is as high as 116 μM and melittin is at 45 μM, combinations of the two cannot be observed.26 Therefore, changes in protein conformation can be studied with the position and intensity of the TNS fluorescence peak, as shown in Fig. 4. It can be seen from curve b of Fig. 4A that in the HEPES buffer solution, the fluorescence intensity of TNS was relatively weak, with a faint bulging peak observed near 500 nm. When TNS was combined with Zmcen, a strong fluorescence peak appeared at 432 nm. This shows that the microenvironment of TNS was changed. At the same time, the TNS fluorescence peak shifted from 500 nm to 432 nm, which shows that the environment in which the TNS probe was located was more polar, presumably due to the interaction between TNS and the hydrophobic cavity of Zmcen. Fig. 4B shows the fluorescence spectra of melittin titrated with TNS-saturated Zmcen. The figure shows that the addition of TNS-saturated Zmcen caused the peak intensity for Trp fluorescence in melittin to decrease gradually, and the TNS peak intensity gradually increased. This shows that when TNS was present, Zmcen and melittin also showed binding. However, when the binding ratio of Zmcen and melittin reached 1.0, the peak intensity decreased, indicating that the presence of TNS weakened the combination of Zmcen and melittin.3.5. Combination of melittin with C-Zmcen and N-Zmcen
The four EF-hand structures of Zmcen are the binding regions of melittin, and the four EF-hands include two each at the C-terminus and N-terminus of Zmcen. Therefore, in Fig. 5, we explored the interactions of C-Zmcen, N-Zmcen and melittin to determine the site for binding of melittin and Zmcen. Employing the method described above, we used C-Zmcen and N-Zmcen to titrate melittin. Fig. 5A shows that the binding of C-Zmcen and melittin was similar to that of Zmcen and melittin, the Trp fluorescence peak was blueshifted, and the fluorescence intensity gradually increased. Finally, C-Zmcen and melittin were combined at a ratio of 1![[thin space (1/6-em)]](https://www.rsc.org/images/entities/char_2009.gif) :
:![[thin space (1/6-em)]](https://www.rsc.org/images/entities/char_2009.gif) 1. Fig. 5B shows that with the addition of N-Zmcen, the Trp fluorescence peak of melittin gradually blueshifted. When the concentration ratio of N-Zmcen and melittin reached 1
1. Fig. 5B shows that with the addition of N-Zmcen, the Trp fluorescence peak of melittin gradually blueshifted. When the concentration ratio of N-Zmcen and melittin reached 1![[thin space (1/6-em)]](https://www.rsc.org/images/entities/char_2009.gif) :
:![[thin space (1/6-em)]](https://www.rsc.org/images/entities/char_2009.gif) 1, the fluorescence peak was blueshifted from 350 nm to 337 nm. However, with further addition of N-Zmcen, the fluorescence intensity did not change significantly, indicating that the binding of N-Zmcen and melittin was weak and that there was no obvious interaction.
1, the fluorescence peak was blueshifted from 350 nm to 337 nm. However, with further addition of N-Zmcen, the fluorescence intensity did not change significantly, indicating that the binding of N-Zmcen and melittin was weak and that there was no obvious interaction.
3.6. SPR analysis of melittin and Zmcen
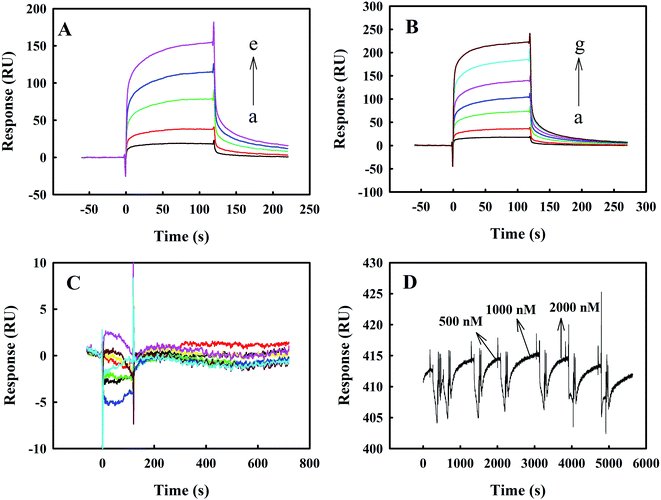
Fig. 6 panels A, B and C show the representative SPR results on the binding kinetics of melittin to Zmcen, C-Zmcen and N-Zmcen. In Fig. 6A, the concentration of Zmcen acting on the melittin-CM5 chip ranged from 125 nM to 1000 nM, and the response value increased by approximately 150 RU. A comprehensive analysis of the resulting binding curve was performed, and a 1![[thin space (1/6-em)]](https://www.rsc.org/images/entities/char_2009.gif) :
:![[thin space (1/6-em)]](https://www.rsc.org/images/entities/char_2009.gif) 1 Langmuir model was fitted to obtain a KD value of 2.0665 × 10⁻⁶ M−1. The reaction concentrations of C-Zmcen and melittin-CM5 chips ranged from 250 nM to 2000 nM. In Fig. 6B, the response value increased by approximately 200 RU, and the fitting KD value was 2.8958 × 10⁻⁶ M−1. As shown in Fig. 6C, the reaction concentration of the N-Zmcen and melittin-CM5 chip ranged from 250 nM to 6000 nM, and the response value did not increase, indicating that the two had basically no effect. Thus, we know that the KD value of the combination of Zmcen and melittin is relatively small. This result shows that Zmcen has a strong affinity with melittin, but the interaction of N-Zmcen with melittin is not obvious, and the same result was obtained with the above-mentioned fluorescence analysis. Additionally, data on the interaction between BSA protein and melittin are shown in Fig. 6D. Even when the BSA concentration was 2000 nM, it did not interact with melittin.
1 Langmuir model was fitted to obtain a KD value of 2.0665 × 10⁻⁶ M−1. The reaction concentrations of C-Zmcen and melittin-CM5 chips ranged from 250 nM to 2000 nM. In Fig. 6B, the response value increased by approximately 200 RU, and the fitting KD value was 2.8958 × 10⁻⁶ M−1. As shown in Fig. 6C, the reaction concentration of the N-Zmcen and melittin-CM5 chip ranged from 250 nM to 6000 nM, and the response value did not increase, indicating that the two had basically no effect. Thus, we know that the KD value of the combination of Zmcen and melittin is relatively small. This result shows that Zmcen has a strong affinity with melittin, but the interaction of N-Zmcen with melittin is not obvious, and the same result was obtained with the above-mentioned fluorescence analysis. Additionally, data on the interaction between BSA protein and melittin are shown in Fig. 6D. Even when the BSA concentration was 2000 nM, it did not interact with melittin.
4. Conclusions
In summary, we studied the combination of Zmcen and melittin. With analysis of CD spectra, fluorescence spectra and SPR spectra, it was shown that Zmcen interacted with melittin and formed a new complex in 10 mM HEPES solution at pH = 7.4. After Zmcen was combined with melittin, the conformation of melittin changed. Trp residues in melittin gradually transferred from a polar environment to a nonpolar environment, and finally, Zmcen and melittin were combined at a ratio of 1![[thin space (1/6-em)]](https://www.rsc.org/images/entities/char_2009.gif) :
:![[thin space (1/6-em)]](https://www.rsc.org/images/entities/char_2009.gif) 1. In the presence of Ca2+, Zmcen and melittin were still bound in a 1
1. In the presence of Ca2+, Zmcen and melittin were still bound in a 1![[thin space (1/6-em)]](https://www.rsc.org/images/entities/char_2009.gif) :
:![[thin space (1/6-em)]](https://www.rsc.org/images/entities/char_2009.gif) 1 ratio, but because the combination of Ca2+ and Zmcen helped Zmcen release more hydrophobic regions, the Zmcen conformation was changed from “closed” to “open”.14 This change contributed to the combination of Zmcen and melittin. In addition, the combination of TNS and Zmcen as a hydrophobic probe affected the binding of Zmcen and melittin. The combination of TNS and Zmcen occupied the hydrophobic areas on the surface, thereby weakening the binding of Zmcen and melittin. Experiments showed that melittin bound to C-Zmcen but exhibited almost no binding to N-Zmcen, indicating that the binding site of melittin on Zmcen was mainly at the C-terminus of Zmcen.
1 ratio, but because the combination of Ca2+ and Zmcen helped Zmcen release more hydrophobic regions, the Zmcen conformation was changed from “closed” to “open”.14 This change contributed to the combination of Zmcen and melittin. In addition, the combination of TNS and Zmcen as a hydrophobic probe affected the binding of Zmcen and melittin. The combination of TNS and Zmcen occupied the hydrophobic areas on the surface, thereby weakening the binding of Zmcen and melittin. Experiments showed that melittin bound to C-Zmcen but exhibited almost no binding to N-Zmcen, indicating that the binding site of melittin on Zmcen was mainly at the C-terminus of Zmcen.
Conflicts of interest
The authors declare no competing financial interests.Acknowledgements
This work was financially supported by the National Natural Science Foundation of China (21201024), the Natural Science Foundation of Shanxi Province (201801D121065), the Shanxi Province Youth Top Talent Support Program, the Shanxi “1331 Project” Key Innovative Research Team, and the Fund for Shanxi Key Subjects Construction (FSKSC). The funders had no role in the study design, data collection and analysis, decision to publish, or preparation of the manuscript.References
- (a) J. V. Kilmartin, J. Cell Biol., 2003, 162, 1211–1221 CrossRef CAS PubMed; (b) V. La Verde, M. Trande, M. D'Onofrio, P. Dominici and A. Astegno, Int. J. Biol. Macromol., 2018, 108, 1289–1299 CrossRef CAS PubMed.
- C. Guerra, Y. Wada, V. Leick, A. Bell and P. Satir, Mol. Biol. Cell, 2003, 14, 251–261 CrossRef CAS PubMed.
- T. Fischer, S. Rodríguez-Navarro, G. Pereira, A. Rácz, E. Schiebel and E. Hurt, Nat. Cell Biol., 2004, 6, 840–848 CrossRef CAS PubMed.
- M. Pedretti, C. Conter, P. Dominici and A. Astegno, Biochem. J., 2020, 477, 173–189 CrossRef CAS PubMed.
- Y. Zhao, X. Guo and B. Yang, Int. J. Biol. Macromol., 2019, 128, 314–323 CrossRef CAS PubMed.
- J. L. Salisbury, A. T. Baron and M. A. Sanders, J. Cell Biol., 1988, 107, 635–641 CrossRef CAS PubMed.
- M. R. Beccia, S. Sauge-Merle, D. Lemaire, N. Brémond, R. Pardoux, S. Blangy, P. Guilippe and C. Berthomieu, JBIC, J. Biol. Inorg. Chem., 2015, 20, 905–919 CrossRef CAS PubMed.
- J. L. Gifford, M. P. Walsh and H. J. Vogel, Biochem. J., 2007, 405, 199–221 CrossRef CAS PubMed.
- Y. Y. Levy, E. Y. Lai, S. P. Remillard, M. B. Heintzelman and C. Fulton, Cell Motil. Cytoskeleton, 1996, 33, 298–323 CrossRef CAS PubMed.
- (a) S. Middendorp, T. Küntziger, Y. Abraham, S. Holmes, N. Bordes, M. Paintrand, A. Paoletti and M. Bornens, J. Cell Biol., 2000, 148, 405–416 CrossRef CAS PubMed; (b) J. L. Salisbury, K. M. Suino, R. Busby and M. Springett, Curr. Biol., 2002, 12, 1287–1292 CrossRef CAS PubMed.
- J. L. Salisbury, A. Baron, B. Surek and M. Melkonian, J. Cell Biol., 1984, 99, 962–970 CrossRef CAS PubMed.
- Z.-J. Wang, Y.-Q. Zhao, L.-X. Ren, G.-T. Li, A.-H. Liang and B.-S. Yang, J. Photochem. Photobiol., A, 2007, 186, 178–186 CrossRef CAS.
- R. Nishi, W. Sakai, D. Tone, F. Hanaoka and K. Sugasawa, Nucleic Acids Res., 2013, 41, 6917–6929 CrossRef CAS PubMed.
- C. E. Dempsey, Biochim. Biophys. Acta, Biomembr., 1990, 1031, 143–161 CrossRef CAS.
- (a) M. S. Sansom, Prog. Biophys. Biophys. Chem., 1991, 55, 139–235 CrossRef CAS; (b) G. Saberwal and R. Nagaraj, Biochim. Biophys. Acta, Biomembr., 1994, 1197, 109–131 CrossRef CAS.
- (a) Y.-R. Du, Y. Xiao, Z.-M. Lu, J. Ding, F. Xie, H. Fu, Y. Wang, J. A. Strong, J.-M. Zhang and J. Chen, Biochem. Biophys. Res. Commun., 2011, 408, 32–37 CrossRef CAS PubMed; (b) P. Novak, V. Havlicek, P. J. Derrick, K. A. Beran, S. Bashir and A. E. Giannakopulos, Eur. J. Mass Spectrom., 2007, 13, 281–290 CrossRef CAS PubMed.
- A. M. Weljie and H. J. Vogel, Protein Eng., 2000, 13, 59–66 CrossRef CAS PubMed.
- R. Chu, D. Reczek and W. Brondyk, Sci. Rep., 2014, 4, 1–9 Search PubMed.
- H.-Y. Lei, F.-L. Bai, J.-X. Liu and Z.-J. Wang, Acta Agric. Boreali-Occident. Sin., 2016, 31, 18–24 Search PubMed.
- C. N. Pace, F. Vajdos, L. Fee, G. Grimsley and T. Gray, Protein Sci., 1995, 4, 2411–2423 CrossRef CAS PubMed.
- S.-H. Wang and J. Yu, Data Brief, 2016, 7, 1696–1699 CrossRef PubMed.
- J. A. Cox, F. Tirone, I. Durussel, C. Firanescu, Y. Blouquit, P. Duchambon and C. T. Craescu, Biochemistry, 2005, 44, 840–850 CrossRef CAS PubMed.
- J. T. Vivian and P. R. Callis, Biophys. J., 2001, 80, 2093–2109 CrossRef CAS PubMed.
- J. B. Shabb, Chem. Rev., 2001, 101, 2381–2412 CrossRef CAS PubMed.
- L. M. Hanft, T. D. Cornell, C. A. McDonald, M. J. Rovetto, C. A. Emter and K. S. McDonald, Arch. Biochem. Biophys., 2016, 601, 22–31 CrossRef CAS PubMed.
- C. C. Condie and S. C. Quay, J. Biol. Chem., 1983, 258, 8231–8234 CrossRef CAS.
Footnote |
| † These two authors contributed equally. |
| This journal is © The Royal Society of Chemistry 2021 |

