
 Open Access Article
 This Open Access Article is licensed under a Creative Commons Attribution-Non Commercial 3.0 Unported Licence
Designing conductive networks of hybrid carbon enables stable and long-lifespan cotton-fiber-based lithium–sulfur batteries†
Yue Wuab,
Cheng Wanga,
Zewen Yangab,
Depeng Songa,
Takeo Ohsakac,
Futoshi Matsumoto c,
Xiaolin Sun*a and
Jianfei Wu*ab
c,
Xiaolin Sun*a and
Jianfei Wu*ab
aQingdao Institute of Bioenergy and Bioprocess Technology, Chinese Academy of Sciences, Qingdao 266101, PR China. E-mail: wujf@qibebt.ac.cn; sunxl@qibebt.ac.cn
bCenter of Materials Science and Optoelectronics Engineering, University of Chinese Academy of Sciences, Beijing 100049, PR China
cResearch Institute for Engineering, Kanagawa University, 3-27-1, Rokkakubashi, Kanagawa-ku, Yokohama, Kanagawa 221-8686, Japan
First published on 28th October 2021
Abstract
In modern society, flexible rechargeable batteries have become a burgeoning apodictic choice for wearable devices. Conventional lithium–sulfur batteries lack sufficient flexibility because their electrode materials are too rigid to bend. Along with the inherent high theoretical capacity of sulfur, lithium–sulfur batteries have some issues, such as dissolution and shuttle effect of polysulfides, which restricts their efficiency and practicability. Here, a flexible and “dead-weight”-free lithium–sulfur battery substrate with a three-dimensional structure was prepared by a simple strategy. With the cooperative assistance of carbon nanotubes and graphene attached to cotton fibers, the lithium–sulfur battery with 2.0 mg cm−2 sulfur provided a high initial discharge capacity of 1098.7 mA h g−1 at 1C, and the decay rate after 300 cycles was only 0.046% per cycle. The initial discharge capacity at 2C was 872.4 mA h g−1 and the capacity was maintained 734.4 mA h g−1 after 200 cycles with only a 0.079% per cycle decay rate.
1. Introduction
Sustainable way of energy utilization is an issue that human beings have been paying close attention to, and there is a desperate need to resolve this issue.1–3 Accompanied economic growth followed by the increased consumer demand, and research into higher energy-density battery systems is rising.4–6 Lithium–sulfur (Li–S) batteries are known to be promising alternatives in the next-generation high-energy storage systems for portable electronics, hybrid vehicles, and grid-scale storage due to their high potential energy capacity.7–9 However, the practical implementation of Li–S batteries still faces two significant challenges: (1) low sulfur power utilization and low conductivity of the Li2S/Li2S2 lithium product decreases the electron transport in the sulfur cathode throughout the cycle, leading to inadequate sulfur consumption and extreme polarization.10–12 (2) Polysulfides are highly soluble in the electrolyte. They can disperse in the battery, leading to adverse reactions between polysulfides and the lithium metal anode, which are the essential explanations for the rapid decay and the low coulombic efficiency of the Li–S battery.13–15 Therefore, it is necessary to suppress the polysulfide shuttle and increase the sulfur utilization rate to boost the efficiency of Li–S batteries.In recent years, researchers have employed various approaches to address these intractable problems, among which carbon-based conductive host materials provide a path to effectively promote the electrochemical performance of Li–S batteries.16–18 For example, Cao et al.19 utilized an interconnected mesoporous carbon (MPC-1300) with a large surface area as a cathode additive. The effectiveness of the sulfur-confined technique has been exemplified in reports of graphene, graphene oxide, and other analogous nano-sized carbon materials.20–22 Typically, it is difficult to ameliorate the situation of lithium–sulfur batteries using only one improvement strategy because the polar–nonpolar interaction between carbon materials and polysulfides holds weakly.23,24 Several studies have revealed that adding polar adsorbents with strong chemical interactions with polysulfides can effectively limit the shuttle effect during cycling, representatives of which are metal species additives25 and functional groups.26 Researchers to date tend to focus on solving inherent problems, while ignoring the possibility of actual applications of Li–S batteries. To date, the concern about the straightforward material preparation and simple structure design has received increasing attention in the research literature. The existing accounts fail to resolve the contradiction between areal sulfur loading and satisfactory electrochemical performance.
Herein, with the combined conductivity-enhancement effects of CNTS and graphene and the hydroxyl groups in cotton natural fiber substrate (CCG substrate), the reversible enhancing charge and discharge capacity and battery cycling stability were achieved. The battery with a sulfur loading of 2.0 mg cm−2 provided a high initial discharge capacity of 1098.7 mA h g−1 at 1C, and the decay rate after 300 cycles was only 0.046%. The initial discharge capacity at 2C was 872.4 mA h g−1 and maintained 734.4 mA h g−1 after 200 cycles with only a 0.079% per cycle decay rate.
2. Experimental section
2.1 Materials
Sublimed sulfur was purchased from Aladdin, and Li2S was obtained from Alfa Aesar. Graphene slurry was purchased from XFNANO Materials Tech Co. Ltd. The carbon nanotube slurry was purchased from Shenzhen Sanshun Nano New Materials Co., Ltd. The carbon nanotube slurry contained 5 wt% carbon nanotubes, 1% polyvinyl pyrrolidone (PVP) dispersant, and the remaining component was the solvent NMP. The graphene slurry contained 5 wt% graphene and the other components were the same as above. All chemicals were of analytical grade and were used as received without further purification. Polypropylene separators and lithium metal chips were obtained from MTI Corporation.2.2 Preparation of CCG, CC, CG cathode substrate
The integrated cathode substrate was prepared by a vacuum filtration method. Typically, 10 g of commercial carbon nanotube slurry (Shenzhen Sanshun Nano New Materials Co., Ltd), 10 g of commercial graphene slurry (XFNANO Materials Tech Co. Ltd) were dispersed in 100 mL of anhydrous ethanol by ultrasonication for 1 h to form a uniform suspension. The cotton pads were vacuum-filtrated with the obtained suspension for 10 min. After drying in an air-dry oven at 90 °C for 5 h, the substrates were punched into 10 mm round pieces. Before transforming the substrates into an argon-filled glove box, they were dried under vacuum for 12 h.For the cotton carbon (CC) substrate and cotton graphene (CG) substrate, the procedure followed was similar to the one mentioned above. The suspensions consisted of 100 mL anhydrous ethanol and 10 g carbon nanotubes slurry (10 g graphene slurry) for the CC (CG) substrate.
2.3 Materials characterization
The CCG substrate surface morphologies and structure were characterized by scanning electron microscopy (SEM, Hitachi, S4800) and transmission electron microscopy (TEM, JEM-F200, Tokyo Electron). Energy-dispersive spectroscopy (EDS, FEI Quanta 650), which was mounted to the SEM, was used to examine sulfur elemental mapping. X-ray photoelectron spectroscopy (XPS, PHI 5000C) analysis was performed using a monochromatic Al Kα X-ray to analyze the components of the CCG substrate before and after cycling. X-ray diffraction (XRD) and Raman spectra were examined with a Bruker D8 Advance diffractometer using Cu-Kα radiation scanned between 5° and 85° (2θ) and Thermo Scientific DXRxi system with a 532 nm laser, respectively. Fourier transform infrared spectroscopy (FTIR) spectra were recorded on an infrared spectrometer (Nicolet 6700) with a KBr plate.2.4 Electrochemical measurements
The electrochemical performances of CCG and the compared substrate were tested using CR2032 coin-type half-cells assembled in an argon-filled glove box. Coin-type cells consisted of the as-prepared substrate, Li2S6 catholyte, Celgard 2500 polypropylene (PP) separator and a Li foil counter electrode (diameter: 16 mm, thickness: 0.6 mm). The charge and discharge curves of batteries were measured by a LAND CT2001A battery tester (Wuhan, China) at a constant temperature of 25 °C within incubators. The cells were charged and discharged from 1.7 V to 2.8 V. Electrochemical impedance spectroscopy (EIS) (range: 0.01–100![[thin space (1/6-em)]](https://www.rsc.org/images/entities/char_2009.gif) 000 Hz) and cyclic voltammogram (CV) curves (scan rate: 0.1 mV s−1, range: 1.7–2.8 V) were conducted on a CHI760 electrochemical workstation. The Li2S6 solution was prepared by mixing sulfur (S) and lithium sulfide (Li2S) in a vial (10 mL) at a stoichiometric mole ratio of 5:1, and then, a certain amount of the electrolyte was added according to the Li2S6 solution concentration. Then, the precursor solution was heated at 60 °C under vigorous stirring for 24 h, and a dark yellow Li2S6 solution was obtained. The sulfur loading was based on a calculation that included the mass loading of everything in the catholyte of the cell. For 2.0 mg cm−2 and 4.5 mg cm−2 sulfur loadings, 40 μL 0.2 mol L−1 and 61 μL 0.3 mol L−1 Li2S6 solution was added into the substrate. The additional blank electrolyte was added to wet the separator. The blank electrolyte was commercially purchased with 1.0 M lithium bis(trifluoromethanesulfonyl)imide and 1% lithium nitrate as an additive in 50:50 volume ratio DOL/DME solutions. All operations were under argon atmosphere.
000 Hz) and cyclic voltammogram (CV) curves (scan rate: 0.1 mV s−1, range: 1.7–2.8 V) were conducted on a CHI760 electrochemical workstation. The Li2S6 solution was prepared by mixing sulfur (S) and lithium sulfide (Li2S) in a vial (10 mL) at a stoichiometric mole ratio of 5:1, and then, a certain amount of the electrolyte was added according to the Li2S6 solution concentration. Then, the precursor solution was heated at 60 °C under vigorous stirring for 24 h, and a dark yellow Li2S6 solution was obtained. The sulfur loading was based on a calculation that included the mass loading of everything in the catholyte of the cell. For 2.0 mg cm−2 and 4.5 mg cm−2 sulfur loadings, 40 μL 0.2 mol L−1 and 61 μL 0.3 mol L−1 Li2S6 solution was added into the substrate. The additional blank electrolyte was added to wet the separator. The blank electrolyte was commercially purchased with 1.0 M lithium bis(trifluoromethanesulfonyl)imide and 1% lithium nitrate as an additive in 50:50 volume ratio DOL/DME solutions. All operations were under argon atmosphere.
3. Result and discussion
3.1 Morphology and structure
As shown in Fig. 1, the vacuum filtration process of the CCG substrate for Li–S batteries was facile and scalable with easily accessible raw materials. The natural cotton fiber had macropores shown in Fig. 2a. Cotton fibers were spatially interlaced and had a large space in three dimensions, as shown in Fig. 2a. During the battery assembly process, while the whole substrate was compressed and decreased in thickness, the three-dimensional shape did not change. After 300 cycles, the configuration of the substrate was still intact in the disassembled battery, as shown in Fig. S3.† Traditional lithium–sulfur batteries mostly use metals, such as aluminum foil and nickel mesh, as current collectors. When using these current collectors, additional carbon materials and adhesives are required to bind the active material to them, and the contact area of this one-dimensional structure is reduced.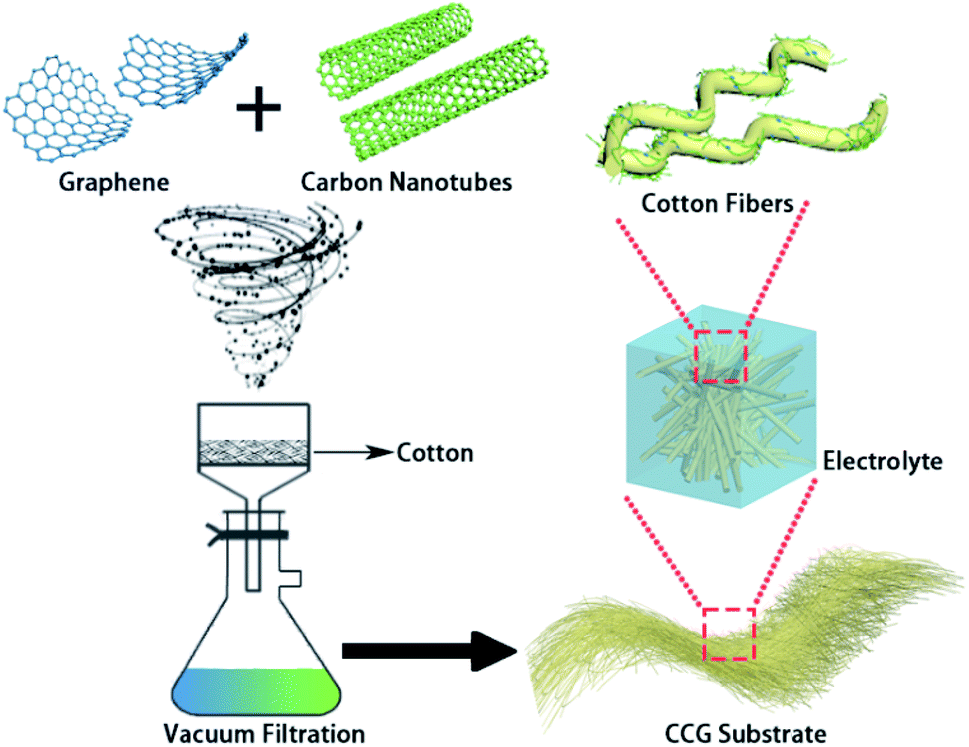 | ||
| Fig. 1 Schematic of the CCG substrate preparation and its corresponding configurations. | ||
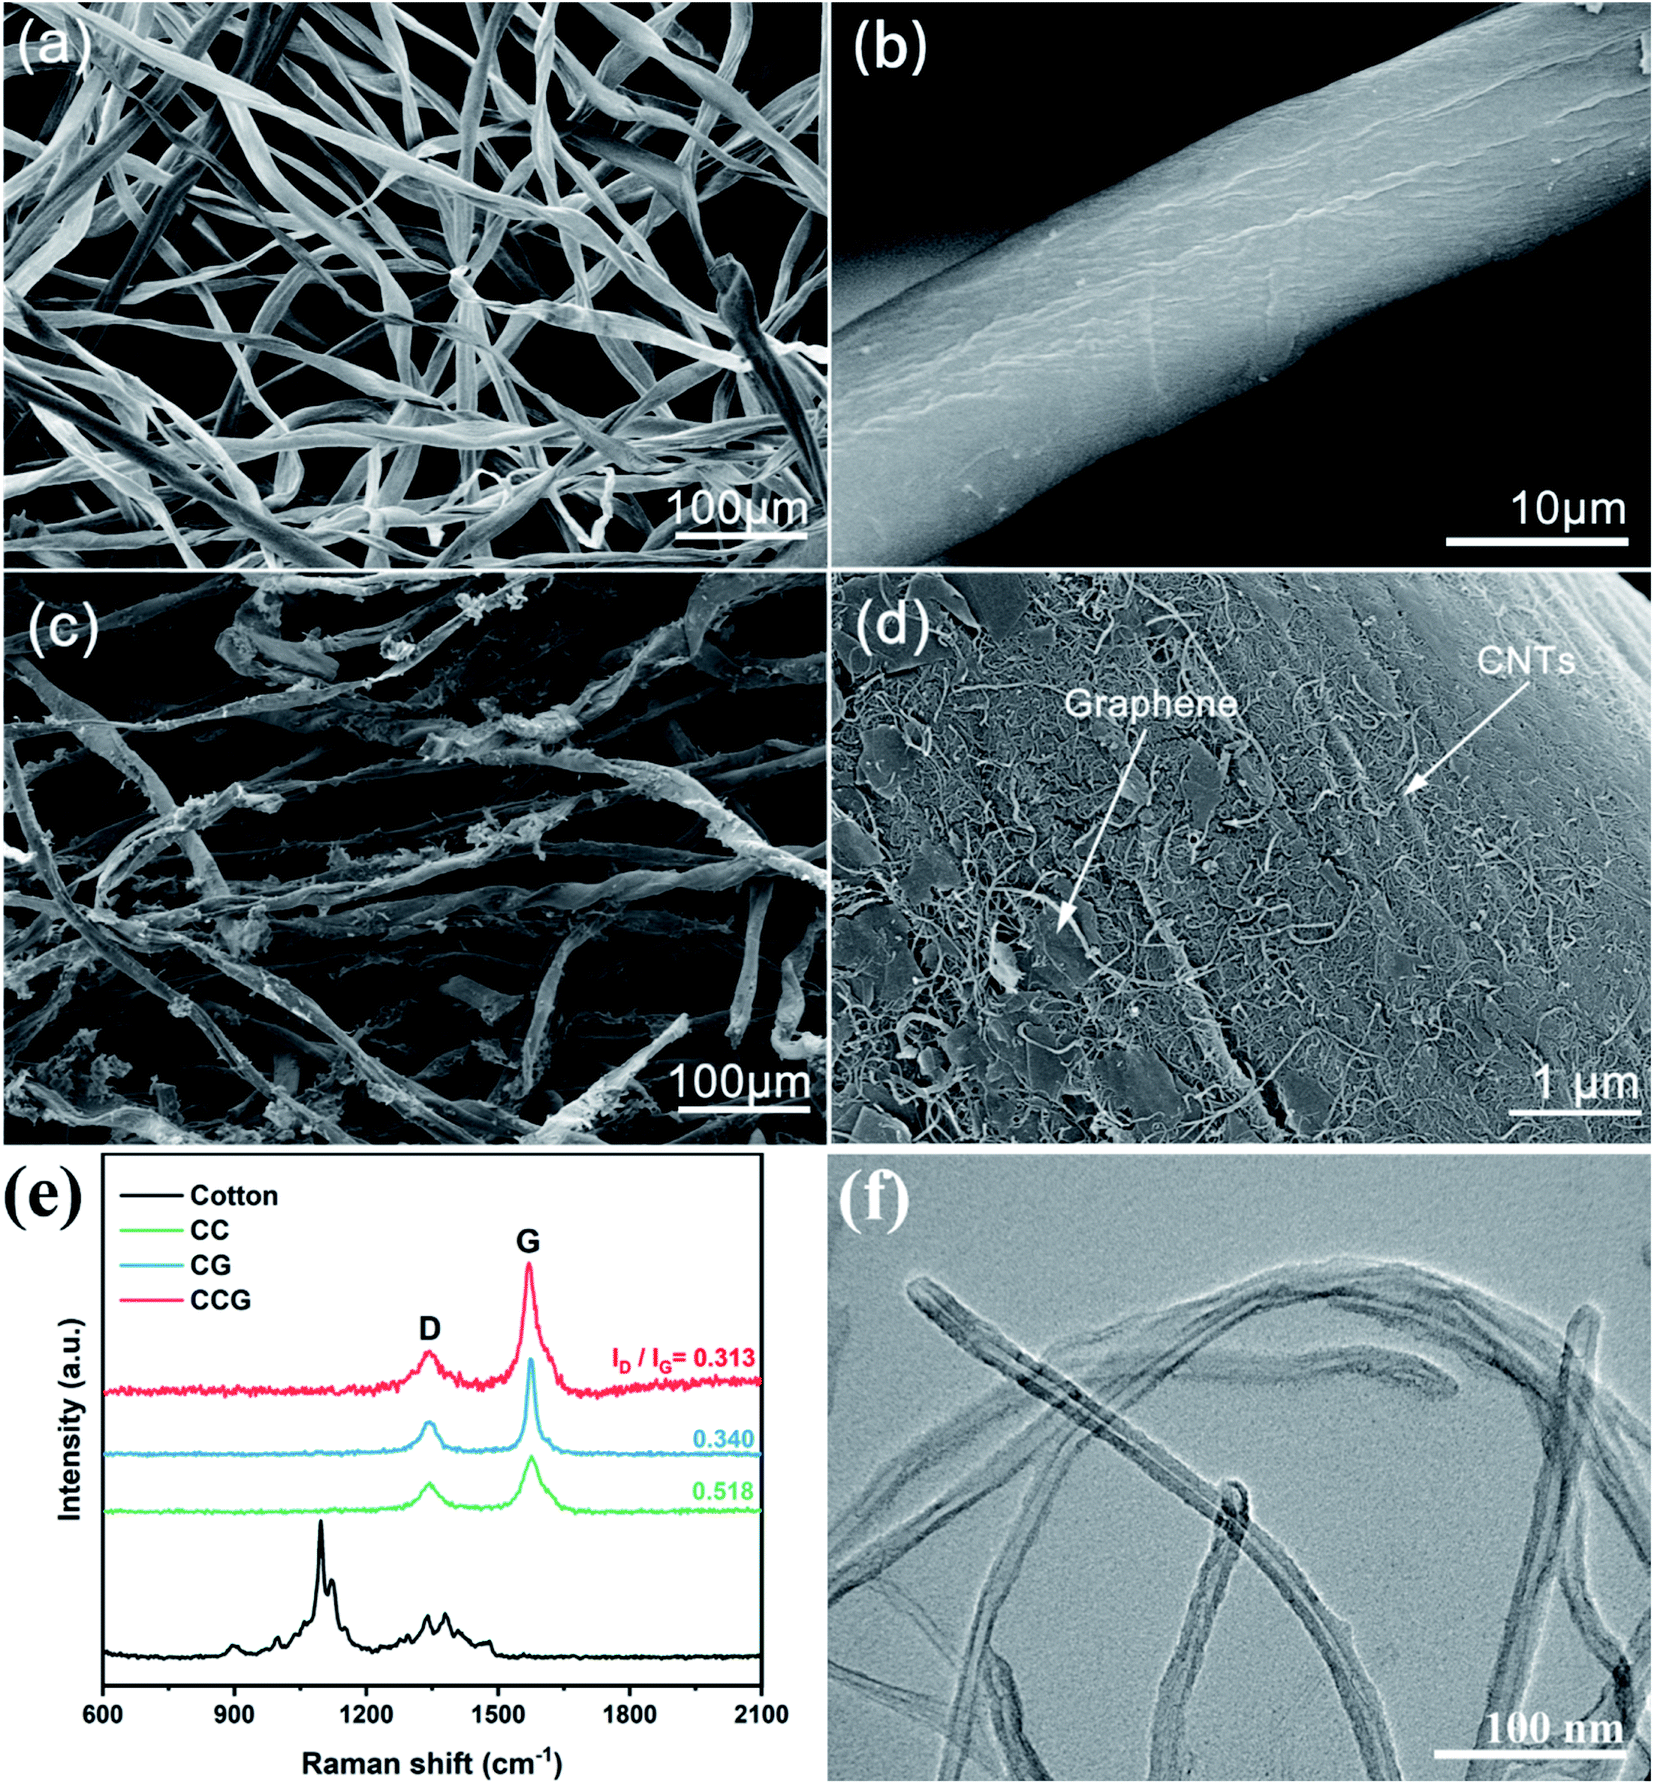 | ||
| Fig. 2 SEM images of (a and b) cotton fibers, (c and d) CCG substrates. (e) Raman spectra of cotton, CC, CG, and CCG substrates. (f) High-resolution transmission electron microscope (HRTEM) image of CNTs. | ||
Moreover, the electron flow path is only one, which is likely to cause low sulfur loading and utilization rate. Along with the inherent hollow structure of the substrate, the volumetric dilation of sulfur during the battery cycling can be offset, preserving the stability of the cells. It can be observed in Fig. 2b that there were only natural cracks on the surface of the cotton fiber, and the fiber surface is relatively smooth, as can be seen from the low-magnification SEM figures. After the loading of carbon nanotubes and graphene, the natural cotton fiber was wrapped by the two additives, as shown in the Fig. 2c, and appeared to have exfoliative peels. The surface of the cotton fiber became mottled, and a uniform layer of the conductive carbon material was wrapped into the fibers. In the enlarged Fig. 2d, it can be clearly distinguished that the carbon nanotubes and graphene were loaded on the surface of the cotton fiber. Graphene was wrapped around the fibers in a scale-like pattern, providing a fiber-axial electron conduction.27 The CNTs were embedded into the fibers and the interlaced parts were probed out. When the cell was assembled, the carbon nanotubes of different cotton fiber layers were interlaced with the fibers, forming a longitudinal pathway.28
3.2 Characteristics of substrate and cotton fiber
Fig. 2f shows the TEM images of CNTs with an average diameter of 15–20 nm and with interlaced filamentous structure.29 CNTs had favorable qualities and provided good and fast ion transform pass.30 The Raman spectra of the three different carriers are plotted in Fig. 2e. There was no apparent characteristic peak corresponding to carbon in the Raman spectrum of the cotton fiber. After adding CNTs and/or graphene, the three substrates showed two prominent distinct carbon peaks in the Raman spectrum. The G peak is the major characteristic peak of graphene. Peak D is a disordered vibration peak.28 The ID/IG of the CCG substrate is 0.313, which is superior to the CC (ID/IG = 0.340) and CG (ID/IG = 0.518). Due to the addition of graphene and CNTs, the resulting graphitization degree was better than the cotton fibers. The additives added to the cotton fiber provided a rich defect structure for the substrate, and increased the overall degree of graphitization. Through a simple addition, it could make up for the insufficient conductivity of the cotton fiber.XRD tests were carried out for different substrates, and the results are listed in Fig. 3c. In the XRD diffraction pattern, it can be seen that the diffraction pattern of cotton fiber can observe diffraction peaks at 2θ = 14.52°, 16.2°, 22.4°, and 34.0°, corresponding to the (110), (110), (020) and (004) reflections of cellulose with a monoclinic crystal symmetry and a space group of P21.31 The XRD diffraction patterns of the additives CNTs and graphene are listed in Fig. S5,† and there is a sharp peak at 2θ = 26.4°, corresponding to the (002) reflection of graphite, and graphene showed a broad peak at the same position. There is also a faint peak at 54.5° of CNTs, which corresponds to the (004) reflection.32 Comparing the XRD patterns of the three substrates with the cotton, CNTs, and graphene, characteristic peaks corresponded to 2θ = 14.52°, 16.2°, and 22.4° of cotton, which proved that the substrate did not change the crystalline state of cotton after loading the additives. Although the CG substrate had a characteristic peak corresponding to the graphite (002) reflection in the range of 26.4°, no peaks related to CNTs and graphene were observed in the CC and CCG substrates, indicating that these two additives have been dispersed into the cotton fiber.33
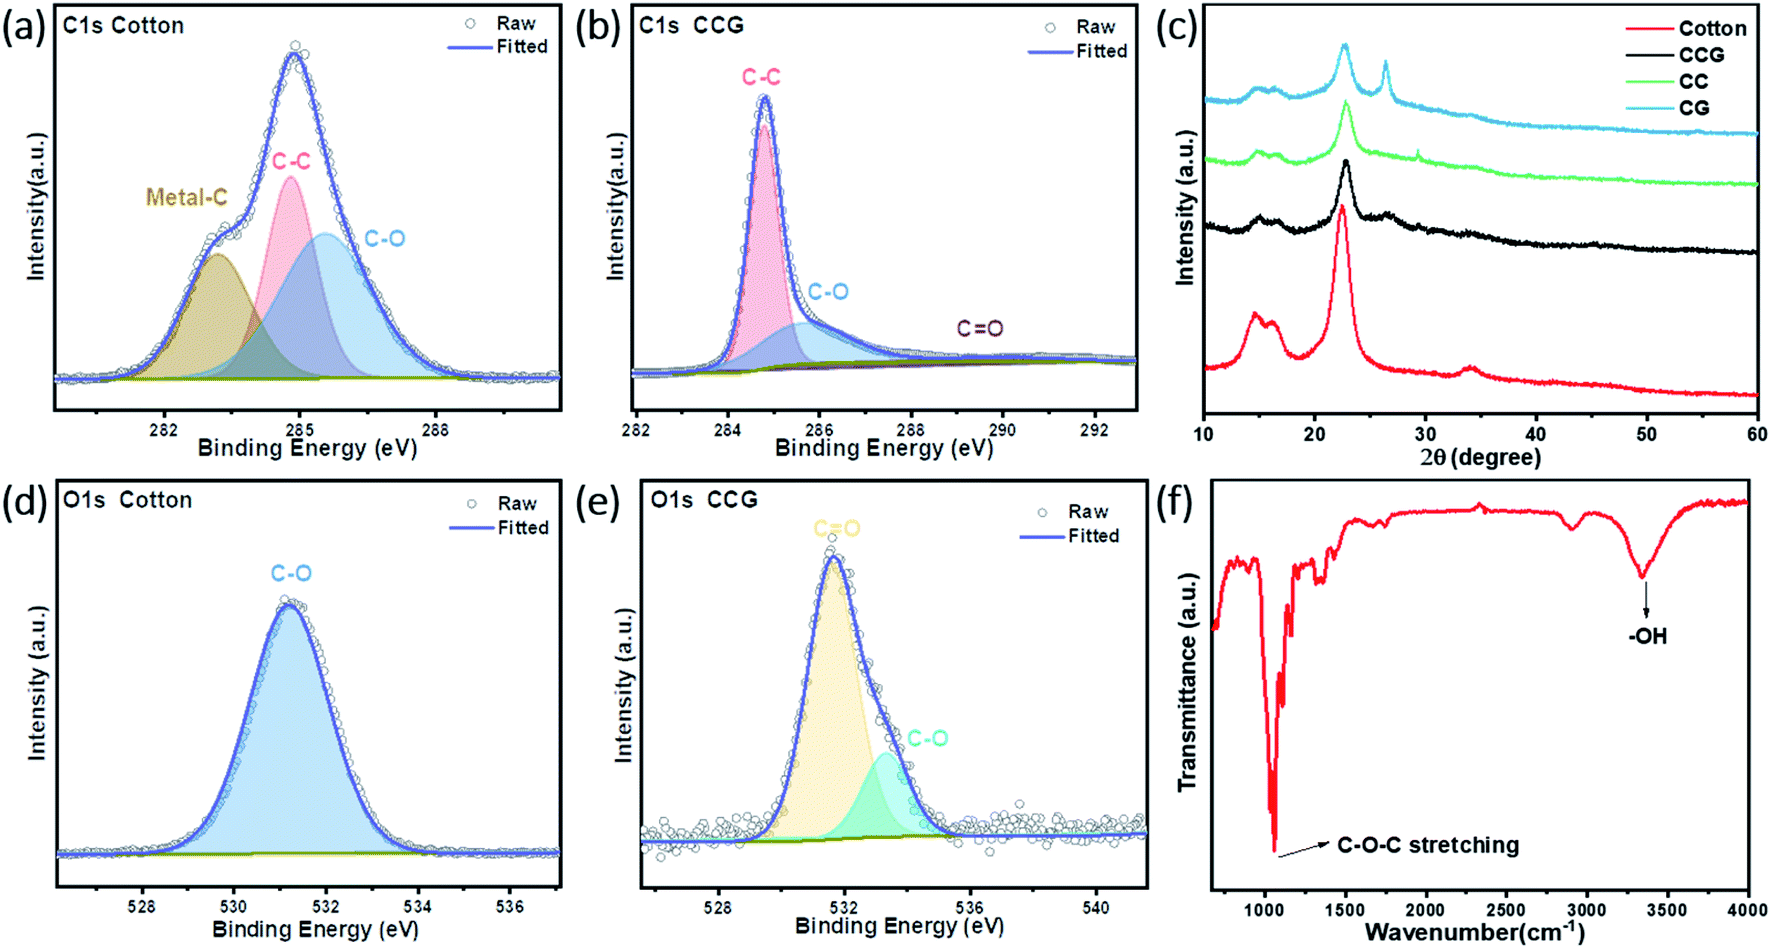 | ||
| Fig. 3 Carbon 1s XPS spectra of (a) cotton fibers and (b) CCG substrate. (c) XRD patterns of cotton, CC, CG, and CCG substrates. Oxygen 1s XPS spectra of (d) cotton fibers and (e) CCG substrate. (f) FTIR spectra of the cotton fiber. | ||
99% of natural cotton fiber is cellulose. According to the molecular structure of cellulose, numerous oxygen atoms come from the hydroxyl groups present in the cellulose.29,34 X-ray photoelectron spectroscopy (XPS) and FTIR tests were carried out on the cotton fiber samples. In the FTIR of Fig. 3f, it can be observed that the characteristic vibration bands at 3340 cm−1 and 1059 cm−1 correspond to the –OH group stretching and C–O–C stretching vibrations, respectively.35,36 XPS measurements were carried out to study the chemical composition of the substrates, and the results obtained are shown in Fig. 3a, b, d and e. The survey spectra of XPS in Fig. S4† prove the existence of large amounts of oxygen atoms. The deconvolution of carbon 1s spectra of cotton fibers reveal three peaks at 283.2, 284.8, and 285.6 eV, which can be assigned to metal–C, C–C, and C–O bonds, respectively, and the oxygen 1s peak at 531.2 eV, which corresponds to the C–O bonds. After the addition of CNTs and graphene, we also found the corresponding characteristic peaks of the XPS spectrum of CCG substrates in Fig. 3d and e. The S–O interaction between sulfur and oxygen atoms was found to fix polysulfides. The oxygen-containing hydroxyl groups on the surface of cotton fibers had the chemical entrapments for polysulfides.37,38 As Fig. S1† shows, the cotton, CC, CG and CCG substrate were immersed in the diluted Li2S6 solution for 24 h, and the signature yellow color of polysulfide faded, which apparently exhibited the chemical absorption of the hydroxyl groups in the cotton.
Through the energy dispersive X-ray spectroscopy (EDS) mapping image of the cotton fiber (Fig. S2†), oxygen atoms were distributed in a large amount and uniformly on the entire fiber. The identical well-distributed oxygen element results were also presented in CC and CG substrates (Fig. S3†). The even scattering of oxygen indicates the distribution of correspondent functional groups; therefore, the anchoring towards polysulfides prevented the potential of side reactions possibly caused due to the inhomogeneity of the sulfur.39 After dropping the polysulfide solution into three different substrates and going through about 50 cycles of electrochemical cycles, it could be clearly seen that the carbon and oxygen atom distributions of the three carriers were not different. However, the sulfur element distribution in the CCG substrate was finer and more refined, and broader and more uniform. It showed that the CCG substrate built a more accessible three-dimensional conductive network with two additives, and this excellent effect was also reflected in the electrochemical performance.
3.3 Electrochemical performance
To evaluate the electrochemical characteristics, we tested the cycle stability, rate performance, and series of measurements of the cells using CC, CG, CCG substrates in the type of the 2032-coin cells with a low sulfur loading of 2.0 mg cm−2 and a high sulfur loading of 4.5 mg cm−2. At a scan rate of 0.1 mV s−1, cyclic voltammetry was performed to describe the kinetics of electrochemical reactions using CCG, CC, and CG different substrates, respectively. It can be recognized in Fig. 4c that there are two closely adjacent oxidation potentials and two reduction potentials. The two clear reduction peaks referred to the transformation from sulfur to the long-chain polysulfide, and then, a step further to the short-chain polysulfide. The two oxidation peaks were related to the contrary reaction from Li2S/Li2S2 to sulfur. Besides, the oxidation peaks of the CCG substrate at 2.368 V and 2.431 V, and the battery oxidation peaks of the CC substrate and the CG substrate at 2.397 V, 2.480 V, and 2.377 V, 2.45 V had a negative shift.40,41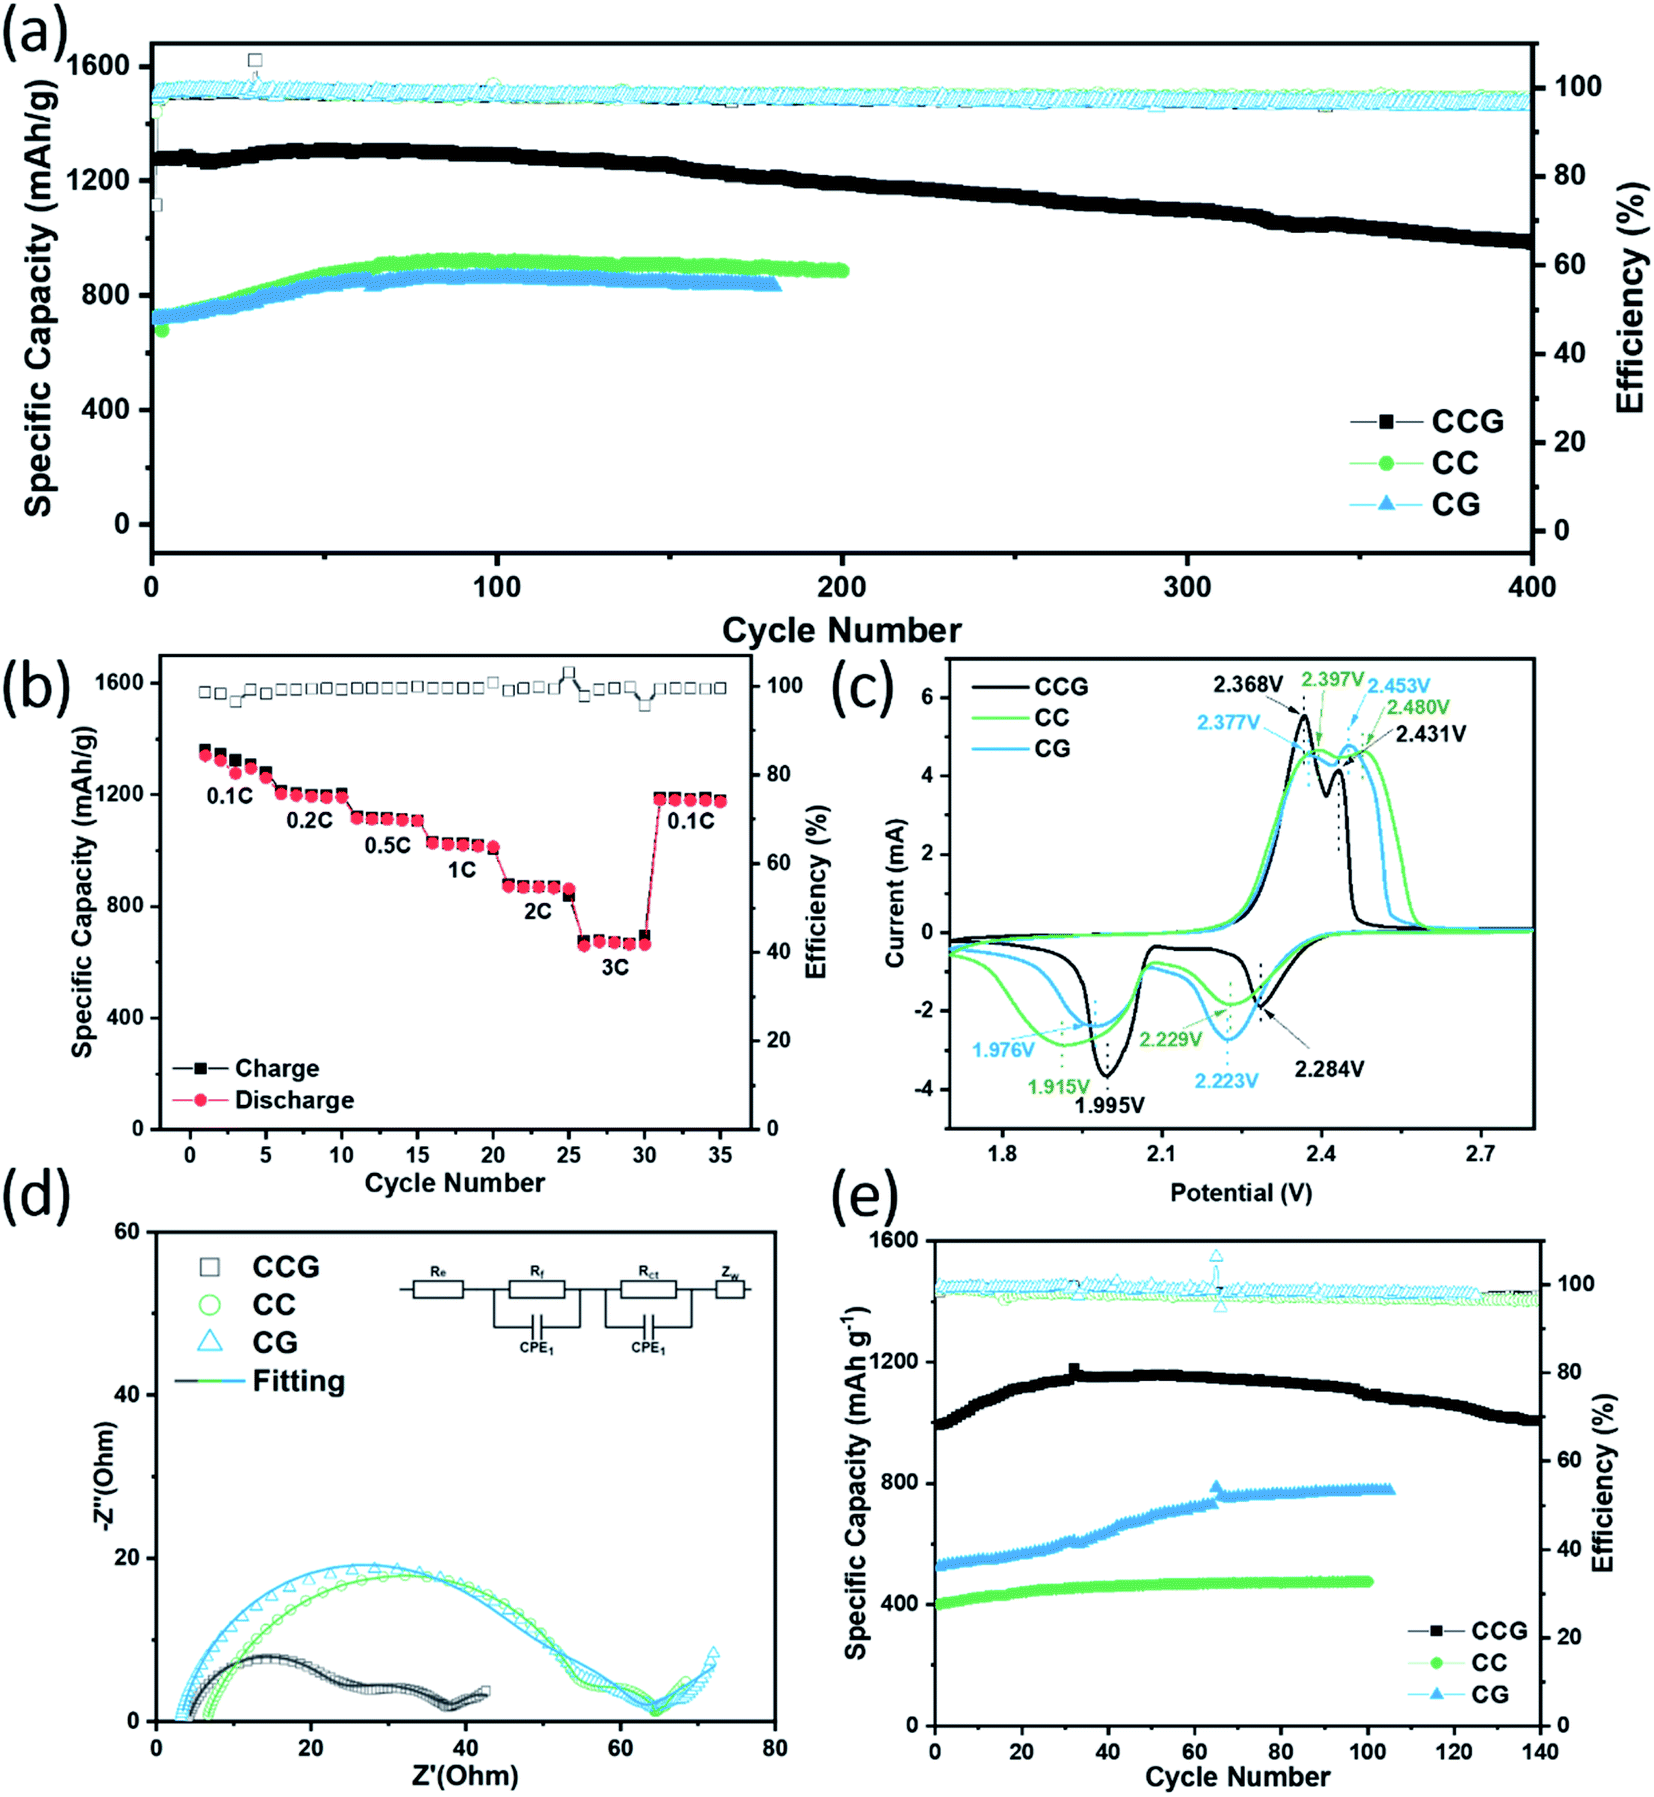 | ||
| Fig. 4 (a) Cycling performances of the batteries with different substrates with a low sulfur loading at a current density of 1C, (b) rate performances of the battery with CCG substrate, (c) CV of CC, CG, CCG substrates batteries at a scan rate of 0.1 mV s−1, respectively, (d) EIS profiles of Li–S batteries using CC, CG and CCG substrates, (e) cycling performances of the batteries with different substrates with a high sulfur loading at a current density of 0.5C. | ||
Similarly, the reduction peaks (1.995 V and 2.284 V) of the CCG base battery positively shifted from the 1.915 V and 2.229 V of the CC substrate and 1.976 V and 2.223 V of the CG substrate. Simultaneously, the CCG base's peak intensity was also significantly higher than the comparative base cell, and these shifts proved that the CCG base had lower polarization and accelerated redox kinetics. Fig S6† shows the obtained Nyquist diagrams of the CCG substrate electrode and Al electrodes to study the electronic conductivity of electrode materials. It should be noted that the diameter of the CCG substrate electrode semicircle was much smaller than that of Al electrodes, which proved that the conductivity of CCG was better. The addition of graphene improved the conductivity of the material, and the formed 3D network structure between cotton fibers and additives had a full range of extending conductive paths, and could enhance electron transmission. The results showed that the conductivity of the CCG substrate is good enough to serve as a current collector and a sulfur carrier. Fig. 4d shows the impedance spectra of the obtained CCG, CC, and CG substrate batteries under the open circuit potential after the active materials were loaded. The semicircle corresponding to the charge transfer resistance (Rct) of CCG is significantly smaller than those of CC and CG batteries. When CNTs and graphene were added, the electrical conductivity of the fiber network increased, and the polarization reduced, respectively. The natural particular interconnection structure of the CCG substrate can extend the current in all directions, effectively enhancing the electron transmission.
As shown in Fig. 4a, the batteries using CCG substrates showed a high initial capacity of 1274.0 mA h g−1 and remained 1098.7 mA h g−1 after 300 cycles at a current density of 1C with a capacity retention of 86.2%, 984.6 mA h g−1 after 400 cycles with a retention of 77.3%. The initial discharge capacities of CC and CG substrate batteries were 724.5 mA h g−1 and 717.4 mA h g−1, respectively, which were considerably less than that of CCG. Although the capacity of these two had a specific increase with the charging and discharging process of the batteries, there was still a certain disparity with the CCG substrate battery capacity even after 200 cycles. The excellent performance of the CCG batteries made the 100th charge–discharge curve almost coincide with the first charge–discharge curve, as shown in Fig. S7.† Besides, these types of batteries in Fig. S8† even possessed 872.4 mA h g−1 at a 2C charge–discharge rate, and maintained a capacity of 734.4 after 200 cycles with only a 0.079% per cycle decay rate. Furthermore, under the case of the high sulfur loading (4.5 mg cm−2), the cycle performance of the battery was evaluated. Under the condition of 0.5C rate charge and discharge (Fig. 4e), the battery with the CCG substrate had an initial capacity of 993.7 mA h g−1 and remained 1006.0 mA h g−1 capacity after 140 cycles, preserving a capacity with basic no attenuation, which was much higher than the initial capacity of 401.0 and 525.8 mA h g−1 of CC and CG substrate batteries, respectively. Although the capacity of the two had a certain increasing trend during the cycle, it was still far lower than that of the CCG base battery. The rate performances of the cells with different substrates are shown in Fig. 4b and S9.† With the increment in the densities from 0.1 to 3.0C, the discharge capacities of CCG substrate batteries were 1358.4, 1213.6, 1121.0, 1030.1, 879.5, and 674.4 mA h g−1, respectively, which were much higher than those of the batteries with CC and CG substrates. When the rate returned to 0.1C, the discharge capacity was still 1188.4 mA h g−1, which proved the excellent rate performance of these batteries.
The charge and discharge profiles of the CC, CG, and CCG substrates are plotted in Fig. 5a–c. Two emblematical discharge plateaus can be recognized from the profiles. The first plateau at around 2.3 V refers to that the ring of S8 opened with the participation of lithium to form long-chain polysulfide (Li2Sn, n = 4–8). Another discharging plateau is related to the reduction of the long-chain polysulfide to a short-chain polysulfide (Li2S2/Li2S). To have a direct view, the specific capacities of the plateaus at lower and higher potentials are denoted as Q1 and Q2, respectively. Theoretically, the capacity from reaction (Li2S4–8 → Li2S2/Li2S) was three times of the first one (S8 → Li2S4–8). Nevertheless, the capacity ratio (Q2/Q1) was generally less than the ideal value due to the torpid transformation and solid-state charge diffusion when short-chain polysulfides were reduced to Li2S.42,43 In Fig. 5d–f, the capacity ratios at different C rates for the three compared electrodes are listed. The capacity and capacity ratio of CCG electrodes are relatively higher than the CC and CG electrodes, particularly at 0.5C rate and above. The ratio of CCG electrodes was 2.35 to 1.57 at a 0.1 to 2C rate (1C = 1675 mA h g−1), confirming that a majority of the polysulfide could be converted into Li2S2/Li2S.38 With the cooperative effect of CNTs and graphene, which formed a scaffold on the surface of the cotton fiber and the space provided by the natural cotton structure, the electrolyte diffused more quickly and reaction kinetics accelerated. Moreover, the voltage hysteresis (ΔE) between the charge and discharge profiles of CCG was 133 mV less than the 144 mV and 152 mV for CG and CC electrodes. Low ΔE demonstrates the decreased polarization and improved reaction kinetics by the CCG substrates.22,44,45 These experimental results are consistent with the results in the CV curve in Fig. 4c.
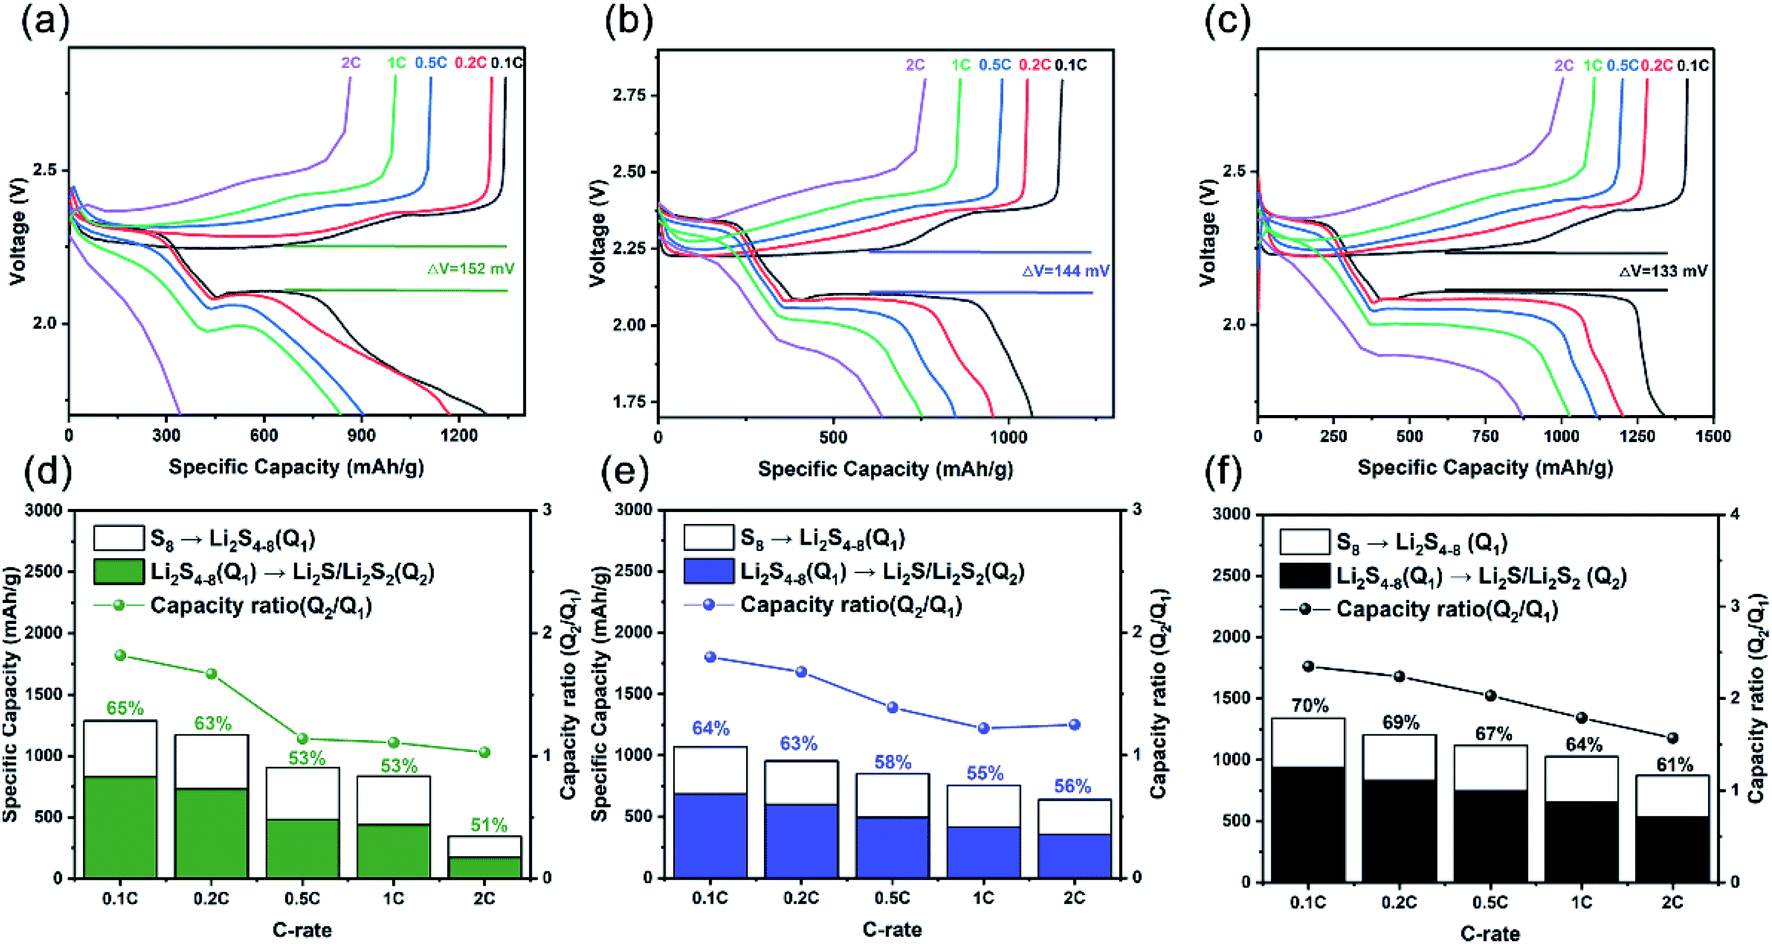 | ||
| Fig. 5 Charge and discharge specific capacity versus voltage profiles of the (a) CC, (b) CG, (c) CCG substrate batteries from 0.1C to 2C. Capacity contribution of lower potential (Q1) and higher potential (Q2) and the Q2/Q1 ratio at various C rates for the (d) CC, (e) CG, (f) CCG substrate batteries. | ||
4. Conclusion
In summary, we prepared a base material for a lithium–sulfur battery with cotton fibers as the main body and added nanotubes and graphene, and combined feasible and straightforward methods to realize a high-performance lithium-ion battery. This type of substrate electrode, which did not require additional binders and was easy to prepare, provided a three-dimensional interconnected conductive frame for the sulfide active material to improve the utilization of sulfur. The surface can chemically adsorb polysulfide to achieve a shuttle effect. A battery with a sulfur content of 2.0 mg cm−2 could provide a high initial discharge capacity of 1098.7 mA h g−1. At 1.0C, the attenuation after 300 cycles is only 0.046%, and the initial discharge capacity at 2C ratio is 872.4 mA h g−1. The batteries remained 734.4 mA h g−1 after 200 cycles with a decay rate of only 0.079% per cycle. Through a series of characterizations and analyses, it was demonstrated that substrate polarization, cotton fiber reaction sites, and polysulfide immobilization performance must be considered simultaneously to achieve a high-performance lithium–sulfur battery. It provides a low-cost green manufacturing process for potentially commercial lithium–sulfur battery applications.Conflicts of interest
The authors declare no conflicts of interest.Acknowledgements
This work acknowledges the financial support from the Shandong Province Key Research and Development Plan (Grant No. 2019GHZ009), the Hundred Talents Program of Chinese Academy of Science (DICP & QIBEBT, Grant No. UN201702), the Youth Fund from Natural Science Foundation of Shandong Province (Grant No. ZR2020QB124) and the Dalian National Laboratory for Clean Energy (DNL, CAS).References
- S. Chu, Y. Cui and N. Liu, Nat. Mater., 2017, 16, 16–22 CrossRef.
- M. Zhao, B. Q. Li, X. Q. Zhang, J. Q. Huang and Q. Zhang, ACS Cent. Sci., 2020, 6, 1095–1104 CrossRef CAS PubMed.
- Y. Hu, W. Chen, T. Lei, Y. Jiao, J. Huang, A. Hu, C. Gong, C. Yan, X. Wang and J. Xiong, Adv. Energy Mater., 2020, 10, 2000082 CrossRef CAS.
- P. G. Bruce, S. A. Freunberger, L. J. Hardwick and J. M. Tarascon, Nat. Mater., 2011, 11, 19–29 CrossRef PubMed.
- F. Wu, J. Maier and Y. Yu, Chem. Soc. Rev., 2020, 49, 1569–1614 RSC.
- J. Wang, Z. Zhang, X. Yan, S. Zhang, Z. Wu, Z. Zhuang and W.-Q. Han, Nano-Micro Lett., 2020, 12, 1–14 CrossRef.
- S. Urbonaite, T. Poux and P. Novák, Adv. Energy Mater., 2015, 5, 1500118 CrossRef.
- J. Dewulf, G. Van der Vorst, K. Denturck, H. Van Langenhove, W. Ghyoot, J. Tytgat and K. Vandeputte, Resour., Conserv. Recycl., 2010, 54, 229–234 CrossRef.
- Y. Liang, C. Z. Zhao, H. Yuan, Y. Chen, W. Zhang, J. Q. Huang, D. Yu, Y. Liu, M. M. Titirici, Y. L. Chueh, H. Yu and Q. Zhang, InfoMat, 2019, 1, 6–32 CrossRef CAS.
- H. Wang, W. Zhang, J. Xu and Z. Guo, Adv. Funct. Mater., 2018, 28, 1707520 CrossRef.
- Z. Gao, Y. Zhang, N. Song and X. Li, Electrochim. Acta, 2017, 246, 507–516 CrossRef CAS.
- T. Liu, X. Sun, S. Sun, Q. Niu, H. Liu, W. Song, F. Cao, X. Li, T. Ohsaka and J. Wu, Electrochim. Acta, 2019, 295, 684–692 CrossRef CAS.
- K. Xi, D. He, C. Harris, Y. Wang, C. Lai, H. Li, P. R. Coxon, S. Ding, C. Wang and R. V. Kumar, Adv. Sci., 2019, 6, 1800815 CrossRef PubMed.
- J. Tu, H. Li, T. Lan, S.-Z. Zeng, J. Zou, Q. Zhang and X. Zeng, J. Alloys Compd., 2020, 822(153751) CAS.
- W. Sun, C. Liu, Y. Li, S. Luo, S. Liu, X. Hong, K. Xie, Y. Liu, X. Tan and C. Zheng, ACS Nano, 2019, 13, 12137–12147 CrossRef CAS PubMed.
- J. Liu, Y. Li, Y. Xuan, L. Zhou, D. Wang, Z. Li, H. Lin, S. Tretiak, H. Wang, L. Wang, Z. Guo and S. Zhang, ACS Appl. Mater. Interfaces, 2020, 12, 17592–17601 CrossRef CAS PubMed.
- Y. Hu, X. Zhu and L. Wang, ChemSusChem, 2020, 13, 1366–1378 CrossRef CAS.
- Z. Wu, S. Yao, R. Guo, Y. Li, C. Zhang, X. Shen, T. Li and S. Qin, Int. J. Energy Res., 2020, 44, 3110–3121 CrossRef CAS.
- D. Cao, Y. Jiao, Q. Cai, D. Han, Q. Zhang, Y. Ma, A. Dong and H. Zhu, J. Mater. Chem. A, 2019, 7, 3289–3297 RSC.
- Y. Mi, W. Liu, K. R. Yang, J. Jiang, Q. Fan, Z. Weng, Y. Zhong, Z. Wu, G. W. Brudvig and V. S. Batista, Angew. Chem., Int. Ed., 2016, 55, 14818–14822 CrossRef CAS PubMed.
- X. Wu, Y. Du, P. Wang, L. Fan, J. Cheng, M. Wang, Y. Qiu, B. Guan, H. Wu and N. Zhang, J. Mater. Chem. A, 2017, 5, 25187–25192 RSC.
- P. Xiao, F. Bu, G. Yang, Y. Zhang and Y. Xu, Adv. Mater., 2017, 29, 1703324 CrossRef PubMed.
- X. Shen, N. Xu, X. Liu, J. Liu, T. Qian and C. Yan, Nanotechnology, 2020, 31, 485403 CrossRef CAS PubMed.
- Q. Pang, X. Liang, C. Y. Kwok, J. Kulisch and L. F. Nazar, Adv. Energy Mater., 2017, 7, 1601630 CrossRef.
- J. Yang, L. Xu, S. Li and C. Peng, Nanoscale, 2020, 12, 4645–4654 RSC.
- S.-H. Moon, M.-C. Kim, J.-H. Choi, Y.-S. Kim, H. Kim and K.-W. Park, J. Alloys Compd., 2021, 857(158236) CAS.
- X. Xu, M. Luo, P. He, X. Guo and J. Yang, Appl. Phys. A, 2019, 125(714) Search PubMed.
- C. Li, Z. Xi, S. Dong, X. Ge, Z. Li, C. Wang and L. Yin, Energy Storage Mater., 2018, 12, 341–351 CrossRef.
- B. Zheng, N. Li, J. Yang and J. Xi, Chem. Commun., 2019, 55, 2289–2292 RSC.
- I. Khan, S. Huang and C. Wu, New J. Phys., 2017, 19(123016) CAS.
- R. S. Costa, A. Guedes, A. M. Pereira and C. Pereira, J. Mater. Sci., 2020, 55, 10121–10141 CrossRef CAS.
- J. Amaro-Gahete, A. Benítez, R. Otero, D. Esquivel, C. Jiménez-Sanchidrián, J. Morales, Á. Caballero and F. J. Romero-Salguero, Nanomaterials, 2019, 9, 152 CrossRef CAS PubMed.
- Y.-R. Son and S.-J. Park, Sci. Rep., 2018, 8, 1–10 CAS.
- T. Theivasanthi, F. L. Anne Christma, A. J. Toyin, S. C. B. Gopinath and R. Ravichandran, Int. J. Biol. Macromol., 2018, 109, 832–836 CrossRef CAS PubMed.
- A. D. Kramar, B. M. Obradović, A. Vesel, M. M. Kuraica and M. M. Kostić, Cellulose, 2018, 25, 4199–4209 CrossRef CAS.
- B. P. Rocky and A. J. Thompson, Fibers Polym., 2021, 22, 916–927 CrossRef CAS.
- L. Ji, M. Rao, H. Zheng, L. Zhang, Y. Li, W. Duan, J. Guo, E. J. Cairns and Y. Zhang, J. Am. Chem. Soc., 2011, 133, 18522–18525 CrossRef CAS PubMed.
- T. Liu, S. Sun, W. Song, X. Sun, Q. Niu, H. Liu, T. Ohsaka and J. Wu, J. Mater. Chem. A, 2018, 6, 23486–23494 RSC.
- W. Li, H. Yao, K. Yan, G. Zheng, Z. Liang, Y. M. Chiang and Y. Cui, Nat. Commun., 2015, 6, 7436 CrossRef CAS PubMed.
- Y. Zuo, P. Ren, M. Zhao, W. Su, Y. Chen, Y. Tang and Y. Chen, J. Alloys Compd., 2020, 819(152995) CAS.
- X. Wen, K. Xiang, Y. Zhu, L. Xiao, H. Liao, W. Chen, X. Chen and H. Chen, J. Alloys Compd., 2020, 815(152350) CAS.
- D. Gueon, M.-Y. Ju and J. H. Moon, Proc. Natl. Acad. Sci., 2020, 117, 12686–12692 CrossRef CAS PubMed.
- T. An, D. Deng, M. Lei, Q.-H. Wu, Z. Tian, M. Zheng and Q. Dong, J. Mater. Chem. A, 2016, 4, 12858–12864 RSC.
- J.-J. Chen, R.-M. Yuan, J.-M. Feng, Q. Zhang, J.-X. Huang, G. Fu, M.-S. Zheng, B. Ren and Q.-F. Dong, Chem. Mater., 2015, 27, 2048–2055 CrossRef CAS.
- S. H. Chung, C. H. Chang and A. Manthiram, ACS Nano, 2016, 10, 10462–10470 CrossRef CAS PubMed.
Footnote |
| † Electronic supplementary information (ESI) available. See DOI: 10.1039/d1ra06568h |
| This journal is © The Royal Society of Chemistry 2021 |