
 Open Access Article
 This Open Access Article is licensed under a Creative Commons Attribution-Non Commercial 3.0 Unported Licence
Polytriphenylamine composites for energy storage electrodes: effect of pendant vs. backbone polymer architecture of the electroactive group†
Afshin Dianatdar a,
Okan Akina,
Irene Mongattia,
Jamo Momandb,
Giacomo Ruggeric,
Francesco Picchionia and
Ranjita K. Bose*a
a,
Okan Akina,
Irene Mongattia,
Jamo Momandb,
Giacomo Ruggeric,
Francesco Picchionia and
Ranjita K. Bose*a
aDepartment of Chemical Engineering, Engineering and Technology Institute Groningen (ENTEG), University of Groningen, Nijenborgh 4, 9747AG Groningen, The Netherlands. E-mail: r.k.bose@rug.nl; Tel: +31 50 3634486
bZernike Institute for Advanced Materials, University of Groningen, Nijenborgh 4, 9747AG Groningen, The Netherlands
cDipartimento di Chimica e Chimica Industriale, Università di Pisa, Via G. Moruzzi 13, 56124 Pisa, Italy
First published on 1st November 2021
Abstract
Polymers are an increasingly used class of materials in semiconductors, photovoltaics and energy storage. Polymers bearing triphenylamine (TPA) or its derivatives in their structures have shown promise for application in electrochemical energy storage devices. The aim of this work is to systematically synthesize polymers bearing TPA units either as pendant groups or directly along the backbone of the polymer and evaluate their performance as electrochemical energy storage electrode materials. The first was obtained via radical polymerization of an acrylate monomer bearing TPA as a side group, resulting in a non-conjugated polymer with individual redox active sites (rP). The latter was obtained by oxidative polymerization of a substituted TPA, resulting in a conjugated polymer with TPA units along its backbone (cP). These polymers were then developed into electrodes by separately blending them with multi-wall carbon nanotubes (rC and cC). The electrodes were characterized and their charge storage stability and mechanical properties were investigated for up to 1000 cycles by cyclic voltammetry, galvanostatic charge–discharge measurements and nanoindentation. The results show that cC offers a higher initial charge capacity than rC as well as improved carbon nanotube dispersion due to its conjugated structure. Although the improved dispersion results in a higher elastic modulus for cC (compared to rC), the stiffer nature of cP made it more vulnerable to degrade upon repetitive volumetric change, while with rP, the decoupled acrylate monomer remained more protected when its redox active units of TPA underwent charge–discharge cycling.
Introduction
Electroactive polymers have attracted a lot of interest in electrochemical energy storage devices in the past two decades, stretching the realm of conventional inorganic materials with organic (macro)molecules. Fast electrochemical kinetics, good charge–discharge capacity, mechanical flexibility, resource availability, and being comparably cheaper and more environmentally friendly are among the reasons making them a desirable choice.1–5Among electroactive polymers, the ones that bear triphenylamine (TPA) groups in their structure have gained special interest. The promising performance of TPA-bearing polymers (PTPAs) is attributed to the chemical structure of TPA, combining the conductivity of poly(p-phenylene) with high energy density of polyaniline.6 In an early study, Feng et al.6 reported that a PTPA derivative showed a high capacity of 103 mA h g−1, when used as a battery cathode and cycled at 0.5C. Following this, there were multiple reports on application of PTPAs in batteries or supercapacitors. The main focus has been increasing of electrode capacity as well as power/energy density by structural tuning of TPA and/or its combination with inorganic materials.7–18 Despite this progress, the long-term performance and stability of PTPAs can be a bottleneck toward their practical applications, like other electroactive polymers.19–22 This stability issue arises from the repetitive insertion/disinsertion of counter ions during charge–discharge cycles, resulting in a constant volumetric change. Such an event culminates in mechanical disintegration and performance loss during time.23–25 This problem could be exacerbated with rod-like rigid structure of conjugated polymers,26–28 which are significantly stiffer than the traditional flexible polymers.
To tackle the above challenge, it is crucial to have an understanding how the structure of PTPA is impacted when oxidized/reduced during a charge/discharge cycle. Despite different derivatives of PTPAs,6,13,16,29 they could be broadly categorized into two groups: (i) the ones in which the TPA also serve as the building block with placing TPA along the polymer backbone; (ii) the ones with TPA decoupled from the backbone, placing it in side chain of the building block (see Scheme 1). The first one makes a conjugated PTPA, while the latter is a non-conjugated but redox active PTPA.
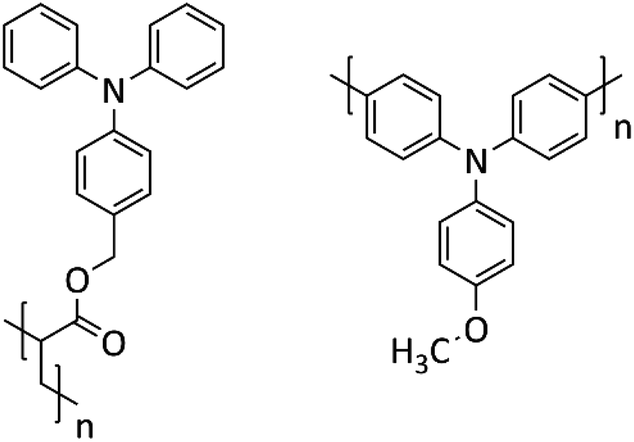 | ||
| Scheme 1 TPA-polymer architecture with TPA in side chain (left), and along the backbone (right). | ||
The advantage of conjugated PTPAs can be a higher conductivity; though when a TPA unit is oxidized, it may limit the doping level by hindering oxidation of the adjacent TPA unit. On the other hand, redox PTPAs could be fully doped and have shown to have lower Coulombic repulsion.30–32 From mechanical stability point of view, it could be hypothesized that a conjugated PTPA is more severely affected as its backbone undergoes constant volumetric change.
At the same time, it should be noted that electroactive polymers (conjugated or redox-active) have rarely been singularly used as an electrode. They are often combined with other highly conductive fillers to meet the requirement of high bulk conductivity in an electrode which is necessary for fast electron transfer. A common choice is carbon-based nanomaterials, which also offer additional mechanical protection to electroactive polymers when combined with them.33,34 Carbon nanotube (CNT) can be particularly attractive as an strengthening filler7 due to their high electrical conductivity and mechanical strength.7 In these applications, polymers could be either covalently or non-covalently hybridized with CNTs.35 While the former results in a more intimate contact between polymer and the nanotube, the sp2 hybridized structure of CNT is disturbed during the polymer–CNT “grafting process”, undermining the electronic performance of the composite.36,37 On the other hand, a non-covalent processing of electroactive polymer with nanotube often relies on π–π stacking and/or hydrogen bonding between the polymer and CNT, which could preserve the primary properties of CNT and benefit from their synergistic effects.38 Nevertheless, for the current discussion, an important question is how CNTs interact with either conjugated PTPA or redox PTPA in polymer-wrapped CNTs via non-covalent approach. This particular aspect has never been explored, which we systematically explore with this research.
Two sets of polymers were synthesized: one with TPA units as side groups representative of redox PTPA (hereafter called as rP), and the other with TPA units along its backbone representative of a conjugated PTPA (hereafter called as cP). Both sets were fully characterized and their electrochemical properties were studied. They were then further processed with CNTs to make composites (rC and cC, respectively). Subsequently, their energy storage performance was monitored through charge–discharge experiments and mechanical tests up to 1000 cycles.
It should be noted that the aim of this work was to investigate the fundamental question of how differences in pendant group vs. backbone placement of PTPA in the polymer architecture would impact the electrochemical energy storage performance and stability during repetitive charge–discharge processes.
Experimental
Triphenylamine (98%), phosphorus(V) oxychloride (99%), sodium borohydride (96%), sodium acetate (99%), triethylamine (anhydrous, 99.5%), acryloyl chloride, sodium acetate, 2,2′-azobis(2-methylpropionitrile) (AIBN, 98%), 4-methoxytriphenylamine (97%), iron(III) chloride (97%), N,N-dimethylformamide (DMF, 99.8%), methyl alcohol (99.8%), 1-methyl-2-pyrrolidinone (NMP, 99%) and anhydrous chloroform (99%) were all purchased from Sigma Aldrich and used as received. Tetrahydrofuran (Boom) and toluene (Macron) were dried using the MBraun SPS800 system. Carboxylic-acid functionalized multiwall carbon nanotube (MWCNT-COOH, 9.5 nm × 1.5 micron) was also purchased from Aldrich and used with no further treatment.Synthesis of TPAA monomer
The monomer was synthesized in three steps (Scheme 2) using established procedures39 with the following modifications.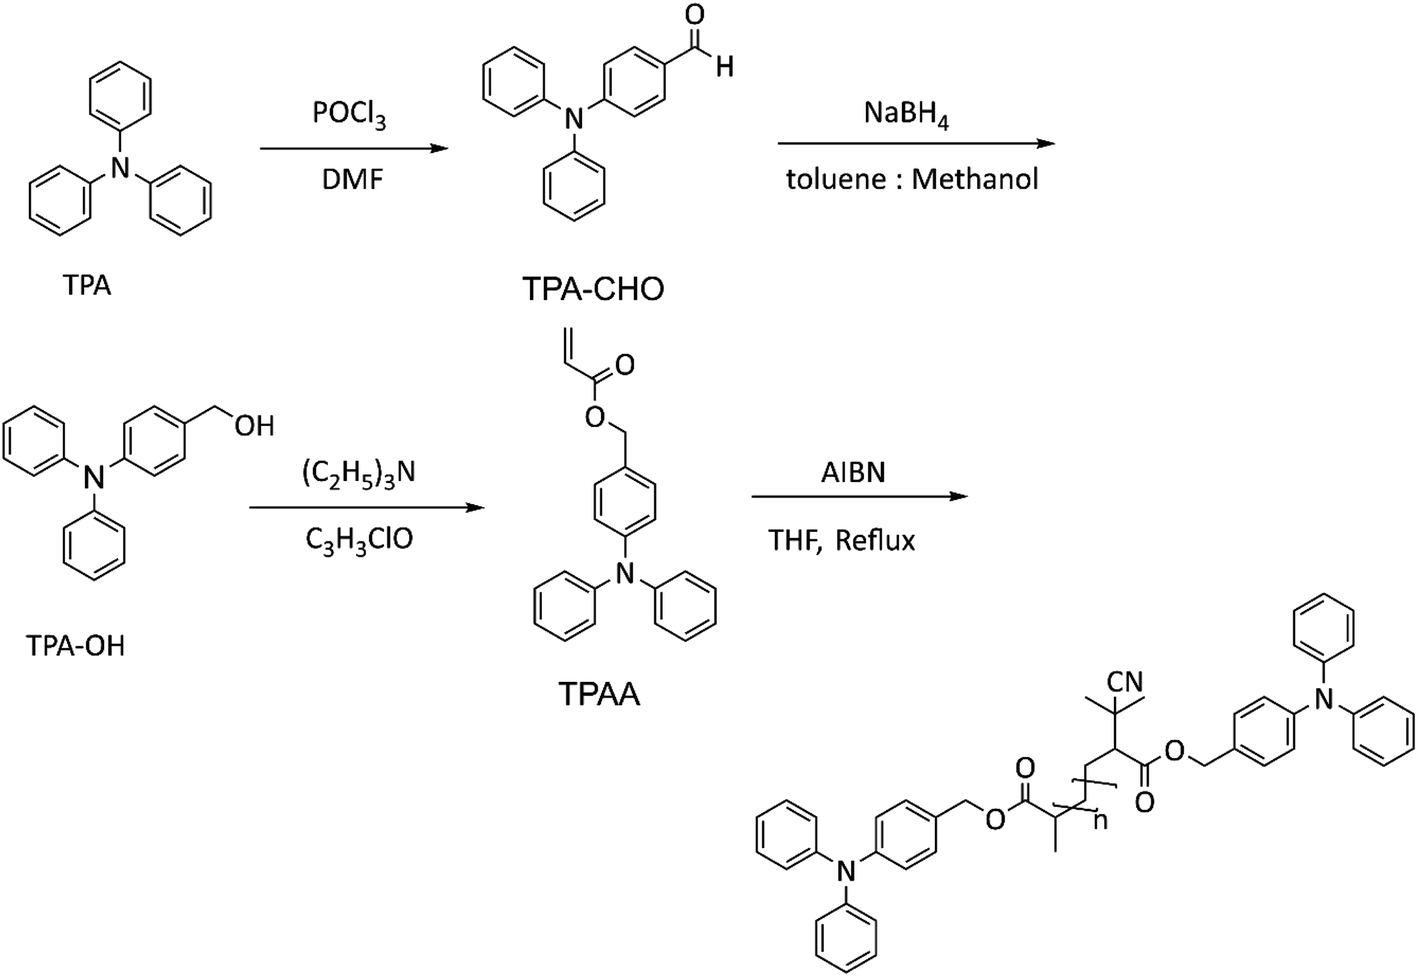 | ||
| Scheme 2 Synthesis of TPAA and its radical polymerization to rP. | ||
![[thin space (1/6-em)]](https://www.rsc.org/images/entities/char_2009.gif) :hexane 4:1) resulted in a yellow powder of TPA-CHO.
:hexane 4:1) resulted in a yellow powder of TPA-CHO.
1H-NMR (400 MHz, CDCl3). δ ppm = 9.81 (s, 1H, CHO), 7.68 (d, J = 8.8 Hz, 2H, H–Ar), 7.34 (t, J = 7.9, 4H, H–Ar), 7.18–7.15 (m, 6H, H–Ar), 7.01 (d, J = 8.7 Hz, 2H, H–Ar) (Fig. S1†).
13C-NMR (MHz, CDCl3). δ ppm = 193.2 (s, 1C), 156.0 (s, 1C), 148.9 (s, 2C), 134.0 (s, 2C), 132.4 (s, 4C), 131.7 (s, 1C), 129.0 (s, 2C), 127.7 (s, 4C), 122.0 (s, 2C) (Fig. S1†).
:methanol (50:50% v/v) at 0 °C, and excess NaBH4 (5 g) was gradually added to the flask under inert atmosphere. The reaction continued for 5 h at 0 °C and at RT overnight. Then the solvent was evaporated using a rotary evaporator, and the crude product was washed and extracted several times with DCM and DI water. The organic layer was dried over MgSO4, and solvent was evaporated using a rotary evaporator. White TPA-CH2O was recrystallized at RT in a few hours. The alcohol was dried in a vacuum oven before using in step 3.
1H-NMR (400 MHz, CDCl3). δ ppm = 7.29–7.20 (m, 6H, H–Ar), 7.08 (pd, J = 7.84, 6H, H–Ar), 7.01 (t, J = 7.32, 2H, H–Ar), 4.63 (s, 2H, –CH2–), 1.68–1.54 (m, 1H, –OH) (Fig. S2†).
13C-NMR (MHz, CDCl3). δ ppm = 150.4 (s, 1C), 150.1(s, 2C), 137.6 (s, 1C), 131.8 (s, 4C), 130.9 (s, 2C), 126.9 (s, 6C), 125.4 (s, 2C), 67.8 (s, 1C) (Fig. S2†).
:hexane 67:33 to 100:0). The white powder was dried in a vacuum oven at 40 °C for 48 h.
1H-NMR (400 MHz, CDCl3). δ ppm = 7.36 (s, 2H), 7.28–7.22 (m, 5H), 7.08–6.98 (m, 7H), 6.48–6.42 (m, 1H), 6.21–6.14 (m, 1H), 6.86–6.83 (m, 1H), 5.12 (s, 2H) (Fig. S3†).
13C-NMR (MHz, CDCl3). δ ppm = 171.5 (s, 1C), 150.6 (s, 1C), 150.2 (s, 2C), 133.7 (s, 2C), 132.2 (s, 4C), 131.9 (s, 1C), 131.0 (s, 2C), 127.1 (s, 2C), 126.0 (s, 4C), 125.7 (s, 2C), 68.8 (s, 1C) (Fig. S3†).
Polymerization
:Mn = 3200, PDI = 1.60). The polymer was dried in a vacuum oven at 60 °C for 24 h before use.:HCL(37%) (90:10), and the precipitated solid was collected by centrifugation. Then, the solid was dissolved in the minimum amount of chloroform and precipitated onto acetone:ammonia (25%) (90:10). The insoluble part was removed using centrifugation, dissolved in THF, filtered through 0.45 mm PTFE and dried at 70 °C overnight (GPC:Mn = 880).Polymer–CNT composite processing
Two sets of composites, namely the rC and cC were prepared, with ratio of 1:1 (polymer:CNT, weight%) (Table 1). In a typical procedure, the relative amounts of CNT and polymer were added to solvent (with two concentrations of 0.2 and 2 mg per CNT per mL NMP to obtain thin and thick film, respectively (see below)) and homogenized using an ultrasonic bath for 30–60 minutes. Then the mixture was centrifuged (4500 rpm) to remove large and metallic bundles. The supernatant was used for making composite films and characterization. Neat CNT films were also prepared as reference samples.
| Sample code | rP (mg) | cP (mg) | CNT (mg) |
|---|---|---|---|
| CNT | — | — | 1 |
| rP | 1 | — | — |
| rC | 1 | — | 1 |
| cP | — | 1 | — |
| cC | — | 1 | 1 |
Sample preparation
First, all substrates were cleaned by sonicating for 15 minutes in a mixture of soap in DIW, in DIW, in acetone and isopropyl alcohol in four subsequent steps. The substrates were then dried using air pressure. For UV-vis tests, 20 μL of either rP, rC, cP or cC solutions (thin film concentration) was drop-casted onto optical grade quartz (12 × 18 mm2) and heated at 140 °C for 30 minutes (thin films). For cyclic voltammetry (CV) tests, 100 μL of the solutions (for each concentrations) were drop-casted onto ITO-coated glasses (20 × 15 × 1.1 mm; Ossila, the UK) and heated the same way (thin films). For conductivity and nanoindentation tests, 100 μL of either rP, rC, cP or cC solutions (thick film concentration) was drop-casted onto borosilicate glass (20 × 15 mm) and heated at 140C for 60 minutes.Characterization
A Varian Mercury Plus 400 (with Varian 5 mm PFG AutoSW probe) was used for 1H NMR. An Agilent MR 400 (with Varian 5 mm OneNMR probe) was used for 13C NMR. A Hewlett Packard 1100 Series with GBC 1240 RID detector and 3× Agilent Technologies PLgel Mixed E column were used for gel permeation chromatography (GPC) using THF (flow of 1 mL min−1) as eluent and polystyrene as reference. A Thermo Spectronic (Thermo Fisher Scientific) was used for spectrophotometry. AFM images were captured in ScanAsyst® mode using a Bruker MultiMode AFM-2. Sample thicknesses were measured using a Bruker Dektak XT profilometer. Conductivity measurements were done using a four-probe resistivity analyzer (T2001A3-EU; Ossila, the UK). Transmission Electron Microscopy (TEM) experiments were performed using a JEOL 2010 operated at 200 kV. Atomic force microscopy (AFM) images were captured in ScanAsyst® mode using a Bruker MultiMode AFM-2. TA Instruments DSC 25 was used for differential scanning calorimetry (DSC) in temperature range 20–200 °C and heating rate of 10 °C min−1.For cyclic voltammetry (CV) and galvanostatic charge–discharge (GCD) measurements, a three-electrode cell configuration was used. An ITO (Ossila, the UK) coated with sample was used as working electrode (WE), Ag/AgCl (Metrohm) as reference electrode (RE) and platinum sheet (surface = 1 cm2, Metrohm) as counter electrode (CE) using an Autolab PGSTAT306N potentiostat. Experiments were conducted in an undivided cell in ambient environment with 50 mV s−1 scan rate. The electrodes were kept in the same position for each experiment. The results were analyzed using Nova 2.1 software to calculate oxidation and reduction potentials (Epa and Epc) and currents as well as onset potentials. I–V curve was normalized (either by dividing the current to the exposed surface area (for thin films) or electrode mass (thick film) of WE into electrochemical cell. Specific capacity was calculated from galvanostatic charge–discharge experiments as:
| Specific capacity (mA h g−1) = IΔt/m | (1) |
Nanoindentation tests were done using a Berkovich indenter in continuous stiffness measurement mode for at least 20 repetitions. The tests were carried out with controlled depth control and force measurement continuously. Hardness is averaged in the range of 200–300 nm and modulus of elasticity is measured at unloading point. Modulus of elasticity is reported at unloading point:42
| H = F/Ar | (2) |
| Ar = 24.5hc | (3) |
| hc = hmax − ε(Fmax/E) | (4) |
| E = dF/dh | (5) |
Results and discussion
Polymer–CNT electrode development
The PTPAs (rP and cP) were synthesized (Schemes 2 and 3) and characterized by 1H and 13C NMR and C DEPT NMR (Fig. S4–S7†). For rP, it was possible to obtain polymerization degrees higher than an average of 9 units (GPC:Mn = 3200, PDI = 1.60), while for cP, an extended oxidative polymerization resulted in only a trimer (GPC:Mn = 880). This relatively low molar mass range may be due to a transfer reaction of the growing chain radical on the nitrogen of the TPA, forming a resonance stabilized radical that prevents propagation. Both materials were then separately processed with CNTs to make the polymer–CNT composites of rC and cC. The electronic properties of the polymers and composites were further studied by UV-vis and resistivity measurements (Fig. 1a and b). The absorption spectrum of rP shows a TPA characteristic maximum at 308 nm40; which appears at 292 nm for rC. On the other hand, cP shows two absorption bands at 313 and 361 nm, revealing themselves in cC at 313 and 376 nm, respectively.
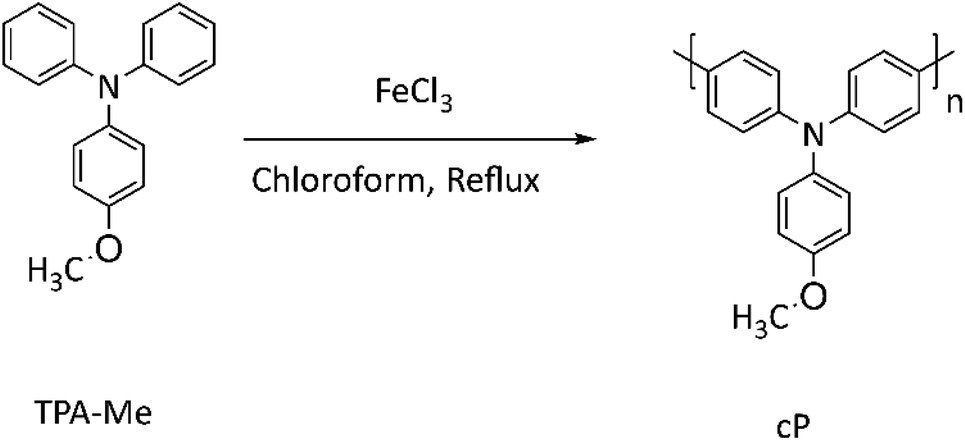 | ||
| Scheme 3 Oxidation polymerization of TPA-Me to cP. | ||
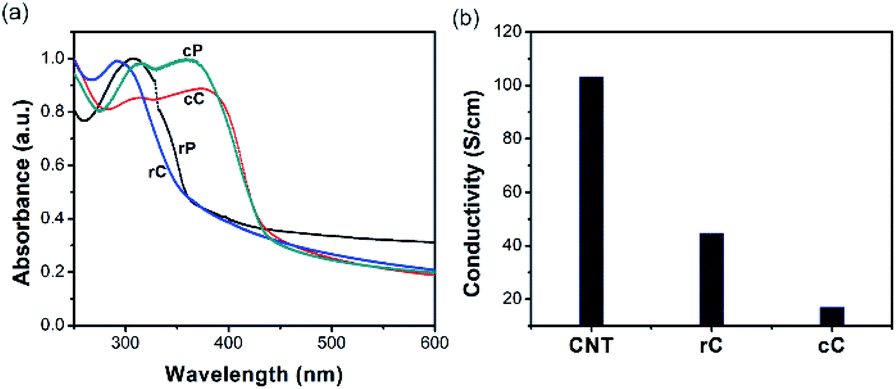 | ||
| Fig. 1 (a) UV-vis absorption spectra of rP, cP and their composites with CNTs; (b) surface conductivity of CNT film and polymer composites measured by four-probe resistivity measurement (the values of standard deviation are too low to be observable in the figure). | ||
For polymers, the red-shifting of cP bands compared to rP has been observed previously for poly(4-methoxy-TPA) and was attributed to the extended conjugated length in a typical PTPA backbone.41 On the other hand, for the composites, the absorption band(s) showed a blueshift for rC and a redshift for cC; suggesting a comparably more favorable electronic interaction between cP and CNTs as a result of overlapping orbitals.43 Fig. 1b shows the conductivity of the CNT film and its composites. Both polymers had a resistivity higher than the threshold of the device (10 M ohm sq−1) for the investigated thickness range (1.5–2 μm). In the composites, the conductivity for rC dropped to less than a half of the value reached by the neat CNT film. This drop, however, is more significant for cC (σrC/σcC = 2.62), where σ is the surface conductivity. It could be suggested that rP is facilitating CNTs percolation better than cP due to higher molecular weight (Mn rP/Mn cP = 3.62), which is in agreement with literature.44
Electrochemical characterization
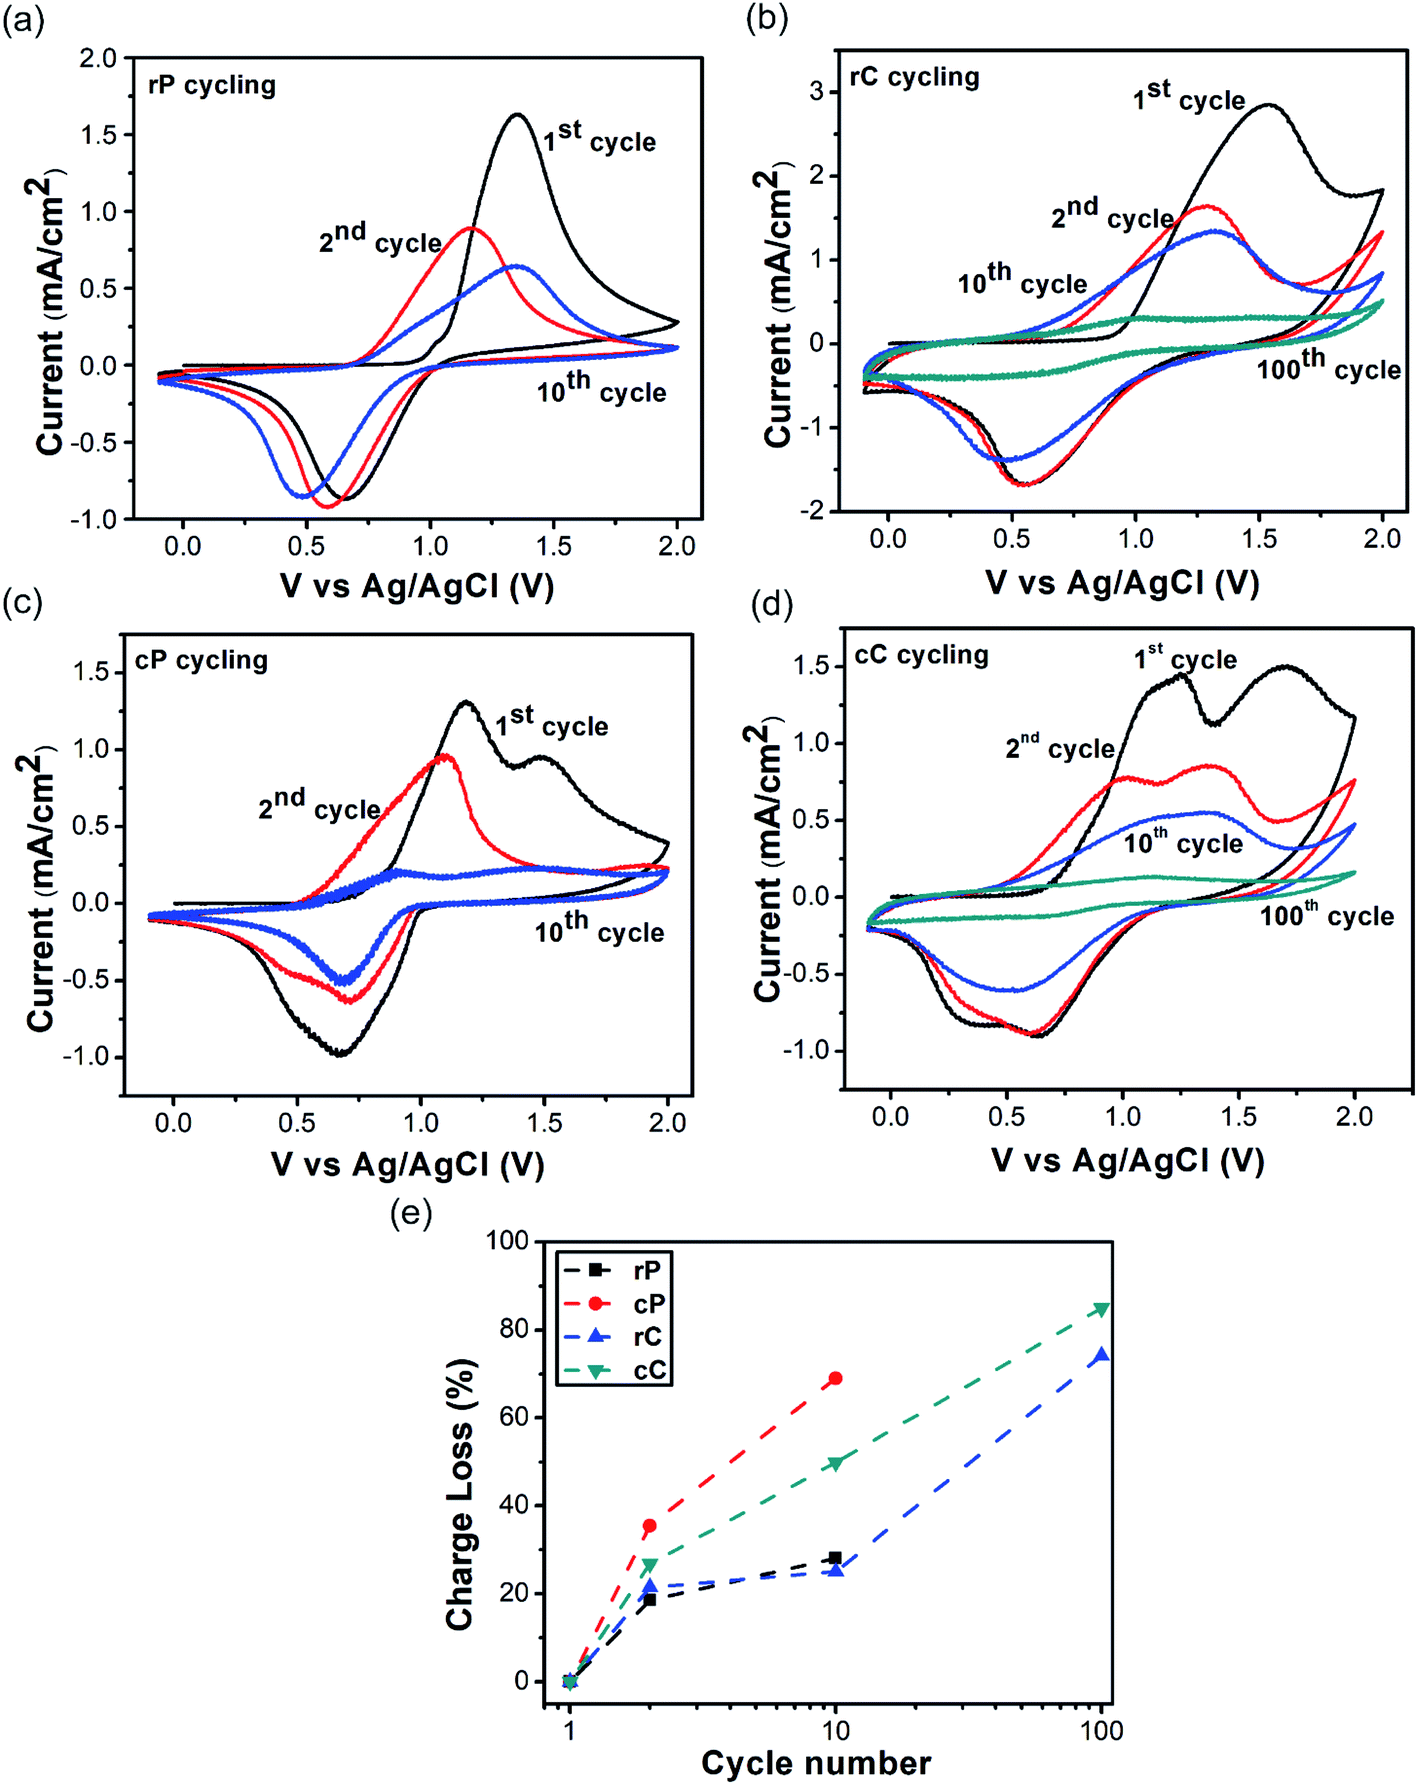 | ||
| Fig. 2 CV curves of rP, cP and their composite electrodes in 1st, 2nd, 10th, and 100th cycle: (a) rP; (b) rC; (c) cP; (d) cC; (e) their charge loss with cycling. Electrodes are prepared by solution cast of the sample solutions onto ITO. Measurements were performed in 0.1 M TBPO solution in acetonitrile using Ag/AgCl as RE and platinum wire as CE. | ||
The Fig. 2a suggests that when rP is first oxidized (TPA to TPA˙+), the onset oxidation potential is at 1.06 V, which is reduced to 0.76 in the second scan and remains almost unchanged up to 10 cycles. On the other hand, the onset oxidation potential of cP is at 0.86 V, which decreases to 0.52 in the second scan and remains almost the same up to ten cycles (Fig. 2c). Additionally, cP shows two oxidation potential peaks at 1.16 and 1.52. This was observed before and was suggested to be a result of dimerization between two oxidized TPA units (forming TPA–TPA, also called TPB).45
For both rC and cC, their onset potentials start at a lower value compared to their constituent polymers (0.93 and 0.71 V, respectively) in the initial scans (as also observed before in redox active polymer–CNT composites).46 However, from the second scan, both show the same potentials as their polymers. This initial reduction in oxidation potential can be attributed to the synergistic effect between conjugated units of the polymers with CNT walls, encouraging charge transfer, related to the orbital overlapping effect (Fig. 1a). When the oxidation–reduction cycling was continued, it was observed that cP lost its charge capacity (the integration of CV curve) much faster than rP (Fig. 2e). Also, when cP was cycled 10 times, it was observed to delaminate from the surface of the ITO electrode, compared with rP, which preserved its initial electrode integration to the highest extent. In both cases however, CNTs in the composites had a stabilizing effect, which was more pronounced in cP. This is likely due to the interlocking of polymer fragments in the CNT network (Fig. S8a–f†).
| I = aXb | (6) |
|
log(I) = log(a) +blog(X)
| (7) |
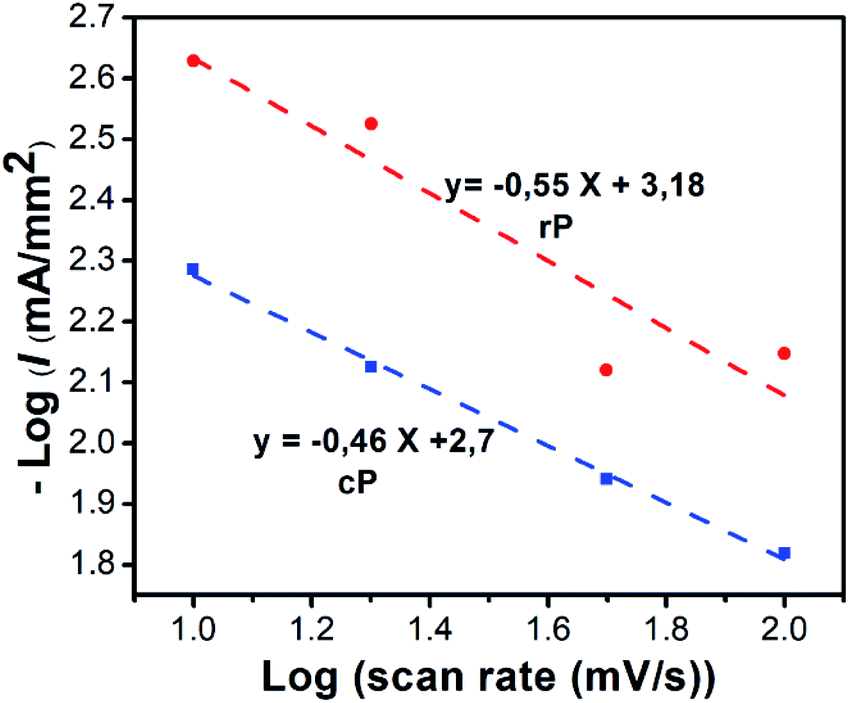 | ||
| Fig. 3 Current response of rP and cP film electrodes at different scan rates of 10 mV s−1, 20 mV s−1, 50 mV s−1, and 100 mV s−1. | ||
 | ||
| Fig. 4 First scan charge–discharge curves: (a) rC, (b) cC; specific capacity loss during 100 cycle: (c) rC, (d) cC; and coulombic efficiencies: (e) rC, (f) cC. | ||
The rC discharge (or charge) capacity curve appears to roughly consist of three phases: (i) 1.6–1.1 V, (ii) 1.1–0.75 V and (iii) 0.75–0 V. Among them, the second phase corresponds to a battery-like behavior and the other two phases show fast capacitive response. The discharge curves show an initial capacity of 37 and 44.7 mA h g−1 for 6C and 60C, respectively.
For cC on the other hand, the same pattern of three phases was observed but with the extension of “battery region” from 1.1 to 0.5 V. The initial capacity of cC is 28 and 47 mA h g−1 for 0.5 A g−1 and 5 A g−1, respectively, dropping to 11, and 21 mA h g−1 on the 100th cycle (Fig. 5f).
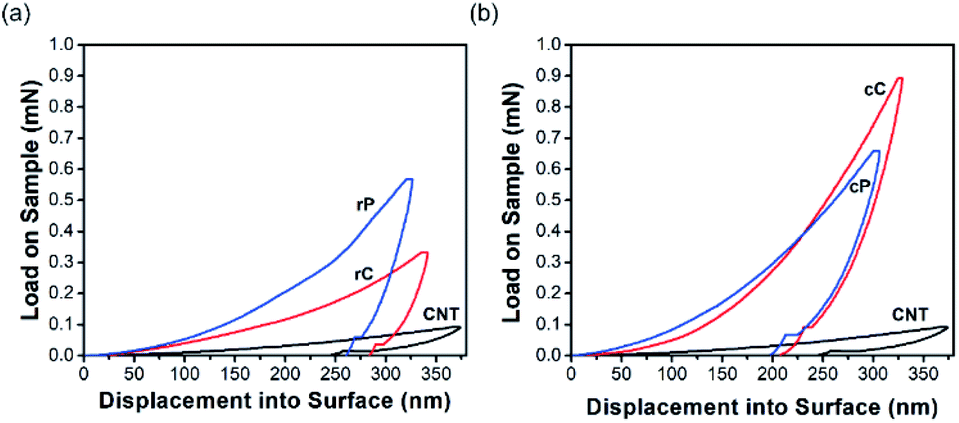 | ||
| Fig. 5 Nanoindentation curve of (a) rP vs. rC, and (b) cP vs. cC. | ||
Interestingly in both cases, the higher their discharge C-rate was, the higher their initial capacities became. This is somewhat interesting as the opposite trend has been usually observed and expected in battery electrodes.13 It is reasoned that when the current density is increased, the capacity would decrease as a result of polarization.49 Nevertheless, a higher performance at a higher C-rate was further supported with capacity retention and Coulombic efficiency during 100 cycles (Fig. 4c–f). For rC at the discharge rate of 5 A g−1, the capacity loss after 100 cycles is 16% compared to 56% for 0.5 A g−1. On the other hand, these numbers were 55 and 61% for cC at the same current densities. The same effect was observed in the Coulombic efficiencies of the electrodes, though it was more pronounced in the case of rC. These data additionally suggest that rC is a more stable electrode than cC, especially at higher discharge rate. The poorer performance of cC electrode could be a result of material dissolution upon cycling during time (Fig. S8†). This phenomenon is most likely related to the different polarization behavior at nanoscales and/or thin film length scales, which needs further investigation.
Mechanical properties
Nanoindentation in continuous stiffness measurement mode was used for mechanical characterization of thin rP and cP films as well as their composites in micrometer range (Fig. 5). The continuity of all the curves suggest that the films were defect-free within the indentation range.50 A control sample of interconnected network of CNTs was also tested for comparison.Calculated from the force – indentation depth curves, the hardness and elastic modulus of CNTs are as low as 26 and 629 MPa, respectively. Both rP and cP show a higher hardness and elastic modulus than CNTs in their pure form; but the increase for cP is slightly higher (Fig. 5a and b). In rC, the hardness decreased from 304 MPa to 125 MPa and modulus of elasticity from 8.98 GPa to 5.51 GPa. However, the trend for cC was exactly the opposite: increasing the hardness from 337 MPa to 544 MPa (61% increase) and elastic modulus from 7.72 GPa to 9.57 GPa (24% increase). This difference in behavior can be attributed to different interaction of CNTs with two polymers at their interfaces. These differences in nanomechanical characterizations of CNT–polymer thin film composites have been reported before. For example, Gupta et al.42 observed that upon adding CNTs in polyurethane, the hardness and elastic modulus of the composite increased up to 271 and 290%, respectively. On the other hand, other reports51,52 revealed that CNT composites with poly (allylamine hydrochloride) or poly (methyl methacrylate) did not result in significant improvements in mechanical properties. This behavior was attributed to the poor bending strength of CNTs and their easy displacement into the surrounding matrix upon indentation.
In this work, it should be the inherent nature of cP and rP as well as their interactions with CNTs that result in such a different trend in mechanical properties. Primarily, cP has a higher E and H than rP, suggesting a rigid nature. This is also in line with DSC results showing significant increase of glass transition temperature (180 °C for cP vs. 90 °C for rP) (Fig. S10†). On the other hand, AFM suggest that when blended with CNTs, cP is also able to better disperse CNTs (Fig. 6). As a result of these cumulative effects, cC/rC show higher/lower E and H compared to their polymeric constituents.
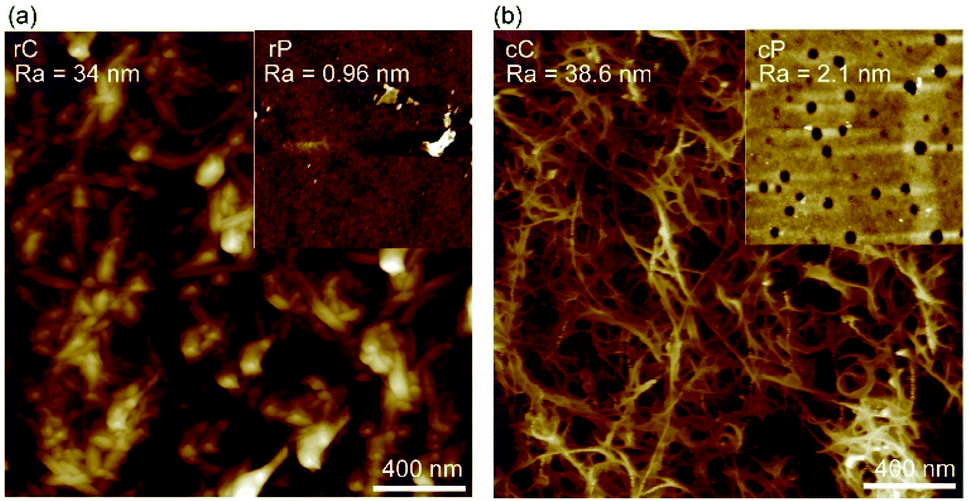 | ||
| Fig. 6 AFM of (a) rP and rC; (b) cP and cC. | ||
To investigate the stabilization effect of CNTs on the mechanical properties of the composites upon charge–discharge cycles, both of them were cycled for 100 and 1000 times with 5 A g−1 current density and the indentation tests were repeated (Fig. 7a and b). It is clear that the degree of mechanical variation degree in cC upon charge–discharge cycling is more significant compared to rC. Quantifying H and E from eqn (4)–(7), it is concluded that the hardness remained stable for both composites up to 1000 cycles (Fig. 7c); while elastic modulus is significantly decreased for both rC and cC. Yet, the drop in elastic modulus is more pronounced for cC. The stability and morphology of the surface of the electrodes were also studied with AFM scans of the degraded samples (Fig. S11†). We observe that rC could retain more of its initial morphology up to 1000 cycles of charge–discharge when compared with cC. This is most likely related to the observation that the initial dispersion of CNT is compromised in cC and the nanotubes could re-agglomerate. This results also corroborates the charge transfer behavior of the electrodes observed above.
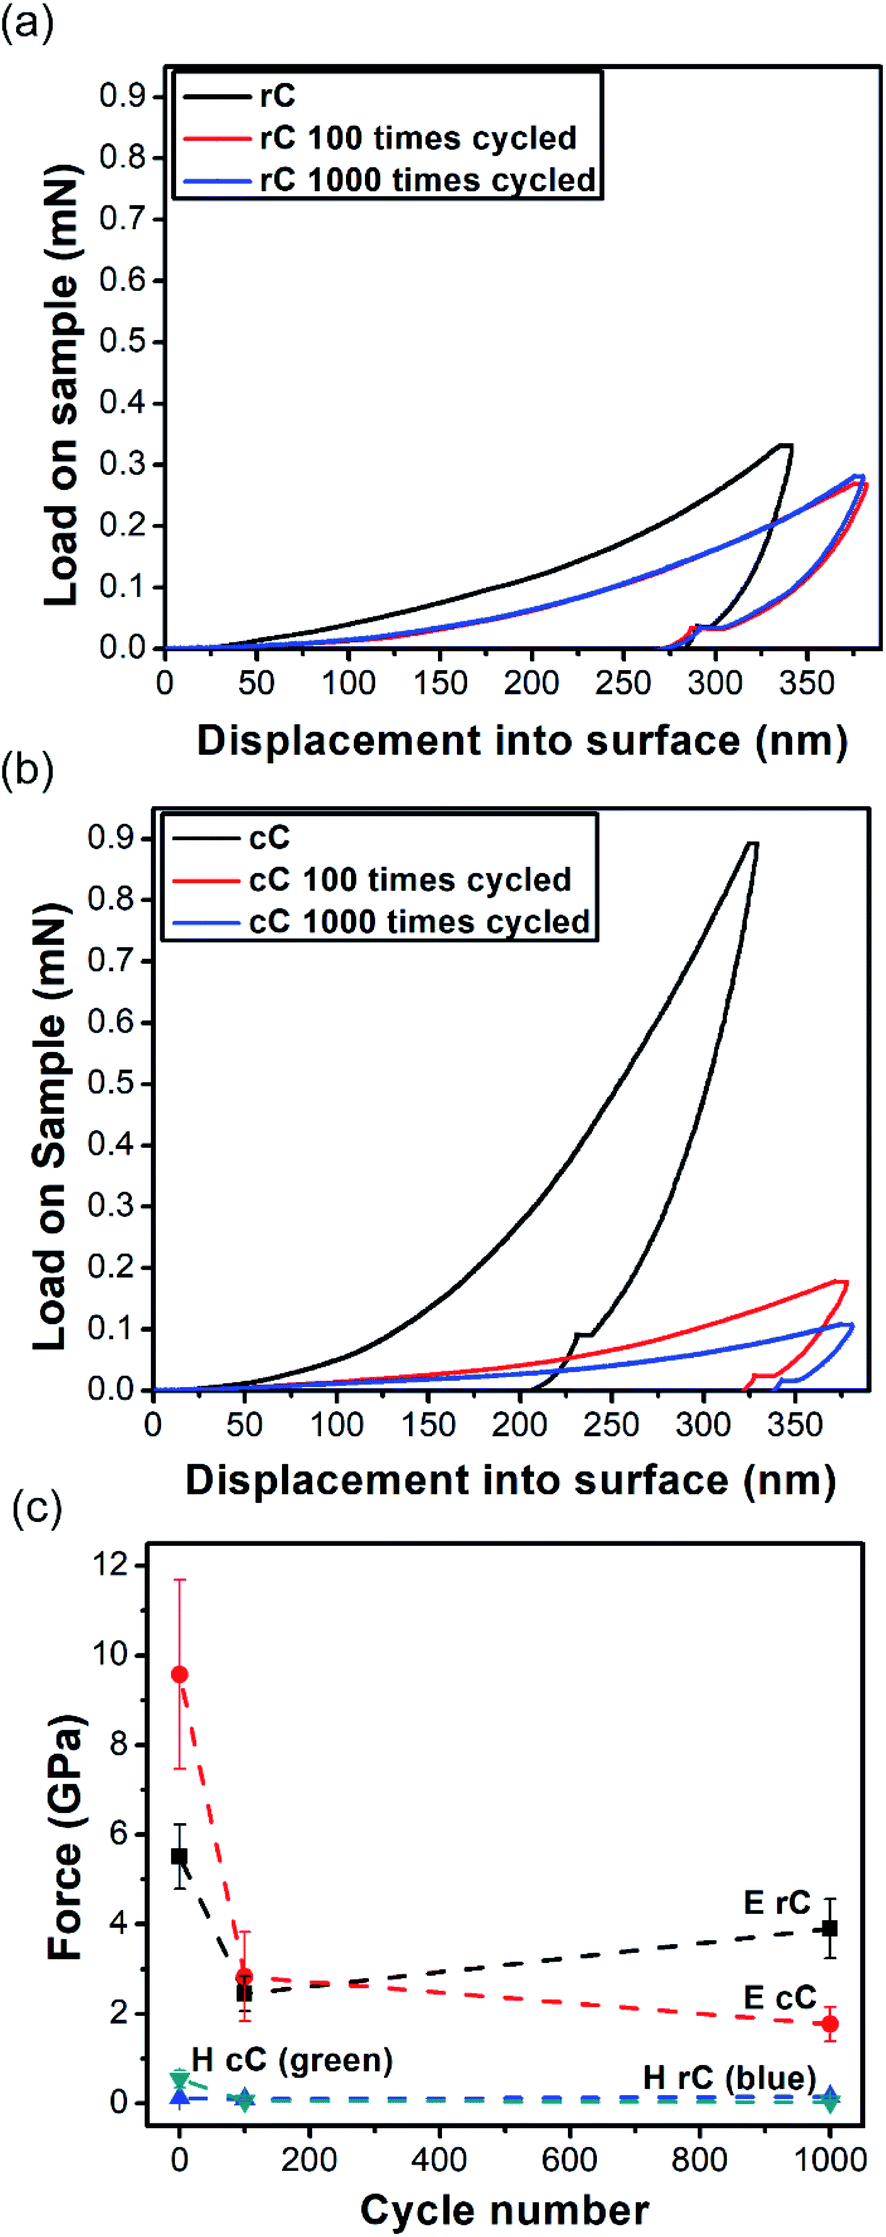 | ||
| Fig. 7 Indentation curves for (a) rC and (b) cC along with the electrochemically aged samples for 100 cycles (rC/cC 100) and 1000 cycles (rC/cC 1000) of charge–discharge at 5 A g−1; (c) Hardness (H) and elastic modulus (E) evolution for rC and cC and their aged samples at 5 A g−1. The samples were annealed in an oven at 140 °C for 30 minutes before the test on aged samples to eliminate the effect of solvent. | ||
Based on these results, and the morphology of the composites, it can be argued that cP with the TPA unit along its backbone provides steric hindrance between nanotubes, thus restricting their mobility. This avoids dislocation of nanotubes as a result of lower bending strength,52 while an acrylate backbone in the polymer is unable to prevent the aggregation of the nanotubes. This was further corroborated by TEM (Fig. 8), where cP was able to individualize CNTs more effectively.
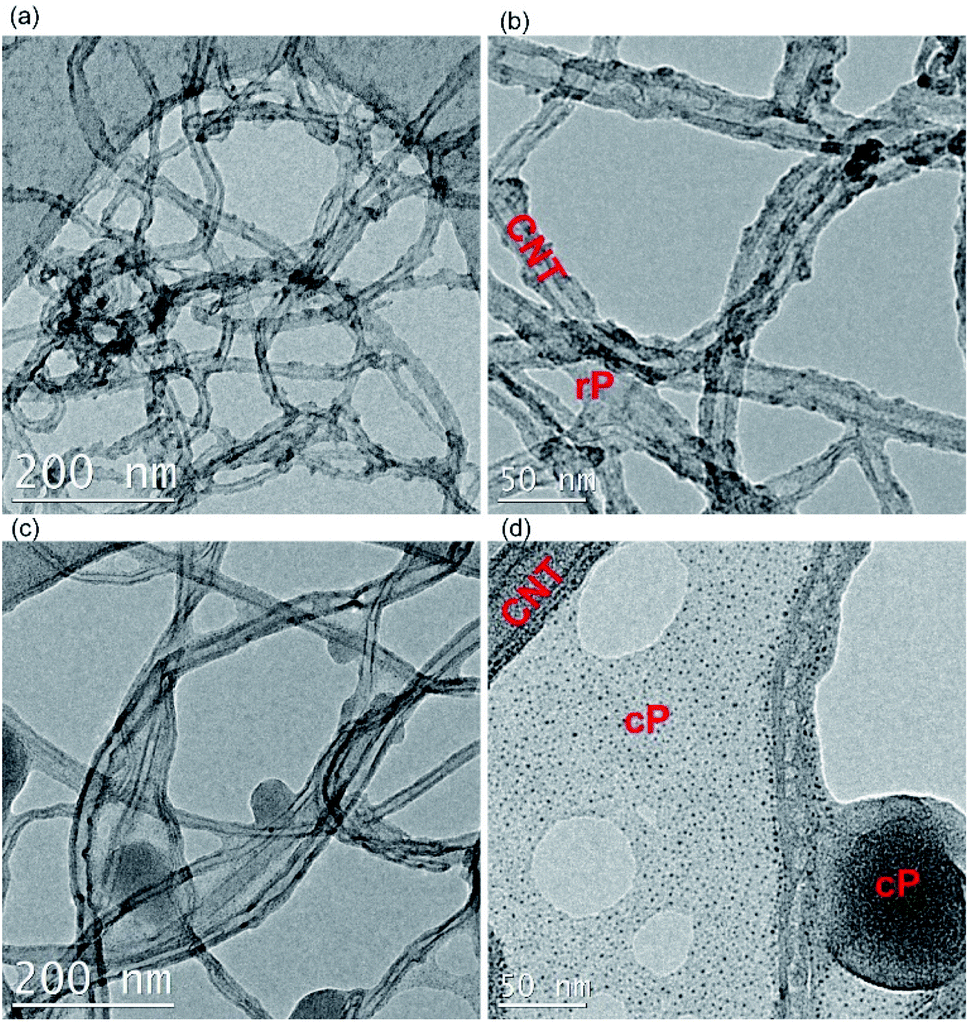 | ||
| Fig. 8 TEM images of rC (a and b) and cC (c and d). | ||
However, when the composites are exposed to repetitive oxidation and reduction cycles, the TPA unit at the interface of CNT-cP-CNT is deteriorated resulting in failure at the interface and hence significant loss in elastic modulus. On the other hand, rP has a redox-inactive chain of acrylate, the CNT-rP-CNT could preserve its initial mechanical properties to a higher extent.
Conclusion
Two sets of TPA-electroactive polymers were synthesized (redox and conjugated) and blended with CNTs for studying their application as charge storage electrode materials. The redox and mechanical stability of the composites were investigated. CNTs had a stabilizing effect on capacity retention of both polymers at different scan rates. Yet, the redox PTPA was inherently more stable than the conjugated polymer upon charge–discharge cycling at different current densities. On the other hand, the conjugated PTPA could disperse CNT particles more effectively with stronger π–π interactions, resulting in enhancement of hardness and elastic modulus in their composite. However, when the composites were electrochemically aged by repetitive cycling, the redox polymer could provide a more mechanically stable electrode compared with conjugated polymer by decoupling of the redox-active sites from the polymer backbone. In summary, although the PTPA composites do not show extremely high performance as electrode materials, this work sheds light on the effect of placing the electroactive groups in the polymer backbone vs. as pendant group.The results of this research could be used for the rational design of electrochemical energy storage materials using TPA-based polymers, suggesting a longer lifetime if TPA (derivative) units are decoupled from the backbone. Furthermore, although only TPA has been investigated in this research, the other conjugated monomeric units may potentially follow a similar trend, validation of which needs further research.
Conflicts of interest
The authors state no conflict of interest.Acknowledgements
The authors would like to thank Dr Ciaran Lahive for his valuable support and discussions regarding monomer synthesis.Notes and references
- A. Mauger, C. Julien, A. Paolella, M. Armand and K. Zaghib, Materials, 2019, 12, 1–57 Search PubMed.
- C. Han, J. Zhu, C. Zhi and H. Li, J. Mater. Chem. A, 2020, 8, 15479–15512 RSC.
- M. A. Morris, H. An, J. L. Lutkenhaus and T. H. Epps, ACS Energy Lett., 2017, 2, 1919–1936 CrossRef CAS.
- S. Muench, A. Wild, C. Friebe, B. Häupler, T. Janoschka and U. S. Schubert, Chem. Rev., 2016, 116, 9438–9484 CrossRef CAS PubMed.
- J. Xie, P. Gu and Q. Zhang, ACS Energy Lett., 2017, 2, 1985–1996 CrossRef CAS.
- J. K. Feng, Y. L. Cao, X. P. Ai and H. X. Yang, J. Power Sources, 2008, 177, 199–204 CrossRef CAS.
- C. Su, Y. Ye, X. Bu, L. Xu and C. Zhang, Adv. Mater. Res., 2011, 335–336, 1512–1515 CAS.
- C. Su, F. Yang, L. Ji, L. Xu and C. Zhang, J. Mater. Chem. A, 2014, 2, 20083–20088 RSC.
- W. Ni, J. Cheng, X. Li, G. Gu, L. Huang, Q. Guan, D. Yuan and B. Wang, RSC Adv., 2015, 5, 9221–9227 RSC.
- J. Xiong, Z. Wei, T. Xu, Y. Zhang, C. Xiong and L. Dong, Polymer, 2017, 130, 135–142 CrossRef CAS.
- Z. Peng, X. Yi, Z. Liu, J. Shang and D. Wang, ACS Appl. Mater. Interfaces, 2016, 8, 14578–14585 CrossRef CAS PubMed.
- C. Zhang, X. Yang, W. Ren, Y. Wang, F. Su and J. X. Jiang, J. Power Sources, 2016, 317, 49–56 CrossRef CAS.
- C. Su, H. He, L. Xu, K. Zhao, C. Zheng and C. Zhang, J. Mater. Chem. A, 2017, 5, 2701–2709 RSC.
- K. Yamamoto, D. Suemasa, K. Masuda, K. Aita and T. Endo, ACS Appl. Mater. Interfaces, 2018, 10, 6346–6353 CrossRef CAS PubMed.
- W. Huang, T. Jia, G. Zhou, S. Chen, Q. Hou, Y. Wang, S. Luo, G. Shi and B. Xu, Electrochim. Acta, 2018, 283, 1284–1290 CrossRef CAS.
- Z. Chen, W. Li, Y. Dai, N. Xu, C. Su, J. Liu and C. Zhang, Electrochim. Acta, 2018, 286, 187–194 CrossRef CAS.
- M. E. Roberts, D. R. Wheeler, B. B. McKenzie and B. C. Bunker, J. Mater. Chem., 2009, 19, 6977–6979 RSC.
- J. T. Kearns and M. E. Roberts, J. Mater. Chem., 2012, 22, 25447–25452 RSC.
- Q. P. McAllister, K. E. Strawhecker, C. R. Becker and C. A. Lundgren, J. Power Sources, 2014, 257, 380–387 CrossRef CAS.
- V. Kuznetsov, A. H. Zinn, G. Zampardi, S. Borhani-Haghighi, F. La Mantia, A. Ludwig, W. Schuhmann and E. Ventosa, ACS Appl. Mater. Interfaces, 2015, 7, 23554–23563 CrossRef CAS PubMed.
- M. K. Jangid and A. Mukhopadhyay, J. Mater. Chem. A, 2019, 7, 23679–23726 RSC.
- J. P. Pender, G. Jha, D. H. Youn, J. M. Ziegler, I. Andoni, E. J. Choi, A. Heller, B. S. Dunn, P. S. Weiss, R. M. Penner and C. B. Mullins, ACS Nano, 2020, 14, 1243–1295 CrossRef CAS PubMed.
- R. Koerver, W. Zhang, L. De Biasi, S. Schweidler, A. O. Kondrakov, S. Kolling, T. Brezesinski, P. Hartmann, W. G. Zeier and J. Janek, Energy Environ. Sci., 2018, 11, 2142–2158 RSC.
- A. Saal, T. Hagemann and U. S. Schubert, Adv. Energy Mater., 2020, 2001984 CrossRef.
- M. E. Abdelhamid, A. P. O'Mullane and G. A. Snook, RSC Adv., 2015, 5, 11611–11626 RSC.
- P. Novák, K. Müller, K. S. V. Santhanam and O. Haas, Chem. Rev., 1997, 97, 207–281 CrossRef PubMed.
- E. Frackowiak, V. Khomenko, K. Jurewicz, K. Lota and F. Béguin, J. Power Sources, 2006, 153, 413–418 CrossRef CAS.
- Y. Liao, H. Wang, M. Zhu and A. Thomas, Adv. Mater., 2018, 30, 1705710 CrossRef PubMed.
- J. Xiang, K. Sato, H. Tokue, K. Oyaizu, C. L. Ho, H. Nishide, W. Y. Wong and M. Wei, Eur. J. Inorg. Chem., 2016, 2016, 1030–1035 CrossRef CAS.
- Y. Liang, Z. Tao and J. Chen, Adv. Energy Mater., 2012, 2, 742–769 CrossRef CAS.
- Z. Qiu, B. A. G. Hammer and K. Müllen, Prog. Polym. Sci., 2020, 100, 101179 CrossRef CAS.
- M. Yao, H. Senoh, T. Sakai and T. Kiyobayashi, J. Power Sources, 2012, 202, 364–368 CrossRef CAS.
- L. Cui, J. Gao, T. Xu, Y. Zhao and L. Qu, Chem.–Asian J., 2016, 11, 1151–1168 CrossRef CAS PubMed.
- V. Raju, J. V. Rani and P. Basak, Electrochim. Acta, 2020, 361, 137097 CrossRef CAS.
- Z. Abousalman-Rezvani, P. Eskandari, H. Roghani-Mamaqani and M. Salami-Kalajahi, Adv. Colloid Interface Sci., 2020, 278, 102126 CrossRef CAS PubMed.
- B. Huang, Biomanufacturing Reviews, 2020, 5, 1–26 CrossRef.
- B. Ernould, O. Bertrand, A. Minoia, R. Lazzaroni, A. Vlad and J. F. Gohy, RSC Adv., 2017, 7, 17301–17310 RSC.
- T. Fujigaya and N. Nakashima, Sci. Technol. Adv. Mater., 2015, 16(2), 024802 CrossRef PubMed.
- S. H. Park, K. Ogino and H. Sato, Polym. Adv. Technol., 2000, 11, 349–358 CrossRef CAS.
- A. F. Fehervari, L. C. Kagumba, S. Hadjikyriacou, F. Chen and R. A. Gaudiana, J. Appl. Polym. Sci., 2002, 87, 1634–1645 CrossRef.
- J. H. Sim, K. Yamada, S. H. Lee, S. Yokokura and H. Sato, Synth. Met., 2007, 157, 940–944 CrossRef CAS.
- T. K. Gupta, B. P. Singh, S. R. Dhakate, V. N. Singh and R. B. Mathur, J. Mater. Chem. A, 2013, 1, 9138–9149 RSC.
- W. J. Xu, H. Z. Chen, M. M. Shi, Y. G. Huang and M. Wang, Nanotechnology, 2006, 17, 728–733 CrossRef CAS.
- Z. Spitalsky, D. Tasis, K. Papagelis and C. Galiotis, Prog. Polym. Sci., 2010, 35, 357–401 CrossRef CAS.
- K. Y. Chiu, T. X. Su, J. H. Li, T. H. Lin, G. S. Liou and S. H. Cheng, J. Electroanal. Chem., 2005, 575, 95–101 CrossRef CAS.
- M. E. Ghica, G. M. Ferreira and C. M. A. Brett, J. Solid State Electrochem., 2015, 19, 2869–2881 CrossRef CAS.
- T. S. Mathis, N. Kurra, X. Wang, D. Pinto, P. Simon and Y. Gogotsi, Adv. Energy Mater., 2019, 9, 1–13 Search PubMed.
- P. Simon, Y. Gogotsi and B. Dunn, Science, 2014, 343, 1210–1211 CrossRef CAS PubMed.
- X. Yang and A. L. Rogach, Adv. Energy Mater., 2019, 9, 1–10 Search PubMed.
- X. Li and B. Bhushan, Mater. Charact., 2002, 48, 11–36 CrossRef CAS.
- P. V. Pavoor, B. P. Gearing, R. E. Gorga, A. Bellare and R. E. Cohen, J. Appl. Polym. Sci., 2004, 92, 439–448 CrossRef CAS.
- M. Olek, K. Kempa, S. Jurga and M. Giersig, Langmuir, 2005, 21, 3146–3152 CrossRef CAS PubMed.
Footnote |
| † Electronic supplementary information (ESI) available. See DOI: 10.1039/d1ra06415k |
| This journal is © The Royal Society of Chemistry 2021 |