DOI:
10.1039/D1RA06304A
(Paper)
RSC Adv., 2021,
11, 32810-32823
In-plane graphene/boron nitride heterostructures and their potential application as toxic gas sensors
Received
20th August 2021
, Accepted 21st September 2021
First published on 6th October 2021
Abstract
After the successful synthesis of graphene/hexagonal boron nitride (h-BN) heterostructures, research works have been carried out for their plausible real-world device applications. Such 2D nanosheets gain great attention as they have shown promising gas sensing properties due to their high surface-to-volume ratio and unique electronic properties between graphene and h-BN. Herein, we report a first-principles density functional theory investigation of the structural and electronic properties of pristine graphene (PG), pristine BN, and their in-plane heterostructures employing B3LYP and dispersion-corrected van der Waals functional WB97XD with the 6-311G (d, p) basis set. We found that these predicted nanosheets show good structural stability with favorable cohesive energy and the bandgap gradually increases with the increase in the B–N concentration. We have also studied their adsorption properties toward toxic gas molecules (SO2 and CO). Among these heterostructures, G2BN2 exhibits greater adsorption energy of about −0.237 eV and −0.335 eV when exposed to SO2 and CO gas molecules, respectively. The electronic properties such as HOMO and LUMO energies, HOMO–LUMO energy gap, Fermi level, work function, and conductivity significantly changed after the adsorption of SO2 gas on the nanosheets except for PG, whereas these parameters remain almost the same after the adsorption of the CO gas molecule. Mulliken and natural bond orbital (NBO) charge analysis reveals that charge transfer occurs from gas molecules to the nanosheets except when SO2 is adsorbed onto PG. Although the adsorption energies for CO gas are slightly greater than those for SO2 gas for these nanosheets, all other investigations such as electronic properties, charge transfer analysis, molecular electrostatic potential (MEP) map, and global indices predict that these nanosheets are good sensors for SO2 gas than CO gas molecules.
1. Introduction
There are many toxic gases that exist in the environment such as CO, SO2, CO2, NO, NH3, and SO3, which are produced by motorized transportations, power plants, industries, biological waste etc.1–5 CO gas is extremely toxic, which is emitted from the burning of fossil fuel, natural gas, and organic matter. It is responsible for several respiratory diseases such as asthma, inflammatory lung disease, and hypoxia.6,7 Sulfur dioxide (SO2) is another noxious gas produced mainly from the combustion of fossil fuels such as coal and oil (e.g., diesel powered vehicles) and is responsible for the acid rain and respiratory and cardiovascular problems such as bronchitis, asthma, and wheezing.8 As pollution-free air is a global demand, the detection of harmful gases is compulsory. Therefore, various kinds of gas sensors such as chromatographic detectors, electrochemical solid-state sensors, and piezoelectric detectors have been introduced by several research groups.9–11 From the previous studies, it has been found that 2D materials and thin film materials are specifically offer chemical sensing applications owing to their unique electrochemical properties, good chemical and thermal stabilities, and high surface-to-volume ratio.12
Among 2D materials, graphene and its derivatives have attracted an extensive attention as chemical gas sensors due to their exceptional thermal conductivity,13 optoelectronic,14 thermal stability,15 and charge carrier mobility16 properties from the bulk materials. Most previous theoretical and experimental studies predicted that pristine graphene lacks sensitivity toward adsorbed gas molecules.17,18 But after the modification of graphene by doping pentavalent and trivalent atoms or creating defects, the electronic and adsorption properties are greatly increased.19–21 Liu et al. investigated the SO2 gas sensing properties of intrinsic and modified graphene by the DFT theory and reported that SO2 weakly adsorbed on the intrinsic graphene while defected and Al-doped graphene showed high reactivity toward SO2.22 Similarly N-, Al, and Si-doped graphenes exhibit high reactivity compared to pristine graphene toward CO gas.23–26 Jiayu Dai et al. examined the adsorption behavior of common gas molecules (H2, H2O, O2, CO2, CO, NO2, NO, SO2, NH3, and N2) over B-, N-, Al-, and S-doped graphene using DFT theory. They predicted that Al-doped graphene would show much more reactivity than B- and S-doped graphenes. Mehdi D. et al. studied the adsorption of NO and NO2 molecules over B- and BN-co-doped graphene sheets where nitrogen atoms around the boron atoms increase the adsorption property of graphene.27
On the other hand, another 2D material, hexagonal boron nitride (h-BN), commonly known as white graphene, has also been widely studied as a sensor for gas and drug molecules.28,29 It exhibits excellent mechanical strength, high thermal/chemical stability, and special thermal conductance analogous to graphene but has different electronic properties from graphene due to the wide range band gap of about 4.6 eV.28–31 As graphene and hexagonal boron nitride (h-BN) have similar structural parameters such as honeycomb lattice structure, comparable lattice constants, and atomic radius of B and N similar to that of C, these two structures stack in a single layer, forming a hybrid in-plane graphene/h-BN material.32 The heterostructures have drawn attention due to their interesting electric and transport properties after the successful synthesis by different research groups.33–36 These systems are widely used in potential applications including sensing toxic gases due to the high sensitivity and chemical reactivity.37–39 Recently, in 2019, Souza et al. investigated the gas sensing properties of graphene/h-BN heterostructure for NO, NO2, NH3, and CO2 gas molecules by employing DFT and NEGF theories. They predicted that strong interaction occurs between the graphene/h-BN heterostructure and NOx gases at the interface region.40 Petrushenko et al. examined the adsorption energies for the adsorption of gas molecules (CO, HCI, and H2) on pristine graphene, h-BN, and graphene/h-BN heterostructure using DFT and independent gradient model (IGM) theories.41
In this research work, we have reported a theoretical study on the structural and electronic properties of pristine graphene (PG), pristine BN (PBN), and their in-plane heterostructures-G3BN1, G2BN2, and G1BN3. We have also studied the interaction between toxic gas molecules (CO, SO2) with PG, PBN, and their heterostructures by employing B3LYP and dispersion-corrected van der Waals functional WB97XD with the 6-311G (d, p) basis set. To understand the structural stability of the nanosheets, cohesive energy and vibrational spectra were investigated. The interaction between gas molecules and the nanosheets was observed by calculating the adsorption energies and desorption recovery time. To predict the electronic properties of the nanosheets, energy gaps, charge transfer abilities, conductivity, work function, and dipole moment were also investigated. For examining the chemical reactivity, the global indices such as chemical potential, chemical hardness, electrophilicity, and chemical softness were calculated.
2. Computational details
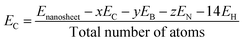
In this study, all calculations were performed by unrestricted DFT theory due to its accuracy in structural, electronic, and magnetic properties. We have chosen two functionals, B3LYP and WB97XD (Meta hybrid functional) with the 6-311G (d, p) basis set, as implemented in the Gaussian 09 package. B3LYP is more reliable and commonly used functional in case of different nanostructures, whereas WB97XD is dispersion-corrected van der Waals functional, which is suitable for adsorption studies.42,43 To estimate the structural stability, we have investigated the cohesive energy per atom of the nanosheets using the following equation.44| |
 | (1) |
where Enanosheet, EC, EB, EN, and EH are the total energies of the nanosheets, carbon, boron, nitrogen, and hydrogen atoms, respectively, and x, y, and z are the number of carbon, boron, and nitrogen atoms, respectively. We have calculated the adsorption energies for the CO and SO2 gas molecules on the nanosheets by the following equation.45| | |
Eads = Etotal(Nanosheets + gas molecules) − Etotal(Nanosheets) − Etotal(gas molecules)
| (2) |
where Etotal(Nanosheets + gas molecules), Etotal(Nanosheets), and Etotal(gas molecules) denote the total energy of the nanosheets with the adsorbed gas molecules, nanosheets, and CO and SO2 gas molecules, respectively. The counterpoise technique is used to correct the basis-set superposition error (BSSE) and calculated by46| | |
Eads,corr = Eads + EBSSE
| (3) |
where Eads,corr is the corrected adsorption energy and EBSSE is the energy of the basis set superposition error.
The charge transfer from the nanosheets to the adsorbed gas molecules was calculated by Mulliken charge analysis and NBO analysis.47 To investigate the electronic properties, Highest Occupied Molecular Orbital (HOMO) and Lowest Unoccupied Molecular Orbital (LUMO) energies were obtained for calculating the energy gap and Fermi level energy48
| |
 | (5) |
where
ELUMO and
EHOMO are the lowest unoccupied and highest occupied molecular orbital energies, respectively, and we have measured the chemical potential (
μ) using Janak's approximation in terms of the energies of HOMO and LUMO.
49| |
 | (6) |
Using Koopmans' theorem,50 chemical hardness (η) is measured by the following equation.
| |
 | (7) |
where
N is the total number of electrons and
E is the total energy of the cluster.
51 Using the calculated value of chemical potential (
μ) and hardness (
η), we have calculated the chemical softness (
S)
52 and electrophilicity index (
ω), which is the ability of a chemical system to accept electrons from the surroundings
53 by the following equations.
To understand the electrophilic and nucleophilic region of the nanosheets, MEP maps have been investigated.
3. Results and discussion
3.1. Optimized geometric structures
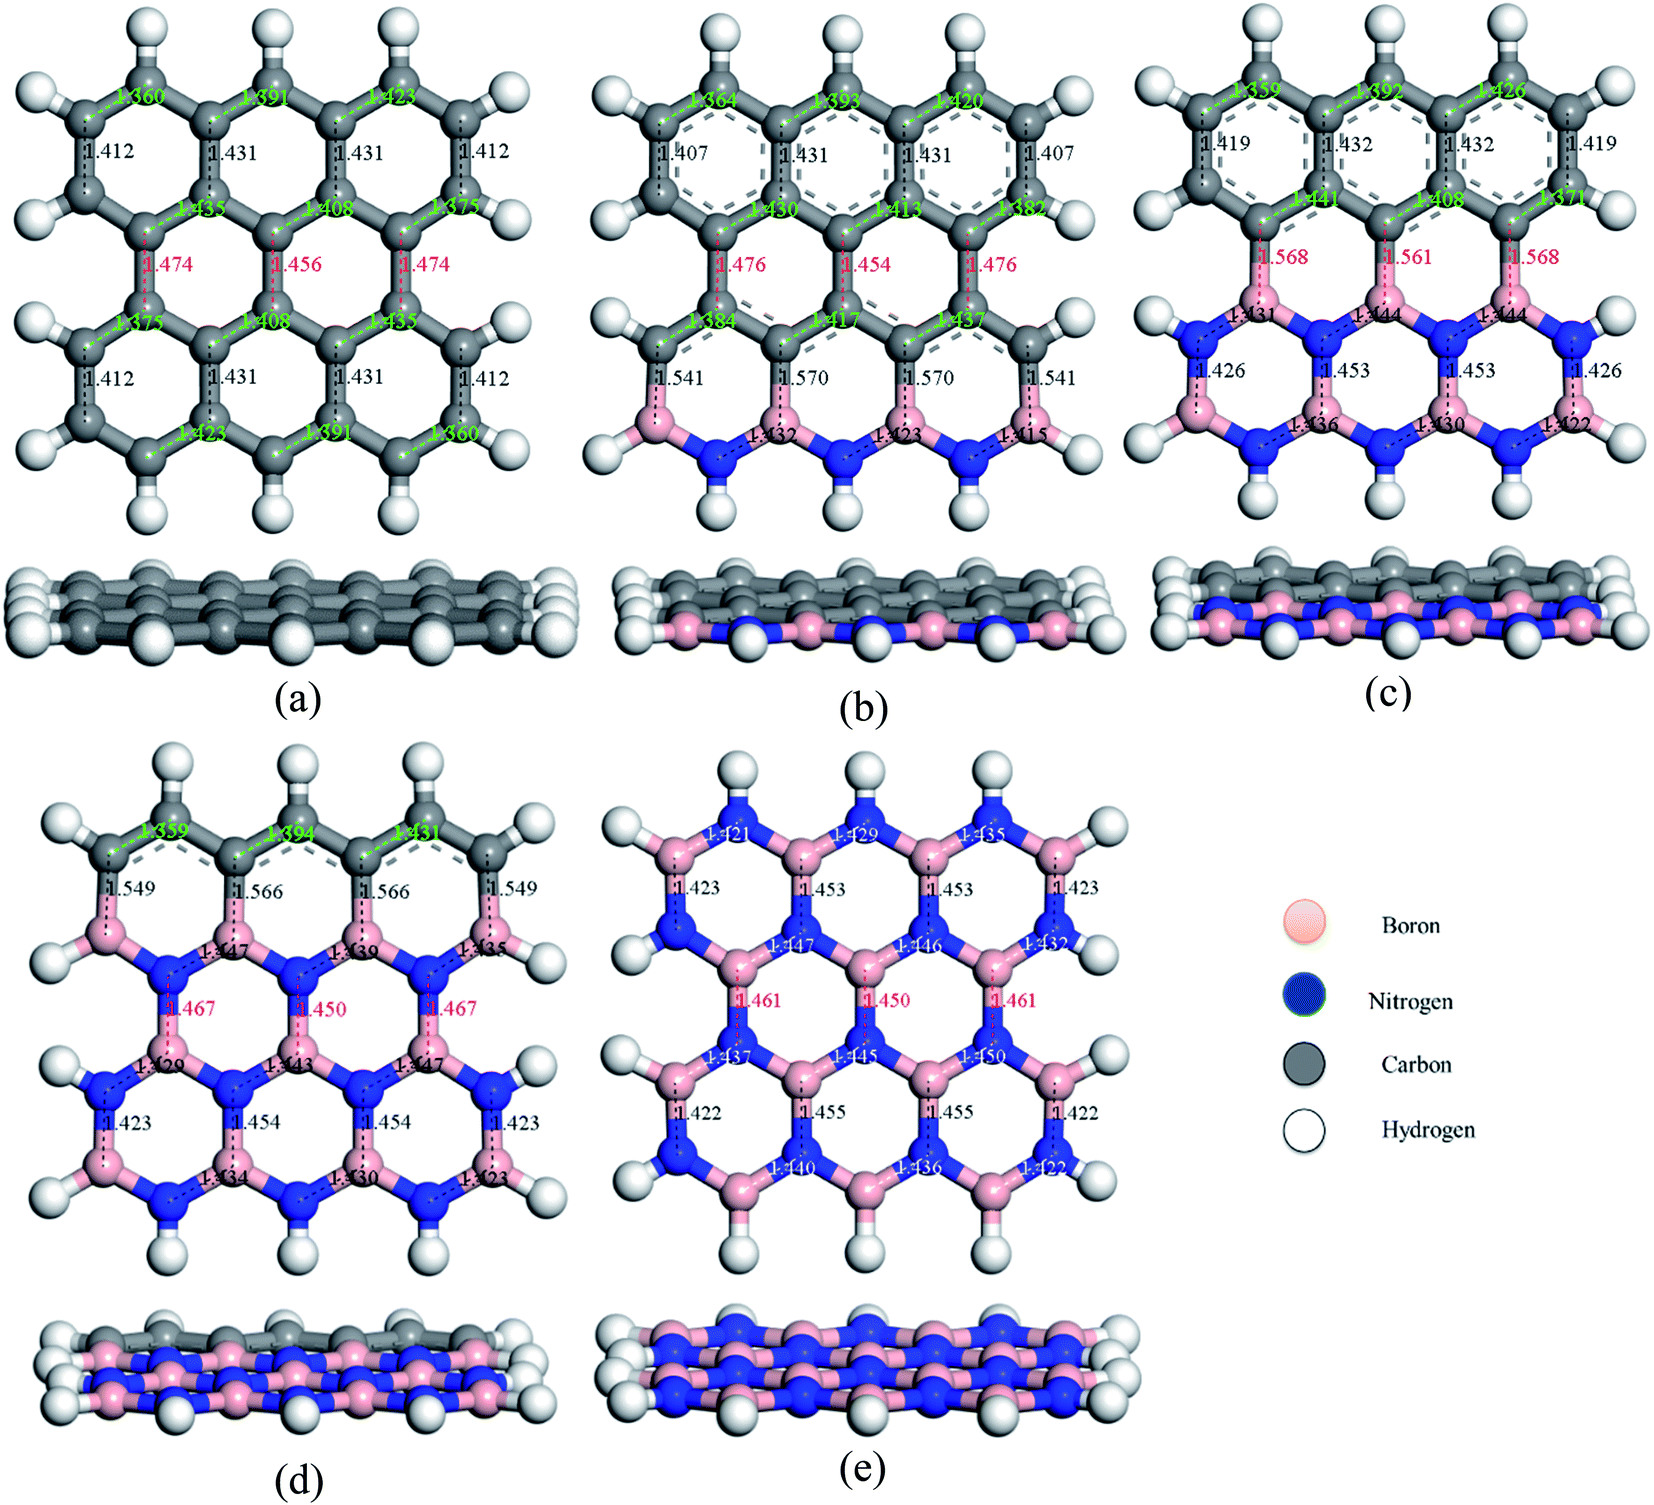
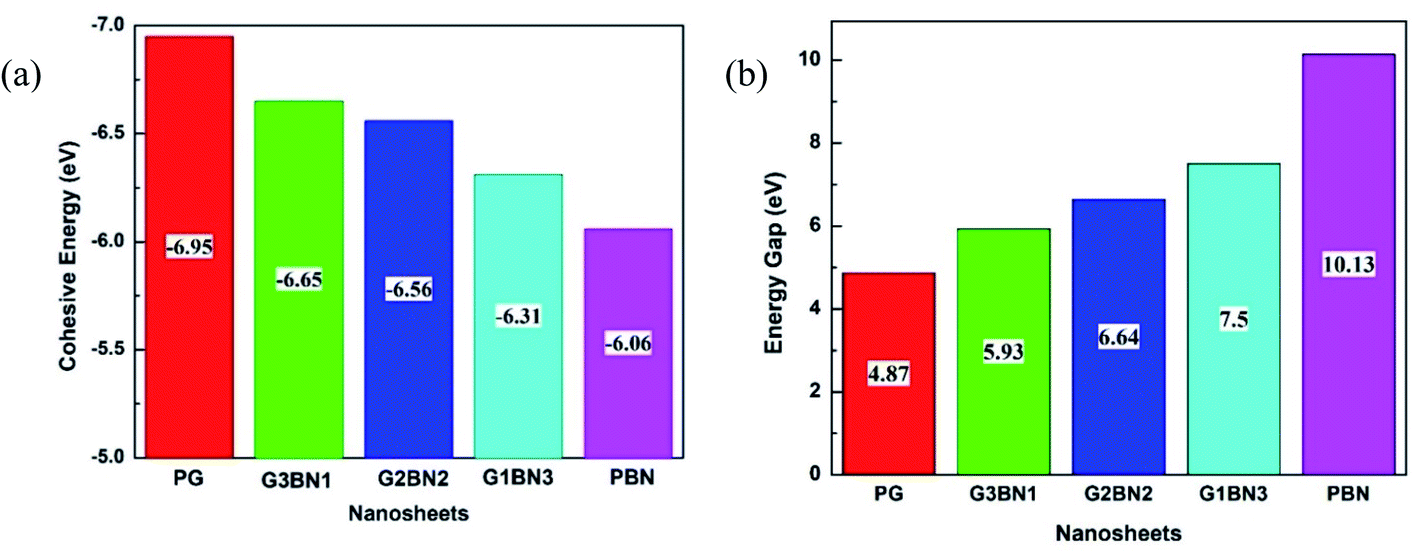
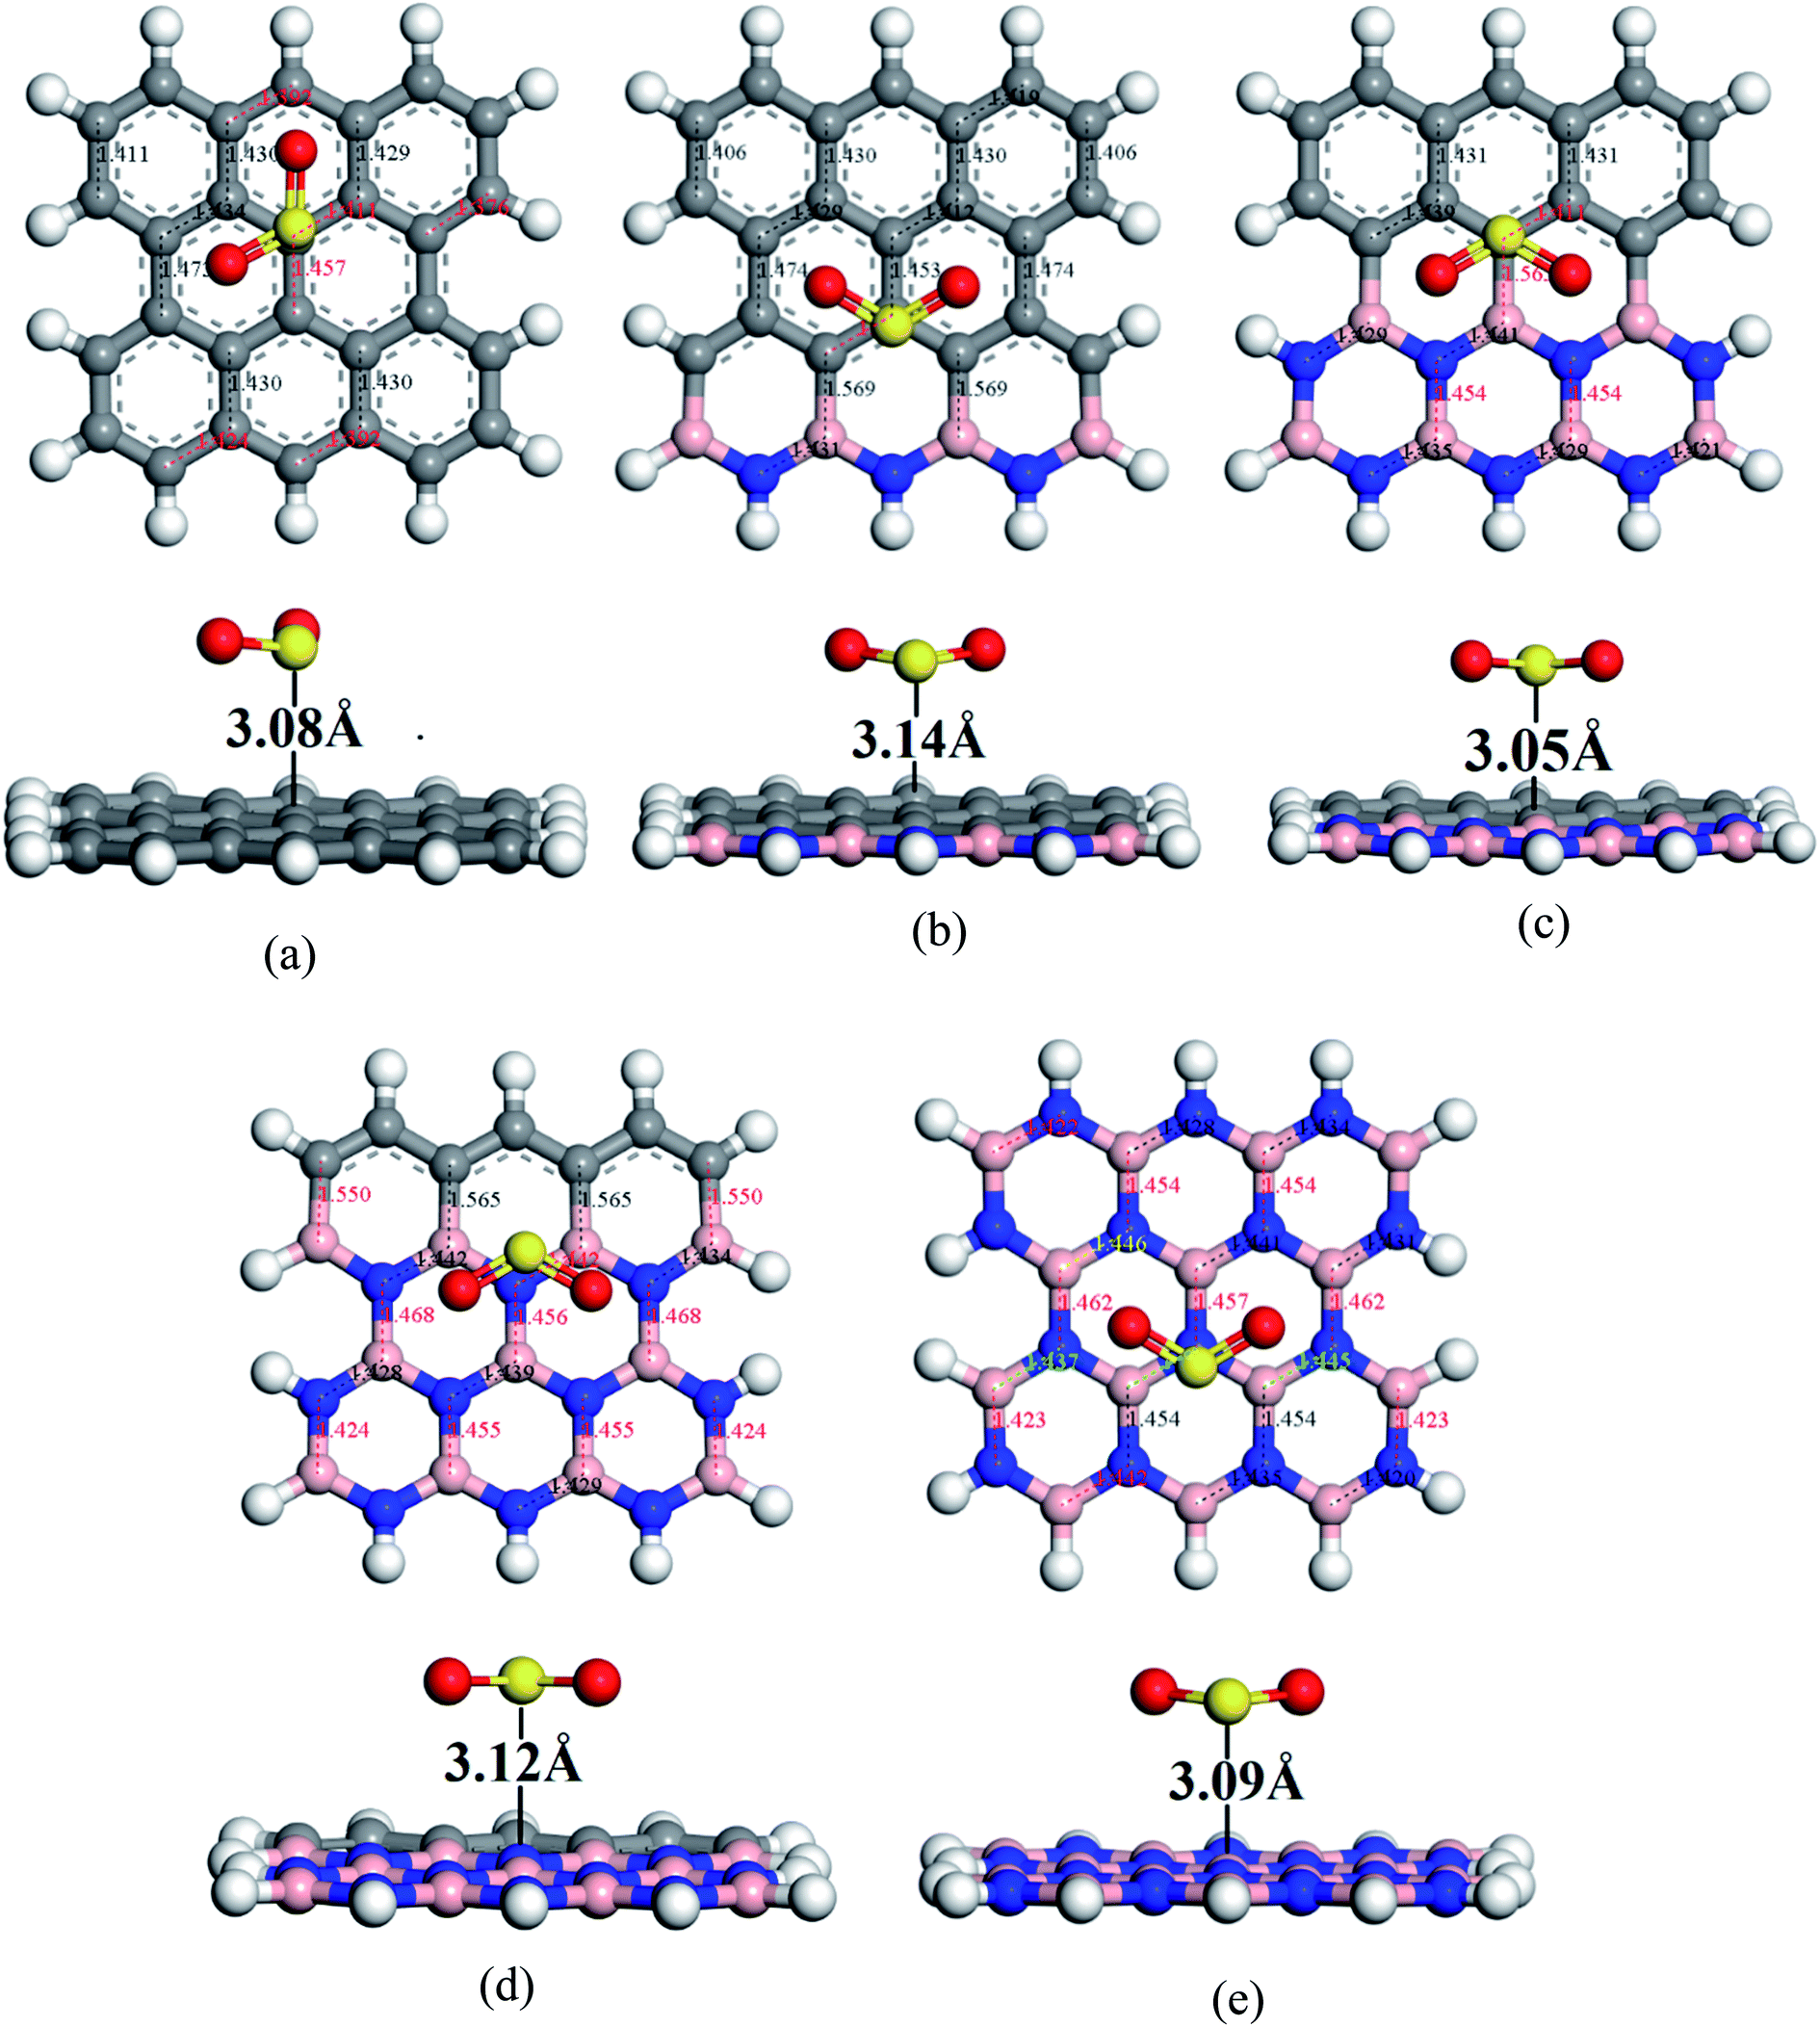
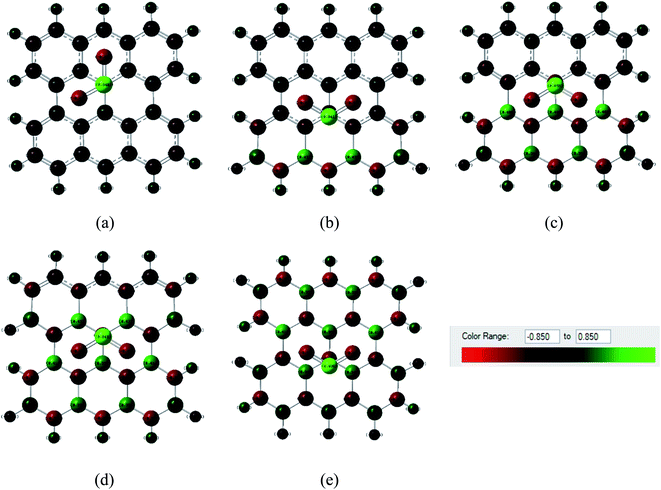
To study the two dimensional in-plane heterostructures, isolated pristine graphene containing 8 hexagons with 28 carbon atoms have been chosen as our model structures. Then, they were modified by doping alternative B and N atoms in one, two, three, and four zigzag rows, respectively, to form BN nanosheets. A comparative analysis was carried out among the five model nanosheets where two pristine structures, pristine graphene (PG) and pristine boron nitride (PBN), and their three heterostructures, one zigzag row doped BN (G3BN1), two rows doped BN (G2BN2), and three rows doped BN (G3BN1) and these model structures were used as gas sensors for toxic SO2 and CO gases. All the structures were optimized using the two functionals, B3LYP and WB97XD with the 6-311G(d,p) basis set. In our calculations, we found the global minimum structures for both the functionals, although the total energy for these nanostructures are quite similar for these functional. The optimized geometry of these nanosheets are shown in Fig. 1. To predict the structural stability, cohesive energies were calculated, as shown in Table 1. The cohesive energies are −6.95, −6.65, −6.56, −6.31, and −6.06 eV for PG, G3BN1, G2BN2, G1BN3, and PBN, respectively. More negative energies indicate more structural stability. Thus, all the structures possess favorable cohesive energies, which is confirmed by previous studies.54,55 The cohesive energies slightly decrease from PG to PBN, i.e., PG > G3BN1 > G2BN2 > G1BN3 > PBN. The variation is shown by the bar chart in Fig. 2.
 |
| | Fig. 1 Top and side view of the optimized geometries of (a) PG, (b) G3BN1, (c) G2BN2, (d) G1BN3, and (e) PBN. | |
Table 1 Total ground state energies (ET), cohesive energies (EC), and dipole moment (D. M) of the nanosheets
| Nanosheets |
ET (keV) |
EC (eV) |
%EC |
D. M (Debye) |
| B3LYP |
WB97XD |
| PG |
−29.27 |
−29.26 |
−6.95 |
— |
0.001 |
| G3BN1 |
−29.19 |
−29.18 |
−6.65 |
4.3 |
0.25 |
| G2BN2 |
−29.94 |
−29.93 |
−6.56 |
1.3 |
0.74 |
| G1BN3 |
−29.86 |
−29.85 |
−6.31 |
3.8 |
0.93 |
| PBN |
−30.60 |
−30.59 |
−6.06 |
4.0 |
1.86 |
 |
| | Fig. 2 Illustration of decreasing (a) cohesive energy and increasing (b) energy gap of the nanosheets. | |
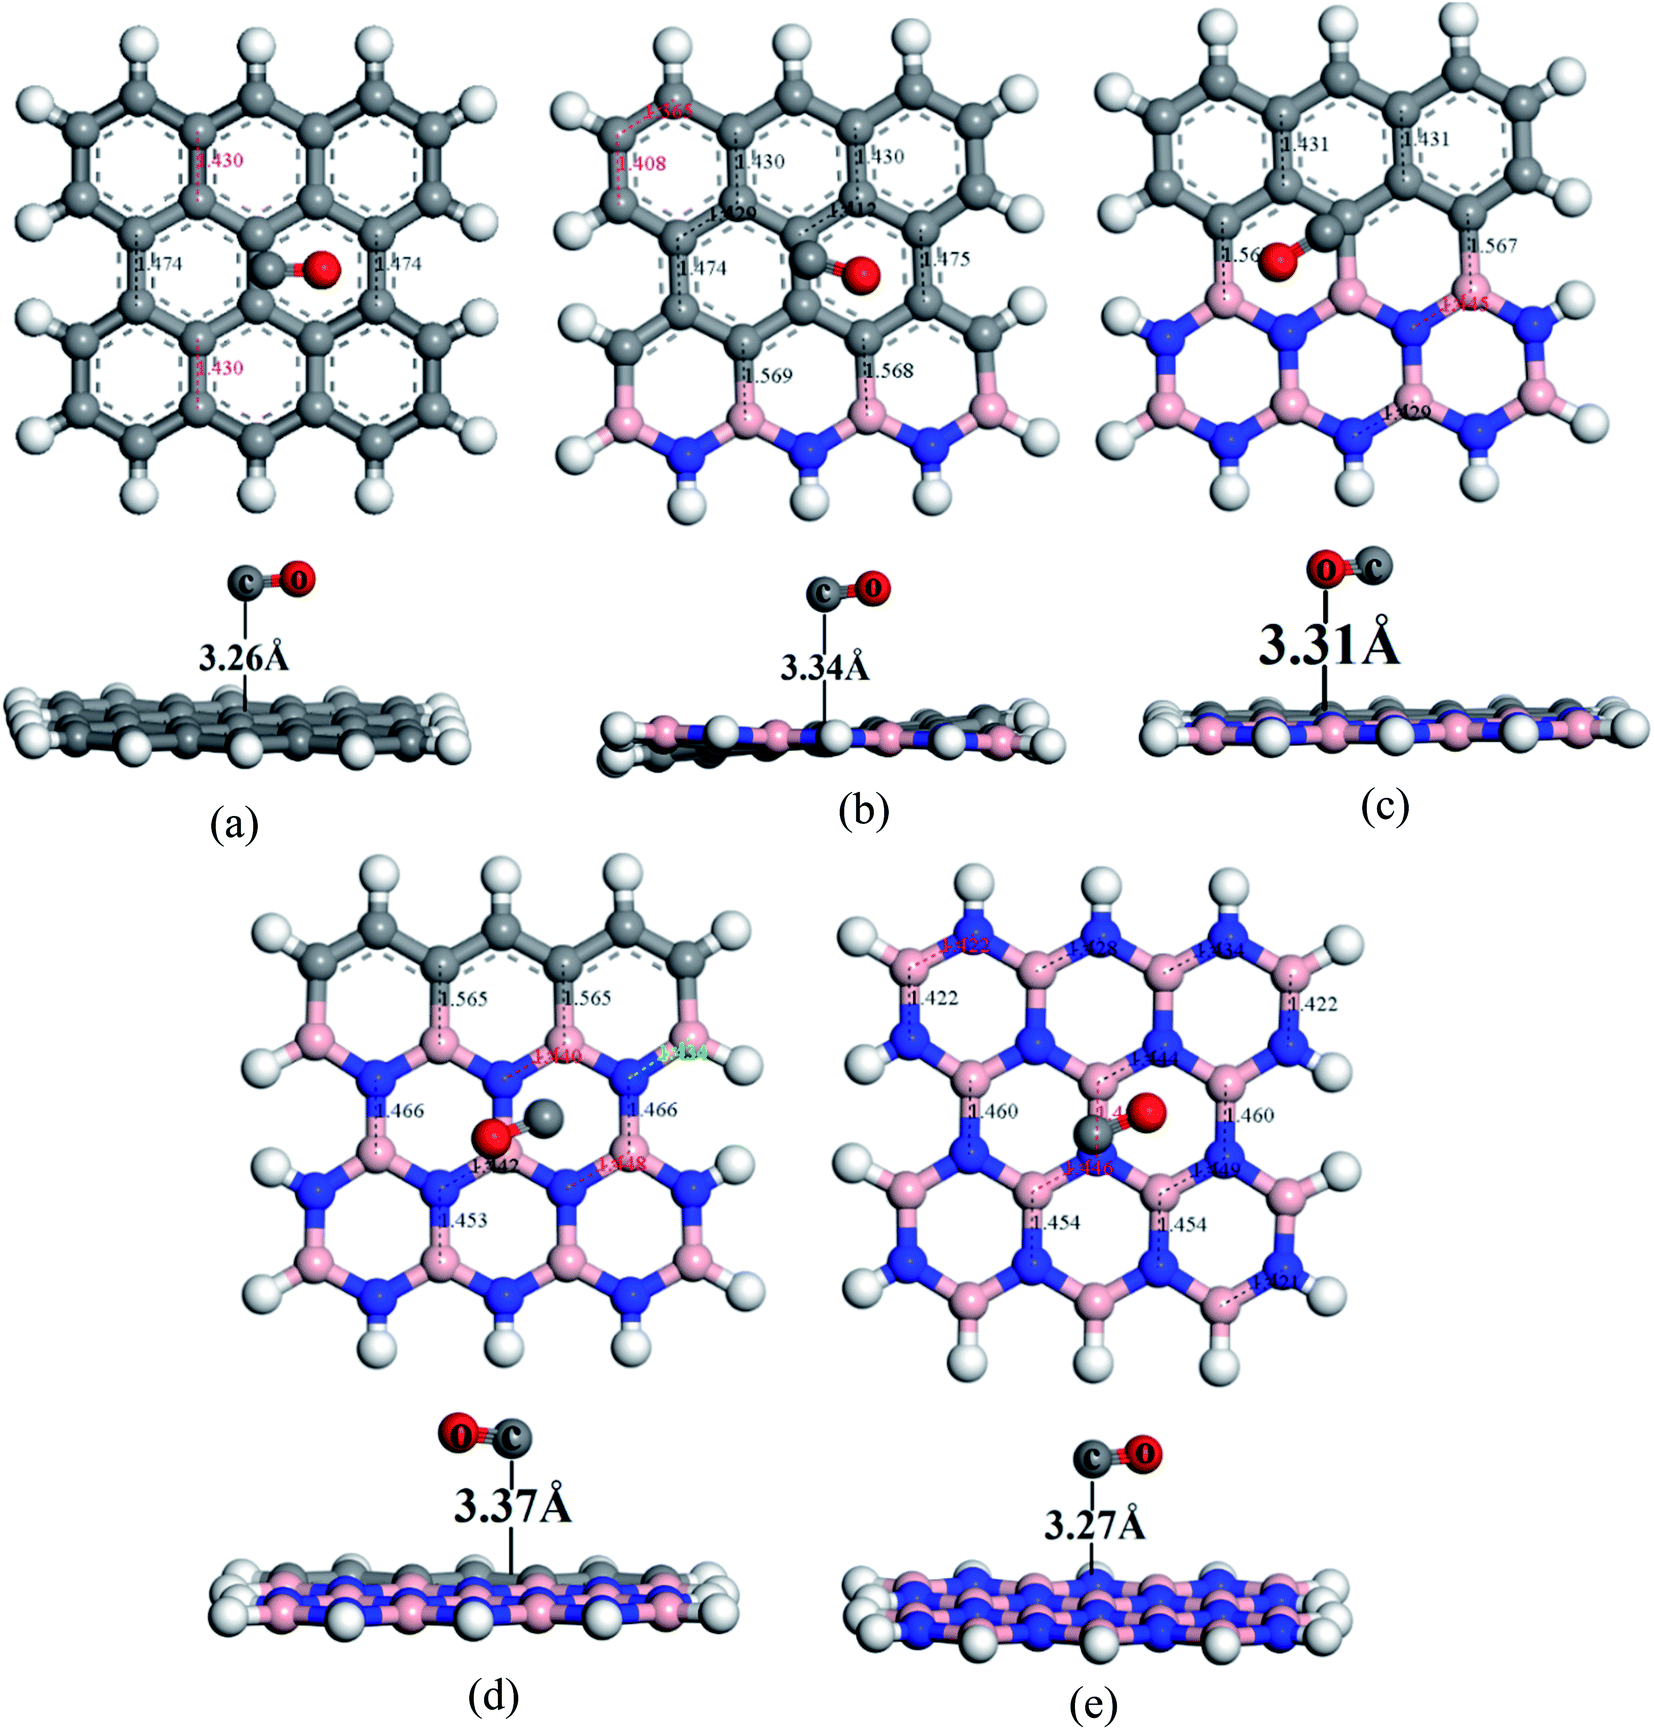
The predicted equilibrium C–C bond lengths in PG varies from 1.30 to 1.47 Å, where the larger bond lengths are present in the armchair edges than the zigzag edges. The maximum bond lengths (∼1.47 Å) were found in the middle hexagons indicated by red color and the average predicted bond length is 1.43 Å. After doping BN in zigzag rows in PG, the bond lengths slightly increase due to the greater atomic radius of B (98 pm) and N (92 pm) than C (77 pm). The average B–C bond lengths are 1.55 Å, which is greater than that for C–C and B–N bonds. In case of PBN, the average bond lengths are 1.44 Å. However the calculated average C–C, C–B, C–N, and B–N bond lengths are in good agreement with those in the previously reported studies.37,56 After the adsorption of gases such as SO2 and CO on the nanosheets, the bond lengths slightly varied by about ∼0.001 Å, as shown in Fig. 1 where black and red colors indicate the decrease and increase in the bond lengths, respectively. As all the optimized structures remain in the planar form with the adsorption of SO2 and CO gases, except for CO@G3BN1, and the bond lengths and bond angles remain almost unchanged, these nanosheets exhibit great structural stability, which make them potential candidates for gas sensors. In the CO@G3BN1 complex, the doped BN layer in G3BN1 is slightly distorted due to Coulombic repulsion between the O atom of CO and the N atoms of the BN layer as these two atoms, O (3.5) and N (3.0), are the most electronegative.
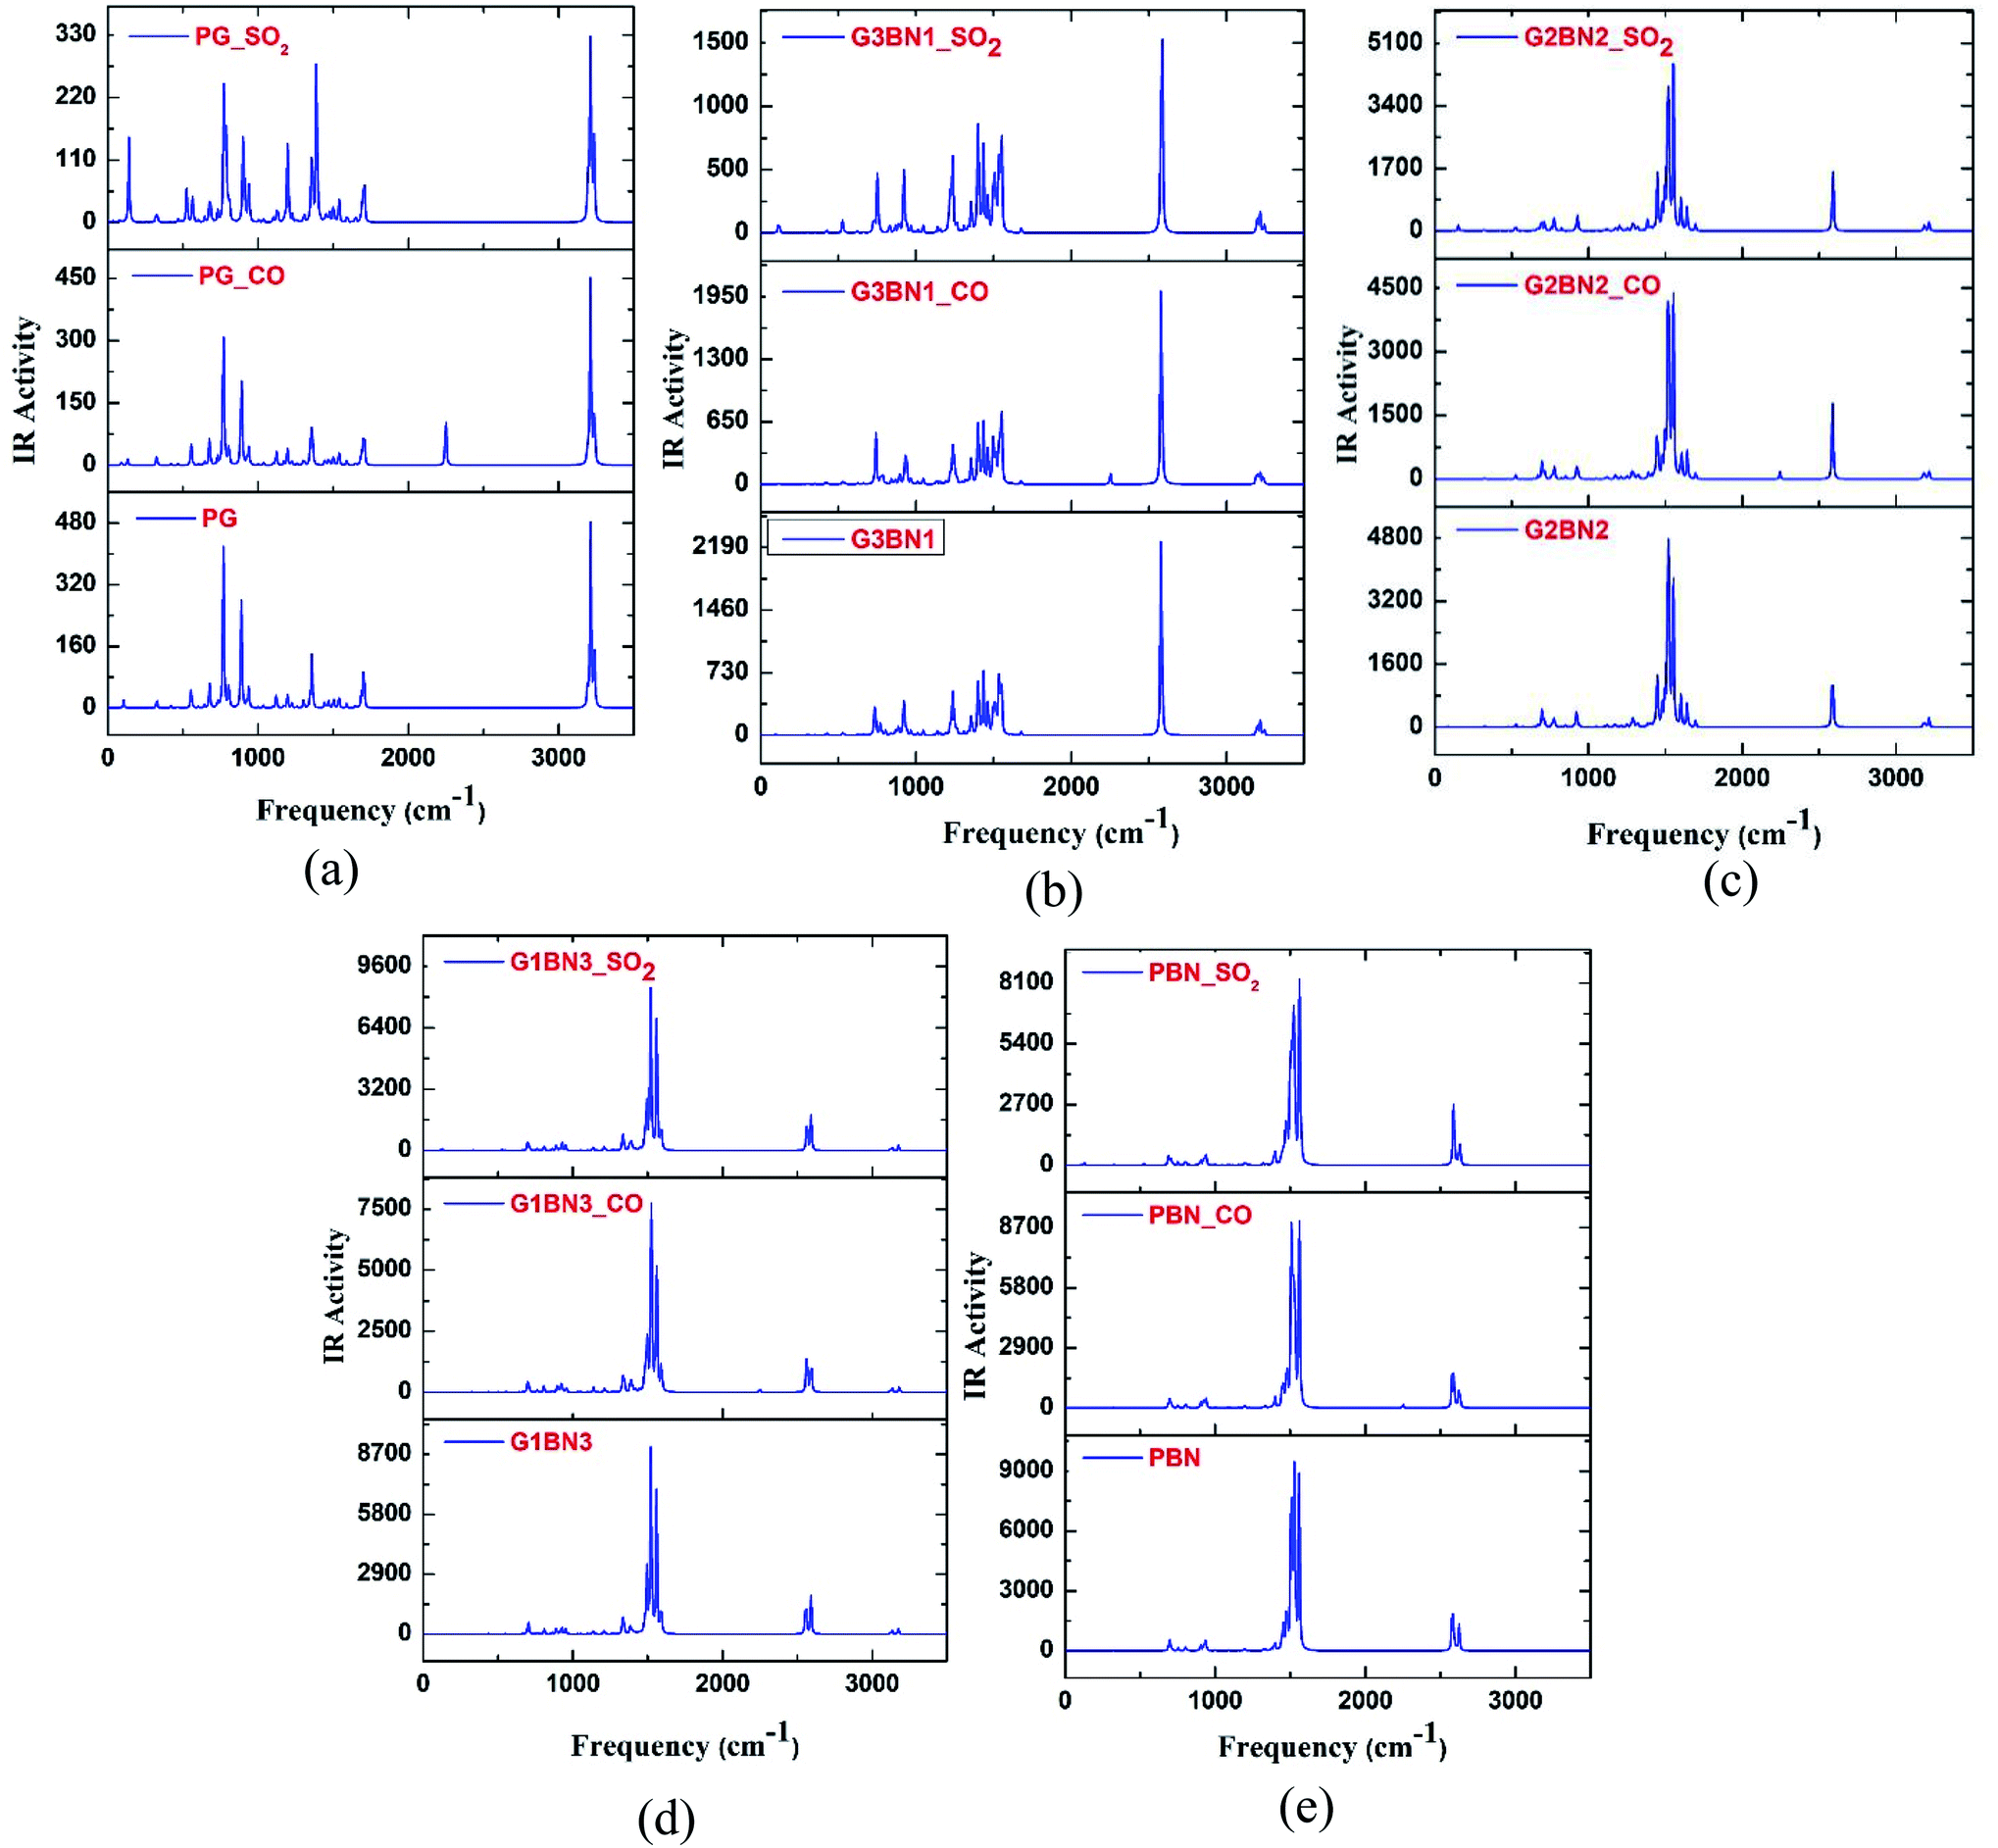
3.2. Vibrational frequencies
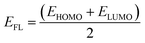
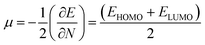
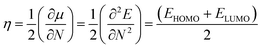
To verify the optimized geometries of the nanosheets corresponding to the local minima, the vibrational frequencies were examined. The maximum and minimum vibrational frequencies are reported in Table 2 and the spectra are illustrated in Fig. 3. As all the structures show vibrational modes in a wide range of frequencies from 20 to 3500 cm−1 with positive frequencies except for SO2@G3BN1, CO@G3BN1, CO@G2BN2, and CO@PBN systems (only one small negative frequency), this prediction indicates good structural stability. After BN doping on PG, the peak strength was greatly enhanced and followed the trend PG < G3BN1 < G2BN2 < G1BN3 < PBN, which indicates that the reactivity of the nanosheets increases with increasing concentration of BN. In the vibrational spectra of PG, CO@PG, and SO2@PG, dominant peaks were found in the region of 700–1000 cm−1 for PG and CO@PG, and in the region of 700–1500 cm−1 for SO2@PG, which are responsible for C–C bond vibrational modes. Another prominent peak was found in the region of ∼3200 cm−1, which is due to the vibration of C–H bonds. A similar phenomenon occurs in all other nanosheets but an extra peak was generated in ∼2500 cm−1 due to the drastically increase in the vibration and peak strength of B–H bonds owing to their vibrational modes. The calculated minimum frequencies are 24.7, 10.93, 29.5, 30.8, and 25.23 cm−1, and the maximum frequencies are 3239, 3640.3, 3675.8, 3679, and 3685.8 cm−1 for the PG, G3BN1, G2BN2, G1BN3, and PBN nanosheets, respectively.
Table 2 Mulliken charge and NBO analysis in (e), dipole moment (DM) in Debye, adsorption energy (Eads), and corrected adsorption energy (Eads,corr) in eV, distance (d) in Å of gas molecules from the nanosheets
| Properties |
PG |
G3BN1 |
G2BN2 |
G1BN3 |
PBN |
| CO |
SO2 |
CO |
SO2 |
CO |
SO2 |
CO |
SO2 |
CO |
SO2 |
| QM |
0.003 |
−0.010 |
0.003 |
0.005 |
0.009 |
0.003 |
0.007 |
0.027 |
0.008 |
0.023 |
| QNBO |
0.001 |
−0.022 |
0.003 |
−0.004 |
0.007 |
−0.012 |
0.015 |
0.021 |
0.013 |
0.018 |
| DM |
0.034 |
1.720 |
0.262 |
1.765 |
0.705 |
1.417 |
0.949 |
0.662 |
1.911 |
0.635 |
| EAds |
−0.363 |
−0.312 |
−0.362 |
−0.273 |
−0.367 |
−0.355 |
−0.365 |
−0.321 |
−0.448 |
−0.326 |
| Eads,corr |
−0.336 |
−0.219 |
−0.334 |
−0.169 |
−0.335 |
−0.237 |
−0.330 |
−0.169 |
−0.412 |
−0.170 |
| d |
3.26 |
3.08 |
3.31 |
3.14 |
3.37 |
3.05 |
3.34 |
3.12 |
3.27 |
3.09 |
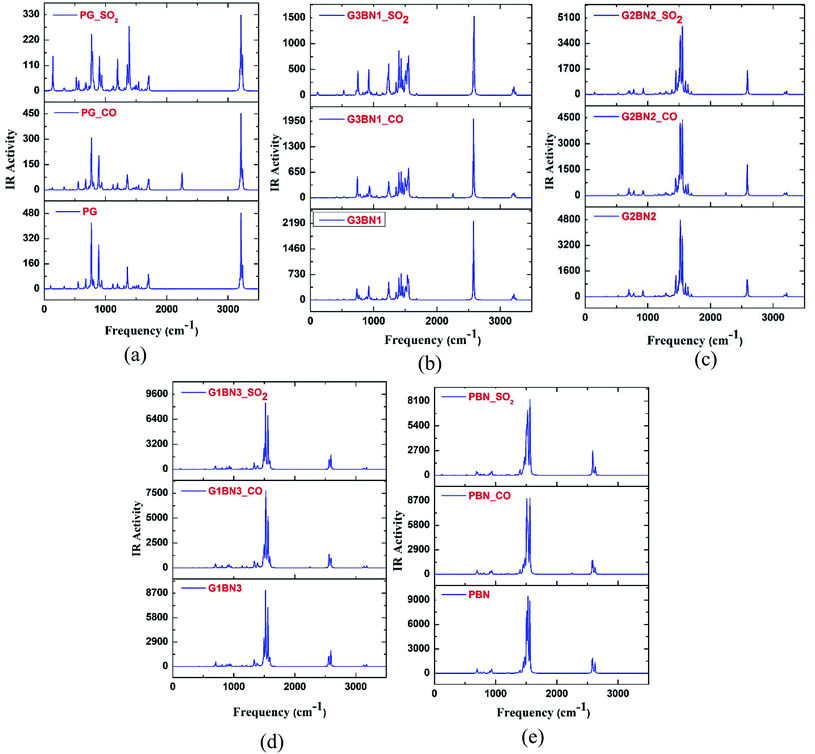 |
| | Fig. 3 IR spectral analysis of (a) PG, (b) G3BN1, (c) G2BN2, (d) G1BN3, and (e) PBN with CO and SO2 gas molecules. | |
3.3. Adsorption of CO and SO2 on the nanosheets
To understand the sensitivity and reactivity of the nanosheets toward CO and SO2 gases, we have investigated the corrected adsorption energies using eqn (3) and the desorption recovery times. Initially, a number of different adsorption sites were set up on these nanosheets by carrying out Monte Carlo Simulation and taking the most stable structures and further relaxing to the global minimum of the nanosheets with adsorbed CO and SO2 gases. In both the cases, CO and SO2 gases molecules are placed on the center of the all nanosheets, where the O and S atoms are present on the hollow site of the hexagon and the top of the atom, respectively. In case of SO2-adsorbed nanosheets, the corrected adsorption energies are −0.219, −0.169, −0.237, −0.169, and −0.170 eV with the nearest distance of 3.08, 3.14, 3.05, 3.12, and 3.09 Å for PG, G3BN1, G2BN2, G1BN3, and PBN, respectively. In case of CO-adsorbed nanosheets, for PG, G3BN1, G2BN2, G1BN3, and PBN systems, the corrected adsorption energies were found to be −0.336, −0.334, −0.335, −0.330, and −0.412 eV with the adsorption distance of 3.26, 3.31, 3.37, 3.34, and 3.27 Å, respectively. Adsorption energy greater than −0.8 eV implies chemisorption while less than −0.6 eV indicates physical adsorption.57 Thus, all adsorption energies are in the physisorption range and consistent with previous reports.24,41,58 As all the adsorption energies are negative, it indicates that there is an attractive interaction between the nanosheets and toxic gases, and also the exothermic reaction takes place thermodynamically.59 The obtained values imply that CO shows high interaction energy with the nanosheets than the SO2 gas molecule (Fig. 4 and 5).
 |
| | Fig. 4 Optimized geometry of (a) PG, (b) G3BN1, (c) G2BN2, (d) G1BN3, and (e) PBN toward SO2 gas. | |
 |
| | Fig. 5 Optimized structures of (a) PG, (b) G3BN1, (c) G2BN2, (d) G1BN3, and (e) PBN toward CO gas. | |
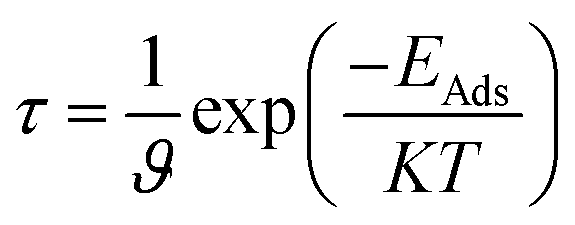
The recovery time is exponentially related to the adsorption energy and was predicted using the following equation of transition theory.60
where
T is the temperature in K,
K is the Boltzmann's constant (∼2 × 10
−3 kcal mol
−1 K
−1), and
ϑ is the used frequency. Experimentally, a sensor can be recovered by exposure to vacuum UV light
61 with frequency (10
12 to 3 × 10
14 s
−1) and temperature (298–350 K); we calculated the recovery time taking
ϑ = 10
12 s
−1 and
T = 298 K.
62–64 According to the equation, the recovery time increases in an exponential manner with the increase in the adsorption energy.
As the adsorption energies of the nanosheets toward the CO gas molecules are higher than that of the SO2 gas molecules, the recovery times are higher for CO gas than the SO2 gas molecules. The recovery times are found in the microsecond range, which are about ∼0.6 to 0.8 μs for PG, G3BN1, G2BN2, and G1BN3 toward CO gas and ∼17.7 μs for PBN for CO. In case of SO2 gas adsorption, the recovery times are found in the nanosecond range, which are estimated to be ∼0.9 to 1 ns for G3BN1, G1BN3, PBN, and 7 ns and 14.6 ns for PG and G2BN2 nanosheets, respectively. As a comparison, the recovery time has been reported to be about ∼10−6 to ∼10−9 seconds for different gas molecules (NH3, NO, CO, CO2, CH4) adsorbed on C2N.65
3.4. Charge transfer
In our study, we also analyzed the charge transfer from the gas molecules to the nanosheets by Mulliken populations and NBO analysis, and the predicted net gain or loss of charge of the adsorbed gas molecules are shown in Table 2. The charge transfer analysis of intermolecular and intramolecular systems predicts the electronic properties, adsorption, and stability of a system.24
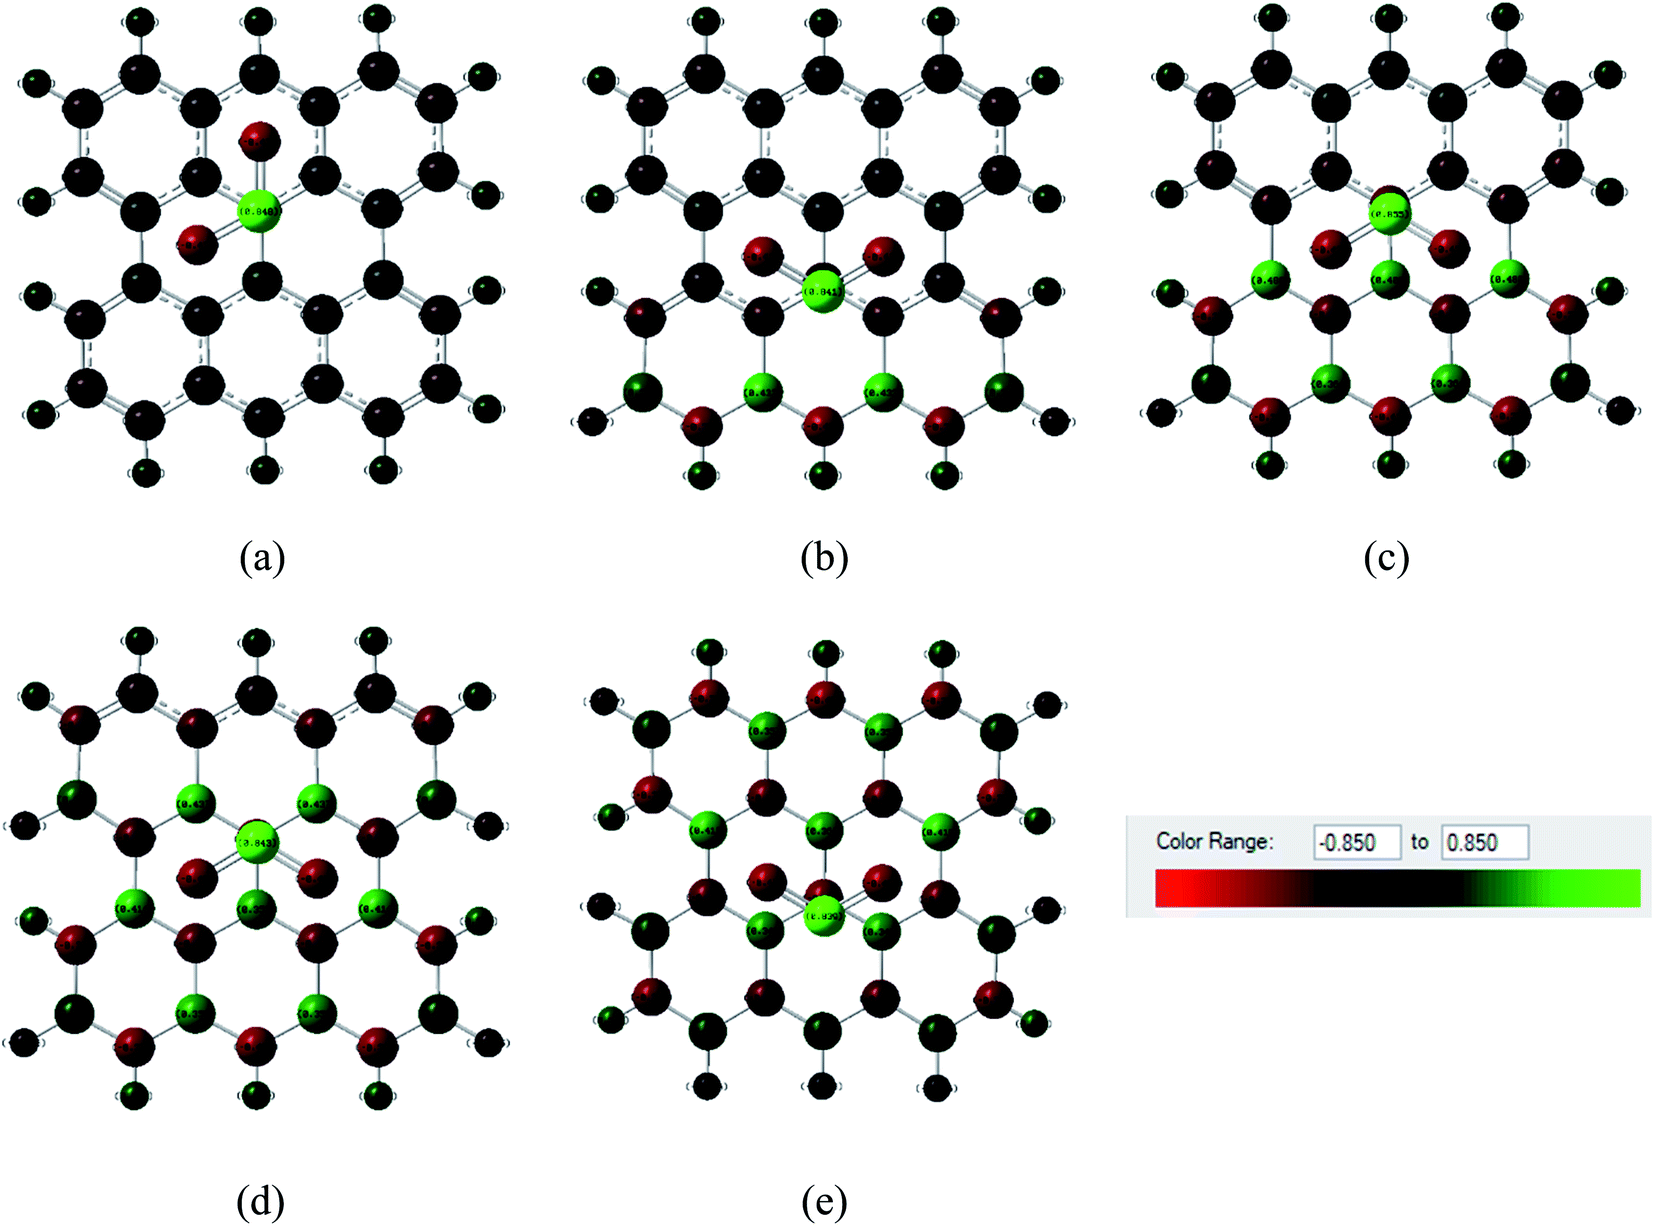
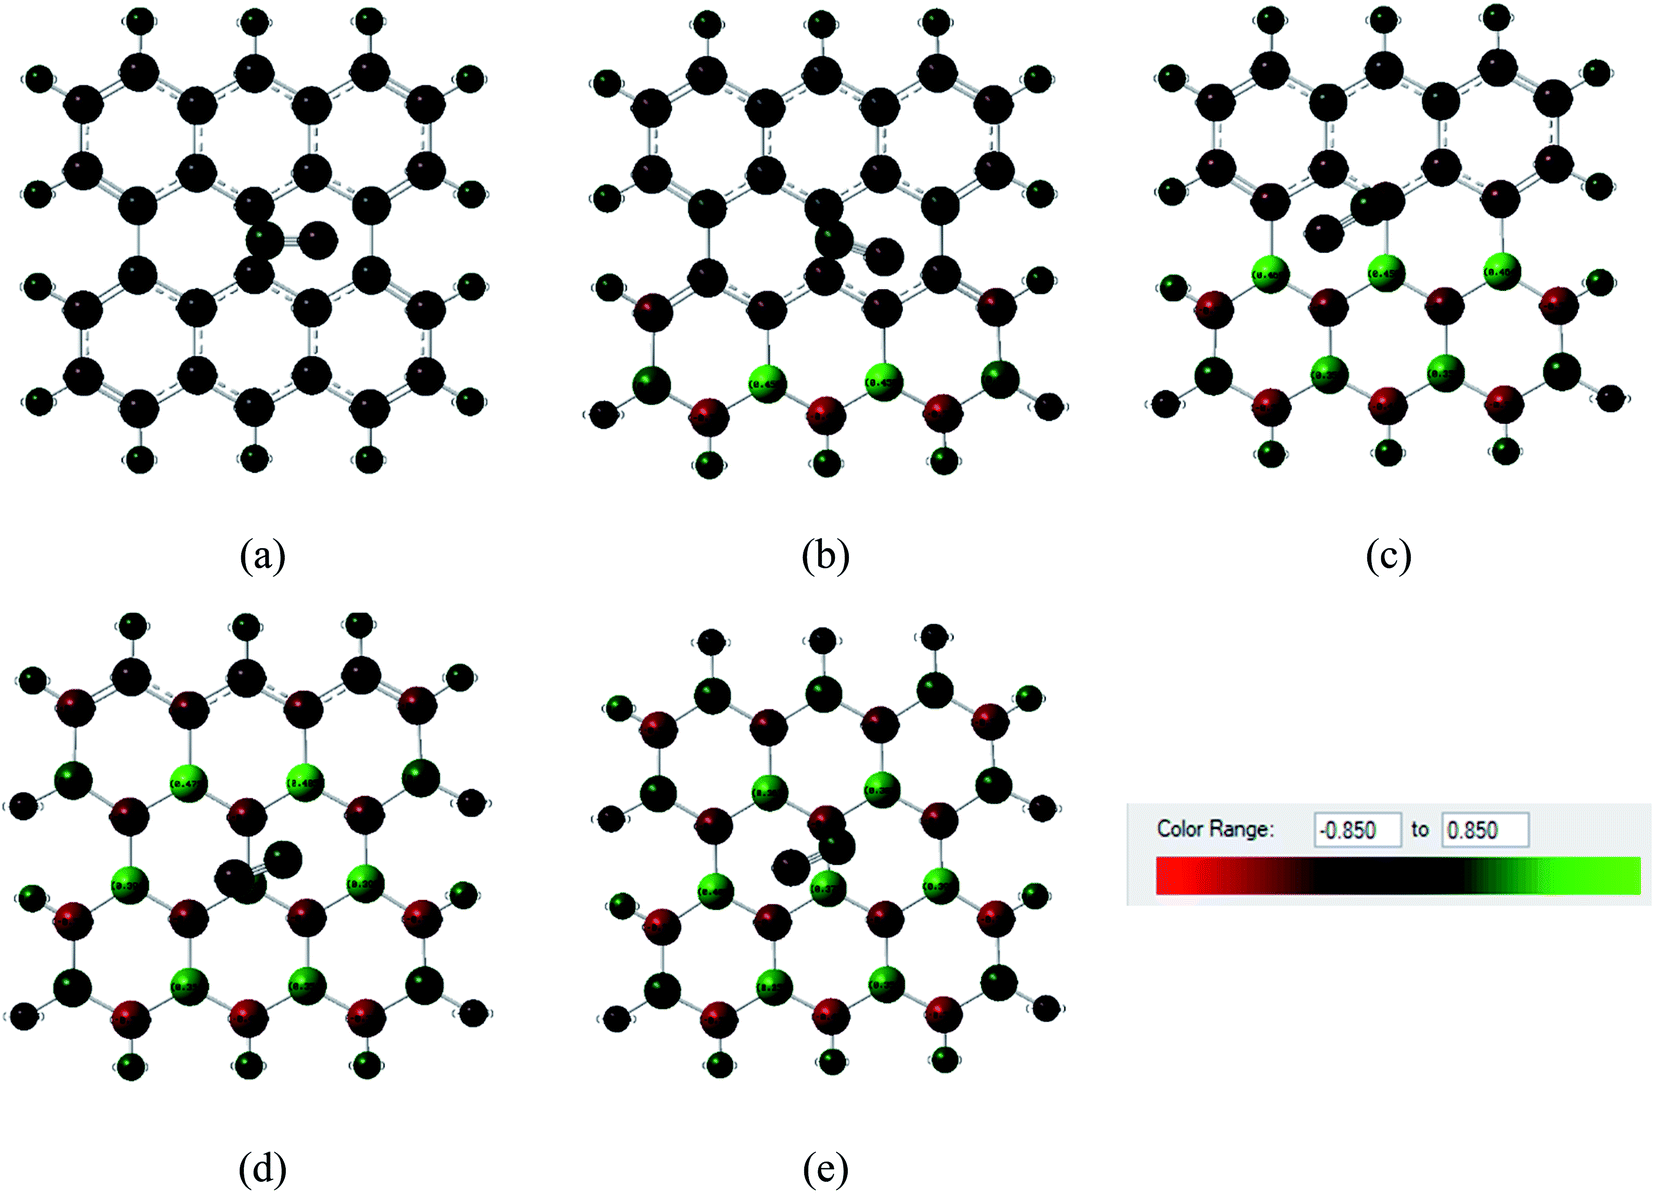
Fig. 6 and 7 show the Mulliken population color map where red color indicates the enrichment of charge density while the green color denotes the loss of charge density. As the electronegativity of the constituent atoms are in the order O > N > S > C > B, O and N act as electron acceptors while other atoms act as electron donors, which are clearly seen in the color map. For pristine graphene, the calculated net charge transfer of SO2 is −0.01e and −0.022e based on Mulliken and NBO analysis, respectively, i.e., SO2 gas molecule gains charge from the graphene nanosheet. But after modifying graphene by B and N, the nanosheets gain charge from gas molecules due to the presence of electron deficient B element on the nanosheets. The other values of net charge transfer of SO2 to the G3BN1, G2BN2, G1BN3, and PBN nanosheets are +0.005e, +0.003e, +0.027e, and +0.023e respectively. Thus, charge transfer greatly increases when graphene is modified to PBN from PG. Similar phenomenon has been found in the case of CO adsorption on the nanosheets. The net values of charge gained from CO gas molecule to PG and PBN are 0.003e and 0.008e based on Mulliken analysis, and 0.001e and 0.013e based on NBO analysis, respectively. Therefore, Mulliken charge population and NBO analysis clearly interpreted that these nanosheets are more favorable for the adsorption of SO2 gas molecule than the CO gas molecule.
 |
| | Fig. 6 Mulliken charge distribution of (a) PG, (b) G3BN1, (c) G2BN2, (d) G1BN3, and (e) PBN nanosheets with adsorbed SO2 gas molecule, where the red color indicates electron acceptor and green color indicates electron donor. | |
 |
| | Fig. 7 Mulliken charge distribution of (a) PG, (b) G3BN1, (c) G2BN2, (d) G1BN3, and (e) PBN nanosheets with adsorbed CO gas molecule where red color indicates electron acceptor and green color indicates the electron donor. | |
3.5. Electronic properties
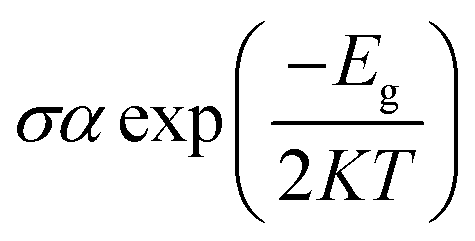
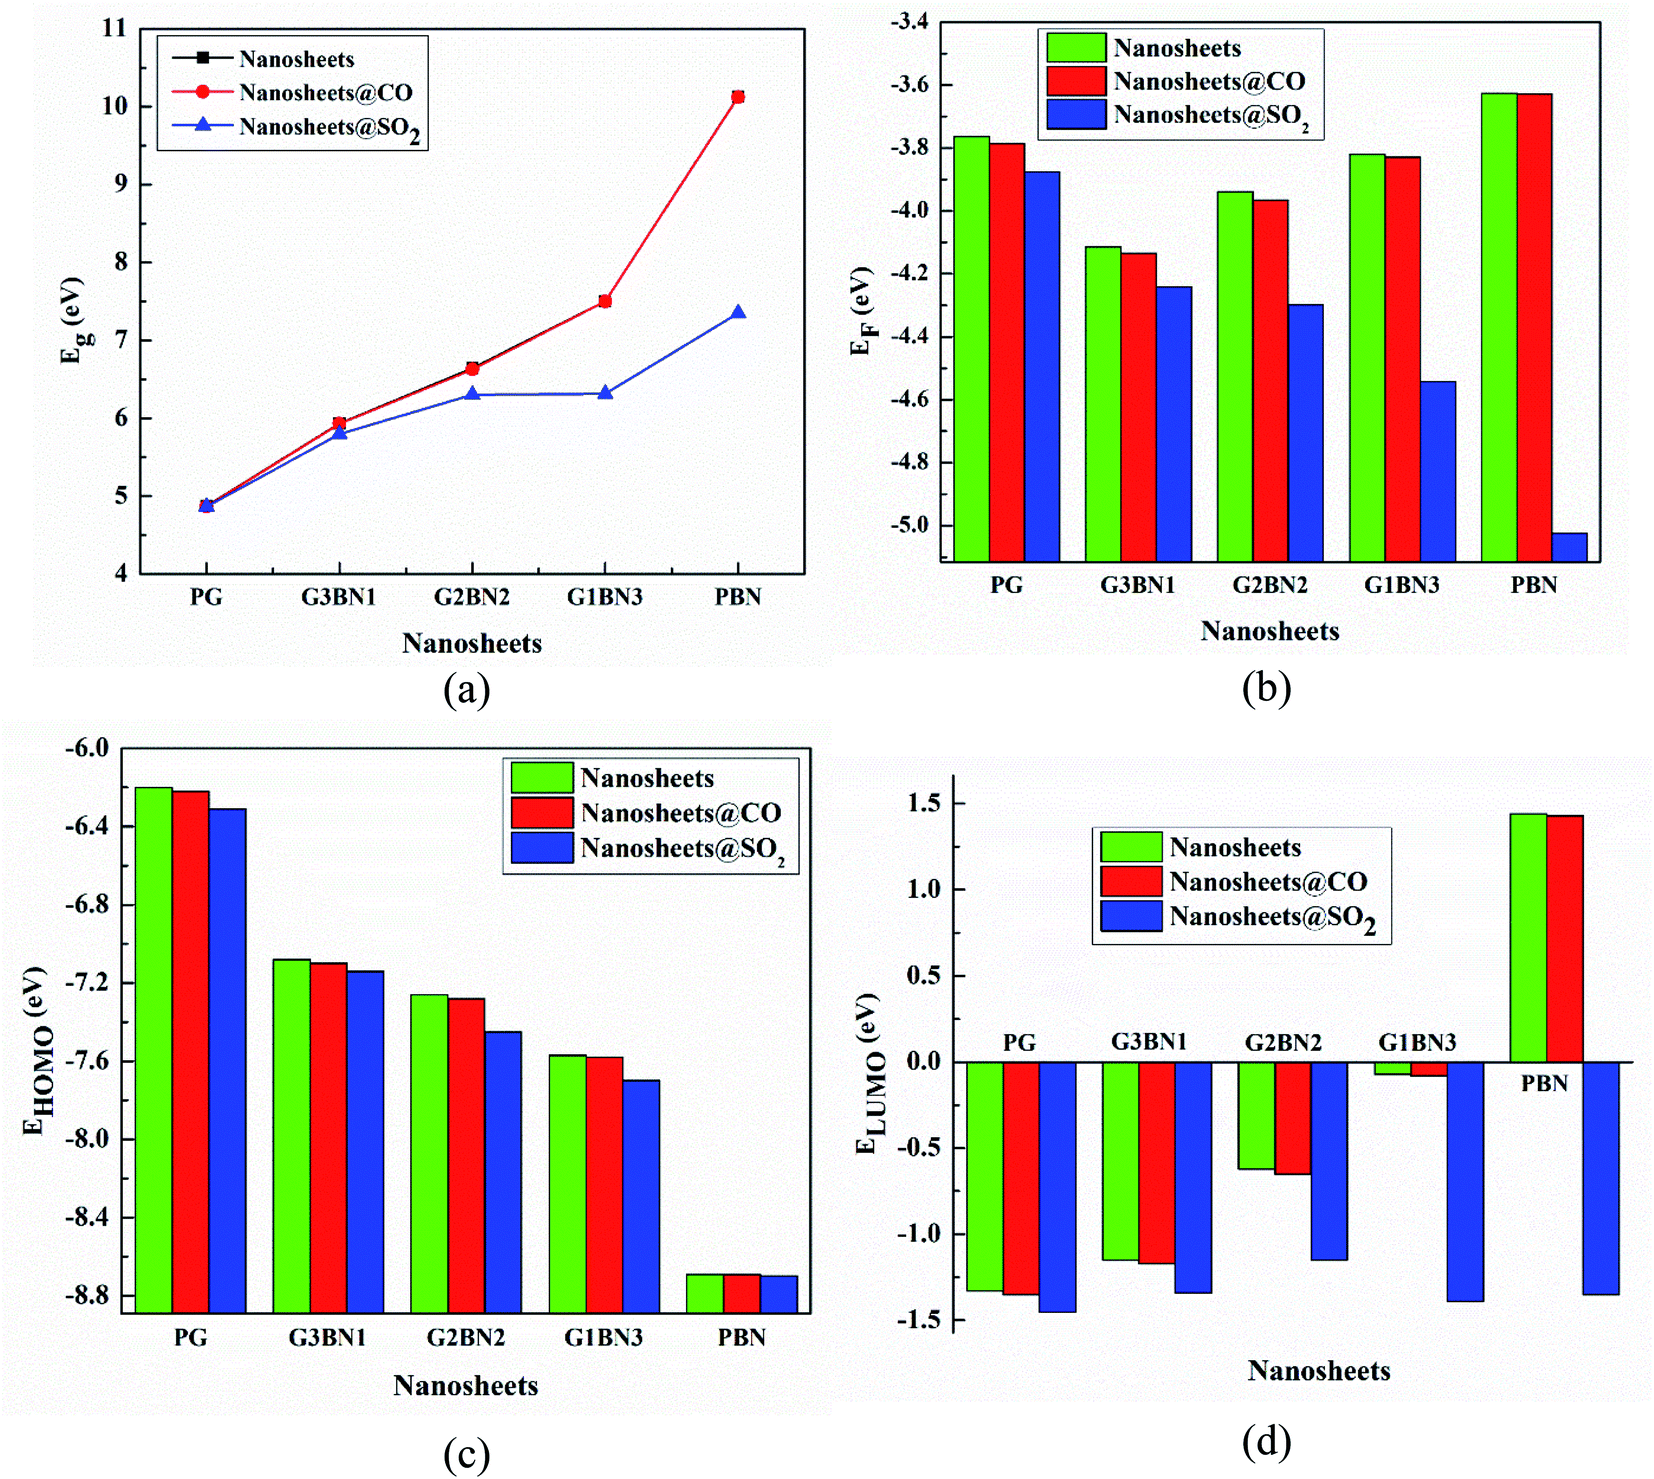
We have investigated the molecular orbital energies, energy gap, and density of states (DOS) spectra for better understanding the electronic structures as well as the adsorption process of CO and SO2 gas molecules on the nanosheets. The predicted HOMO and LUMO energies of PG are −6.20 eV and −1.33 eV, respectively, with an energy gap of 4.87 eV. The change in the energy gap, Fermi level energy, HOMO energy, and LUMO energy with the increase in the BN layer in the in-plane graphene heterostructures are illustrated in Fig. 8. After doping BN on graphene, the HOMO energies gradually increase while the LUMO energies gradually decrease. Hence, the energy gap drastically increased to about 21.7%, 36.3%, 53.9%, and 107.8% from PG to G3BN1, G2BN2, G1BN3, and PBN, respectively. According to HOMO energy, higher the HOMO energy, higher the reactivity of a molecule.66 But after adsorption of SO2 on the nanosheets, the energy gaps remain same for PG but are greatly reduced to about 2.3%, 5%, 15.8%, and 27.4% for G3BN1, G2BN2, G1BN3 heterostructures, and PBN, respectively. Thus, it indicates the increase in the reactivity and conductivity of the nanosheets after the adsorption of SO2 gas molecules. The electrical conductivity of the semiconductors is related to Eg by the following equation.
where σ and K are the conductivity and Boltzmann's constant, respectively. This equation states that with the decreasing energy gap Eg, the electrical conductivity increases exponentially.
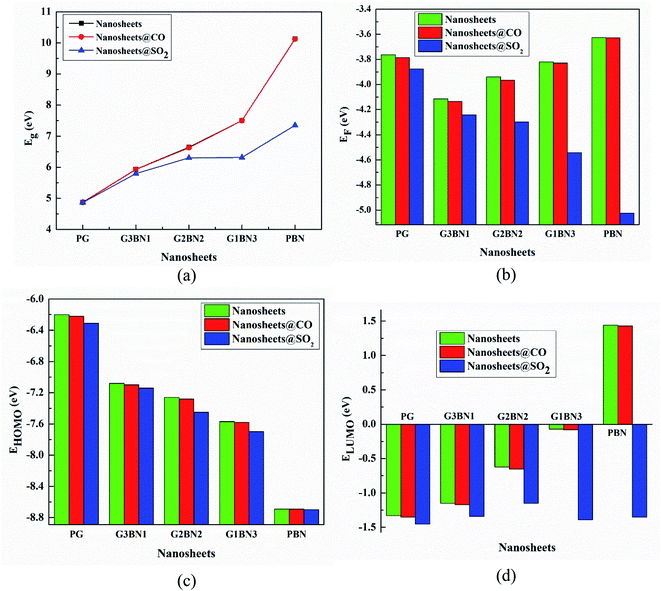 |
| | Fig. 8 Illustration of changing (a) energy gap, (b) Fermi level energy, (c) HOMO energy, and (d) LUMO energy with the increase in the BN layer in the in-plane graphene heterostructures. | |
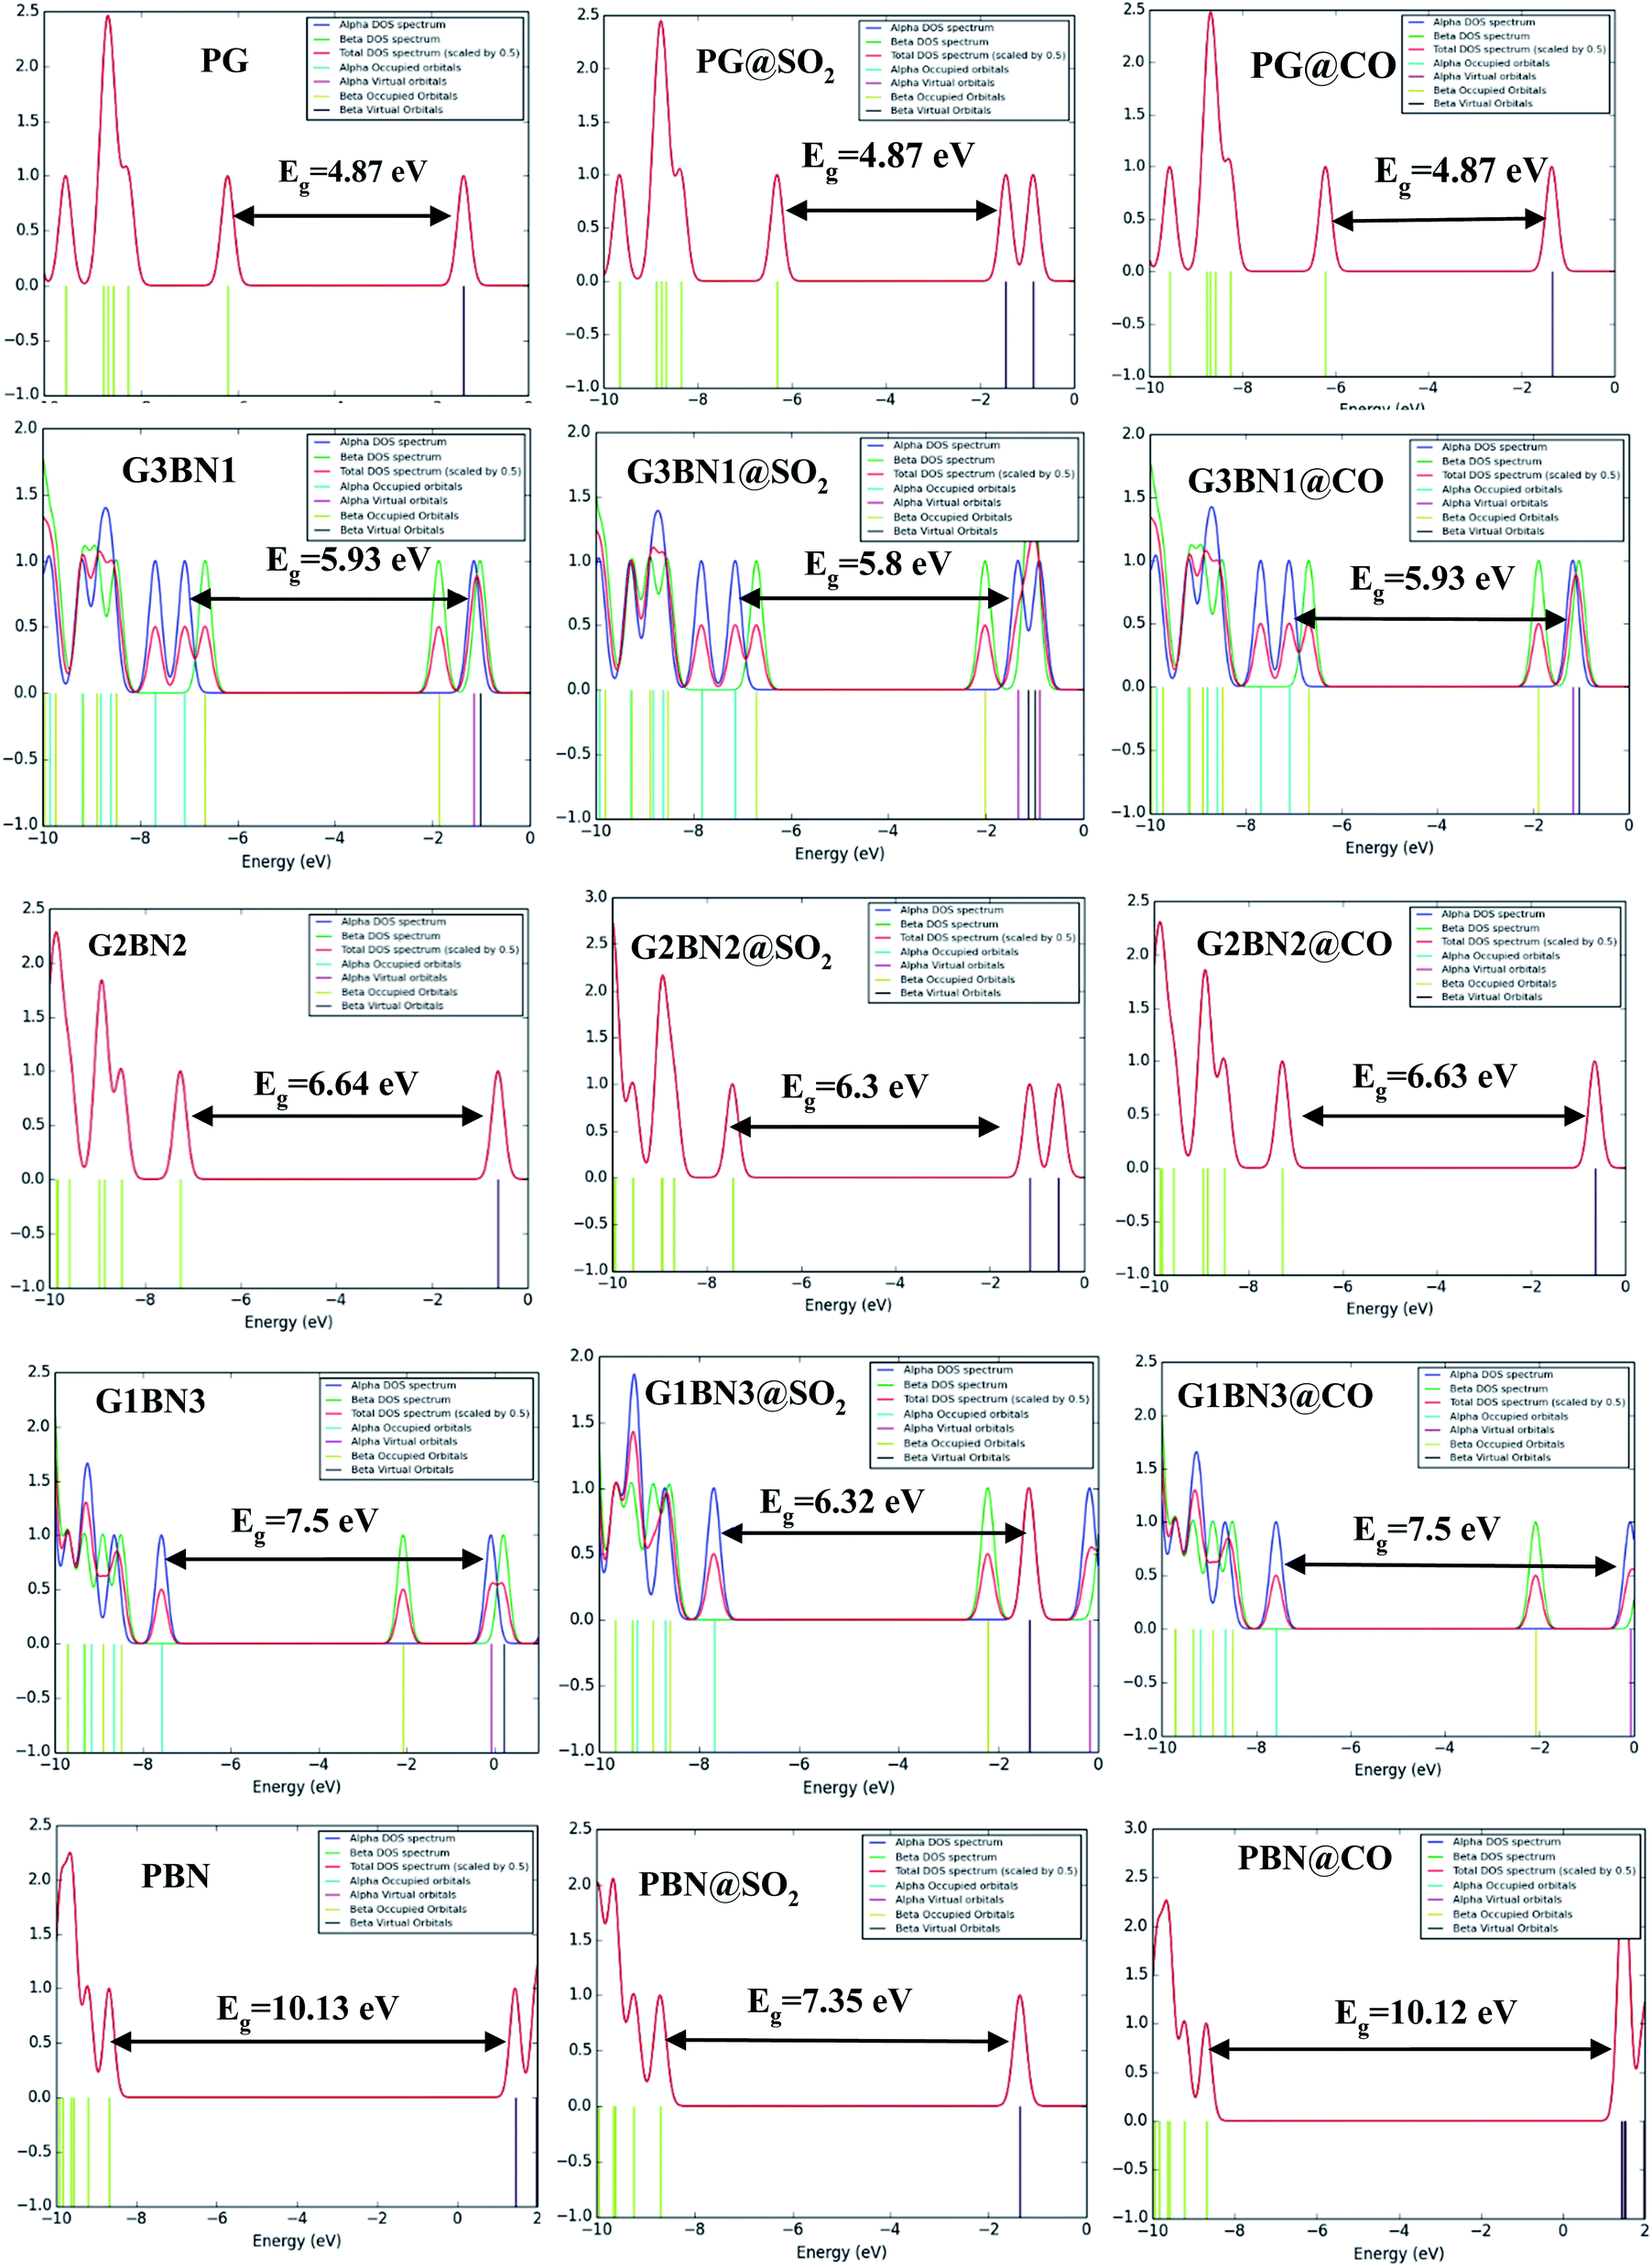
In case of CO gas molecules, the energy gaps slightly reduced by about 0.1–0.2%, which predicted that these nanosheets are not very sensitive for CO gas molecules. Fig. 9 shows the comparison of the DOSs spectra without (left column), with SO2 (middle column), and with CO (right column) nanosheets. We also calculated the dipole moment, which predicts the polarity of the nanosheets, i.e., higher dipole moment means higher interaction between the adsorbed gas molecules and the nanosheets. For all the nanosheets, the dipole moment increased after the adsorption of the gas molecules, which leads to the enhancement of the reactivity of the nanosheets. The work function φ is another key parameter for the sensor, which implies the amount of energy required to eliminate the electron from the Fermi level to the outside of the material. It is a surface-dependent property that describes the surface behavior of the nanosheets after the adsorption of gas molecules. The change in the work function greatly alters the conducting properties of the nanosheets after adsorption upon the nanosheets' surface.
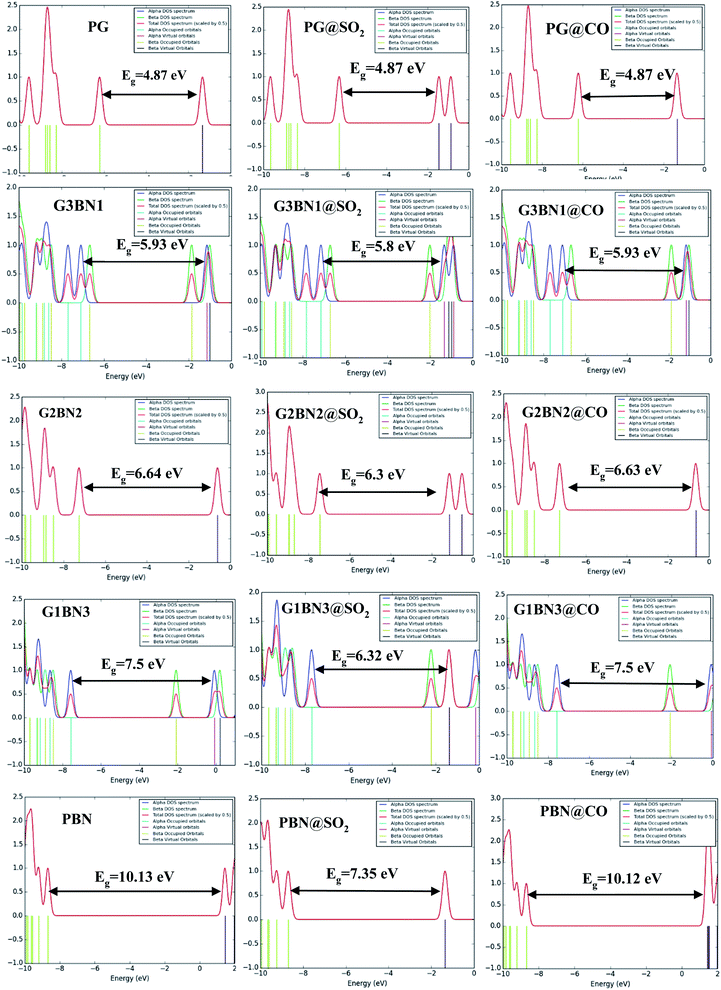 |
| | Fig. 9 DOSs spectra without (left column), with SO2 (middle column), and with CO (right column) nanosheets. | |
The work function is defined as φ = Vel(±∞) − EF, where Vel(±∞) is the electron electrostatic potential energy far from the surface of the material and is assumed to be zero. Thus, one can write work function φ = −EF, and the calculated values and the change in the work functions are illustrated in Table 3. The calculated values reveal that the work function is significantly altered after the adsorption of SO2 gas molecules and increases with increasing dopant BN concentration. The values change by about 3%, 3.2%, 9.14%, 18.8%, and 38.3% for PG, G3BN1, G2BN2, G1BN3, and PBN nanosheets after the adsorption of SO2 gas. But for the adsorption of CO gas molecules, the values change very slightly by about ∼0.5%, which is consistent with the change in the energy gap.
Table 3 HOMO energy (EHOMO), LUMO energy (ELUMO), HOMO–LUMO energy gap (Eg), Fermi level energy (Eg), work function (φ) in eV, change in HOMO–LUMO energy gap (%ΔEg), and work function (%Δφ) with respect to the nanosheets
| Nanosheets |
EHOMO |
ELUMO |
Eg |
% ΔEg |
EF |
φ |
% Δφ |
| PG |
−6.20 |
−1.33 |
4.873 |
— |
−3.76 |
3.76 |
— |
| G3BN1 |
−7.08 |
−1.15 |
5.932 |
— |
−4.11 |
4.11 |
— |
| G2BN2 |
−7.26 |
−0.62 |
6.64 |
— |
−3.94 |
3.94 |
— |
| G1BN3 |
−7.57 |
−0.07 |
7.49 |
— |
−3.82 |
3.82 |
— |
| PBN |
−8.69 |
1.44 |
10.13 |
— |
−3.63 |
3.63 |
— |
| PG@SO2 |
−6.31 |
−1.45 |
4.867 |
0.1 |
−3.88 |
3.88 |
3 |
| G3BN1@SO2 |
−7.14 |
−1.34 |
5.80 |
2.3 |
−4.24 |
4.24 |
3.2 |
| G2BN2@SO2 |
−7.45 |
−1.15 |
6.30 |
5.9 |
−4.30 |
4.30 |
9.14 |
| G1BN3@SO2 |
−7.70 |
−1.39 |
6.32 |
15.8 |
−4.54 |
4.54 |
18.8 |
| PBN@SO2 |
−8.70 |
−1.35 |
7.35 |
27.4 |
−5.02 |
5.02 |
38.3 |
| PG@CO |
−6.22 |
−1.35 |
4.868 |
0.10 |
−3.79 |
3.79 |
0.6 |
| G3BN1@CO |
−7.10 |
−1.17 |
5.93 |
0.03 |
−4.14 |
4.14 |
0.5 |
| G2BN2@CO |
−7.28 |
−0.65 |
6.63 |
0.2 |
−3.97 |
3.97 |
0.7 |
| G1BN3@CO |
−7.58 |
−0.08 |
7.50 |
0.03 |
−3.83 |
3.83 |
0.2 |
| PBN@CO |
−8.69 |
1.43 |
10.12 |
0.04 |
−3.63 |
3.63 |
0.1 |
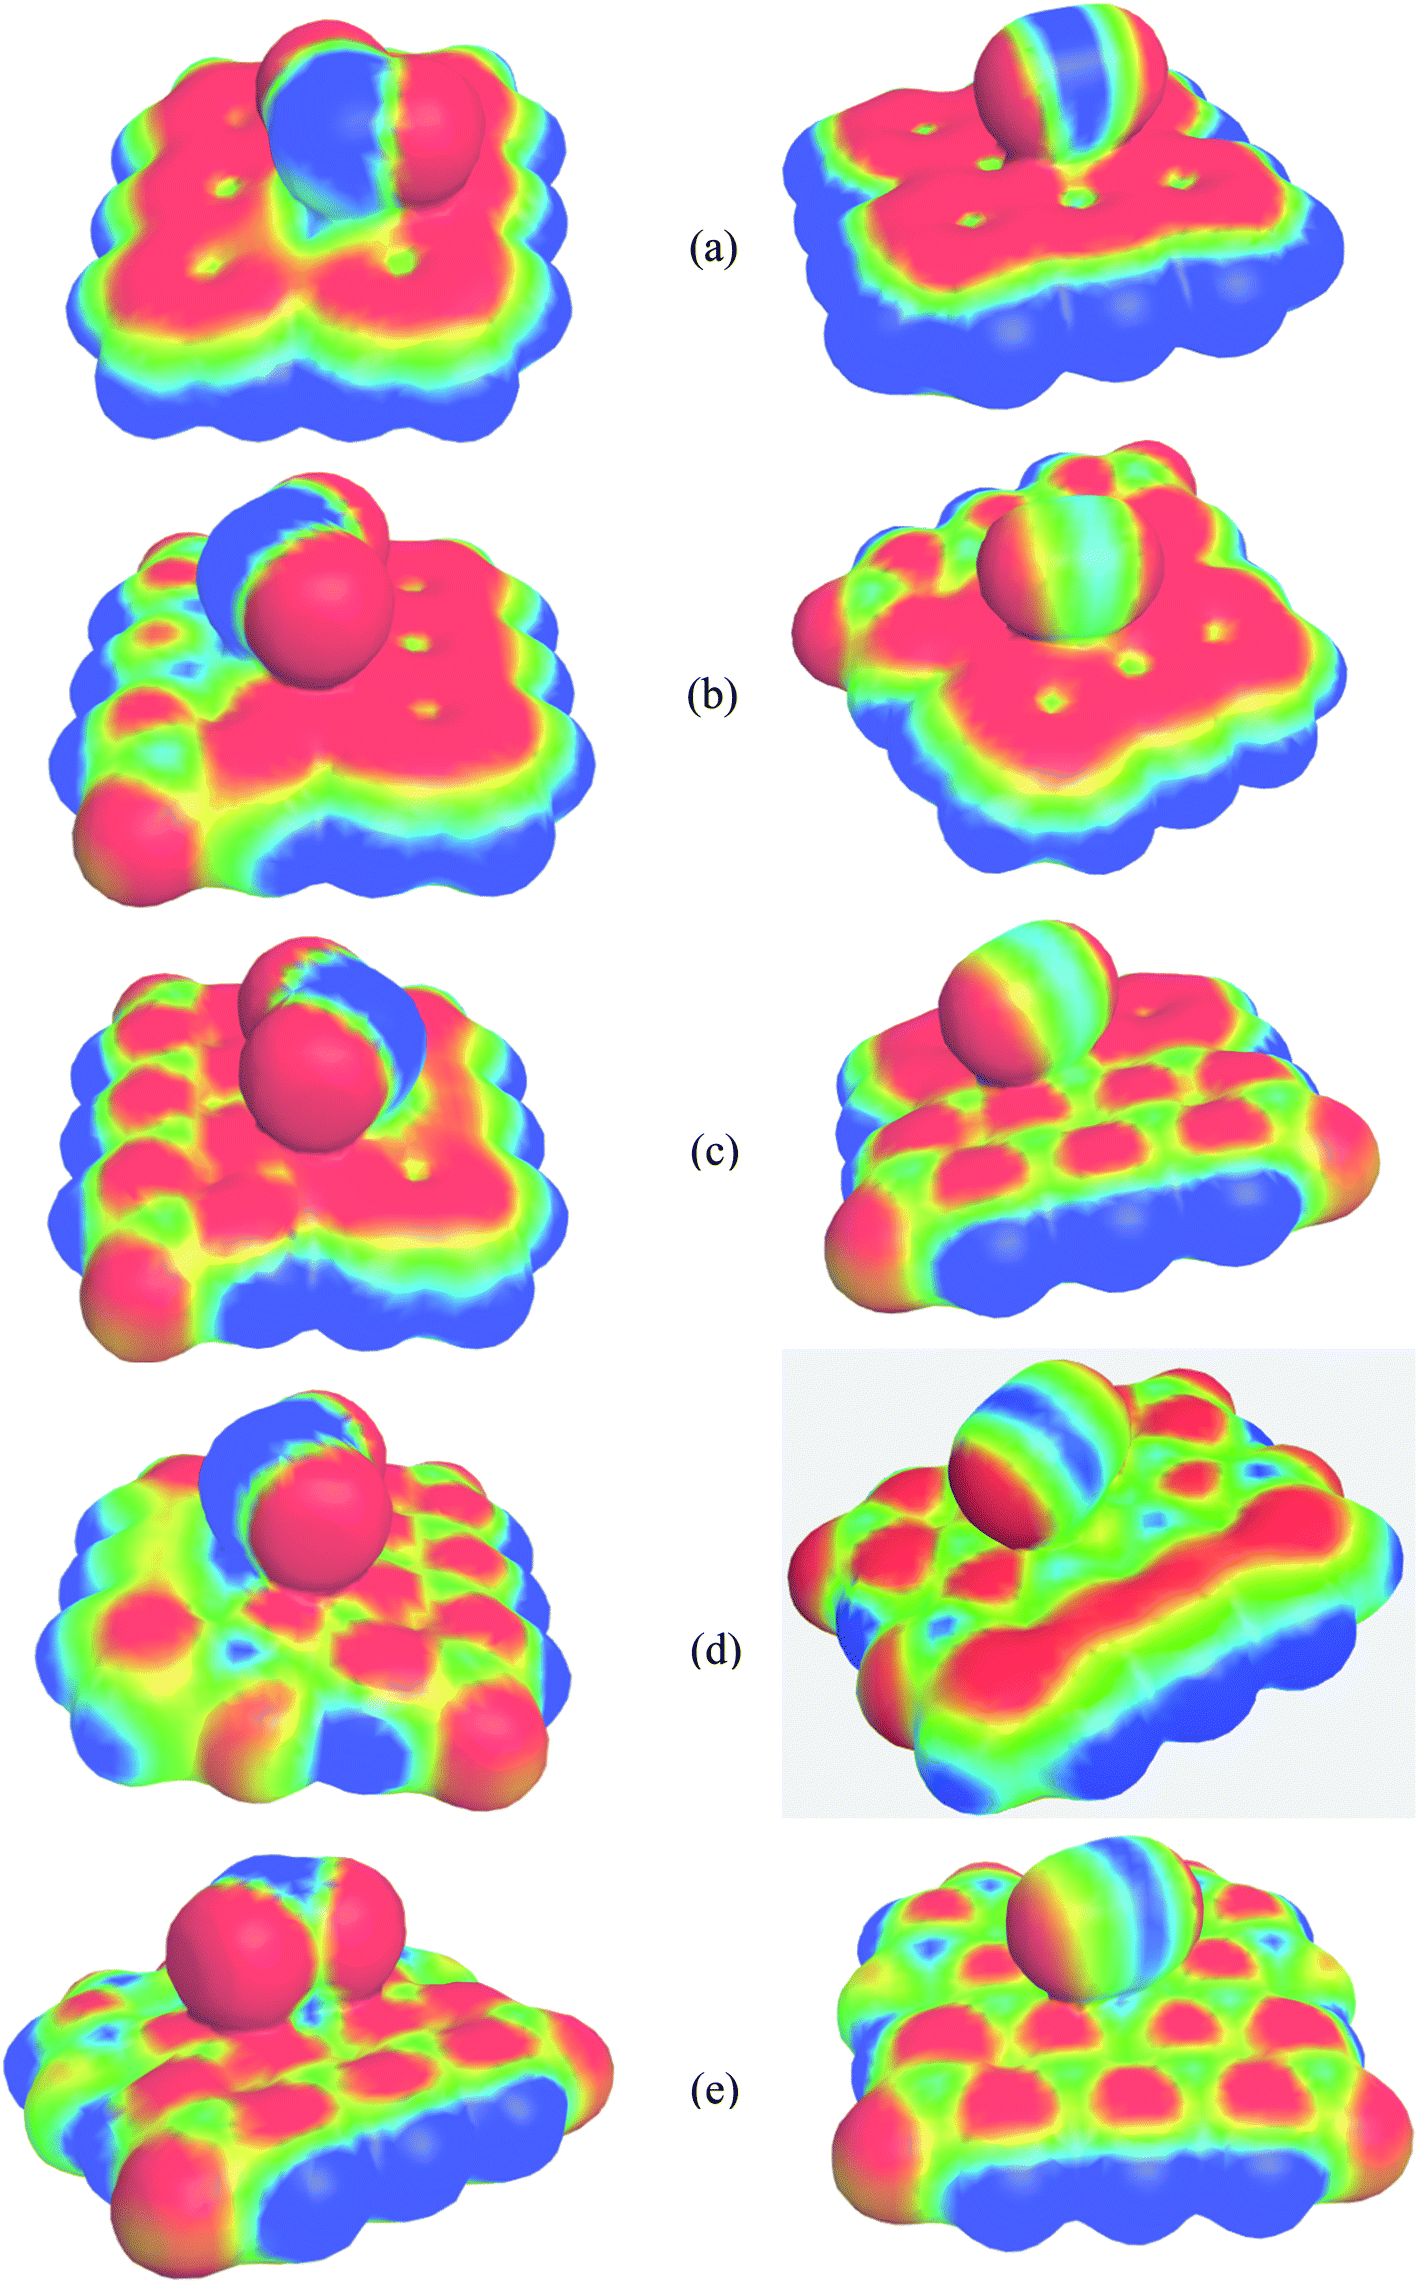
3.6. Molecular electrostatic potential map
Molecular electrostatic potential (MEP) maps represent the nucleophilic, electrophilic, and neutral regions of the systems and help visualize surface charge density distribution. The calculated MEP maps are illustrated in Fig. 10. Here, the red and blue colors indicate the negative (electrophilic region) and positive (nucleophilic region) charge. It is clearly seen that in PG, the maximum negative electrostatic potential is located over the C atoms throughout the whole surface except at the center of hexagonal ring but when it was modified by B and N, the positive and negative, i.e., the nucleophilic and electrophilic regions are located on the B and N atoms, respectively, which agree with our charge distribution analysis. Strong positive charges are found around the nanosheets where H atoms are located. In the SO2 gas molecule, the positive and negative electrostatic potentials occur on the S and O sites, respectively, while in the CO gas molecule, the positive charges are localized in between the C and O atoms and negative charges are located at the two ending sites of C–O bond. After the adsorption of SO2 and CO on the nanosheets, significant charge transfer occurs between the adsorbates and the adsorbents, which can be clearly found in the MEP map.
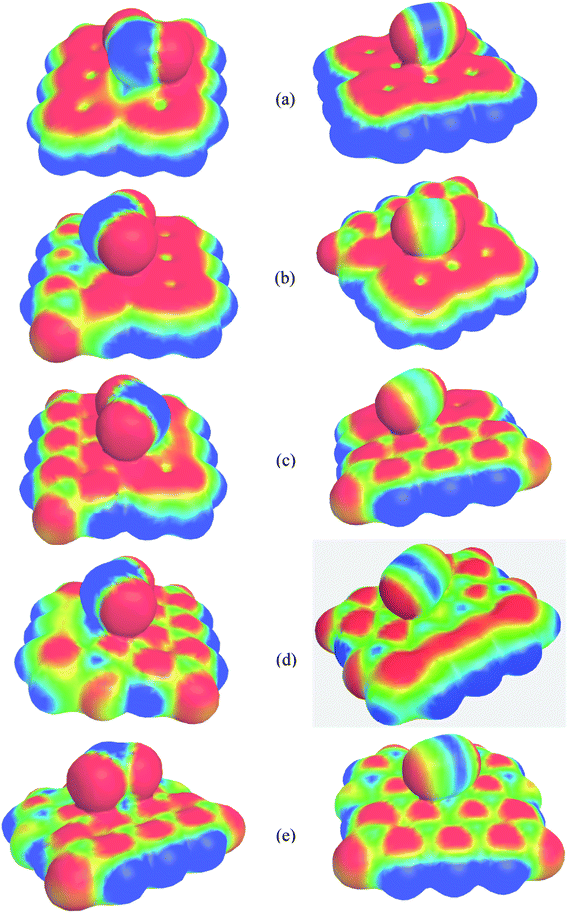 |
| | Fig. 10 MEP of (a) PGN, (b) G3BN1, (c) G2BN2, (d) G1BN3, and (e) PBN with adsorbed SO2 gas molecule (left column) and CO gas molecule (right column). The MEP surfaces are defined by 0.0004 electron per bohr3 contour of the electronic density. | |
3.7. Global indices
The global indices such as global hardness, softness, and electrophilicity help understand the reactivity for CO and SO2 adsorption on the nanosheets; these parameters were calculated and are summarized in Table 4. Higher global hardness indicates the higher stability toward deformation in the presence of electric field and it has an opposite relation with global softness. Thus, with decreasing hardness, the stability of the system decreases but the reactivity of the system increases, which plays an important role in gas sensors. In our study, the hardness and softness remained almost the same when CO and SO2 gas molecules were adsorbed upon the PG nanosheets. But after the adsorption of SO2 on the G3BN1, G2BN2, G1BN3, and PBN nanosheets, these parameters decreased significantly while the softness of the systems increased considerably. The values of hardness were reduced from 2.97, 3.32, 3.75, and 5.06 eV to 2.90, 3.15, 3.16, and 3.68 eV for SO2 adsorption upon G3BN1, G2BN2, G1BN3, and PBN nanosheets, respectively.
Table 4 Chemical potential, hardness, softness, electrophilicity, ionization potential, and electron affinity in eV
| Nanosheets |
Chemical potential |
Hardness |
Softness |
Electrophilicity |
Ionization potential |
Electron affinity |
| PG |
3.77 |
2.44 |
1.22 |
17.29 |
6.204 |
1.331 |
| G3BN1 |
4.11 |
2.97 |
1.48 |
25.1 |
7.08 |
1.148 |
| G2BN2 |
3.94 |
3.32 |
1.66 |
25.74 |
7.258 |
0.616 |
| G1BN3 |
3.82 |
3.75 |
1.87 |
27.41 |
7.573 |
0.074 |
| PBN |
3.62 |
5.06 |
2.53 |
33.2 |
8.685 |
1.443 |
| PG@SO2 |
3.88 |
2.43 |
1.22 |
18.32 |
6.314 |
1.447 |
| G3BN1@SO2 |
4.24 |
2.9 |
1.45 |
26.05 |
7.138 |
1.342 |
| G2BN2@SO2 |
4.3 |
3.15 |
1.58 |
29.17 |
7.454 |
1.15 |
| G1BN3@SO2 |
4.54 |
3.16 |
1.58 |
32.58 |
7.7 |
1.385 |
| PBN@SO2 |
5.03 |
3.68 |
1.84 |
46.45 |
8.703 |
1.352 |
| PG@CO |
3.78 |
2.43 |
1.22 |
17.4 |
6.215 |
1.347 |
| G3BN1@CO |
4.13 |
2.97 |
1.48 |
25.29 |
7.095 |
1.165 |
| G2BN2@CO |
3.96 |
3.31 |
1.66 |
25.99 |
7.275 |
0.647 |
| G1BN3@CO |
3.83 |
3.75 |
1.88 |
27.44 |
7.576 |
0.075 |
| PBN@CO |
3.63 |
5.06 |
2.53 |
33.37 |
8.693 |
−1.431 |
The increase in the electrophilicity and chemical potentials of these systems also predict the increase in the reactivity after the adsorption of SO2 gas molecules. The values of chemical potentials increased from 4.11, 3.94, 3.82, and 3.62 eV to 4.24, 4.30, 4.54, and 5.03 eV for SO2 adsorption upon G3BN1, G2BN2, G1BN3, and PBN nanosheets, respectively. Therefore, these nanosheets are highly suitable for sensing SO2 gas molecules. In case of CO, these parameters almost remain unchanged, which shows that these nanosheets show poor interaction with CO gas molecules; these predictions were also found from the energy gap and work function analysis. We also investigated Koopmans' ionization potential and electron affinity, which are shown in Table 4. The higher the value of ionization potential, the more is electronic stability of the structure. On the other hand, a lesser value of electron affinity indicates a more electronically stable structure.67
4. Conclusion
In our study, the geometric structures, adsorption ability, electronic properties, and chemical stability of PG, PBN, and their heterostructures G3BN1, G2BN2, and G1BN3 were investigated by employing B3LYP and WB97XD functionals with the 6-311G (d, p) basis set. We found that these predicted nanosheets show good structural stability with favorable cohesive energy and the band gap gradually increases with increasing doping concentration of BN. We studied these model nanostructures for their gas sensing properties toward toxic SO2 and CO gases. After the adsorption of SO2 gas molecule on the nanosheets, the electronic properties such as HOMO and LUMO energies, HOMO–LUMO energy gap, Fermi level, work function, and conductivity change greatly, except for PG, but change slightly after the adsorption of CO gas molecule. This phenomenon predicts that these nanosheets (except PG) are more sensitive for SO2 than CO gas molecules. The adsorption energies were found to be in the physisorption range, which are favorable for gas sensors, as confirmed from previous studies. Among these heterostructures, G2BN2 exhibits greater adsorption energy of about −0.237 eV and −0.335 eV for SO2 and CO gas molecules, respectively. We also calculated the desorption recovery time by taking ϑ = 1012 s−1 and T = 298 K. The recovery times were found in the microsecond range (∼10−6 s) for the nanosheets toward CO gas and in the nanosecond range (∼10−9 s) for the nanosheets toward SO2 gas. The Mulliken and NBO charge analyses reveal that charge transfer occurs from the gas molecules to the nanosheets except for SO2@PG. From our calculated electronic and adsorption properties, these nanosheets demonstrate promising gas sensing properties toward SO2 and CO gas molecules.
Conflicts of interest
The authors declare that they have no known competing financial interests or personal relationships that could have appeared to influence the work reported in this paper.
Acknowledgements
Jannatul Mawwa thankfully acknowledges the Ministry of Science and Technology, Bangladesh for their financial support through the National Science and Technology (NST) Fellowship to conduct this research as part of her M. S. thesis. Further, the authors thankfully acknowledge the Higher Education Quality Enhancement Program (HEQEP) subproject CP-3415 provided by the Ministry of Education, Bangladesh with the financial supports from the World Bank through the University Grant Commission (UGC) of Bangladesh for setting up the Computational Physics (CP) Research Lab in the Department of Physics at Jahangirnagar University.
References
- D. A. Hashim, A. M. Alwan and M. F. Jawad, J. Electrochem. Soc., 2018, 165, B773–B778 CrossRef CAS.
- M. Dun, J. Tan, W. Tan, M. Tang and X. Huang, Sens. Actuators, B, 2019, 298, 126839 CrossRef CAS.
- J. Ozhikandathil, S. Badilescu and M. Packirisamy, J. Electrochem. Soc., 2018, 165, B3078–B3083 CrossRef CAS.
- I. Lee and S. A. Akbar, Ionics, 2014, 20, 563–569 CrossRef CAS.
- K. Suematsu, K. Watanabe, M. Yuasa, T. Kida and K. Shimanoe, J. Electrochem. Soc., 2019, 166, B618–B622 CrossRef CAS.
- E. Babusikova, M. Jesenak, P. Durdik, D. Dobrota and P. Banovcin, J. Physiol. Pharmacol., 2008, 59, 9–17 Search PubMed.
- C. Behl, Prog. Neurobiol., 1999, 57, 301–323 CrossRef CAS PubMed.
- J. S. Pandey, R. Kumar and S. Devotta, Atmos. Environ., 2005, 39, 6868–6874 CrossRef CAS.
- A. Bryant, M. Poirier, G. Riley, D. L. Lee and J. F. Vetelino, Sens. Actuators, 1983, 4, 105–111 CrossRef CAS.
- C. M. Mari, M. Beghi, S. Pizzini and J. Faltemier, Sens. Actuators, B, 1990, 2, 51–55 CrossRef CAS.
- S. S. Bhoga and K. Singh, Ionics, 2007, 13, 417–427 CrossRef CAS.
- R. Chandiramouli and B. G. Jeyaprakash, RSC Adv., 2015, 5, 43930–43940 RSC.
- E. Pop, V. Varshney and A. K. Roy, MRS Bull., 2012, 37, 1273–1281 CrossRef CAS.
- X. Wang, L. Zhi and K. Müllen, Nano Lett., 2008, 8, 323–327 CrossRef CAS PubMed.
- H. Y. Nan, Z. H. Ni, J. Wang, Z. Zafar, Z. X. Shi and Y. Y. Wang, J. Raman Spectrosc., 2013, 44, 1018–1021 CrossRef CAS.
- S. V. Morozov, K. S. Novoselov, M. I. Katsnelson, F. Schedin, D. C. Elias, J. A. Jaszczak and A. K. Geim, Phys. Rev. Lett., 2008, 100(1), 016602 CrossRef CAS PubMed.
- X. Y. Liang, N. Ding, S. P. Ng and C. M. L. Wu, Appl. Surf. Sci., 2017, 411, 11–17 CrossRef CAS.
- X. Lin, J. Ni and C. Fang, J. Appl. Phys., 2013, 113, 034306 CrossRef.
- S. M. S. Seyyedi, Z. S. M. Pour and E. Nadimi, in 22nd Iranian Conference on Electrical Engineering, ICEE, 2014, vol. 2014, pp. 463–466 Search PubMed.
- X. Deng, D. Zhang, M. Si and M. Deng, Phys. E, 2011, 44, 495–500 CrossRef CAS.
- D. Singh, A. Kumar and D. Kumar, Bull. Mater. Sci., 2017, 40, 1263–1271 CrossRef CAS.
- X. Y. Liu, J. M. Zhang, K. W. Xu and V. Ji, Appl. Surf. Sci., 2014, 313, 405–410 CrossRef CAS.
- A. A. Peyghan, M. Noei and M. B. Tabar, J. Mol. Model., 2013, 19, 3007–3014 CrossRef CAS PubMed.
- A. S. Rad, S. S. Shabestari, S. A. Jafari, M. R. Zardoost and A. Mirabi, Mol. Phys., 2016, 114, 1756–1762 CrossRef CAS.
- Z. M. Ao, J. Yang, S. Li and Q. Jiang, Chem. Phys. Lett., 2008, 461, 276–279 CrossRef CAS.
- L. F. Velázquez-López, S. M. Pacheco-Ortin, R. Mejía-Olvera and E. Agacino-Valdés, J. Mol. Model., 2019, 25, 1–11 CrossRef PubMed.
- M. D. Esrafili, Phys. Lett. A, 2019, 383, 1607–1614 CrossRef CAS.
- M. Sajjad and P. Feng, Mater. Res. Bull., 2014, 49, 35–38 CrossRef CAS.
- A. A. Piya, S. U. D. Shamim, M. N. Uddin, K. N. Munny, A. Alam, M. K. Hossain and F. Ahmed, Comput. Theor. Chem., 2021, 1200, 113241 CrossRef CAS.
- X. Deng, D. Zhang, M. Si and M. Deng, Phys. E, 2011, 44, 495–500 CrossRef CAS.
- G. Kim, S. C. Jung and Y. K. Han, Curr. Appl. Phys., 2013, 13, 2059–2063 CrossRef.
- K. Watanabe, T. Taniguchi and H. Kanda, Nat. Mater., 2004, 3, 404–409 CrossRef CAS PubMed.
- Z. Liu, L. Ma, G. Shi, W. Zhou, Y. Gong, S. Lei, X. Yang, J. Zhang, J. Yu, K. P. Hackenberg, A. Babakhani, J. C. Idrobo, R. Vajtai, J. Lou and P. M. Ajayan, Nat. Nanotechnol., 2013, 8, 119–124 CrossRef CAS PubMed.
- Y. Chen and M. Sun, Nanoscale, 2021, 13, 5594 RSC.
- X. Mu and M. Sun, Appl. Phys. Lett., 2020, 117, 091601, DOI:10.1063/5.0018854.
- Q. Li, M. Liu, Y. Zhang and Z. Liu, Small, 2016, 12, 32–50 CrossRef CAS PubMed.
- M. T. Nguyen, ChemPhysChem, 2014, 15, 2372–2376 CrossRef CAS PubMed.
- J. Zhang, W. Xie, X. Xu, S. Zhang and J. Zhao, Chem. Mater., 2016, 28, 5022–5028 CrossRef CAS.
- R. S. Krsmanović and Ž. Šljivančanin, J. Phys. Chem. C, 2014, 118, 16104–16112 CrossRef.
- F. A. L. De Souza, G. Sivaraman, J. Hertkorn, R. G. Amorim, M. Fyta and W. L. Scopel, J. Mater. Chem. A, 2019, 7, 8905–8911 RSC.
- I. K. Petrushenko and K. B. Petrushenko, Diamond Relat. Mater., 2019, 100, 107575 CrossRef CAS.
- L. Chen, C. Xu, X. F. Zhang and T. Zhou, Phys. E, 2009, 41, 852–855 CrossRef CAS.
- J. Da Chai and M. Head-Gordon, Phys. Chem. Chem. Phys., 2008, 10, 6615–6620 RSC.
- A. S. Rad, M. Ardjmand, M. R. Esfahani and B. Khodashenas, Spectrochim. Acta, Part A, 2021, 247, 119082 CrossRef CAS PubMed.
- Y. Liu, J. Chem. Eng. Data, 2009, 54, 1981–1985 CrossRef CAS.
- A. S. Rad and K. Ayub, Mater. Chem. Phys., 2017, 194, 337–344 CrossRef CAS.
- S. Fukuzumi, C. L. Wong and J. K. Kochi, J. Am. Chem. Soc., 1980, 102, 2928–2939 CrossRef CAS.
- M. Rakib Hossain, M. Mehade Hasan, S. Ud Daula Shamim, T. Ferdous, M. Abul Hossain and F. Ahmed, Comput. Theor. Chem., 2021, 1197, 113156 CrossRef CAS.
- R. G. Pearson, Inorg. Chem., 1988, 27, 734–740 CrossRef CAS.
- R. G. Pearson, J. Chem. Sci., 2005, 117, 369–377 CrossRef CAS.
- J. P. Cornard and C. Lapouge, J. Phys. Chem. A, 2006, 110, 7159–7166 CrossRef CAS PubMed.
- W. R. Wadt and P. J. Hay, J. Chem. Phys., 1985, 82, 284–298 CrossRef CAS.
- A. S. Rad, S. S. Shabestari, S. A. Jafari, M. R. Zardoost and A. Mirabi, Mol. Phys., 2016, 114, 1756–1762 CrossRef CAS.
- F. W. Averill, J. R. Morris and V. R. Cooper, Phys. Rev. B: Condens. Matter Mater. Phys., 2009, 80, 195411 CrossRef.
- G. J. Slotman and A. Fasolino, J. Phys.: Condens. Matter, 2012, 25, 045009 CrossRef PubMed.
- S. Bhowmick, A. K. Singh and B. I. Yakobson, J. Phys. Chem. C, 2011, 115, 9889–9893 CrossRef CAS.
- M. G. Ahangari, A. H. Mashhadzadeh, M. Fathalian, A. Dadrasi, Y. Rostamiyan and A. Mallahi, Vacuum, 2019, 165, 26–34 CrossRef CAS.
- F. Behmagham, E. Vessally, B. Massoumi, A. Hosseinian and L. Edjlali, Superlattices Microstruct., 2016, 100, 350–357 CrossRef CAS.
- S. U. D. Shamim, T. Hussain, M. R. Hossian, M. K. Hossain, F. Ahmed, T. Ferdous and M. A. Hossain, J. Mol. Model., 2020, 26, 1–17 CrossRef PubMed.
- A. Ahmadi Peyghan, N. L. Hadipour and Z. Bagheri, J. Phys. Chem. C, 2013, 117, 2427–2432 CrossRef CAS.
- H. Wang, T. Maiyalagan and X. Wang, ACS Catal., 2012, 2, 781–794 CrossRef CAS.
- Z. Rahmani, L. Edjlali, E. Vessally, A. Hosseinian and P. D. K. Nezhad, J. Sulfur Chem., 2020, 41, 82–95 CrossRef CAS.
- M. Li, Y. Wei, G. Zhang, F. Wang, M. Li and H. Soleymanabadi, Phys. E, 2020, 118, 113878 CrossRef CAS.
- S. Peng, K. Cho, P. Qi and H. Dai, Chem. Phys. Lett., 2004, 387, 271–276 CrossRef CAS.
- Y. Yong, H. Cui, Q. Zhou, X. Su, Y. Kuang and X. Li, Appl. Surf. Sci., 2019, 487, 488–495 CrossRef CAS.
- H. Ullah, A. U. H. A. Shah, S. Bilal and K. Ayub, J. Phys. Chem. C, 2013, 117, 23701–23711 CrossRef CAS.
- X. J. Feng and Y. H. Luo, J. Phys. Chem. A, 2007, 111, 2420–2425 CrossRef CAS PubMed.
|
| This journal is © The Royal Society of Chemistry 2021 |
Click here to see how this site uses Cookies. View our privacy policy here. 
 Open Access Article
 This Open Access Article is licensed under a Creative Commons Attribution-Non Commercial 3.0 Unported Licence
 b,
Shamima Khanoma,
Md Kamal Hossain
b,
Shamima Khanoma,
Md Kamal Hossain