 Open Access Article
Micro flow injection analysis of leucomalachite green in fish muscle using modified henequen fibers as microfluidic channels
T. Alexandra Ferreira a,
Alfredo Guevara-Laraa,
M. Elena Paez-Hernandeza,
Alicia C. Mondragonb and
Jose A. Rodriguez
 *a
*a
aArea Academica de Quimica, Universidad Autonoma del Estado de Hidalgo, Mineral de la Reforma, Hidalgo, Mexico. E-mail: josear@uaeh.edu.mx
bLaboratorio de Higiene, Inspeccion y Control de Alimentos, Departamento de Química Analitica, Nutricion y Bromatologia, Facultad de Veterinaria, Universidad de Santiago de Compostela, 27002, Lugo, Spain
First published on 2nd November 2021
Abstract
In this work a simple and novel procedure for leucomalachite green determination based on micro flow injection analysis (μFIA) with amperometric detection is presented. The method involves the use of henequen modified fibers as microfluidic channels. The μFIA system proposed offers a simple, rapid, and low-cost alternative for the determination. Capillary and gravitational forces across the modified henequen fibers control the flow rate, eliminating the need for external pumps. This technique requires low reagent consumption and allows portability for in situ measurements. The flow system is described, and the operational variables were studied and optimized using a Taguchi parameters design to increase analytical sensitivity. Under optimal conditions a limit of detection of 1.16 μg kg−1 was achieved with adequate repeatability and reproducibility (expressed as %RSD <5.0%, n = 3, n = 9 respectively) in all cases. The effect of interfering species and the accuracy of the method were also investigated. The proposed methodology was validated and applied to determine LMG in tilapia muscle samples.
Introduction
Leucomalachite green (LMG) is a colourless, nonpolar compound considered potentially carcinogenic and mutagenic. The presence of LMG in fish tissues is the result of the metabolic reduction of malachite green (MG), a triarylmethane dye that has been widely used in aquaculture as a fungicide, bactericide, and antiseptic. MG, when administered to fish, is absorbed, and metabolized to its leuco form. LMG is then deposited in muscles and adipose tissue.1–3 Currently, the use of MG in aquaculture has been banned in some countries, as it has genotoxic and carcinogenic properties.4 However, it is still used due to its low cost, good efficiency, and availability, so it is possible to find residues of MG and LMG in aquatic products, which represents a risk for the consumer. International organizations recommend that techniques developed for the determination of LMG should detect concentrations of 2.0 μg kg−1.1The determination of MG and LMG has been described using methodologies based on electrochemical,5,6 immunological systems such as ELISA tests,7,8 spectrophotometric,9 liquid chromatography and capillary electrophoresis techniques with UV, fluorescence, or MS detection.10–13 Analytical procedures for LMG determination require expensive and sophisticated methods and intensive sample pretreatment.5
Flow based techniques are a simple alternative for the determination. This technique requires low reagent consumption, allows the determination of samples in a simple, fast, and versatile way and it requires low-cost instrumentation. Flow techniques can be coupled to different detectors, according to the analyte, such as electrochemical and spectroscopic detection.14–18 Electrochemical detection is based on the electric currents generated from oxidative or reductive reactions on the electrode surface involving the analyte. Therefore, the flow system design is of great importance.16,19 In continuous determinations, the pulsation of the pump causes the presence of background noise in the analytical signal. Then the flow pattern must be accurately controlled to obtain reproducible measurements and with greater analytical sensitivity.
Micro flow injection analysis (μFIA) generally uses micro pumps or external pumps to promote flow rates in the order of nL min−1 to μL min−1 with minimal fluctuation. In these systems it is possible to perform the sample injection, detection, and flow control in a small device which increases the cost. However, in recent years the possibility of using passive pumps has been evaluated, these pumps rely mainly on capillary forces, gravitational forces, and surface tension to transport the fluid through a microfluidic channel.14
The use of cellulose paper for the design of micro channels has been described as passive pump,14 where the flow is possible due to capillarity, requiring the creation of hydrophobic barriers to delimit the direction of the fluid through the channel; however, paper-based systems can show a decrease in the mechanical strength of the channel once the fluid phase goes through the cellulose phase.
Natural fibers present greater resistance to humidity and flexibility when they are dry or wet. Cotton has been used as microfluidic channel for the determination of pharmaceutical products and phenol in water.20–23 However, cotton fibers are short and fragile and must be braided to improve its mechanical properties being used as threads.
Natural Agave fibers contain series of microchannels joined by microfibrils of hemicellulose and lignin. As consequence the porous structure allows an adequate flow transport through the fiber by capillarity.13,24 Henequen fiber is obtained from Agave fourcroydes leaves, one of the main Agave species produced in south-eastern Mexico. These fibers have a length of up to approximately 160 cm and are one of the most important natural hard fibers, so they can be used without the need to be braided. However, it has been studied that dyes can be heavily adsorbed onto a cellulose surface.25 Thus, chemical modification of the fiber with copper phthalocyanine is proposed. This compound reacts with hydroxyl groups on the cellulose to form a stable ether linkage making the surface hydrophobic avoiding the LMG from adhering irreversibly onto the surface.26,27 This work proposes the use of modified henequen fibers as microfluidic channel for LMG determination using amperometric detection.
Results and discussion
Henequen fiber characterization
Scanning Electron Microscopy (SEM) was used to study the morphological characteristics of the henequen fiber. The micrographs obtained show that natural henequen fibers contain series of microfibrils embedded in hemicellulose and lignin resulting in a porous structure as can be seen in Fig. 1a.20,28 After the dying process with copper phthalocyanine, a change in chemical and structural properties is observed. The chemical treatment of the fiber in an alkaline medium promotes the elimination of hemicellulose and lignin allowing the fibrillation and creation of capillary spaces in internal layers (Fig. 1b).29 Chemical modification causes an increase in the pore size which improves the capillarity of the fiber making more stable and adequate the electrolyte transport through the μFIA system.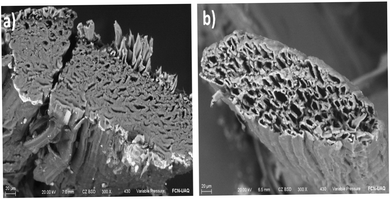 | ||
| Fig. 1 SEM micrographs showing the change in the size of the microchannels before and after the modification. (a) Natural henequen fiber (b) henequen fiber modified with copper phthalocyanine. | ||
Henequen fibers were characterized by FT-IR to identify the functional groups present at the surface and confirm LMG interaction (Fig. 2). A broad band between 3700 cm−1 and 2980 cm−1 corresponds to O–H stretching vibration of the hydroxyl groups in the cellulose. The bands between 2797 cm−1 and 2970 cm−1 are related to C–H stretching of alkyl groups in the aliphatic bonds of the cellulose, hemicellulose, and lignin. At around 1730 cm−1, a band is observed due to C![[double bond, length as m-dash]](https://www.rsc.org/images/entities/char_e001.gif) O stretching of ester groups present in the hemicellulose and lignin, and a characteristic band at 1009 cm−1 is associated to the lignocellulose hydrogens.30 After the fiber modification with the copper phthalocyanine the –OH peak became weaker, since this group is expected to form an ether linkage with the phthalocyanine, also new bands at 2130 and 1460 cm−1 are observed indicating the presence of tertiary amine groups. Once the fiber was in contact with a LMG solution, the band at 1730 cm−1 disappears suggesting that –C
O stretching of ester groups present in the hemicellulose and lignin, and a characteristic band at 1009 cm−1 is associated to the lignocellulose hydrogens.30 After the fiber modification with the copper phthalocyanine the –OH peak became weaker, since this group is expected to form an ether linkage with the phthalocyanine, also new bands at 2130 and 1460 cm−1 are observed indicating the presence of tertiary amine groups. Once the fiber was in contact with a LMG solution, the band at 1730 cm−1 disappears suggesting that –C![[double bond, length as m-dash]](https://www.rsc.org/images/entities/char_e001.gif) O group participates on the LMG retention on the fiber surface.
O group participates on the LMG retention on the fiber surface.
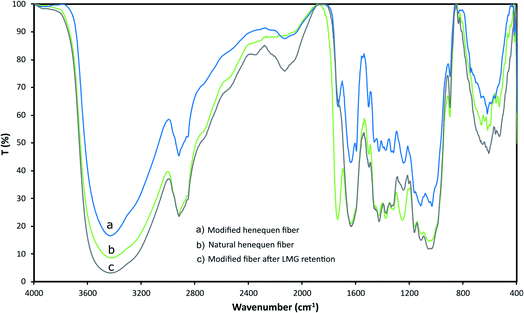 | ||
| Fig. 2 IR spectra for (a) modified henequen fiber, (b) natural henequen fiber, (c) modified fiber after LMG retention (IR were recorded in KBr). | ||
Electrochemical characterization
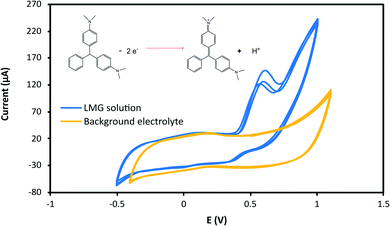
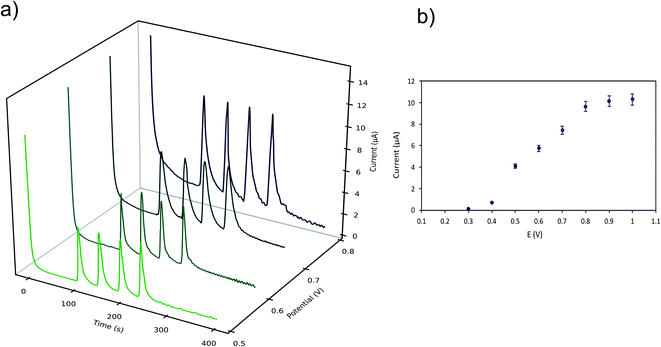
The effect of the applied potential was evaluated considering LMG oxidation potential obtained from the cyclic voltammogram. Fig. 3 shows the cyclic voltammograms at 25 mV s−1 for the buffer solution (background solution: 50 mM ammonium acetate, ACN (40% v/v), Tween-80 (1% v/v) and pH = 4.00 ± 0.02) and the LMG solution. When using a wide potential window, the appearance of anodic peaks corresponding to the electrolyte is observed. For this reason, the potential window selected was −0.5 to 1.0 V. For the analyte solution, as can be seen, LMG exhibits an anodic peak at 0.63 V (vs. Ag); also, no reduction peak is observed, suggesting that the electrode process of LMG is irreversible. There are few references in the bibliography towards the electrochemical determination of LMG, Ngamukot et al. describe this process using a phosphate buffer solution at pH = 2.0, where an anodic peak is observed at 0.9 V (vs. Ag/AgCl, scan rate 25 mV s−1).31The hydrodynamic behaviour of LMG was studied to obtain the optimal potential for the amperometric detection in the μFIA system. The oxidation potentials evaluated were 0.3 to 0.8 V vs. Ag reference electrode. Fig. 4a shows the amperometric determination of LMG on the μFIA system using different oxidation potentials. The hydrodynamic voltammetric I–E curve obtained for a 3 μL injection of LMG solution exhibited a sigmoidal shape (Fig. 4b). The optimal potential for the determination was selected at the point where the current remains steady which is 0.8 V.
Micro flow injection analysis (μFIA)
Using the oxidation potential selected, the experimental parameters of the μFIA system were evaluated and optimized. The μFIA analysis is mainly influenced for experimental parameters that are related to flow stability and velocity. These parameters are the microfluidic channel size (number of fibers), the distance between the injection point and the detection zone, the height of the system and the injection volume. Optimization of those parameters was carried out to ensure a stable and constant flow, and thus, reproducible measurements with good analytical sensitivity. For the optimization, a Taguchi parameter design was selected with an orthogonal array L9 (34), the control factors and their corresponding settings were chosen according to preliminary experiments and are shown in Table 1. The analytical response evaluated was the peak current (μA) of LMG oxidation using a concentration of 5 mM.| Experiment | Factors and levels | Height (μA) | |||
|---|---|---|---|---|---|
| Number of glass plates | Number of fibers | Injection distance (mm) | Sample volume (μL) | ||
| 1 | 14 | 9 | 0.50 | 1.0 | 5.11 |
| 2 | 14 | 10 | 0.75 | 2.0 | 16.59 |
| 3 | 14 | 11 | 1.00 | 3.0 | 26.93 |
| 4 | 15 | 9 | 0.75 | 3.0 | 8.30 |
| 5 | 15 | 10 | 1.00 | 1.0 | 10.43 |
| 6 | 15 | 11 | 0.50 | 2.0 | 13.32 |
| 7 | 16 | 9 | 1.00 | 2.0 | 5.40 |
| 8 | 16 | 10 | 0.50 | 3.0 | 20.15 |
| 9 | 16 | 11 | 0.75 | 1.0 | 3.74 |
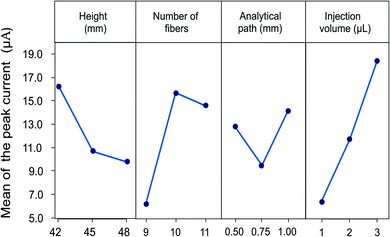
The flow speed obtained in the system depends directly on the height of the device, since the gravity force plays an important role in the transport of the fluid through the microfluidic channel. In the designed system height can be modified with the number of glass plates between the inlet and outlet reservoirs for the carrier solution. This height difference facilitates the transport of the fluid in the capillary since the fluid is siphoned into the fibers as a result of the hydrostatic pressure. Height differences from 15 to 48 mm were evaluated in preliminary experiments. An increase in the current of the analytical signal and a lower dispersion of the sample are observed with increasing the height, allowing the obtention of more defined signals. Therefore, height differences from 42 to 48 mm were evaluated for the optimization (14, 15 and 16 glass plates). The optimal response was obtained using 14 glass plates corresponding to 42 mm since this flow rate allows a low dispersion and an adequate contact of the sample with the electrode surface.
The second parameter evaluated was the number of fibers since the size of the microfluidic channel depends on this. An interval of 9 to 11 fibers arranged in parallel was considered to ensure the fluid has contact with the surface of the electrode entirely. The flux is improved by increasing the number of fibers, favouring the passage of the carrier solution through the detector, and ensuring adequate contact between the analyte and the electrode surface, thus, an improvement in the analytical response is observed. However, a high number of fibers represents an important increase in the flow and a greater dilution of the sample, related to a decrease in the height of the signal. A maximum current value was obtained for devices constructed with 10 fibers.
Parameters related with sample injection were also considered. The first refers to the distance between the sample injection point to the detection zone. In order to evaluate the effect of the analytical path the distance was evaluated from 5 to 20 mm. The results show that when increasing the distance after 10 mm, a decrease in the analytical signal and a broadening are observed, due to a dispersion effect of the sample in the microfluidic channel when increasing the length of the analytical path. On the other hand, when the distance is less than 10 mm a lack of repeatability is shown in the results due to the proximity of the detection zone. Therefore, an analytical path of 10 mm was selected as the optimal distance.
Finally, the effect of the sample volume was included. Volumes from 1.0 to 5.0 μL were evaluated in previous experiments. The increase in the injection volume allows to obtain an increase in the analytical response, caused by a lower dispersion of the central area of the sample.14 However, volumes greater than 3.0 μL produce saturation of the fiber and sample loss, thus diminishing the response current. For this reason, the volumes considered for the experimental design were 1.0 to 3.0 μL.
All experiments were performed in triplicate and the measurements were carried out using a LMG solution 5.0 mM. The effects of the control factors on the mean signal are shown in Fig. 5. The combination of experimental parameters allowing the highest peak current was height of the device of 42 mm (14 glass plates), 10 fibers for the microfluidic channel, 10 mm analytical path length and injection volume of 3.0 μL.
Methodology validation
Once the device configuration was optimized for LMG determination the analytical methodology was validated by determining the analytical parameters, precision, and recovery. The proposed method was applied to the determination of LMG in tilapia muscle samples. Standard solutions and spiked tilapia samples were employed to construct the calibration lines in a concentration interval of 0.082–8.2623 μg kg−1. The peak height of the analytical response was measured in triplicate using the proposed methodology. Limit of detection (LOD) and limit of quantification (LOQ) were calculated for a signal-to-noise ratio of 3.0 and 10.0 respectively according to the IUPAC criteria.32 LODs obtained for LMG using the standard solutions and the spiked samples were 0.94 and 1.16 μg kg−1 with analytical sensitivities (b1 ± Sb1) of 0.0787 ± 0.0038 and 0.0810 ± 0.0044 μA kg μg−1 respectively. The calibration lines present intercept values (b0 ± Sb0) of 0.0133 ± 0.0156 and 0.0170 ± 0.014 μA for LMG.In Fig. 6 can be appreciated that no significant matrix effect was observed comparing the slope in both calibration lines. Therefore, the direct calibration method was followed for LMG determination without the need of sample pre-treatment.
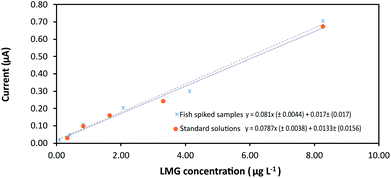 | ||
| Fig. 6 Calibration plot of LMG. Comparison of the analytical sensitivity (slope) using standard solutions and fish spiked samples. Linear interval 0.082–8.262 μg kg−1. | ||
The methodology precision was measured as repeatability and reproducibility in terms of relative standard deviation (%RSD). The result in all cases was less than 5.0% RSD by means of inter- and intra-day repetitions indicating that this method shows adequate results for the analysis of real samples.
The selectivity of the method was also assessed considering species usually found in fish muscle.33 A fish sample spiked with a LMG concentration of 4.13 μg kg−1 was evaluated containing the interfering specie. The concentrations of interfering species were considered taking as a starting point 4.13 μg kg−1 and making consecutive additions until a change in the height of the signal was observed. A slight change in the analytical signal was observed at the following concentrations: ascorbic acid (2.21 mg kg−1, 94.81%), caffeine (2.43 mg kg−1, 92.02%), casein (650.00 mg kg−1, 97.98%), uric acid (500.00 mg kg−1, 97.74%) and vitamin E (5.00 g kg−1, 98.30%). Casein, uric acid, and vitamin E show very little interference at high concentrations because of their low solubility in the extraction medium used in sample pre-treatment.
The decrease in the analytical signal is less than 10%. Therefore, the proposed method is adequate to the analysis of LMG in tilapia muscle samples with good selectivity.
LMG determination in tilapia samples
The proposed method was applied to the analysis of LMG in ten commercially available tilapia samples obtained from local supermarkets. The direct calibration method was followed. Measurements of the analytical signal (current) were obtained in triplicate for each sample and the average value was used for the determination of the concentration (see Table 2).| Sample | μFIA method (μg kg−1) | HPLC method (μg kg−1) |
|---|---|---|
| 1 | 5.33 | 5.41 |
| 2 | 6.46 | 7.00 |
| 3 | 4.55 | 4.82 |
| 4 | 5.07 | 5.57 |
| 5 | 5.31 | 5.40 |
| 6 | 7.10 | 7.56 |
| 7 | 11.18 | 11.08 |
| 8 | 4.89 | 5.11 |
| 9 | 3.87 | 2.92 |
| 10 | 6.03 | 5.63 |
The accuracy of the method was assessed comparing the results obtained for the fish samples using the proposed methodology with those obtained using the FDA suggest methodology (HPLC).34 The results obtained with both methods were compared using a paired student's t-test (n = 10). The value of t calculated (0.4874) does not exceed t critical value (1.8331, α = 0.05, d. f. = 9), thus, there are no significant difference between the results obtained by both methods. In this sense, the proposed method is an adequate alternative for LMG determination in tilapia samples.
In comparison with conventional methodologies, such as HPLC, the proposed method offers an adequate and simple alternative for LMG determination in fish samples without the need of intensive sample pre-treatment. This methodology allows to reduce the consumption of organic solvents in the pre-treatment and analysis stages, in addition, the fiber can be easily degraded reducing secondary contamination. This is the first report of LMG amperometric determination using a natural fiber as micro channel in a μ-FIA system.
Experimental
Reagents and solutions
All the solutions were prepared using deionized water (Milli-Q Merck, Millipore Darmstadt, Hesse, Germany) with a resistivity of 18.2 MΩ cm or greater. All chemicals used were analytical grade and used without further purification. Leucomalachite green (LMG), malachite green (MG), NaHCO3, glacial acetic acid, NaCl and ACN were purchased from Sigma Aldrich (St. Louis Missouri, USA). Copper phthalocyanine dye was obtained from Santa Cruz chemicals (Huissen, Gelderland, Netherlands), ammonium acetate and Tween-80 were purchased from J.T. Baker (Phillipsburg, New Jersey, USA).Working standard solutions (5.0 mM) were prepared by dissolving the leucomalachite green in a buffer solution. The buffer solution consisted of 50 mM ammonium acetate, ACN (40% v/v), Tween-80 (1% v/v) as surfactant and the pH value was adjusted with acetic acid to pH = 4.0 ± 0.02. The carrier solution used for μFIA experiments consisted of 50 mM ammonium acetate, MeOH (20% v/v), Tween-80 (3% v/v) and the pH value was adjusted to 4.00 ± 0.02 with acetic acid.
Instrumentation
Micrographs of the henequen fibers were obtained using scanning electron microscopy (SEM Carl Zeiss, model EVO-50, Oberkochen, Germany). IR spectra of the fibers were recorded in KBr pellets in a GX PerkinElmer 2000FT-IR spectrophotometer (Waltham, Massachusetts, U.S.A.). Amperometric detection was carried out in a Bipotentiostat μStat 200 by Dropsens (Asturias, Spain) controlled with a DropView 1.3 software for Windows. Cyclic voltammetry studies were performed using a potentiostat galvanostat Autolab PGSTAT 302N by Metrohm AG (Ionenstrasse, Herisau, Switzerland). In all the experiments described, the detector used is a carbon screen printed electrode (SPE, Dropsens, model DRP-110) consisting of carbon as work and auxiliar electrodes and Ag as pseudo-reference electrode, the SPE was used without modifications. A pH/ion analyzer Oakton pH510 series (Vernon Hilld, Il, USA) was used to adjust pH of the buffer solutions to 0.01 pH units.Henequen fiber modification
Henequen fiber modification procedure was carried out to improve porosity and to avoid the LMG from adhering to the fiber surface. Briefly, natural henequen fibers were immersed in a solution prepared by dissolving 1.0 g of copper phthalocyanine and 9.0 g of NaCl in 150 mL of deionized water. The mixture was stirred at 300 rpm and heated at 70 °C for 15 minutes before adding 7.5 g of NaHCO3. The dying procedure was continued for 4 more hours under the same stirring and temperature conditions. After this time, the fibers were left in the solution for 24 hours at room temperature and without stirring. Once the dyeing process was completed, the supernatant was decantated and the fibers were washed with deionized water (50 mL × 4) and EtOH (50 mL × 4) or until a colourless solution was obtained. The fibers were dried and stored before their use.13Electrochemical characterization
Cyclic voltammetry was performed to select the oxidation potential of LMG in the buffer solution. In this case, 10 mL of the buffer solution (blank) and 10 mL of the LMG solution (1.0 mM) were evaluated using a carbon SPE (vs. Ag). Cyclic voltammograms were recorded in an electrochemical window of −0.6 V to 1.2 V at scan rate of 0.025 V s−1.The hydrodynamic voltammetric I–E curve for LMG was obtained evaluating anodic potentials from 0.3 to 0.8 V vs. Ag reference electrode in the μFIA system. The injection volume used was 3 μL of LMG 1.0 mM solution with a flow rate of 0.1 mL min−1 (height of the device: 42 mm).
Micro flow injection analysis (μFIA) device
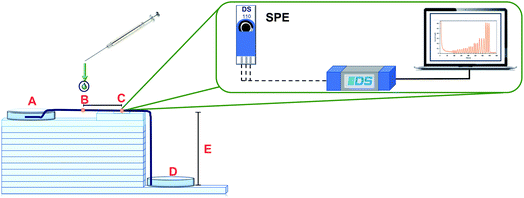
The configuration of the μFIA device is shown in Fig. 7. The carrier solution flows from the inlet reservoir (A), passes through the injection point (B), where 3.0 μL of the sample are introduced, and through the detection zone (C), where a screen-printed electrode is placed. After the determination, the solution goes to the outlet reservoir (D). In this system ten henequen fibers were used to act like a microfluidic channel to transport the fluid through the system. Capillary and gravitational forces across the modified henequen fibers control the flow rate. Fourteen glass plates with a thickness of 5 mm each were used as support (E) between the inlet and outlet reservoirs eliminating the need of external pumps. Using these conditions, a flow rate of 100 μL min−1 was obtained. In order to increase analytical sensitivity operational parameters such as: height, number of fibers in the microfluidic channel, sample injection distance to the detection zone and sample volume were evaluated and optimized using a Taguchi experimental design. Amperometric recordings were obtained using a potential of 0.8 V (vs. Ag).Once the determination is completed the fibers can be used again after being rinsed with the carrier solution. Using the methodology proposed, the flow obtained has laminar behaviour, eliminating the presence of background noise in the analytical signal and thus, increasing sensitivity.
Method validation
Once the experimental conditions were optimized, the analytical parameters were obtained using calibration lines with standard solutions and spiked samples. The peak height was measured in triplicate. The limit of detection (LOD) and the limit of quantification (LOQ) were calculated for a signal-to-noise ratio of 3 and 10 according to the IUPAC criteria.32 Precision was evaluated by means of repeatability and reproducibility, measuring at three concentration levels (0.83, 4.13, 6.20 μg kg−1) in triplicate for three days. Results were determined as relative standard deviation (%RSD). Finally, the methodology was applied to the analysis of tilapia muscle samples.Tilapia muscle tissues was used as sample, and it was purchased from a local supermarket. Muscle tissues were homogenized with a food blender and frozen until analysis. 2.0 g of blank tissue samples were spiked with LMG. The samples were added with 5.0 ± 0.1 mL of ACN to precipitate the proteins present in the matrix. The mixture was vortex-mixed in a screw-capped polypropylene tube for 2 minutes and the liquid phase was collected and analysed.
Conclusions
In this work a simple and feasible methodology for the determination of LMG in fish muscle samples was designed and validated. The methodology consists of the use of modified vegetable fibers as microfluidic channel in a μFIA device. Henequen fiber modification procedure was carried out to improve porosity and to avoid the LMG from adhering to the fiber surface. It was demonstrated that henequen fibers allow the transport of fluids by capillarity, without the need to be braided due to its length and microfibrils structure. The proposed method is an easy alternative for LMG determination compared to conventional methodologies, such as HPLC.Operational conditions such as system height, number of fibers, analytical path and injection volume were evaluated and optimized using a Taguchi parameters design. The optimal conditions for the determination were: 14 glass plates (42 mm), 10 fibers, injection distance of 10 mm and sample volume of 3.0 μL. Under optimal conditions the analytical parameters were obtained. The methodology presents a LOD of 1.16 μg kg−1 and a LOQ of 3.86 μg kg−1 in the fish extract without the need to carry out a previous treatment of the sample, since the presence of matrix effect is not observed. The methodology allowed the analysis of samples with good repeatability and reproducibility, since the % RSD is less than 5.0% in all cases.
Author contributions
T. Alexandra Ferreira: writing–original draft preparation and investigation. Alfredo Guevara-Lara: methodology, investigation. M. Elena Paez-Hernandez: methodology, investigation. Alicia C. Mondragon: methodology, investigation. Jose A. Rodriguez: conceptualization, supervision, writing–reviewing and editing.Conflicts of interest
There are no conflicts to declare.Notes and references
- W. S. Wan Ngah, N. F. M. Ariff, A. Hashim and M. A. K. M. Hanafiah, Clean: Soil, Air, Water, 2010, 38(4), 394–400 Search PubMed.
- Y. Sharma and B. Singh, Open Environ. Pollut. Toxicol. J., 2009, 1, 74–78 CAS.
- M. J. Martínez Bueno, S. Herrera, A. Uclés, A. Agüera, M. D. Hernando, O. Shimelis and A. R. Fernández-Alba, Anal. Chim. Acta, 2010, 665(1), 47–54 CrossRef PubMed.
- A. A. Bergwerff and P. Scherpenisse, J. Chromatogr. B: Anal. Technol. Biomed. Life Sci., 2003, 788(2), 351–359 CrossRef CAS.
- Y. Zhou, X. Li, Z. Pan, B. Ye and M. Xu, Food Anal. Methods, 2019, 12, 1246–1254 CrossRef.
- J. Hou, F. Bei, M. Wang and S. Ai, J. Appl. Electrochem., 2013, 43(7), 689–696 CrossRef CAS.
- N. Bilandžić, I. Varenina, B. S. Kolanović, D. Oraić and S. Zrnčić, Food Control, 2012, 26(2), 393–396 CrossRef.
- G. Singh, T. Koerner, J. M. Gelinas, M. Abbott, B. Brady, A. C. Huet and S. Benrejeb Godefroy, Food Addit. Contam., Part A, 2011, 28(6), 731–739 CrossRef CAS PubMed.
- K. Farhadi, R. Maleki, N. M. Nezhad and N. Samadi, Spectrosc. Lett., 2010, 43(2), 101–107 CrossRef CAS.
- Y. Tao, D. Chen, X. Chao, H. Yu, P. Yuanhu, Z. Liu and Z. Yuan, Food Control, 2011, 22(8), 1246–1252 CrossRef CAS.
- L. Chen, Y. Lu, S. Li, X. Lin, Z. Xu and Z. Dai, Food Chem., 2013, 141(2), 1383–1389 CrossRef CAS PubMed.
- C. Long, Z. Mai, Y. Yang, B. Zhu, X. Xu, L. Lu and X. Zou, J. Chromatogr. A, 2009, 1216(12), 2275–2281 CrossRef CAS PubMed.
- T. A. Ferreira, I. S. Ibarra, M. L. S. Silva, J. M. Miranda and J. A. Rodriguez, Microchem. J., 2020, 157, 104941–104947 Search PubMed.
- D. Agustini, M. F. Bergamini and L. H. Marcolino-Junior, Anal. Chim. Acta, 2017, 951, 108–115 Search PubMed.
- P. Ngamukot, T. Charoenraks, O. Chailapakul, S. Motomizu and S. Chuanuwatanakul, Anal. Sci., 2006, 22(1), 111–116 Search PubMed.
- B. Karlberg and G. E. Pacey, Techniques and instrumentation in analytical chemistry, Elsevier Science, first edn, 1989, chapter 4: detectors in FIA, vol. 10, pp. 66–83 Search PubMed.
- S. Lee, J. Choi, L. Chen, B. Park, J. B. Kyong, G. H. Seong and K. H. Lee, Anal. Chim. Acta, 2007, 590(2), 139–144 Search PubMed.
- J. Zhu, M. Qin, S. Liu, Z. Liu, J. Yang and X. Hu, Spectrochim. Acta, Part A, 2014, 130, 90–95 Search PubMed.
- A. J. Bard Electrochemical Methods Fundamentals and Applications, John Wiley and Sons, New York, 2001 Search PubMed.
- D. Agustini, M. F. Bergamini and L. H. Marcolino-Junior, Lab Chip, 2016, 16(2), 345–352 Search PubMed.
- D. Agustini, M. F. Bergamini and L. H. Marcolino-Junior, J. Chem. Educ., 2018, 95(8), 1411–1414 Search PubMed.
- F. R. Caetano, E. A. Carneiro, D. Agustini, L. C. S. Figueiredo-Filho, C. E. Banks, M. F. Bergamini and L. H. Marcolino-Junior, Biosens. Bioelectron., 2018, 99, 382–388 Search PubMed.
- L. M. Ochiai, D. Agustini, L. C. S. Figueiredo-Filho, C. E. Banks, L. H. Marcolino-Junior and M. F. Bergamini, Sens. Actuators, B, 2017, 241, 978–984 Search PubMed.
- M. N. Cazaurang-Martinez, P. J. Herrera-Franco, P. I. Gonzalez-Chi and M. Aguilar-Vega, J. Appl. Polym. Sci., 1991, 43(4), 749–756 Search PubMed.
- N. Buvaneswari and C. Kannan, J. Hazard. Mater., 2011, 189(1–2), 294–300 CrossRef CAS PubMed.
- H. Hayatsu, J. Chromatogr. A, 1992, 597(1–2), 37–56 CrossRef CAS.
- I. Safarik, E. Baldikova, M. Safarikova and K. Pospiskova, J. Ind. Text., 2018, 48(4), 761–771 CrossRef CAS.
- H. S. Lee, D. Cho and S. O. Han, Macromol. Res., 2008, 16(5), 411–417 CrossRef CAS.
- M. Vukcevic, A. Kalijadis, M. Radisic, B. Pejic, M. Kostic, Z. Lausevic and M. Lausevic, Chem. Eng. J., 2012, 211–212, 224–232 CrossRef CAS.
- A. Orue, A. Jauregi, C. Pena-Rodriguez, J. Labidi, A. Eceiza and A. Arbelaiz, Composites, Part B, 2015, 73, 132–138 CrossRef CAS.
- P. Ngamukot, T. Charoenraks, O. Chailapakul, S. Motomizu and S. Chuanuwatanakul, Anal. Sci., 2006, 22(1), 111–116 CrossRef CAS PubMed.
- J. Mocak, A. M. Bond, S. Mitchell and G. Scollary, Pure Appl. Chem., 1997, 69(2), 297–328 CAS.
- W. Huang, C. Yang, W. Qu and S. Zhang, Russ. J. Electrochem., 2008, 44(8), 946–951 CrossRef CAS.
- W. C. Andersen, S. B. Turnipseed and J. E. Roybal, Quantitative and confirmatory analyses of malachite green and leucomalachite green residues in fish and shrimp, Laboratory Information Bulletin 4363, U.S. Food and Drug Administration, Animal Drugs Research Center, https://www.fda.gov/food/laboratory-methods-food/laboratory-information-bulletin-lib-4363-malachite-green-and-leucomalachite-green-fish-and-shrimp, accessed April 2021 Search PubMed.
| This journal is © The Royal Society of Chemistry 2021 |

