 Open Access Article
Understanding liquid–liquid equilibria in binary mixtures of hydrocarbons with a thermally robust perarylphosphonium-based ionic liquid†
Santosh R. P. Bandlamudia,
Jimmie L. McGeheea,
Albaraa D. Mandoa,
Mohammad Soltanib,
C. Heath Turner c,
James H. Davis Jr
 b,
Kevin N. West
 a and
Brooks D. Rabideau
 *a
*a
aDepartment of Chemical & Biomolecular Engineering, The University of South Alabama, Mobile, Alabama 36688, USA. E-mail: brabideau@southalabama.edu; Fax: +1 251 461-1485; Tel: +1 251 460-7147
bDepartment of Chemistry, The University of South Alabama, Mobile, Alabama 36688, USA
cDepartment of Chemical & Biological Engineering, The University Alabama, Tuscaloosa, Alabama 35487, USA
First published on 22nd September 2021
Abstract
Binary mixtures of hydrocarbons and a thermally robust ionic liquid (IL) incorporating a perarylphosphonium-based cation are investigated experimentally and computationally. Experimentally, it is seen that excess toluene added to the IL forms two distinct liquid phases, an “ion-rich” phase of fixed composition and a phase that is nearly pure toluene. Conversely, n-heptane is observed to be essentially immiscible in the neat IL. Molecular dynamics simulations capture both of these behaviours. Furthermore, the simulated composition of the toluene-rich IL phase is within 10% of the experimentally determined composition. Additional simulations are performed on the binary mixtures of the IL and ten other small hydrocarbons having mixed aromatic/aliphatic character. It is found that hydrocarbons with a predominant aliphatic character are largely immiscible with the IL, while those with a predominant aromatic character readily mix with the IL. A detailed analysis of the structure and energetic changes that occur on mixing reveals the nature of the ion-rich phase. The simulations show a bicontinuous phase with hydrocarbon uptake akin to absorption and swelling by a porous absorbent. Aromatic hydrocarbons are driven into the neat IL via dispersion forces with the IL cations and, to a lesser extent, the IL anions. The ion–ion network expands to accommodate the hydrocarbons, yet maintains a core connective structure. At a certain loading, this network becomes stretched to its limit. The energetic penalty associated with breaking the core connective network outweighs the gain from new hydrocarbon–IL interactions, leaving additional hydrocarbons in the neat phase. The spatially alternating charge of the expanded IL network is shown to interact favourably with the stacked aromatic subphase, something not possible for aliphatic hydrocarbons.
1 Introduction
Separating aromatics such as benzene, toluene, ethylbenzene, and xylenes (BTEX) from linear chain aliphatic hydrocarbons (C4 to C10) is a major challenge in the petroleum industry. Similar boiling points and the formation of azeotropes make traditional techniques such as extractive distillation, azeotropic distillation, and liquid–liquid extraction only viable when the concentration of aromatic compounds is above 20 wt%.1 Below this concentration, no feasible process exists since the use of traditional solvents to recover the aromatics, although effective, results in additional steps and significant downstream processing costs.2Ionic liquids (ILs) have shown great promise in separating aromatics from hydrocarbon (HC) mixtures. Moreover, they have been the subject of a number of experimental and modeling studies.3–13 Many of these studies have focused on the effects of cation and anion structure on the extraction/separation of aromatic compounds from hydrocarbon mixtures.14–20 Certain ILs when mixed with aromatic compounds such as benzene, toluene, or xylenes in excess concentrations form two distinct liquid phases: an ion-rich phase and an almost pure aromatic phase.21–25 Furthermore, the ratio of aromatics to ion pairs in the ion-rich phase is surprisingly well-defined, and this behaviour is oftentimes referred to as the formation of liquid clathrates.26–28 This idea was further supported by the fact that these mixtures formed solids that included hydrocarbons trapped in cage-like structures.21 Nevertheless, there are a number of contrasting reports about which interactions play a major role in this behaviour. Some studies have indicated that π–π interactions between cations and aromatic compounds are essential.21,24 Others have noted the importance of ion–quadrupole interactions.29–31 Interestingly, it is found that formation depends on the strength of the cation–anion interaction and that aromatic solubility is inversely proportional to this strength.32–34 Additionally, interactions with the nonpolar domain of an IL are also likely to play a role23 since aromatic hydrocarbons are shown to be soluble in non-aromatic ILs.35,36 Likely each of these factors plays a role to some degree, however until a clearer picture emerges of the molecular interactions leading to this phenomena, it remains difficult to tune the structure for optimal control over separation.
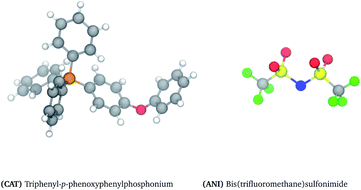
Another practical limitation of traditional ILs is their long-term stability at high temperatures. Contrary to common descriptions of ILs as being thermally stable, most begin to slowly decompose around 250 °C.37 The use phosphonium and sulfonium cations comprised of peraryl groups, however, have shown exceptional thermal stability, upwards of 300 °C for a period of 3 months.38–40 While many of these ILs do not melt below 100 °C, these mesothermal ILs have shown a lot of promise as heat transfer fluids, lubricants, solvents, and catalysts for high temperature reactions.41 Despite the confinement to thermally stable groups, innovative ways have been developed to expand this design space42–44 and even tune the melting point.45 This work focuses on triphenyl-p-phenoxyphenylphosphonium bistriflimide, shown in Fig. 1 and abbreviated hereafter as TPOP. TPOP shows a high affinity for aromatic compounds but not aliphatic compounds. This, combined with its high thermal stability and low volatility, makes it an ideal candidate for extractive separations of aromatics from hydrocarbon mixtures.46
In this work, molecular dynamics (MD) simulations are used to understand the molecular-level interactions that give rise to hydrocarbon solubility in TPOP, the thermally robust IL of Fig. 1. First, the molecular models are validated by comparing the simulated behaviour of a model aromatic and a model aliphatic with precise experimental liquid–liquid equilibria (LLE) measurements. Once the accuracy of the models are established, the study is broadened to include the solubility of a variety of different hydrocarbons (HC), shown in Fig. 2. These compounds were chosen to provide a range of different characteristics (e.g. variable alkyl tail lengths, polarity, quadrupole moments) that might provide different solvation behaviours. In practice, only two behaviours emerged. Molecules with dominant aromatic character formed an ion-rich mixture, while molecules with dominant aliphatic character remained relatively immiscible. The results were then analyzed in detail to characterize the underlying molecular structure of the ion-rich mixture, which is shown to be a bicontinuous phase. In the next few sections, we begin building a picture of this phase, its structure, and the molecular interactions that drive its formation.
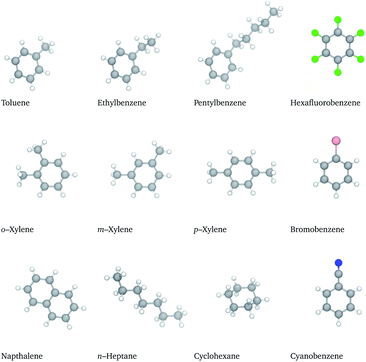 | ||
| Fig. 2 Structure and notation of the hydrocarbons. Atom colouring provided in caption of Fig. 1. | ||
2 Methods
2.1 Experimental details
2.2 Simulation details
Ionic liquid cations, anions, and hydrocarbons were modeled using the all-atom, fully flexible, generalized AMBER force field (GAFF).47 As outlined by GAFF, the Hartree–Fock method employing the 6-31G* basis set was used to generate electrostatic potentials in Gaussian 09 (v.09, revision E.01, Gaussian, inc, Wallingford, USA),48 while the point charges were fit to these electrostatic potentials using the restrained electrostatic procedure (RESP).49 All partial charges were scaled by 80% to account for polarizability effects. It was shown that GAFF accurately predicts thermodynamic and transport properties of ionic liquids when this scaling is used.50All of the simulations were performed with LAMMPS51 using periodic boundary conditions. A cutoff radius of 12 Å was used for all non-bonded interactions and the long-range electrostatics were handled using the particle–particle particle–mesh (pppm) method52 with a relative error in the forces of 1 × 10⁻⁴. Initial configurations were created by placing hydrocarbon molecules and IL pairs at a ratio of 70![[thin space (1/6-em)]](https://www.rsc.org/images/entities/char_2009.gif) :
:![[thin space (1/6-em)]](https://www.rsc.org/images/entities/char_2009.gif) 30 at separate ends of a 40 × 40 × 140 Å3 simulation box using PACKMOL.53 The system was first minimized by conjugate gradient method with a tolerance of 1 × 10⁻⁴. This was followed by equilibrating the system in the isothermal–isobaric (NPT) ensemble for 6 ns followed by a production run in the canonical ensemble (NVT) for an additional 180 ns. A Nosé–Hoover thermostat and barostat were used to maintain temperature at 400 K and 1 atm with damping factors of 100 and 1000 fs, respectively. Trajectories were saved every 25 ps for further analyses. A total of eighteen simulations were conducted; six for the Model validation section and twelve (one for each hydrocarbon type in Fig. 2) for the main miscibility study.
30 at separate ends of a 40 × 40 × 140 Å3 simulation box using PACKMOL.53 The system was first minimized by conjugate gradient method with a tolerance of 1 × 10⁻⁴. This was followed by equilibrating the system in the isothermal–isobaric (NPT) ensemble for 6 ns followed by a production run in the canonical ensemble (NVT) for an additional 180 ns. A Nosé–Hoover thermostat and barostat were used to maintain temperature at 400 K and 1 atm with damping factors of 100 and 1000 fs, respectively. Trajectories were saved every 25 ps for further analyses. A total of eighteen simulations were conducted; six for the Model validation section and twelve (one for each hydrocarbon type in Fig. 2) for the main miscibility study.
3 Results & discussion
3.1 Model validation
Prior to dissecting the structure and molecular interactions in the ion-rich phase, it is crucial to verify that the molecular models accurately capture this phenomena. Fig. 3 shows the experimental LLE measured for the model system (1) toluene/(2) TPOP NTf2.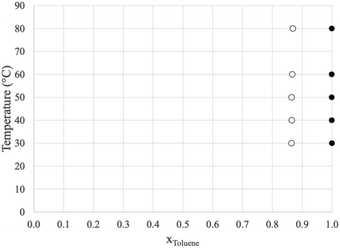 | ||
| Fig. 3 Liquid/liquid equilibrium of (1) toluene/(2) TPOP NTf2. The open circles represent the more dense, ion-rich phase and the closed circles represent the less dense, hydrocarbon phase. | ||
The more dense phase (open circles) has a toluene mole fraction of ∼0.86 and the less dense phase is nearly pure toluene. This indicates that for liquid extraction processes, very little of the ionic liquid would be lost in the hydrocarbon phase. Similar experiments were conducted using n-heptane, however, two liquid phases were not observed, only a single, nearly pure hydrocarbon phase in equilibrium with the pure solid ionic compound. The data for both systems are shown in Tables 1 and 2.
| T (°C) | Liquid phase | |
|---|---|---|
| x 1 | ± u | |
| 30.0 | 0.9982 | 0.0001 |
| 40.0 | 0.9986 | 0.0009 |
| 50.0 | 0.9991 | 0.0009 |
| 60.0 | 1.000 | 0.002 |
| 70.0 | 0.999 | 0.002 |
| 80.0 | 1.000 | 0.002 |
To determine the suitability of the force fields, simulations were performed that would help quantify the solubility of toluene and the relative insolubility of n-heptane in the IL. Hydrocarbon to IL ratios were chosen such that the former was in excess as determined from the experimental measurements, favouring the formation of a second liquid phase. An elongated box was used, assisting in the establishment of a stable and planar liquid–liquid interface. It was suspected that the dynamics of the systems might be diffusion limited. To alleviate this, three different initial states were used for each of the two hydrocarbon systems. The first state consisted of two neat phases in contact, the second state consisted of a neat hydrocarbon phase in contact with a presaturated ion-rich phase (∼86 mol%), and the third state consisted of a fully mixed system. This totaled six starting configurations, two for each of the hydrocarbon systems, with each run as an independent simulation.
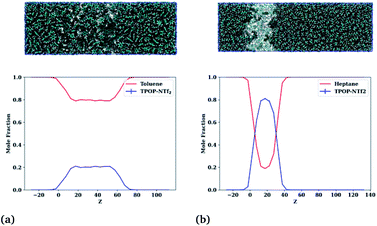
After approximately 60 ns, each of the three initial configurations evolved to very similar states for each of the respective hydrocarbon system. The mole fractions of each component were calculated in Z-axial cross-sections and averaged over the last 30 ns. Typical profiles of the toluene–IL and n-heptane–IL systems are shown in Fig. 4.
The final profiles of all six starting configurations are provided in Fig. S1.† Importantly, the toluene–IL system, shown in Fig. 4(a), forms two liquid phases, a pure toluene phase and an ion-rich phase. The n-heptane–IL system, shown in Fig. 4(b), remains largely separated as a pure n-heptane phase and a concentrated IL phase. Furthermore, the ion-rich phase is shown to be 77 mol% toluene, relatively close to the 86 mol% determined from the experiments. Thus, reasonable quantitative agreement exists between the simulations and the experiments. Importantly, the models capture the formation of the ion-rich phase, which is explored further in the next section.
3.2 Miscibility studies
With confidence that the models capture this phenomena, the miscibility of other small hydrocarbons are examined. Initial configurations were constructed with both constituents as two neat phases in contact. Since the primary focus is to understand the nature of the ion-rich phase, the hydrocarbon![[thin space (1/6-em)]](https://www.rsc.org/images/entities/char_2009.gif) :
:![[thin space (1/6-em)]](https://www.rsc.org/images/entities/char_2009.gif) IL was chosen as 70
IL was chosen as 70![[thin space (1/6-em)]](https://www.rsc.org/images/entities/char_2009.gif) :
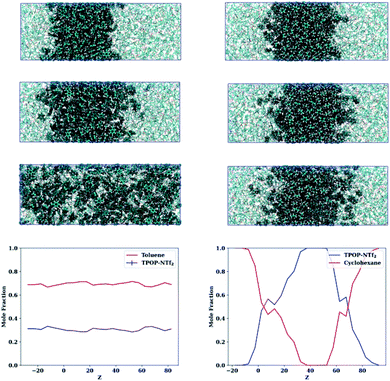
:![[thin space (1/6-em)]](https://www.rsc.org/images/entities/char_2009.gif) 30, anticipated to be just below the saturation limit. This ratio helps in the formation of a single ion-rich phase very near the saturation limit, facilitating further structural analyses. Simulations were run for 186 ns, sufficient to achieve equilibrium, and the mole fractions in axial cross-sections calculated and then averaged over the last 30 ns. Snapshots showing the evolution of the two typical hydrocarbon behaviours and the final profile are provided in Fig. 5.
30, anticipated to be just below the saturation limit. This ratio helps in the formation of a single ion-rich phase very near the saturation limit, facilitating further structural analyses. Simulations were run for 186 ns, sufficient to achieve equilibrium, and the mole fractions in axial cross-sections calculated and then averaged over the last 30 ns. Snapshots showing the evolution of the two typical hydrocarbon behaviours and the final profile are provided in Fig. 5.
The left column shows snapshots of the toluene–IL mixture after (top to bottom) 0, 6, and 186 ns, eventually displaying full miscibility at the selected composition. Similarly, the right column shows the cyclohexane–IL mixture at these same times, though here cyclohexane remains separate from the IL with a slight degree of interfacial mixing. Profiles for all of the compounds along with Z-resolved standard deviations and standard uncertainties are provided in Fig. S2–S4† and show that toluene, ethylbenzene, hexafluorobenzene, napthalene, m-xylene, o-xylene, p-xylene, bromobenzene, and cyanobenzene behave like Fig. 5 (left column) while cyclohexane, n-heptane, and pentylbenzene behave like Fig. 5 (right column). Note that the compounds with dominant aromatic character are fully miscible, while those with dominant aliphatic character remain essentially immiscible. Of these hydrocarbons, pentylbenzene is the only aromatic compound that remains immiscible, likely attributable to its long alkyl tail and resultant aliphatic character. In the next section we take a look at the changes in liquid structure that accompany the uptake of hydrocarbons by the ionic liquid.
3.3 Radial distribution functions
For a better understanding of the liquid structure in the ion-rich phases, site–site radial distribution functions (rdf) were constructed between the cations (CAT), the anions (ANI), and the hydrocarbons (HC). The sites used for this were the phosphorous atom of the cation, the nitrogen atom of the anion, and the center of mass of each hydrocarbon. These functions are displayed in Fig. 6. Note that the CAT–ANI, CAT–CAT and ANI–ANI rdfs of all of the mixtures are quite similar and deviate only slightly from that of the neat IL. In each case, the CAT–ANI peak is located at 7.5 Å with shoulders around 6.4 Å and 8.9 Å. Importantly, the peak heights of the binary mixtures are all noticeably higher than the neat IL, indicating a preservation of the alternating-charge network. The CAT–CAT rdfs display a distinct, sharp peak around 6 Å in the presence of the hydrocarbons. Notice that all of these mixtures lack some of the distribution between 6 and 7.5 Å, which is distinctly present in the neat IL. This represents a separation of the cations at close distances due to the presence of the hydrocarbons, one that occurs without a significant disruption of the alternating-charge network. Moreover, the peak at 12.5 Å is shifted outward relative to the neat IL, indicating a straightening of the network. Similarly, the ANI–ANI rdfs are shifted outward by 2 Å in the presence of hydrocarbons, again indicative of a straightened network.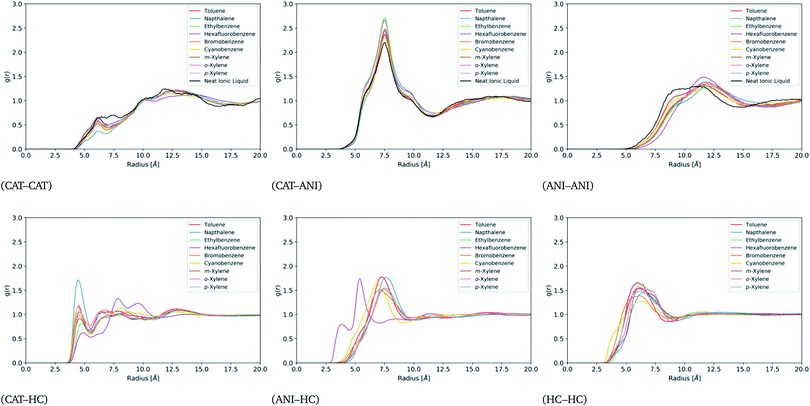 | ||
| Fig. 6 Site–site radial distribution functions between the cation, anion, and hydrocarbons for all miscible systems. | ||
Apart from hexafluorobenzene, all the other hydrocarbons show distinctive peaks in the CAT–HC and ANI–HC rdfs around 4.5 Å and 7.5 Å, respectively. The intensity of the CAT–napthalene relative to the other hydrocarbons suggests stronger localization. For hexafluorobenzene, the CAT–HC rdf shows a significantly reduced peak at 4.5 Å and much stronger peaks at 8 Å and 9.8 Å. Similarly, hexafluorobenzene's ANI–HC peak appears at 5.5 Å instead of 7.5 Å. Together, this suggests that the orientation of hexafluorobenzene in the IL network is reversed compared to the other hydrocarbons. This flipped orientation is clearly visible in the trajectories (see Fig. S13†) and likely a direct result of its flipped quadrupole moment. More precisely, the components of its quadrupole moment tensor have a flipped sign relative to the quadrupole moment tensor of the other hydrocarbons, which could be visualized as more of an oblate ellipsoid as opposed to a prolate ellipsoid.
Finally, note that all of the hydrocarbons display an HC–HC peak at around 5.8 Å, which does not deviate substantially from that of the neat hydrocarbon phases as shown in Fig. S5.† This indicates persistent contact between hydrocarbons while within the ion-rich phase. If each molecule were fully enclosed by an ionic cage one might expect as notable difference in the HC–HC peaks from the neat simulations. Taken together, the six plots of Fig. 6 provide a picture of an expanded IL network that is able to accommodate hydrocarbons without full separation. Additional values for the excess volumes of mixing are provided for each of the compounds in Table S1.†
3.4 Spatial distribution functions
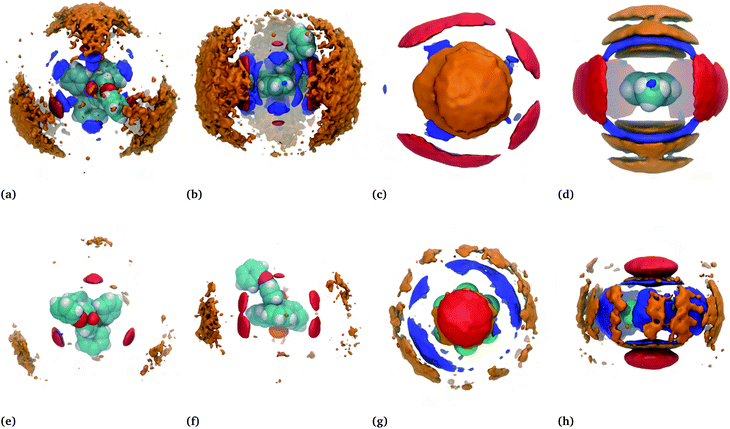
For a better view of the local molecular arrangements, spatial distribution functions (SDFs) around the cation and the hydrocarbon were generated. SDFs show the probability of finding a specific atom in three-dimensional space around a given molecule. The SDFs of the toluene–IL system and the hexafluorobenzene–IL system are displayed in Fig. 7(a–d) and (e–h), respectively.For the neat IL (not shown),43 there is strong localization of the anions near each of the four tetrahedral pits around the cation's phosphorous center and weaker localization at the distal edges of the three single phenyl groups. There is also a noticeable lack of localization near the phenoxyphenyl group, likely caused by this group's relative motion. By contrast, the binary mixtures show a quasiplanar and triangular alignment of anions around the cations, red in Fig. 7(a, b, e and f). Note that these subfigures show either hydrocarbon (blue) or bistriflimide (red) sandwiched between the cation of interest as well as neighbouring cations (orange). The SDFs of the toluene–IL (Fig. 7(a and b)) and hexafluorobenzene–IL (Fig. 7(e and f)) systems are quite similar, aside from minor changes in the probability density magnitudes. This is true for all of the IL–hydrocarbon mixtures, which are each provided in Fig. S10–S12.†
The spatial distributions around the hydrocarbons provide important information about the structural organization in these systems. Around toluene (Fig. 7(c and d)) the anions (red) aggregate equatorially, near the electropositive hydrogens within the molecule. Above and below toluene's ring plane are localized distributions of either cations (orange) or hydrocarbons (blue). For simplicity, consider the case where cations occupy the axial locations, one above and one below, while anions occupy the equatorial positions. This could be considered a fully enclosed cage around the molecule, an image evoked from the word clathrate. If instead, one cation is above the ring while hydrocarbons occupy the space below, this constitutes more of an open-ended cage. Lastly, if both ends are occupied by hydrocarbons this would be more of a cylindrical channel. While this view is overly simplified, it presents the possibility of different structural motifs, all of which do occur and are significant. In the next few sections we refer back to these motifs while constructing a more coherent picture of the nature of the “ion-rich” phase. It will be shown that several of these motifs exist and combine to form a phase aptly described as bicontinuous.
Apart from hexafluorobenzene, the SDFs of the other miscible hydrocarbons are, with some decipherable differences, similar to toluene in Fig. 7(a–d). Cyanobenzene, for example, shows a skewed distribution of neighbouring cyanobenzene around the nitrogen atom relative to the distribution above and below the ring plane. Anion distributions are skewed away from the alkyl groups of the toluene, ethylbenzene, the xylenes, and very notably away from the bromine atom of bromobenzene. Despite napthalene's larger size, it too is similar to the SDF shown for toluene. In this case, the hydrocarbons are a bit more constrained to be above and below the ring plane. Moreover, this also increases the favourable interactions with the cations, which are shown later to be the highest among the hydrocarbons. All additional SDFs can be found in Fig. S6–S12.†
Hexafluorobenzene provides an interesting comparison because of its aforementioned flipped quadrupole moment relative to that of toluene. The SDFs for the hexafluorobenzene–IL system, shown in Fig. 7(g and h), reflect this. In this case, the cations and hydrocarbons occupy the equatorial positions, which are now more electronegative due to the fluorine atoms, while anions preferentially reside above and below the ring. This and the importance of the quadrupole moment was noted earlier by Shimizu,31 who studied dilute concentrations of fluorobenzenes in 1-ethyl-3-methylimidazolium bistriflimide. Our study shows that this is also true for TPOP and also exists near the solubility limit. In the next section, a much more detailed view emerges of the structural organization in these systems.
3.5 Common neighbour analysis
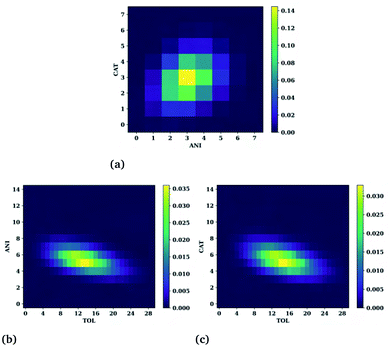
The SDFs of the last section provide the regions of enhanced probability around a molecule but do not detail how many molecules reside in each of those regions at any given instant. For example, for Fig. 7(d) it was noted that the presence of different molecules at a given time could present different structural motifs such as fully enclosed cages, open-ended cages, or circular channels. In this section we quantify the number of cations, anions, and hydrocarbons that simultaneously reside in a central molecule's first solvation shell. Here, the first solvation shell is defined as the trough immediately following the tallest, usually first, peak of the respective radial distribution function of Fig. 6. The cutoff values used for this are provided in Table S2.† While this is an improved view of the overall structure, note that not all of the molecules residing in the first peak actively participate in the connective structure nor do they necessarily reside within the isosurfaces selected in Fig. 6. Therefore, the numbers one might interpret as the “true” connective neighbours is likely to be smaller than the analysis presented herein and should be interpreted accordingly. Heat maps showing the number of cations and anions around toluene, anions and toluene around a cation, and cations and toluenes around an anion are provided in Fig. 8(a), (b), and (c), respectively.Notice the very narrow distribution of cations (CAT) and anions (ANI) present around each toluene molecule. The most probable situation (∼15%) has 3 cations and 3 anions surrounding a toluene molecule with the majority being with ±1 of each of these numbers. This might seem sufficient for forming a fully enclosed cage, however this is not seen upon direct inspection of the trajectories. Moreover, the trajectories show a fast exchange (<20 ps) of cations and anions in the first solvation shell, negating the concept of the molecule being somehow trapped.
Even more telling is the number of common neighbours surrounding the cations and the anions, shown in Fig. 8(b and c), respectively. In both cases there is a coordination of either 5 anions or 5 cations around the oppositely charged ion. Surprisingly, both cases show a substantial number of toluene molecules in their vicinity, varying from about 5 to 20. These large numbers are observed in the trajectories and show that the ions are frequently in contact with an abundant hydrocarbon phase.
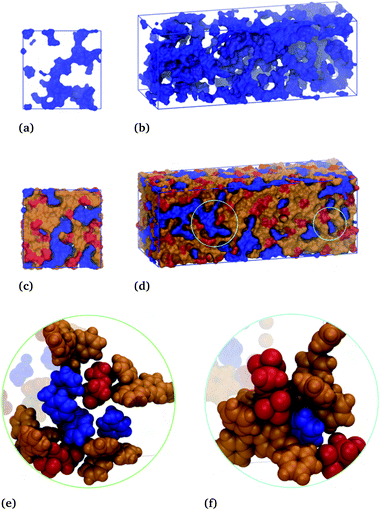
A clearer view of the topology of the ion-rich phase is given in Fig. 9.
The blue surface displays the toluene subphase, which is notably porous in the absence of the IL subphase, Fig. 9(a and b). These subfigures show a cross-section of the box and the entire simulation box, with the hydrocarbon phase shown to be one complete connective structure snaking throughout the box. Here, the thickness of the strands range from a single molecular length to several molecular lengths for the globular parts. This same toluene subphase is displayed along with the cation (orange) and anion (red) subphase in Fig. 9(c and d). Similar to toluene, the ions form a single continuous structure, snaking through the voids presented by the toluene subphase. Thus, these simulations results, which accurately capture the phenomenon attributed to the formation of liquid clathrates, suggest an underlying structure that is more aptly described as a bicontinuous phase.
The circled regions of Fig. 9(d) are expanded in Fig. 9(e) and (f), showing the local molecular arrangements. Fig. 9(e) shows a channel-like structure, with two anions interacting with toluene's ring hydrogens and several hydrocarbons interacting above and below the given toluene's ring. Fig. 9(f) shows an open-ended cage structure, with toluene surrounded at the equator by two anions and axially by two cations, one above and one below the ring. These enlarged regions give an indication of the different structural motifs present in the system, brought about by the respective molecular interaction, which gives rise to the bicontinuous phase. Analogous figures for the hexafluorobenzene–IL system are provided in Fig. S13,† again showing a bicontinuous phase but with reversed ion–hydrocarbon contacts.
The heat maps of Fig. 8 are typical for all of the IL–hydrocarbon systems, which are provided in Fig. S14–S16.† A concise summary is provided in Table 3, which gives the most probable configurations for each.
| System | HC | CAT | ANI | |||
|---|---|---|---|---|---|---|
| CAT | ANI | HC | ANI | HC | CAT | |
| Toluene | 3 | 3 | 14 | 5 | 14 | 5 |
| Ethylbenzene | 3 | 3 | 6 | 5 | 6 | 5 |
| o-Xylene | 3 | 3 | 12 | 5 | 14 | 5 |
| m-Xylene | 3 | 3 | 6 | 5 | 7 | 5 |
| p-Xylene | 3 | 3 | 24 | 5 | 26 | 5 |
| Hexafluorobenzene | 2 | 2 | 24 | 5 | 24 | 5 |
| Bromobenzene | 3 | 3 | 14 | 5 | 14 | 5 |
| Cyanobenzene | 3 | 3 | 14 | 5 | 14 | 5 |
| Napthalene | 3 | 3 | 12 | 5 | 14 | 5 |
Three cations and three anions are found around the hydrocarbons in all of the systems except for hexafluorobenzene, which only has 2 cations and 2 anions. These numbers are similar to those recently determined for aromatics in alkylammonium chloroaluminates.34 As with toluene, the ions of all hydrocarbon–IL mixtures are in close proximity to an abundant hydrocarbon phase, albeit to varying degrees: ethylbenzene and m-xylene (6–7); toluene, o-xylene, napthalene, bromobenzene, and cyanobenzene (12–14); p-xylene and hexafluorobenzene (24–26). These differences may arise from differences in channel width or local curvature at the subphase interface, though this was not apparent from visual inspection of the trajectories. The ability of the molecules to stack may also play a role in these numbers, as those with the highest values have the highest propensity to stack (e.g. hexafluorobenzene, p-xylene, napthalene) while those with the lowest numbers are less apt to stack (e.g. ethylbenzene, m-xylene). Similar arguments could be made for the anion's ability to interact with the equatorial positions of these molecules. The role of these interactions and how the topology of the subphases are affected by these numbers is still not clear.
3.6 Connectivity analysis
An algorithm was used to determine the size and number of clusters based upon a cutoff distance between individual molecules.54 Here, a cluster is taken to mean a unique set of molecules or ions that are mutually connected. If the distance between two target molecules was within the specified cutoff distance, those two molecules were considered to be “connected.” A cutoff of 9 Å was used between the centers of mass of the hydrocarbons of the HC–HC networks and a cutoff of 11.55 Å between the cations and anions of the IL–IL networks. These values correspond to the backside of the first peak in the HC–HC and cation–anion rdfs, respectively, and are the same values used in the common neighbour analysis. In the algorithm, each pair of target molecules is first tested for connectivity and, if connected, saved as a pair. Next, the list of connected pairs is scanned and those with mutual participants were combined into unique clusters. This process was repeated until each cluster had a unique set of molecules, which were all mutually connected. This analysis was then repeated for each frame of the trajectory over the last 20 ns of the simulations and then averaged. The average number of clusters for the HC–HC networks and the IL–IL networks are provided in Table 4.| System | HC–HC | IL–IL |
|---|---|---|
| Toluene | 1.07 | 1.00 |
| Ethylbenzene | 1.08 | 1.00 |
| o-Xylene | 1.04 | 1.00 |
| m-Xylene | 1.14 | 1.00 |
| p-Xylene | 1.09 | 1.00 |
| Hexafluorobenzene | 1.04 | 1.00 |
| Bromobenzene | 1.05 | 1.00 |
| Cyanobenzene | 1.07 | 1.00 |
| Napthalene | 1.15 | 1.00 |
For all systems, the IL–IL network was never found to be anything but a single connected cluster. The hydrocarbon–hydrocarbon networks ranged from 1.04 to 1.15 clusters per frame. This corresponds to a single connected cluster 85 to 95% of the time and two divided clusters the remaining time.
The connectivity of the toluene–toluene and IL–IL networks in a representative snapshot of the toluene–IL system are provided in Fig. 10.
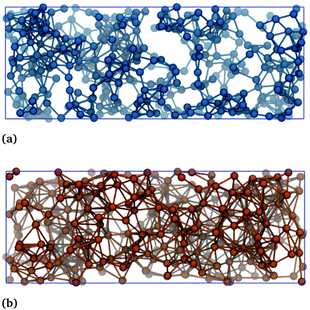 | ||
| Fig. 10 Connectivity of (a) the toluene–toluene network and (b) the IL–IL network in the toluene–IL system. Both subfigures show the same snapshot. | ||
The blue spheres in Fig. 10(a) display the atom nearest the center of mass of each toluene molecule. The orange spheres of Fig. 10(b) display the phosphorous and nitrogen atoms of the cation and anion, respectively. Lines between two atoms indicate that their distance is within the respective cutoff criteria. Note each network's single connected structure. The network connectivity shown in Fig. 10 is typical for all of the hydrocarbon systems, which are all provide in Fig. S17 and S18.† Together, these figures show clear evidence of the formation of a bicontinuous phase.
3.7 Interaction energies
Lastly, we consider the driving forces that give rise to mixing. This is done by tabulating the changes in the pairwise interaction energies between the cations, anions, and hydrocarbons from the initial separated state to the final bicontinuous assembly. Note that caution should be used in the interpretation of these numbers, since they are highly dependent upon the construction of the underlying force field. Nonetheless, the contributions herein are largely dominated by electronic effects and a rough overview can yield additional insights when taken alongside the other analyses of this work. A breakdown of these interaction energies is given in Table 5. Standard deviations and standard uncertainties are reported in Tables S3 and S4.†| System | ΔUCAT–CAT | ΔUCAT–ANI | ΔUANI–ANI | ΔUCAT–HC | ΔUANI–HC | ΔUHC–HC | ||||||
|---|---|---|---|---|---|---|---|---|---|---|---|---|
| vdW | Elec. | vdW | Elec. | vdW | Elec. | vdW | Elec. | vdW | Elec. | vdW | Elec. | |
| Toluene | 4.9 | −91.1 | 4.2 | 184.2 | 0.5 | −92.1 | −12.3 | −1.1 | −4.1 | −0.5 | 6.1 | 0.4 |
| Ethylbenzene | 5.2 | −113.6 | 4.2 | 229.1 | 0.6 | −114.4 | −12.1 | −1.2 | −4.2 | −0.5 | 6.6 | 0.4 |
| o-Xylene | 5.3 | −112.4 | 4.3 | 225.8 | 0.6 | −112.3 | −12.8 | −1.0 | −4.2 | −0.4 | 6.8 | 0.3 |
| m-Xylene | 6.3 | −126.0 | 4.9 | 253.2 | 0.7 | −125.9 | −15.0 | −1.1 | −4.8 | −0.5 | 7.9 | 0.3 |
| p-Xylene | 5.8 | −118.8 | 4.4 | 239.5 | 0.6 | −119.2 | −13.1 | −1.1 | −4.3 | −0.3 | 6.9 | 0.2 |
| Hexafluorobenzene | 4.8 | −111.0 | 5.0 | 223.1 | 0.7 | −110.3 | −12.5 | −0.2 | −6.0 | −3.1 | 7.1 | 0.5 |
| Bromobenzene | 4.9 | −79.4 | 3.5 | 160.7 | 0.6 | −80.1 | −12.3 | −1.4 | −4.0 | −0.7 | 6.7 | 0.6 |
| Cyanobenzene | 4.3 | −70.2 | 3.6 | 141.7 | 0.4 | −69.7 | −11.3 | −1.8 | −3.9 | −2.4 | 6.5 | 2.1 |
| Napthalene | 6.3 | −111.4 | −0.9 | 225.2 | 0.2 | −112.5 | −17.0 | −2.0 | −4.9 | −1.0 | 9.4 | 0.9 |
All systems in the table are quite similar to the toluene–IL system, which is now explored in detail. Notice the large changes in the ion–ion interaction energies (CAT–CAT, CAT–ANI, and ANI–ANI) giving rise to a net energetic penalty of +10.6 kcal mol−1. Furthermore, +9.6 kcal mol−1 of this arises from the van der Waal's interactions, primarily from the cation–cation and cation–anion contributions, while only +1.0 kcal mol−1 is attributable to changes in electrostatic potential. Electrostatically, the large cost of breaking the strong cation–anion network (+184.2 kcal mol−1) is almost entirely offset by a reduction in the cation–cation and anion–anion repulsions (−183.2 kcal mol−1).
Breaking the toluene–toluene network also incurs a penalty, +6.5 kcal mol−1, of which is mostly van der Waal's energy. Mixing is favoured for these systems because the ion–ion and toluene–toluene penalties are overcome by the favourability of new ion–hydrocarbon energies totaling −18.0 kcal mol−1. Most of this is van der Waal's energy (−16.4 kcal mol−1) with a minor contribution from the electrostatic energy (−1.6 kcal mol−1). Even more, this favourable van der Waal's energy arises three times as much from the cation–toluene interactions (−12.3 kcal mol−1) than from the anion–toluene interactions (−4.1 kcal mol−1).
The other mixtures follow the same trends with only a couple of minor differences. The changes in the electrostatic component of the ion–ion interactions are considerably lower for the polar compounds (bromobenzene and cyanobenzene) suggesting a smaller disruption in the ionic network. Also, the cation–napthalene interaction is the most favourable of all of the compounds leading to a net change in the pairwise interaction energies that is nearly an order of magnitude stronger than the others. The hexafluorobenzene system has the second most favourable change in interaction energies suggesting that the absence of nonaromatic groups plays a key role. Despite these minor differences, all systems seem driven by cation–hydrocarbon van der Waals interactions that are roughly 2–3 times larger the respective anion–hydrocarbon contributions.
4 Conclusions
A combination of experimental measurements and molecular dynamics simulations were used to investigate the LLE behaviour of binary mixtures of hydrocarbons with a thermally robust ionic liquid. Experimentally, it was shown that excess toluene added to the IL results in two liquids: an ion-rich phase and a nearly pure toluene phase. Excess n-heptane, conversely, is essentially immiscible with the IL phase. The MD results were able to capture these behaviours as well as the solubility of toluene in the IL to within 10%. Extension of these simulation results to other aromatic and aliphatic compounds generally found two liquid phases for the former and immiscibility for the latter.Analyses were performed to understand the structure and driving forces of the ion-rich phase. Radial distribution functions showed a separation of like charges and a strengthening of unlike charges upon absorption, suggesting a preservation of the core ionic network. Spatial distribution functions showed a preference of IL anions to orient equatorially around an aromatic molecule and for IL cations and other hydrocarbons to orient axially. These trends were reversed for hexafluorobenzene, which has a flipped quadrupole moment. An analysis of the simultaneous coordination of components around the given component showed a coordination of 3 ± 1 cations and 3 ± 1 anions around the aromatics. Around the cations and anions there was found to be a wide ranging number of hydrocarbons that was surprisingly large. Analysis of the trajectories showed the ion-rich phase as bicontinuous, consisting of an IL subphase and a toluene subphase, that is largely driven by structural motifs favoured by the molecular interactions. A breakdown of the energetic changes on absorption suggested that uptake is largely driven by dispersion interactions between the hydrocarbons and the cations and to a lesser extent the hydrocarbons with the anions, as would be expected from structural considerations.
Taken together, these results provide a detailed picture of molecular interactions that give rise to the phenomena oftentimes attributed to the formation of liquid clathrates. We find that the “ion-rich” phase manifests as a dynamic bicontinuous phase. Uptake of hydrocarbons by the ionic liquid is analogous to the expansion of a sponge upon absorption of liquid. As hydrocarbon enters the ionic liquid, the ion–ion network expands, creating voids that accommodate the new molecules while the primary connectivity of the ions remains intact. Once a certain amount of hydrocarbon enters, the ion–ion network reaches a critical point where any additional expansion would require a break in the core connective structure. The energetic penalty incurred through a break in the core ion–ion structure vastly outweighs the energetic gain that would occur upon further absorption and the additional hydrocarbon remains in the neat phase. Future studies will examine the role of cation and anion structure on the ion-rich phase as well as the selectivity of the ILs for ternary mixtures.
Conflicts of interest
There are no conflicts to declare.Acknowledgements
Materials, reagents, and the synthetic work were funded through grants by the NSF CHE-1464740. Computational work was funded through the DOE Office of Science (DE-SC0020282) through the Separations and EPSCoR programs and Energy Efficiency and Renewable Energy Advanced Manufacturing Office. Additionally, the simulations were made possible through a grant of high performance computing resources and technical support from the Alabama Supercomputing Authority.Notes and references
- M. Słomińska, S. Król and J. Namieśnik, Crit. Rev. Environ. Sci. Technol., 2013, 43, 1417–1445 CrossRef.
- K. Weissermel and H.-J. Arpe, Industrial Organic Chemistry, Wiley-VCH, Weinheim, 2003 Search PubMed.
- U. Domańska, A. Pobudkowska and M. Królikowski, Fluid Phase Equilib., 2007, 259, 173–179 CrossRef.
- A.-L. Revelli, F. Mutelet and J.-N. Jaubert, J. Phys. Chem. B, 2010, 114, 4600–4608 CrossRef CAS PubMed.
- I. Domínguez, E. J. González, R. González and Á. Domínguez, J. Chem. Eng. Data, 2011, 56, 3376–3383 CrossRef.
- A. Arce, M. J. Earle, H. Rodríguez and K. R. Seddon, J. Phys. Chem. B, 2007, 111, 4732–4736 CrossRef CAS PubMed.
- A. E. Díaz-Álvarez, J. Francos, B. Lastra-Barreira, P. Crochet and V. Cadierno, Chem. Commun., 2011, 47, 6208–6227 RSC.
- M. Z. M. Salleh, M. Hadj-Kali, I. Wazeer, E. Ali and M. A. Hashim, J. Mol. Liq., 2019, 285, 716–726 CrossRef CAS.
- E. A. Vázquez-Montelongo, G. A. Cisneros and H. M. Flores-Ruiz, J. Mol. Liq., 2019, 296, 111846 CrossRef.
- M. Z. M. Salleh, M. K. Hadj-Kali, M. A. Hashim and S. Mulyono, J. Mol. Liq., 2018, 266, 51–61 CrossRef CAS.
- P. F. Requejo, N. Calvar, Á. Domínguez and E. Gómez, Fluid Phase Equilib., 2016, 417, 137–143 CrossRef CAS.
- P. Navarro, M. Ayuso, A. M. Palma, M. Larriba, N. Delgado-Mellado, J. García, F. Rodriguez, J. A. P. Coutinho and P. J. Carvalho, Ind. Eng. Chem. Res., 2018, 57, 14242–14253 CrossRef CAS.
- M. Larriba, P. Navarro, M. Gonzalez-Miquel, S. Omar, J. Palomar, J. García and F. Rodriguez, Chem. Eng. Res. Des., 2016, 109, 561–572 CrossRef CAS.
- M. S. Selvan, M. D. McKinley, R. H. Dubois and J. L. Atwood, J. Chem. Eng. Data, 2000, 45, 841–845 CrossRef CAS.
- A. Arce, M. J. Earle, H. Rodríguez and K. R. Seddon, Green Chem., 2007, 9, 70–74 RSC.
- Z. Ren, M. Wang, Y. Li, Z. Zhou, F. Zhang and W. Liu, Energy Fuels, 2017, 31, 6598–6606 CrossRef CAS.
- F. Zhang, Y. Li, L. Zhang, W. Sun and Z. Ren, J. Chem. Eng. Data, 2015, 60, 1634–1641 CrossRef CAS.
- P. F. Requejo, E. Gómez, N. Calvar and Á. Domínguez, Ind. Eng. Chem. Res., 2015, 54, 1342–1349 CrossRef CAS.
- U. Domańska, A. Pobudkowska and Z. Żołek-Tryznowska, J. Chem. Eng. Data, 2007, 52, 2345–2349 CrossRef.
- M. J. Lubben, R. I. Canales, Y. Lyu, C. Held, M. Gonzalez-Miquel, M. A. Stadtherr and J. F. Brennecke, Ind. Eng. Chem. Res., 2020, 59, 15707–15717 CrossRef CAS.
- J. D. Holbrey, W. M. Reichert, M. Nieuwenhuyzen, O. Sheppard, C. Hardacre and R. D. Rogers, Chem. Commun., 2003, 476–477 RSC.
- J. łachwa, I. Bento, M. T. Duarte, J. N. C. Lopes and L. P. N. Rebelo, Chem. Commun., 2006, 2445–2447 RSC.
- C. C. Weber, A. F. Masters and T. Maschmeyer, Green Chem., 2013, 15, 2655–2679 RSC.
- J. F. B. Pereira, L. A. Flores, H. Wang and R. D. Rogers, Chem.–Eur. J., 2014, 20, 15482–15492 CrossRef CAS PubMed.
- J. K. D. Surette, L. Green and R. D. Singer, Chem. Commun., 1996, 2753–2754 RSC.
- J. L. Atwood and J. D. Atwood, in Inorganic Compounds with Unusual Properties, ed. R. B. King, American Chemical Society, Washington, D.C., 1976, ch. 11, pp. 112–127 Search PubMed.
- J. L. Atwood, in Recent Developments in Separation Science: Volume III, ed. N. Li, CRC Press, Cleveland, 1977, pp. 195–209 Search PubMed.
- J. L. Atwood, in Inclusion Compounds: Volume 1, ed. J. L. Atwood, J. E. D. Davies and D. D. MacNicol, Academic Press, London, 1984, ch. 9, pp. 375–405 Search PubMed.
- C. Hanke, A. Johansson, J. Harper and R. Lynden-Bell, Chem. Phys. Lett., 2003, 374, 85–90 CrossRef CAS.
- J. B. Harper and R. M. Lynden-Bell, Mol. Phys., 2004, 102, 85–94 CrossRef CAS.
- K. Shimizu, M. F. Costa Gomes, A. A. Padua, L. P. N. Rebelo and J. N. Canongia Lopes, J. Phys. Chem. B, 2009, 113, 9894–9900 CrossRef CAS PubMed.
- H. Wang, S. P. Kelley, J. W. Brantley III, G. Chatel, J. Shamshina, J. F. Pereira, V. Debbeti, A. S. Myerson and R. D. Rogers, ChemPhysChem, 2015, 16, 993–1002 CrossRef CAS PubMed.
- A. D. Headley and N. M. Jackson, J. Phys. Org. Chem., 2002, 15, 52–55 CrossRef CAS.
- R. Kore, M. K. Mishra, U. M. Gonela and R. D. Rogers, Ind. Eng. Chem. Res., 2020, 59, 18419–18424 CrossRef CAS.
- G. W. Meindersma, A. R. Hansmeier and A. B. de Haan, Ind. Eng. Chem. Res., 2010, 49, 7530–7540 CrossRef CAS.
- U. Domańska and M. Królikowska, Fluid Phase Equilib., 2011, 308, 55–63 CrossRef.
- C. Maton, N. De Vos and C. V. Stevens, Chem. Soc. Rev., 2013, 42, 5963–5977 RSC.
- C. G. Cassity, A. Mirjafari, N. Mobarrez, K. J. Strickland, R. A. O'Brien and J. H. Davis, Jr, Chem. Commun., 2013, 49, 7590–7592 RSC.
- B. Siu, C. G. Cassity, A. Benchea, T. Hamby, J. Hendrich, K. J. Strickland, A. Wierzbicki, R. E. Sykora, E. A. Salter, R. A. O'Brien, K. N. West and J. H. Davis, Jr, RSC Adv., 2017, 7, 7623–7630 RSC.
- M. Soltani, J. L. McGeehee, A. C. Stenson, R. A. O'Brien, E. R. Duranty, E. A. Salter, A. Wierzbicki, T. G. Glover and J. H. Davis, Jr, RSC Adv., 2020, 10, 20521–20528 RSC.
- B. D. Rabideau, K. N. West and J. H. Davis, Jr, Chem. Commun., 2018, 54, 5019–5031 RSC.
- A. Benchea, B. Siu, M. Soltani, J. H. McCants, E. A. Salter, A. Wierzbicki, K. N. West and J. H. Davis, Jr, New J. Chem., 2017, 41, 7844–7848 RSC.
- C. A. Cassity, B. Siu, M. Soltani, J. L. McGeehee, K. J. Strickland, M. Vo, E. A. Salter, A. C. Stenson, A. Wierzbicki, K. N. West, B. D. Rabideau and J. H. Davis, Jr, Phys. Chem. Chem. Phys., 2017, 19, 31560–31571 RSC.
- M. Soltani, B. Siu, E. A. Salter, A. Wierzbicki, K. N. West and J. H. Davis, Jr, Tetrahedron Lett., 2017, 58, 4628–4631 CrossRef CAS.
- B. D. Rabideau, M. Soltani, R. A. Parker, B. Siu, E. A. Salter, A. Wierzbicki, K. N. West and J. H. Davis, Jr, Phys. Chem. Chem. Phys., 2020, 22, 12301–12311 RSC.
- P. Sappidi, B. D. Rabideau and C. H. Turner, Chem. Eng. Sci., 2020, 224, 115790 CrossRef CAS.
- J. Wang, R. M. Wolf, J. W. Caldwell, P. A. Kollman and D. A. Case, J. Comput. Chem., 2004, 25, 1157–1174 CrossRef CAS PubMed.
- M. J. Frisch, G. W. Trucks, H. B. Schlegel, G. E. Scuseria, M. A. Robb, J. R. Cheeseman, G. Scalmani, V. Barone, B. Mennucci, G. A. Petersson, H. Nakatsuji, M. Caricato, X. Li, H. P. Hratchian, A. F. Izmaylov, J. Bloino, G. Zheng, J. L. Sonnenberg, M. Hada, M. Ehara, K. Toyota, R. Fukuda, J. Hasegawa, M. Ishida, T. Nakajima, Y. Honda, O. Kitao, H. Nakai, T. Vreven, J. A. Montgomery, Jr, J. E. Peralta, F. Ogliaro, M. Bearpark, J. J. Heyd, E. Brothers, K. N. Kudin, V. N. Staroverov, R. Kobayashi, J. Normand, K. Raghavachari, A. Rendell, J. C. Burant, S. S. Iyengar, J. Tomasi, M. Cossi, N. Rega, J. M. Millam, M. Klene, J. E. Knox, J. B. Cross, V. Bakken, C. Adamo, J. Jaramillo, R. Gomperts, R. E. Stratmann, O. Yazyev, A. J. Austin, R. Cammi, C. Pomelli, J. W. Ochterski, R. L. Martin, K. Morokuma, V. G. Zakrzewski, G. A. Voth, P. Salvador, J. J. Dannenberg, S. Dapprich, A. D. Daniels, O. Farkas, J. B. Foresman, J. V. Ortiz, J. Cioslowski and D. J. Fox, Gaussian'09 Revision E.01, Gaussian Inc., Wallingford CT, 2009 Search PubMed.
- T. Fox and P. A. Kollman, J. Phys. Chem. B, 1998, 102, 8070–8079 CrossRef CAS.
- K. G. Sprenger, V. W. Jaeger and J. Pfaendtner, J. Phys. Chem. B, 2015, 119, 5882–5895 CrossRef CAS PubMed.
- S. Plimpton, J. Comput. Phys., 1995, 117, 1–19 CrossRef CAS.
- R. W. Hockney and J. W. Eastwood, Computer Simulation Using Particles, Taylor & Francis Group, New York, 1988 Search PubMed.
- L. Martinez, R. Andrade, E. G. Birgin and J. M. Martinez, J. Comput. Chem., 2009, 30, 2157–2164 CrossRef CAS PubMed.
- S. R. P. Bandlamudi, M. J. Cooney, G. L. Martin and K. M. Benjamin, Ind. Eng. Chem. Res., 2017, 56, 3040–3048 CrossRef CAS.
Footnote |
| † Electronic supplementary information (ESI) available: Miscibility profiles, HC–HC radial distributions functions, spatial distribution functions, heat maps, excess volumes, network connectivity, and an interaction energy analysis for all of the systems. See DOI: 10.1039/d1ra06268a |
| This journal is © The Royal Society of Chemistry 2021 |

